Article

Assessment of Hydrological Responses to Land Use and Land Cover Changes in Forest-Dominated Watershed Using SWAT Model

1
Civil and Environmental Engineering Department, University of Science and Technology (UST), Daejeon 34113, Republic of Korea
2
Department of Water Resources and River Research, Korea Institute of Civil Engineering and Building Technology, Goyang 10223, Republic of Korea
*
Authors to whom correspondence should be addressed.
Water 2024, 16(4), 528; https://doi.org/10.3390/w16040528
Submission received: 23 January 2024 / Revised: 2 February 2024 / Accepted: 5 February 2024 / Published: 7 February 2024
(This article belongs to the Special Issue Novel Applications of Surface Water–Groundwater Modeling)

Abstract

:
Recognizing how human activities affect hydrological systems is vital for the sustainable preservation and effective management of water resources in the watershed. Hence, this paper focuses on the hydrological response to land use and land cover (LULC) change scenarios in the Anyang watershed, South Korea. We obtained LULC data maps for the years 2000, 2013, and 2022 from the local government, revealing significant changes over the years. Agricultural lands experienced a 6.2% increase from 2000 to 2022, and pastureland expanded by 8.67% over two decades. The SWAT model was utilized to assess the impact of LULC on the hydrological components of the study watershed. Model calibration and validation for each LULC change were carried out using the SWAT-CUP program, considering the recorded streamflow information of the region. An excellent agreement was reached between the simulated and measured streamflow in both the calibration and validation stages under various LULC conditions. The Nash–Sutcliffe model efficiency (NSE), the objective function, demonstrated values of 0.9, 0.89, and 0.89 during the calibration for 2000, 2013, and 2022, respectively, in the LULC scenario, while for the validation, we obtained values of 0.82, 0.78, and 0.80 for 2000, 2013, and 2022, respectively. Our findings indicate that the surface runoff rise contributed much to the water yield increase over the two decades compared to the other components in terms of the water yield, while the contribution of evapotranspiration (ET) to the watershed hydrological cycle declined by 1.66% from 2000 to 2022. The southeastern sub-basin part showed a high groundwater recharge distribution due to agricultural land, rice area, and forest area changes.

1. Introduction

Contemporary global shifts like urban expansion, climate variability, and population growth have a deep influence on the world’s water crisis [1,2]. Additionally, the changing patterns of land use and land cover (LULC) play a crucial part in affecting biodiversity, environmental factors, and the functioning of hydrological processes, specifically in terms of water availability and the replenishment of groundwater [1,3]. Knowing the nexus between LULC changes and water resources in the watershed is a critical aspect of environmental sustainability [4,5]. Human activities have significantly altered landscapes, leading to LULC conversion and subsequently affecting the available water resources. Hence, understanding these impacts is crucial for managing this invaluable resource [3]. In South Korea, notable LULC changes have resulted from urbanization and socioeconomic development, directly influencing the hydrological processes of the region [6].
South Korea experienced rapid economic growth beginning in the 1960s, which was notably marked by swift urbanization and industrial development, primarily concentrated around Seoul, the country’s capital. The region encompassing Seoul and Gyeonggi-do has evolved into a standard urban region. Approximately 26 million individuals, nearly half of Korea’s population, reside within the capital [6]. Such a transformation in the LULC has considerably influenced the hydrological processes of the region. It frequently alters deep infiltration, streamflow, evapotranspiration, surface runoff, and rates of recharge within the watershed [7]. Quantifying the LULC variation’s impact on the water segment constituents is necessary to sustain and manage the surface and groundwater resources.
Alterations in LULC have an unswerving influence on various hydrological components by altering surface characteristics such as roughness, vegetation density, and soil composition [8]. These modifications can significantly influence the flow of water, runoff patterns, and infiltration rates within the ecosystem [9,10]. For instance, shifts in LULC can impact the ability of surfaces to retain water, affect the rate at which water moves across the landscape, and ultimately influence the overall water balance and hydrological processes within an area [7]. Watershed models help as a dynamic means to assess and quantify the effects of changes in LULC on the catchment.
Hydrological models are frequently employed to estimate the effect of LULC change scenarios on water resources [5,8,11,12]. These situations apply a required pre-processing of the data in these models to assess their impact on catchment water resources [8]. Most studies generate LULC scenario maps from satellite images, which are then classified using object-based image analysis [13] and pixel-based approaches [14,15]. Future LULC scenarios are usually obtained using a simulation approach like land use models [16,17] or statistical methods [18,19]. The other way is to obtain the data from the local government office or global data (i.e., GlobeLand30-NGCC, MODIS LC, and others [5,8]), which can be previous and/or current LULC maps.
The soil and water assessment tool (SWAT) stands out as the most extensively exploited model for diverse objectives, enabling the assessment of both surface and groundwater quality and quantity in studies ranging from small to large scales [20,21,22]. The model has also been used to assess LULC change scenarios in various studies. For instance, Martinez-Retureta et al. [9] employed the SWAT model to investigate the hydrological implications of LULC alterations. They conducted three LULC scenarios (1986, 2001, and 2011), with their comparison spanning several years (1984–2013), revealing a noteworthy decline in total annual flows. The annual flows exhibited a variation of 25.05 m3/s between the 1986–2011 LULC conditions. W. Liu et al. [23] evaluated the influence of LULC variations on river runoff within the Danjiang River source area. Their analyzed data from three LULC scenarios unveiled an increase in cropland, grassland, and urban areas, and it created an augmentation in the river runoff within the study catchment. This model was also employed to weigh the impact of LULC alterations in deep recharge [24,25,26,27], water balance [7,28], water yield [9,29], sediment yield [3], ET [30,31], drought analysis [32,33,34], and surface runoff [8,23,35]. Therefore, in previous studies and in further research, the SWAT model has demonstrated its effectiveness in appraising hydrological reactions to LULC transformation scenarios. This study employs the SWAT model to estimate the influence of LULC changes on water segment components.
Our study area, the Anyang catchment, has encountered noteworthy LULC transformations in the prior two decades, similar to other cities surrounding Seoul. These transformations have influenced the water segment components such as deep recharge, water yield, and evapotranspiration. Therefore, it is essential to assess the effect of LULC scenarios to effectively sustain and manage the available water resources in the area. This study aims to estimate the hydrological response to LULC alteration scenarios over the two decades in the catchment. As per our knowledge, this is the first time that the impact of LULC change scenarios have been assessed in the study area. Therefore, the findings could contribute to comprehending the intricate relationships among soil, land use, and the provision/regulation of water, providing scientific–technical insights to inform decision-making for integrated river basin management in the region.

2. Materials and Methods

2.1. Study Area Description

The Anyang catchment, placed in Goyang province, southwest of Seoul, South Korea, is home to approximately 600,000 people. The study catchment encloses an area of around 137 km2, and its elevations vary from 11 m to 591 m (see Figure 1). The Anyangcheon River, the primary river in the area and one of the Han River’s four major tributaries in Seoul, stretches 32.2 km long and drains a basin area of 275 km2. This watershed experiences a humid climate, with mean daily temperatures ranging from 8.5–17.5 °C. Over the years from 2002 to 2018, the average annual rainfall in the watershed measured around 1266 mm. About two-thirds of the regional rainfall happens in the monsoon season between June and August. The main soil type in the region is the Osan series (OnC2, OnC3, OnD2, OnD3, OnD4, OnE2, OnE3, OnE4, OnF2, and OnF3), which covers around 20.53% of the area.

2.2. SWAT Model Description and Data Inputs

The soil and water assessment tool (SWAT) is a comprehensive, continuous, and physically grounded model designed to simulate various water management scenarios [36,37]. This model is adept at mimicking runoff patterns and nutrient discharges using easily accessible input data, enabling the assessment of different land management strategies [20]. SWAT is a versatile hydrological tool that is extensively utilized in land use and climate change research due to its ability to replicate watershed hydrological features across various LULC and climatic scenarios [38]. During the model simulation of the study area, SWAT defines the hydrological water balance using Equation (1). This study primarily focuses on the water yield, groundwater recharge, and the evapotranspiration spatiotemporal distribution of the catchment.
SW t = SWo + t = 1 t R Q sur ET W seep Q gw
where SWt is the last water amount in the soil (mm), SWo is the early soil water amount (mm), t is time (days), R is the precipitation amount (mm), Qsur is the surface runoff (mm), ET is evapotranspiration (mm), Wseep is the deep infiltration (mm), and Qgw is the amount of flow return (mm).
The SWAT model utilizes the digital elevation model (DEM) to portray the topography of the study watershed, using land use and land cover (LULC), soil, and weather data to replicate and simulate hydrological processes [39].
Figure 2 shows data about the soil types within the study watershed employed in the SWAT model, including their corresponding hydrological soil groups. The dominant soil class types in the watershed were Osan (20.53%), Songsan (10.47%), Gwanag (9.96%), and Cheongsan (9.34%). The watershed was predominantly covered by hydrological soil group A, constituting 67.1% of the total area, representing soil textures of sand and sandy loam with little possibility for runoff. The other hydrological groups, i.e., B, C, and D, constituted 27%, 3.2%, and 2.7%, respectively. The soil information was gathered from the National Institute of Agricultural Sciences of Korea [40]. Detail descriptions of the soil series along their respective properties can be accessed on the referred [41] website.
In our study, we identified 15 types of LULC, as depicted in Figure 3. The dominant features in the catchment were forest and urban areas, which covered more than 80% of the area in all the LULC maps. For instance, in the LULC for the year 2000, forest areas (FRSD, FRSE, and FRST) accounted for 50.50% of the total coverage. In the subsequent years, namely 2013 and 2022, these percentages experienced slight variations, reaching 50.71% and 50.66%, respectively, as displayed in Figure 4. Notably, there was a 6.02% increase in the deciduous forest (FRSD) area observed between 2000 and 2022. With the same timeframe, the evergreen forest (FRSE) area showed a 4.77% reduction in the region.
The urban LULC area (i.e., URLD, UINS, UIDU, UCOM, and UTRN) underwent substantial changes over the span of two decades. In the years between 2000 and 2022, the low-density residential (URLD) area experienced a 10.74% reduction in area coverage, while transportation (UTRN) land coverage showed a 5.67% increase within 22 years. Figure 4 illustrates the individual urban areas coverage changes over the course of the period. For the years between 2000 and 2022, the pasture area coverage increased more than twice in percentage compared to between the years 2000 and 2013. The Environmental Spatial Information Service [42] provided LULC maps for the periods of 2000, 2013, and 2022. Ultimately, the individual LULC maps were employed as inputs in distinct SWAT model simulations to replicate hydrological processes. Additionally, the weather and daily streamflow information were sourced from the Metrological Agency Weather Data Service [43] and the Water Resources Management Information System [44], respectively.

2.3. SWAT Model Setup and Simulation

We employed the SWAT (2012, version 636) model to replicate and simulate the watershed hydrological processes. SWAT is a hydrological model that can function on a process-based and semi-distributed framework. The model consistently mimics key constituents of the water balance, providing continuous assessments on the daily time step. By employing a process-based approach, the SWAT model captures intricate hydrological interactions, offering a comprehensive understanding of the complex water dynamics within the system. The semi-distributed nature of the model allows it to represent the spatial variability of hydrological processes across different sub-basins or regions, enabling a more accurate and detailed simulation of water-related phenomena [37,45].
This study used the QSWAT interface to build and execute the SWAT model for the catchment. The first step was to delineate the region using a 30 m resolution digital elevation model (DEM). Then, the region was segmented into sub-basins connected by a stream network in the SWAT model. Hydrologic response units (HRUs) encompass distinctive combinations of the soil, slope, and land use characteristics for each sub-basin in a watershed. The water balance of individual HRUs is defined by four storage volumes (i.e., ice melt, soil profile, unconfined aquifer, and confined aquifers) [45]. To establish the HRUs, our study used multiple HRUs with a threshold of 3% for the watershed, which had 21 sub-basins with seven slope classes. Three distinct SWAT models were developed for the different LULC map datasets (i.e., 2000, 2013, and 2022). Consequently, the count of HRUs varied according to the LULC map dataset: 3308, 3625, and 3806 for the LULC datasets in 2000, 2013, and 2022, respectively. A station gauge (SG2) (Figure 1) was employed for the model calibration process of the study area. Meteorological information was incorporated and written into the model database. The SWAT model simulation covered the period from 2002 to 2018, with the early two years (2002–2003) selected as a warm-up phase.

2.4. Model Calibration and Validation Approach

The SWAT calibration and uncertainty programs (SWAT-CUP), is an independent processer and open-access package, intended for calibrating, validating, and analyzing uncertainty in a SWAT model, and which was utilized to adjust the constraints of the SWAT model [46,47]. The SWAT-CUP program includes the sequential uncertainty fitting ver. 2 (SUFI-2) algorithm and other algorithms [46]. For this study, SUFI-2 was chosen for the calibration and validation of the SWAT model due to the effectiveness and consideration of all uncertainties during the simulation [46,48]. For this study, fifteen parameters were chosen for the preliminary simulation of the watershed, as displayed in Table 1. The calibration period of the SWAT model ranged from January 2013 to December 2017 and from January 2006 to December 2010 for the validation.
To evaluate the SWAT model’s performance, statistical parameters including the Nash–Sutcliffe efficiency (NSE), percentage bias (PBIAS), and determination coefficient (R2) were used for the study region. These parameters were used to show how well the modeled process represents the observed streamflow in the region. The NSE, a standardized statistical approach, was utilized to gauge the proportionate degree of remaining variance in contrast to the variance observed in the measured value. PBIAS statistics parameters were used to quantify the estimation bias of the model. A positive PBIAS number indicates underestimation, while a negative value signifies overestimation versus the observed streamflow, while a value of zero denotes the optimal simulation performance of the model. R2 was used to assess the congruence between the simulated and measured streamflow data of the model. The value ranges from 0 to 1, with higher values indicating a lower error variance. The evaluations of the model’s performance were conducted by considering a spectrum of values for NSE, PBIAS, and R2, as outlined in Equations (2), (3), and (4), respectively.
NSE = 1   i = 1 n ( Q obs , i Q sim , i ) 2 i = 1 n ( Q obs , i Q mobs ) 2
PBIAS = [ i = 1 n Q obs , i i = 1 n Q sim , i i = 1 n Q mobs ]   ×   100  
R 2 = [ i = 1 n Q obs , i Q mobs   ×   ( Q sim , i Q msim ) ] 2 i = 1 n Q obs , i Q mobs 2   ×   i = 1 n ( Q sim , i Q msim ) 2
where Qobs,i is the measured value, Qsim,i is the simulated value, Qmobs is the mean observed value, and Qmsim is the mean simulated value.

3. Results and Discussion

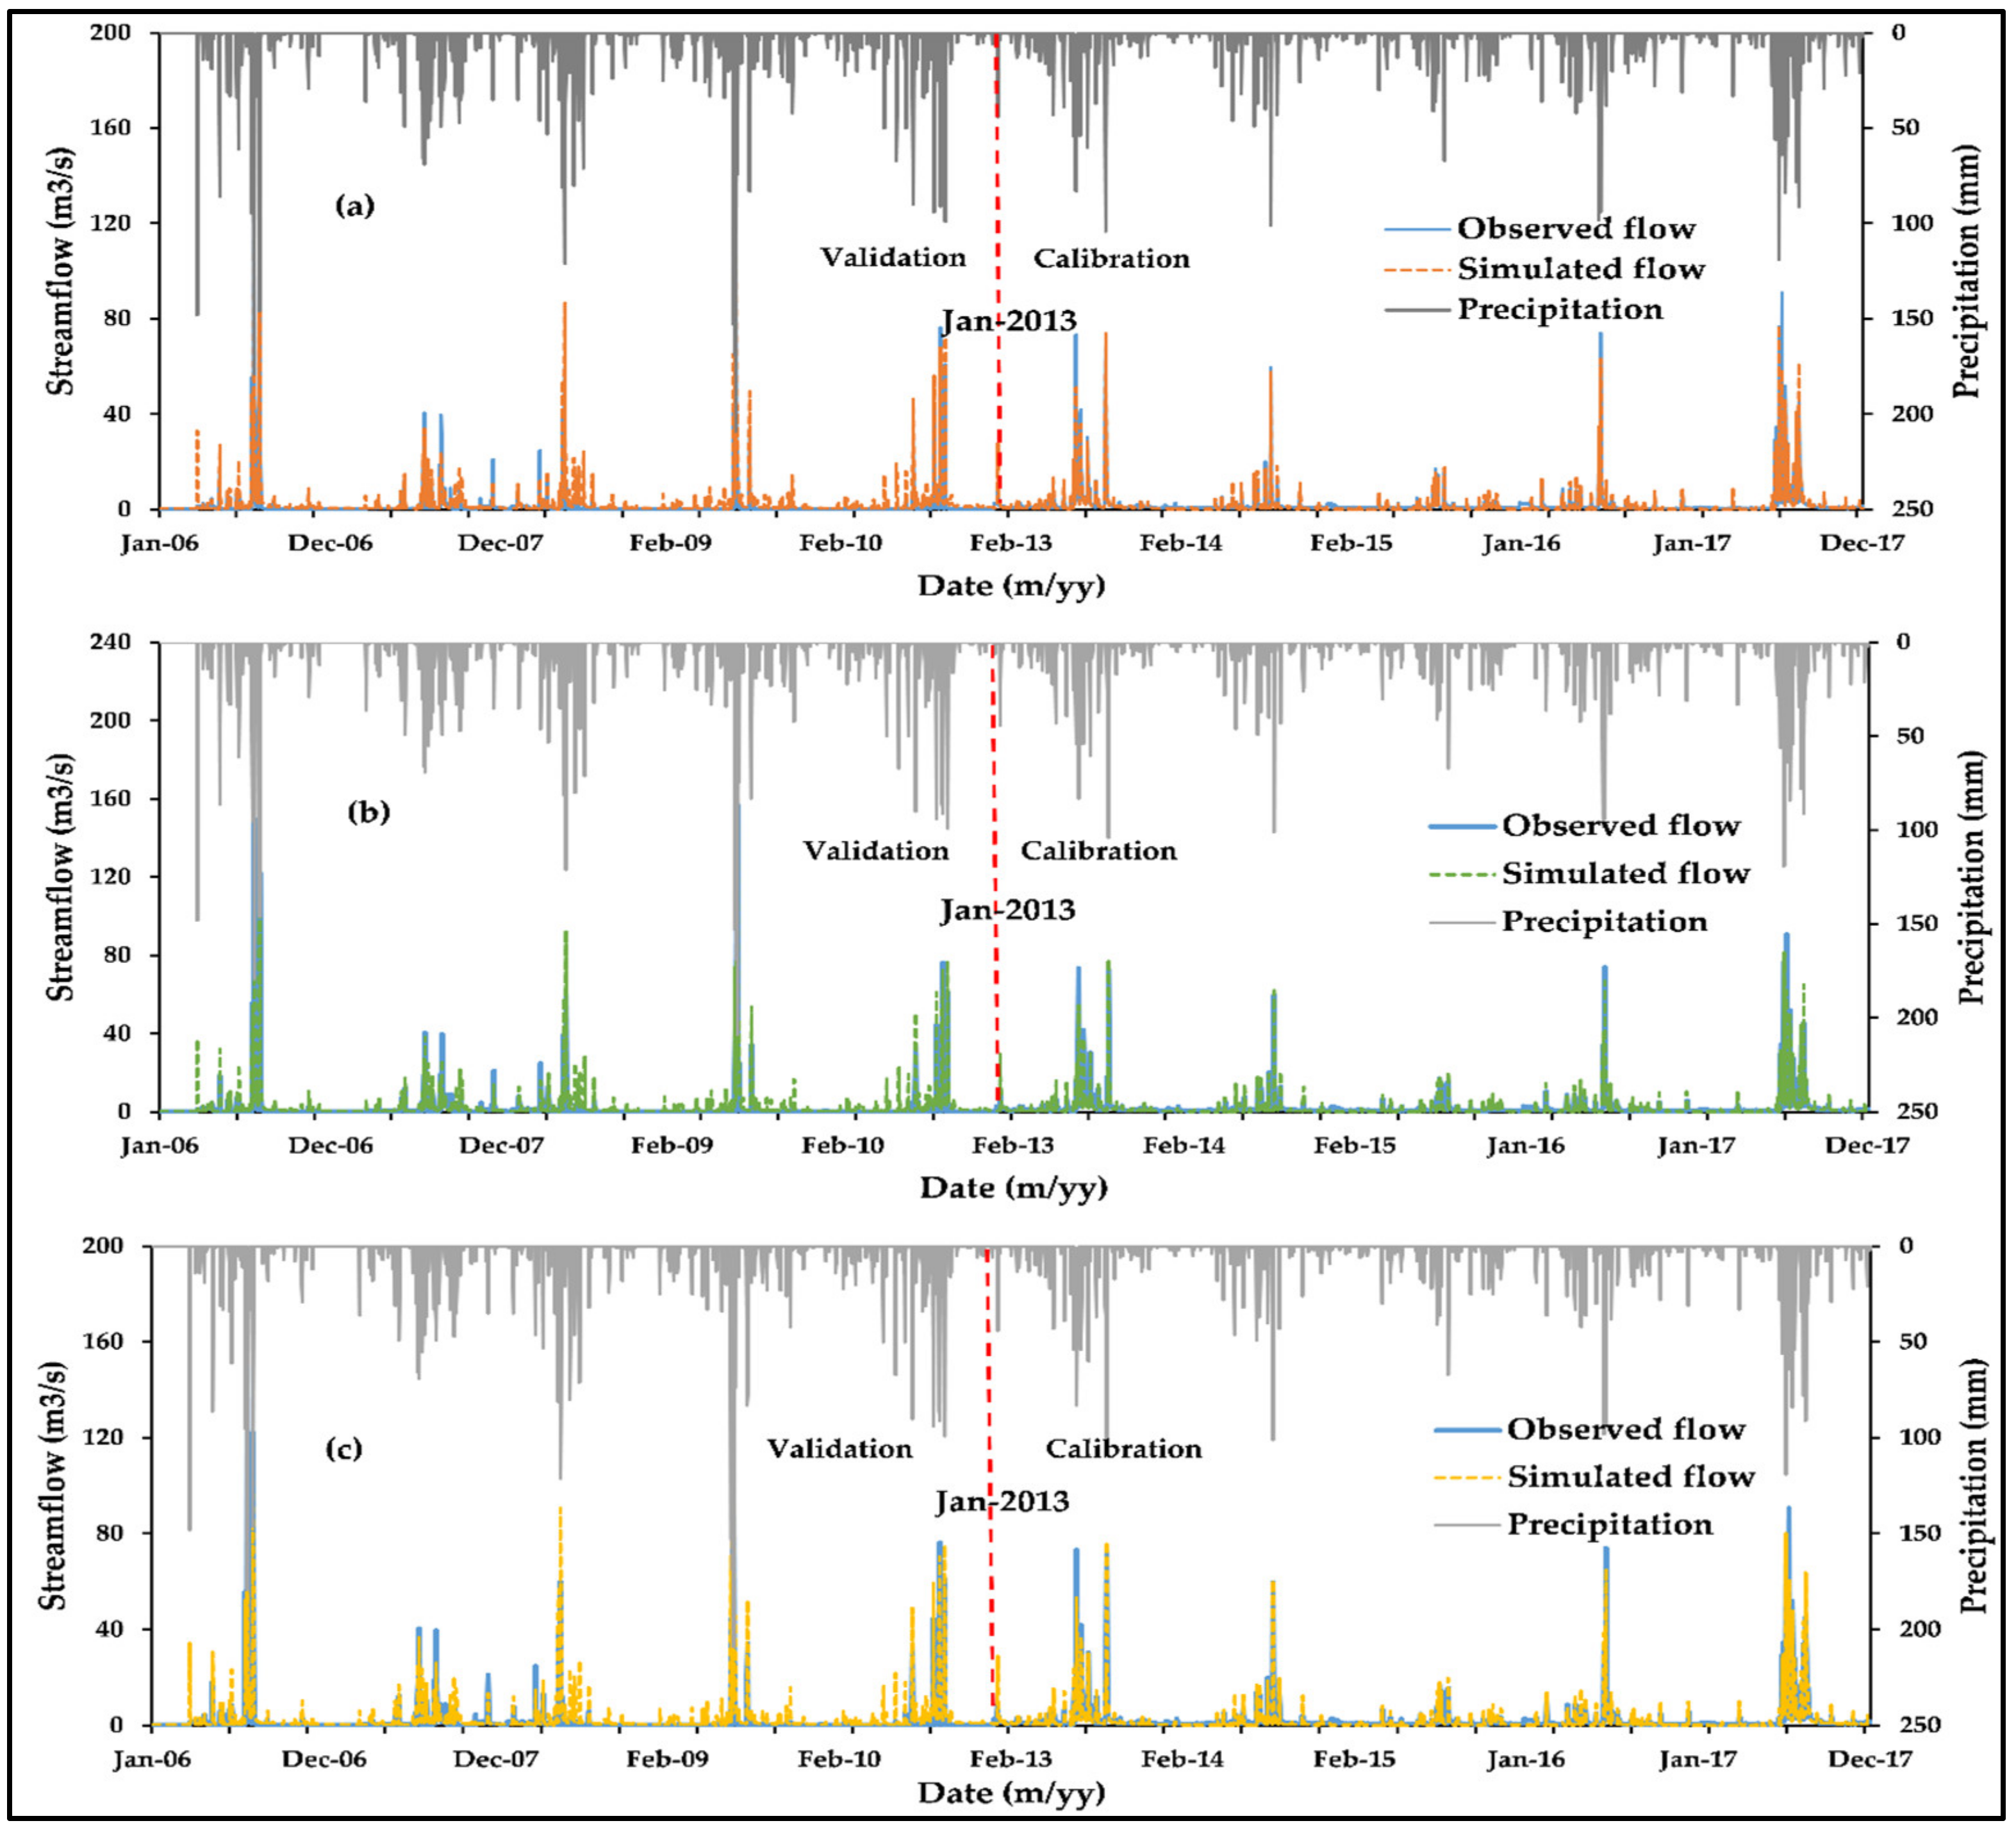
3.1. SWAT Model Performance

Before the calibration and validation processes, a comprehensive set of analyses were employed to identify the most influential and governing parameters in the streamflow simulation. Subsequently, 15 parameters were determined to be sensitive based on the evaluation criteria and were used to calibrate and validate the model’s predictive capacity. The values of these parameters were adjusted individually within acceptable ranges until the optimal simulation was achieved [47]. The initial runoff curve number (CN2) and hydraulic conductivity (SOL_K) emerged as the most influential parameters during the streamflow calibration. These calibration parameters were employed in different LULC scenarios to evaluate the influence of LULC alterations on the streamflow simulation. Uniform calibration value ranges were utilized for the models with different LULC change scenarios, as illustrated in Table 1. Consistently, identical optimal parameter values were identified across all the SWAT models.
In all the SWAT models, the streamflow calibration was conducted for the timeframe spanning from 2013 to 2017, while the period from 2006 to 2010 was designated for the validation process. Statistical indicators and graphical plots were used to evaluate the model simulation performance. For the calibration and validation process, the NSE, a statistical variable, was applied as an objective function for the model evaluation.
Table 2 displays the models’ statistical variable indicators magnitude in the calibration and validation periods for each LULC change in the watershed. The SWAT model performance values were checked according to the guidelines provided by Moriasi et al. [49]. In the year 2000, the calibrated model accomplished R2, NSE, and PBIAS values of 0.91, 0.90, and 11.3%, respectively. During the validation time, the model showed R2, NSE, and PBIAS values of 0.86, 0.82, and −10.4% in the same year, respectively. The PBIAS values shown in Table 2 indicate that the streamflow simulation was underestimated during the calibration phase and overestimated during the validation timeframe. Both the statistical indicators R2 and NSE showed the same values of 0.90 and 0.89 for the LULC scenarios (2013 and 2022) during the calibration period, respectively. For the two LULC changes (2013 and 2022), the PBIAS values we obtained were 7.4 and 8.3 for the calibration timeframe, respectively.
As for the validation for 2013, the statistical indicators show very good predictions of the measured streamflow. Overestimation of the simulated streamflow was observed during the years 2013 and 2022 with values of PBIAS of 17.6% and 15.9%, respectively, as stated in Table 2 for validation.
Figure 5 displays the association between the observed and simulated streamflow values for each LULC change scenario. These figures indicate that either the simulated streamflow was over- or under-predicted compared to the observed values for the LULC change scenarios, which was consistent with the PBIAS value. As an example, in the year 2022, the average daily simulated streamflow was 1.73 and 2.60 m3/s, whereas for the observed streamflow, it was 1.89 and 1.48 m3/s during the calibration and validation timeframes, respectively. In general, the simulated streamflow for each LULC change scenario indicates that the SWAT model accurately reflected the observed streamflow, as supported by the statistical indicators and graphical representations for the watershed under study.

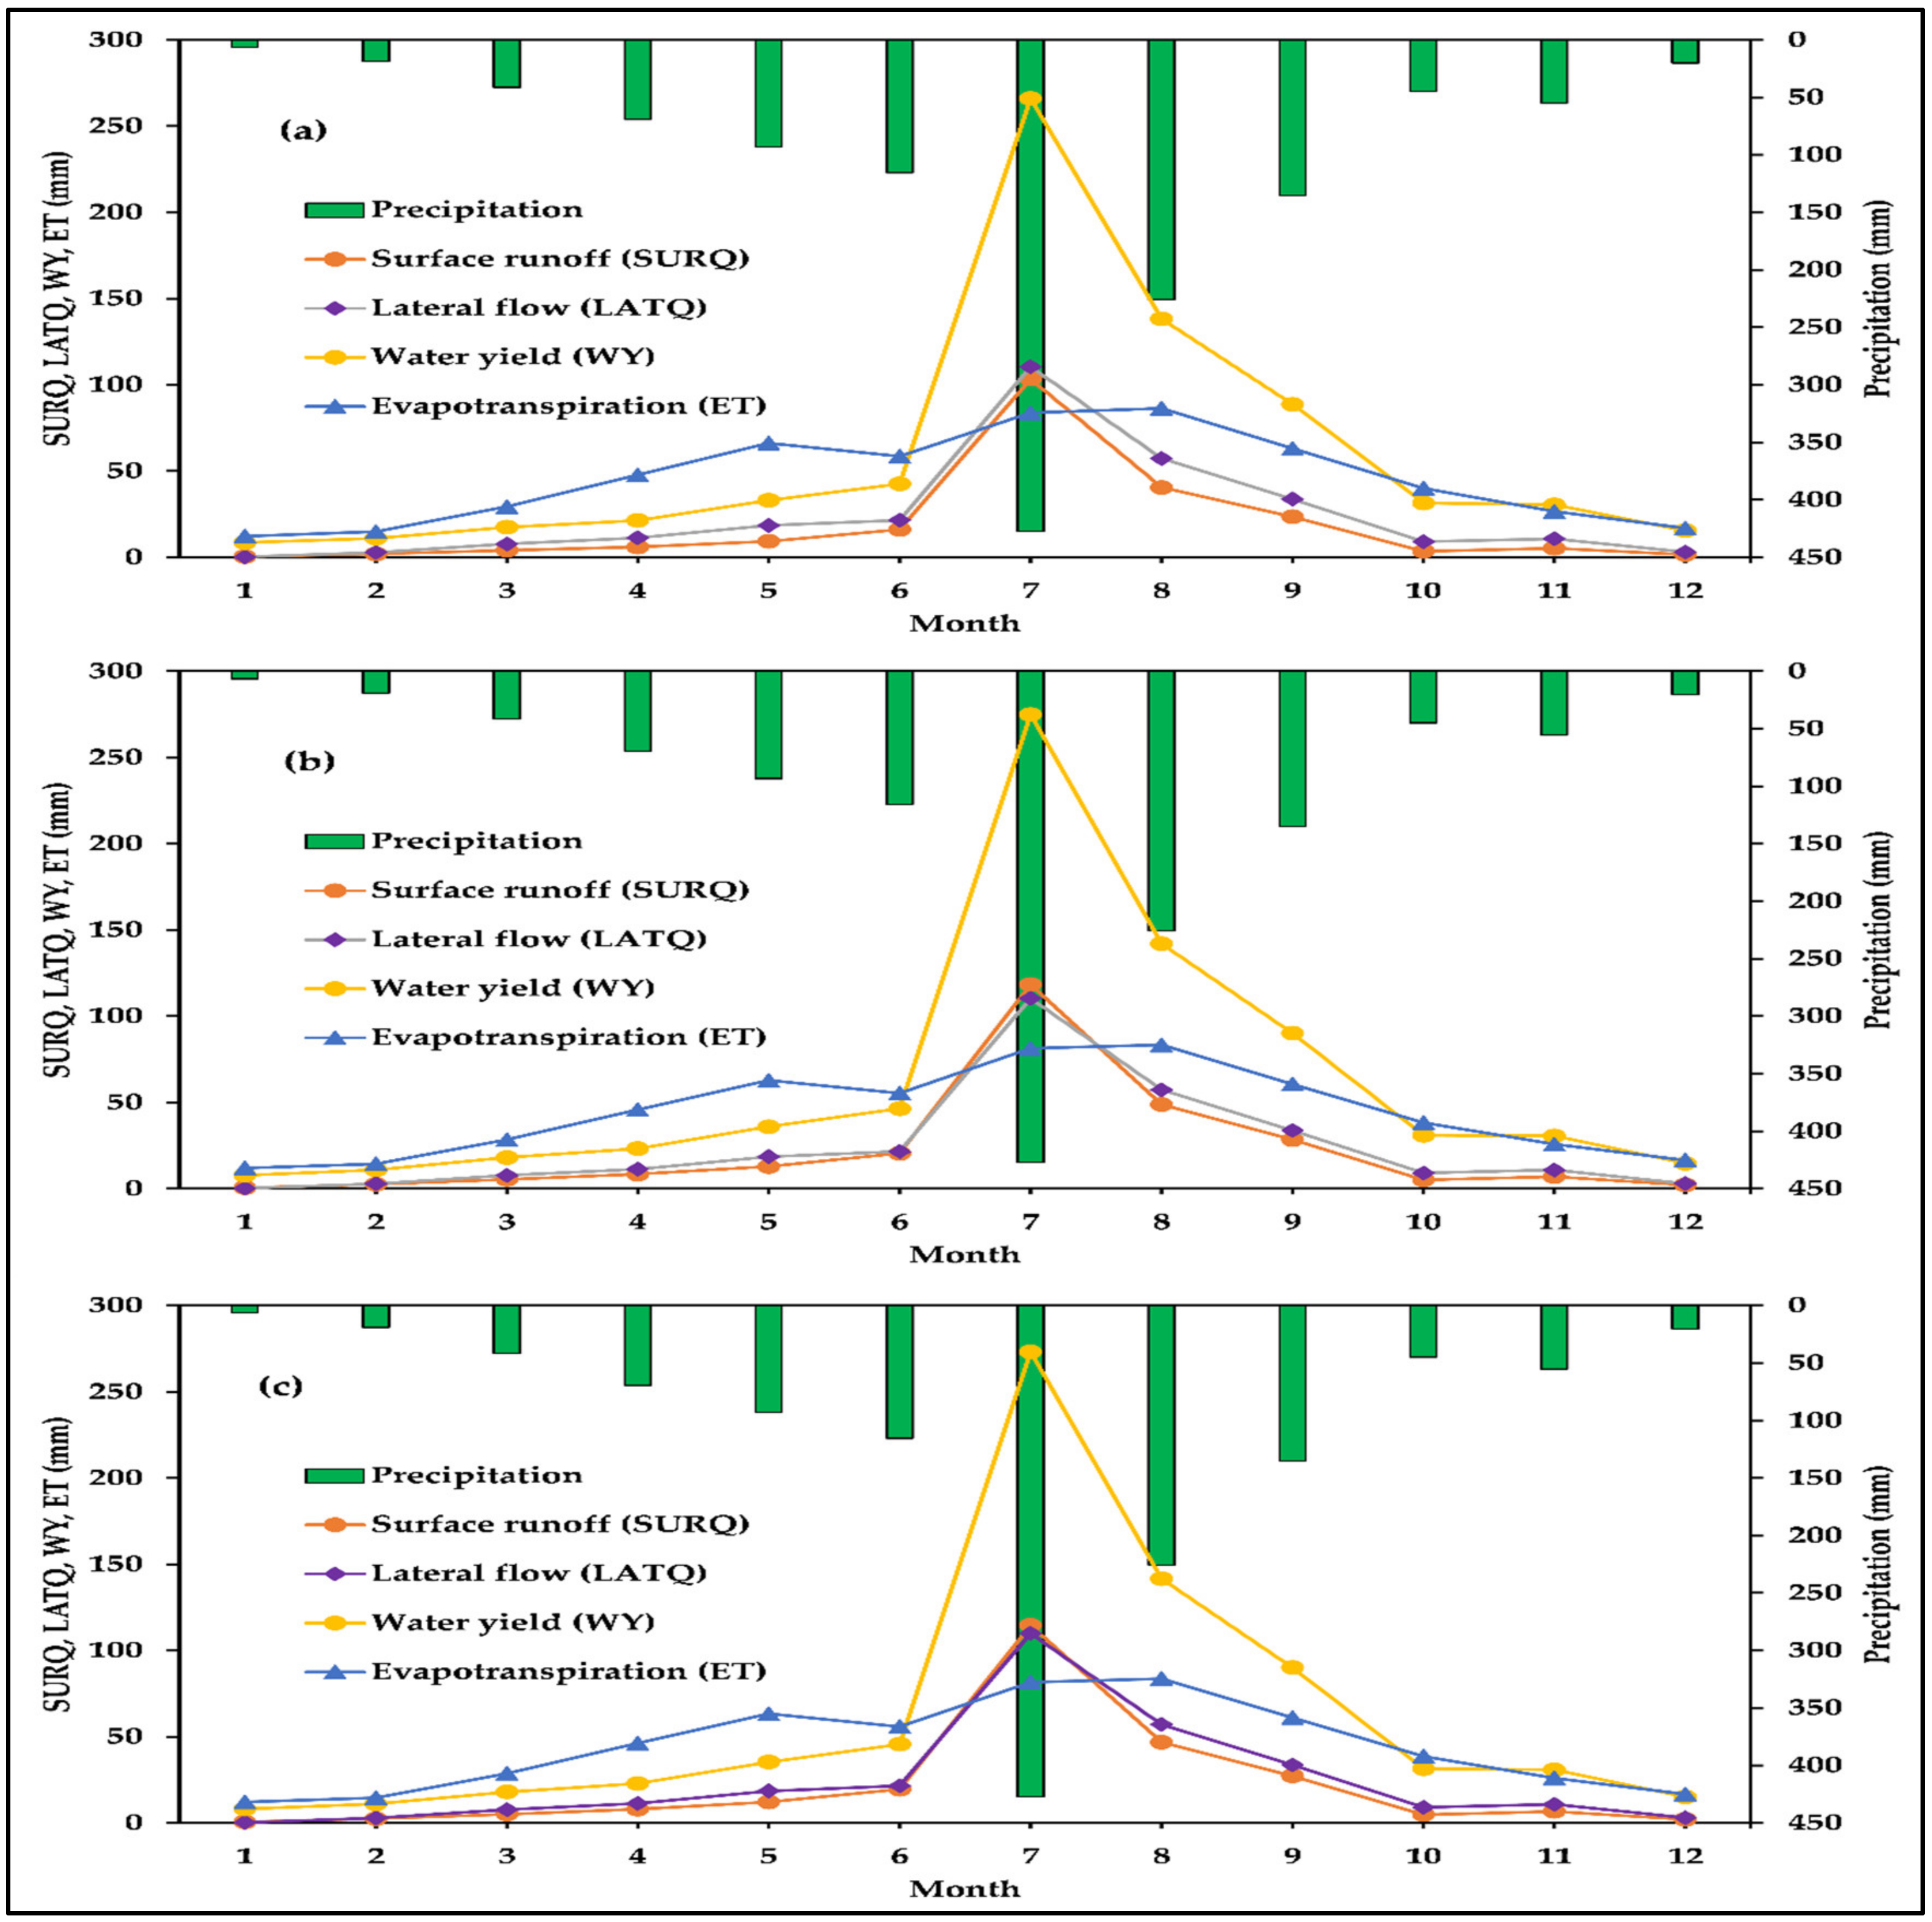
3.2. LULC Scenarios on Hydrological Components

This section explores the influence of LULC changes on the primary water components at both the watershed and sub-basin levels and particularly focuses on groundwater recharge, water yield, and evapotranspiration within the study area.

3.2.1. Groundwater Recharge
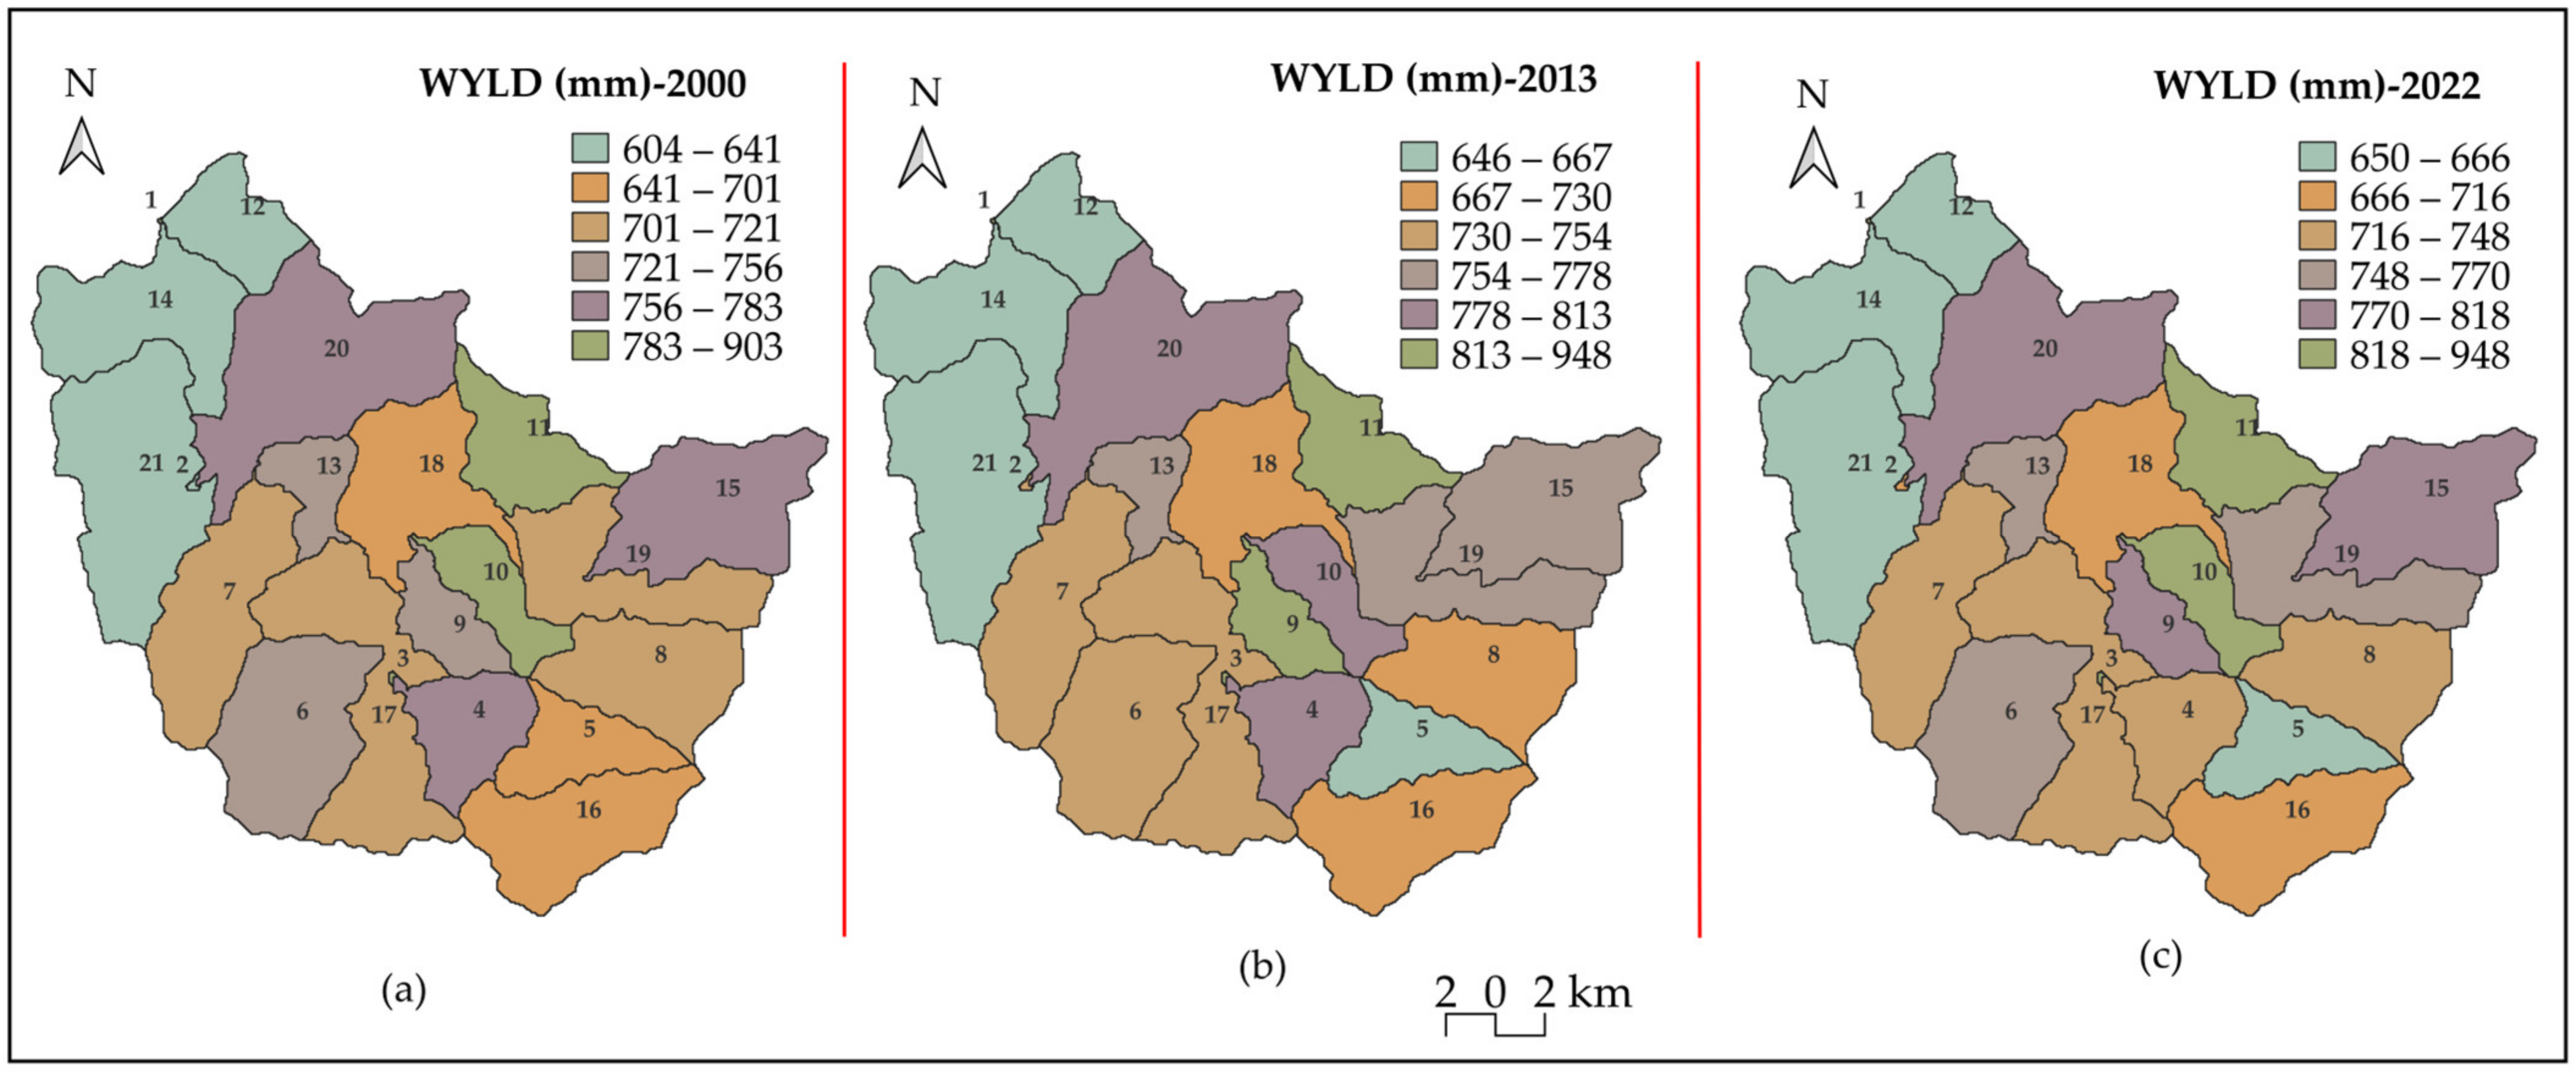
A calibrated SWAT model was utilized to simulate the daily hydrological components for three LULC change scenarios in the Anyang catchment spanning from 2002 to 2018, with the initial two-year period designated as a warm-up period. Figure 6 illustrates the spatiotemporal distribution of the groundwater recharge of the study region for the various LULC change conditions for the model simulation period without the warm-up period. At the sub-basin level, the groundwater recharge ranged from 21 to 371 mm, 0 to 339 mm, and 0 to 335 mm for the years 2000, 2013, and 2022, respectively.
The southeastern sub-basin part of the region demonstrated a higher groundwater recharge, while the lower north part showed the minimum groundwater recharge value, as displayed in Figure 6. Forest area occupied about 50% of the entire region in the study catchment, but in the southeastern sub-basins (i.e., 5, 11, 16, and 19), there was a combination of land uses such as pasture, crops, and rice. This diversity led to higher groundwater recharge amounts in comparison to the other sub-basins within the region. Forest areas dominated the northern part of the region and contributed to low groundwater recharge. Sub-basin numbers 11 and 1 exhibited the highest and lowest groundwater recharge values in each LULC scenario, respectively, as depicted in Figure 6.
On the basin scale, groundwater recharge accounted for 16.43%, 14.59%, and 15.28% of the annual precipitation in the years 2000, 2013, and 2022, respectively, as stated in Table 3. The percolation rate was affected by agricultural land, with a notable variation observed between 2000–2013 as the agricultural land (AGRC and AGRR) area increased by 3.69%, leading to higher water consumption and reduced percolation through the soil profile. Conversely, between 2013 and 2022, there was a 1.48% decrease in agricultural land, which influenced the water use and percolation dynamics, as displayed in Figure 4.
Past research concurs that alterations in agricultural practices and urbanization have impacted the quantity of groundwater recharge in the watershed [5,8,24,25], and our findings agree with the reasoning stated. Also, the groundwater recharge depends on the rainfall amount and distribution in the watershed [25,50]. High rainfall occurs during the wet season (June–September), and the groundwater recharge considerably increases during this period, as displayed in Figure 7. Yifru et al. [51] indicated that, in a study encompassing the current watershed, the annual average groundwater recharge constitutes approximately 18% of the total rainfall, and our findings showed similar figures for the LULC change scenarios.

3.2.2. Water Yield

The SWAT model calculates water yield as a crucial hydrological factor since it represents the volume of water exiting sub-basins and entering the main channel of the watershed [37,52]. Figure 7 presents the mean monthly water yield values for the study watershed from 2004 to 2018, considering each LULC scenario. In the year 2000, the peak water yield of 267 mm occurred in July, corresponding to the month with the highest precipitation. For both the years 2013 and 2022, the peak water yield was in July, with values of 274.9 mm and 273.1 mm, respectively. Table 3 indicates that lateral flow contributed the most to the water yield across all the LULC change scenarios in the region. However, there was a noteworthy increase in the contribution of surface runoff compared to lateral flow in the total water yield from 2000 to 2022 due to LULC changes (see Figure 7).
In Figure 8, the spatial and temporal variations in the study area are depicted for the different LULC scenarios spanning from 2004 to 2018. The water yield fluctuated between 604 mm and 903 mm, 646 mm and 948 mm, and 650 mm and 948 mm for the LULC scenarios occurring in the years 2000, 2013, and 2022, respectively. Sub-basin number 1 consistently recorded the highest water yield for each LULC scenario model in the watershed. In the years 2000 and 2022, the lowest water yield was observed in sub-basin number 4, while for the 2013 LULC scenario, it was in sub-basin number 21, as shown in Figure 8. The quantity of the water yield in a sub-basin depends on the input of surface runoff, lateral flow, and groundwater flow [31].
The water yield constituted 56.14%, 57.87%, and 57.61% for the LULC scenarios of years 2000, 2013, and 2022, respectively, as presented in Table 3. There was a 1.73% rise in the water yield between 2000 and 2013, whereas a 0.25% decline was observed between 2013 and 2022. The increase in the water yield within the region was entirely attributable to the rise in surface runoff, as indicated in Table 3. The alteration in LULC was a driving factor behind the amplified contribution of surface runoff in the study region. Studies show that surface runoff increases due to several land use and land cover changes (i.e., urbanization, agricultural practices, and deforestation) [14,15,53,54]. Mengistu et al. [8] investigated the impacts of LULC transformations, specifically focusing on the years 2000, 2010, and 2020, on surface runoff and deep percolation in Gilgel Gibe, Ethiopia. Their findings indicated an increase in surface runoff and a drop in groundwater levels credited to the LULC scenarios. In our study, the contribution of surface runoff was 17.25% in the year 2000, and it increased to 19.95% in 2022, reflecting a 2.7% increase. Given the limited lateral contribution (see Table 3) observed during the entire period of LULC change and the consistent decline in groundwater recharge over the past two decades, surface runoff emerges as a prominent contributor to the overall water yield in the region.

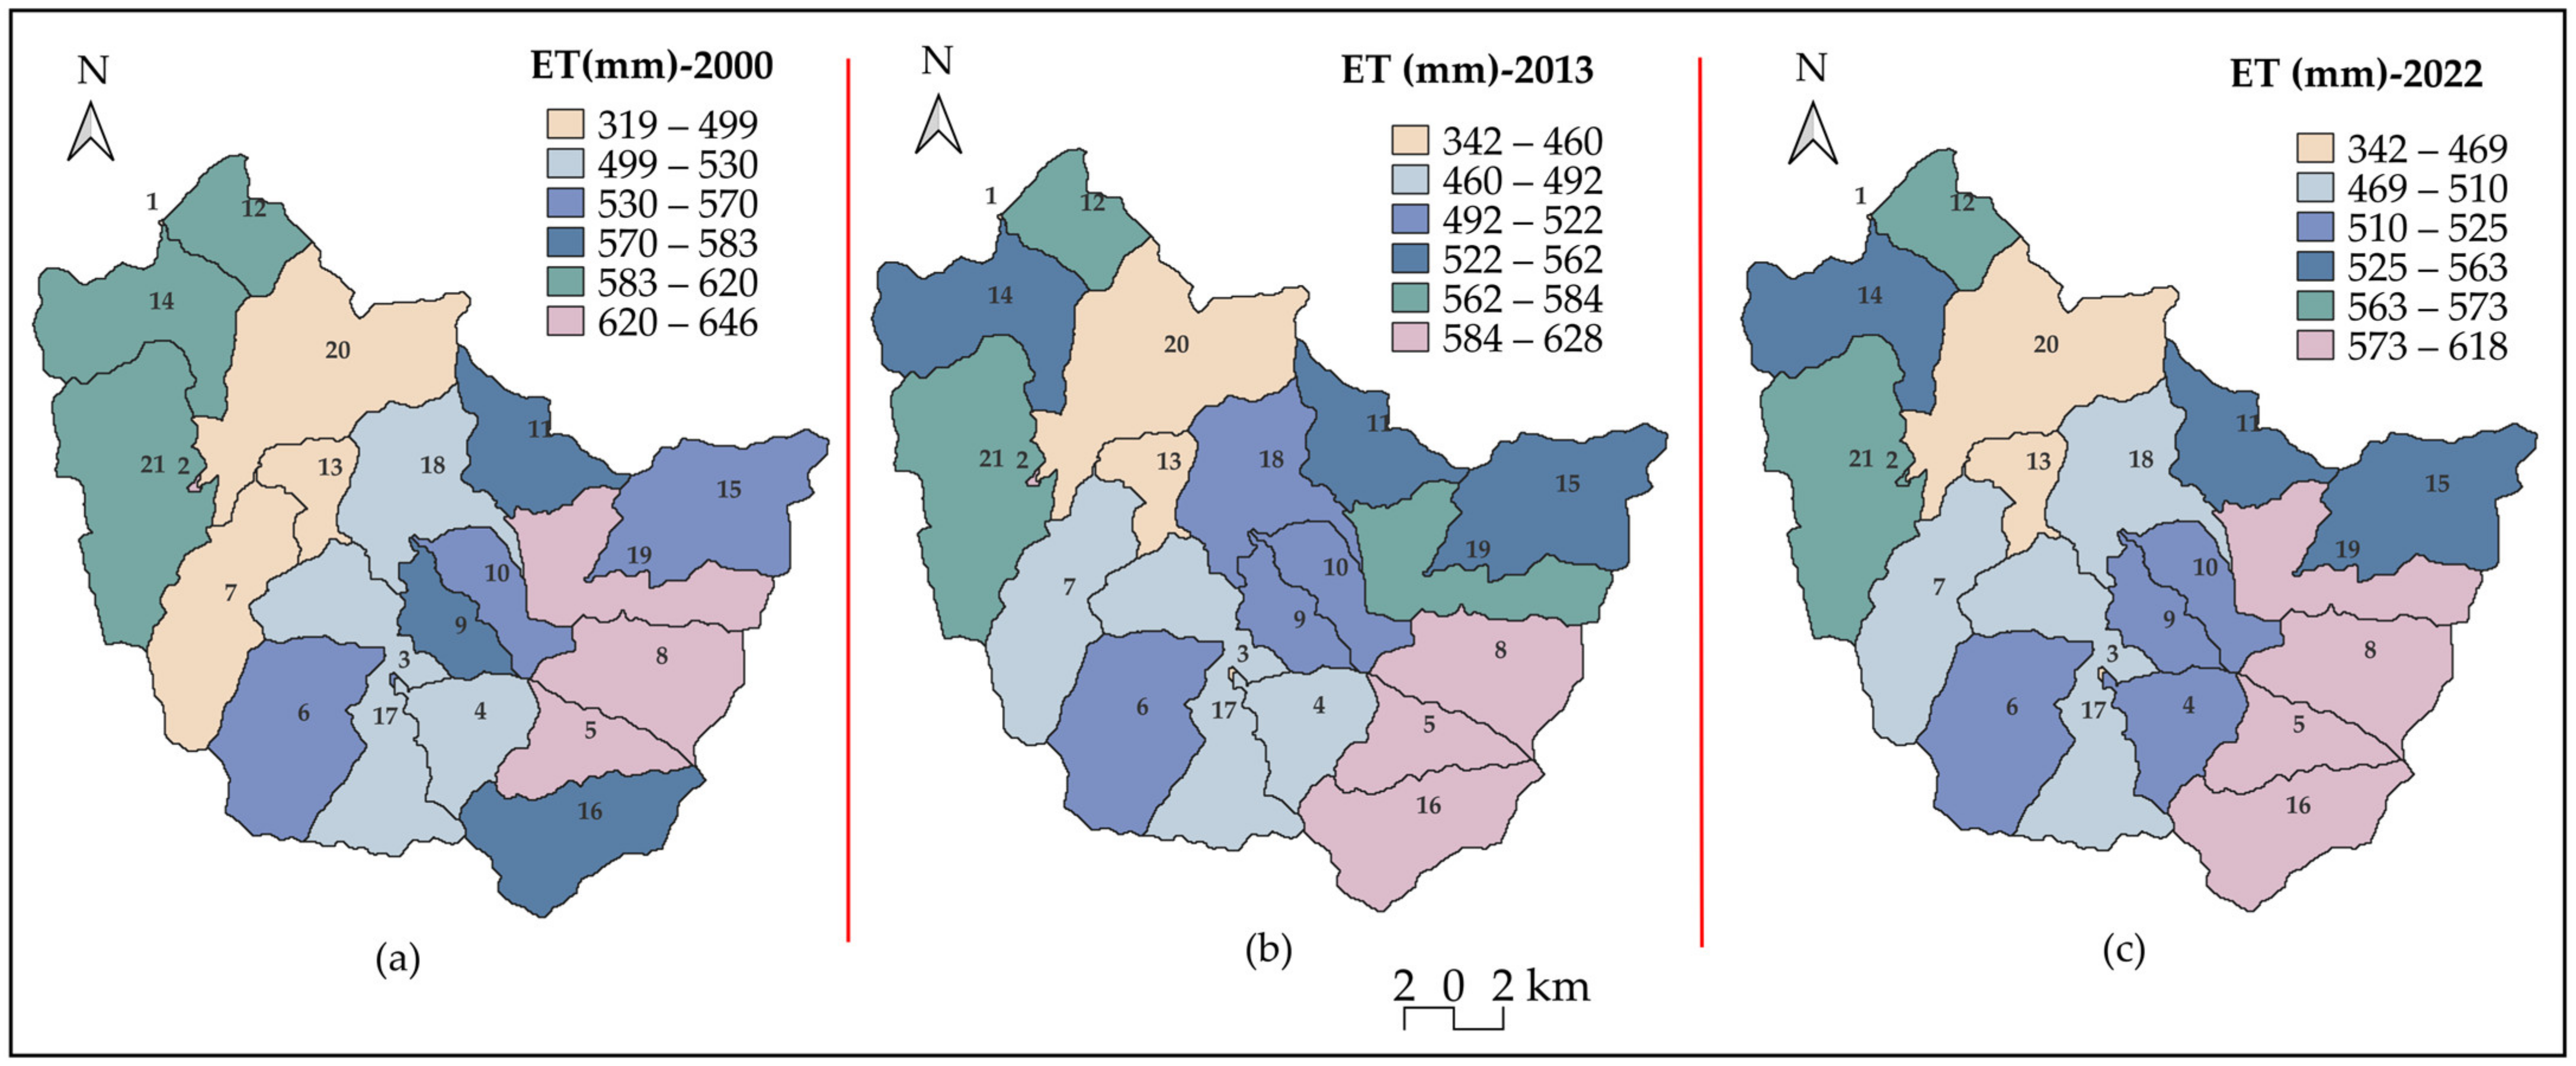
3.2.3. Evapotranspiration

Evapotranspiration (ET) is a hydrological component that plays a crucial role in influencing the response to LULC changes within watersheds [55]. Decreases in forested areas, urbanization, and the extension of pasture lands have resulted in altering the amount of ET in the catchment [56,57,58]. Figure 9 depicts the mean annual spatiotemporal distribution of ET in the study area for the three LULC scenarios spanning from 2004 to 2018. The ET values varied within the ranges from 319 mm to 646 mm, 342 mm to 628 mm, and 342 mm to 618 mm for the LULC scenarios of 2000, 2013, and 2022, respectively, as indicated in Figure 9. Sub-basin numbers 2, 8, and 5 exhibited the highest ET values in the LULC change scenarios of 2000, 2013, and 2022, respectively (see Figure 9). This elevated ET value was attributed to their substantial forest area coverage [59,60].
At the basin level, ET accounted for 43.36%, 41.7%, and 41.96% of the total precipitation in the region for the years 2000, 2013, and 2022, respectively, as shown in Table 3. During the LULC scenario transition from 2000 to 2013, the percentage of ET experienced a decrease of 1.66%, and for the period spanning from 2000 to 2022, it registered a reduction of 1.4%. This ET percentage reduction occurred due to the changes in pasture and agricultural land in the region (see Figure 4) [18,61]. There was a marginal increase of 0.26% in ET observed between 2013 and 2022, which was related to the decrease in rice cultivation and water areas in the region. The maximum ET value occurred in the month of August for all the LULC change scenarios, as depicted in Figure 7, where the rainfall was not at peak for the region. Studies indicate that alterations in land use and land cover have a considerable impact on the response of hydrological components within watersheds [55,62,63].
Pandey et al. [64] examined the hydrological response to both land use and land cover change and climate change in the upper Narmada basin, India. Their results revealed a reduction in evapotranspiration percentage of 4.19% due to land use changes between 2010 and 2030. Hence, understanding the hydrological response to LULC changes in a watershed is vital to managing and sustaining the available water resources.

4. Conclusions

The focus of this study was to analyze the hydrological response to changes in land use and land cover (LULC) in the Anyang watershed of South Korea using the SWAT model. The LULC scenarios for the years 2000, 2013, and 2022 were examined to determine the impact on the hydrological components in the study region. Over the course of two decades, the LULC scenarios underwent significant changes. For instance, low-density residential (URLD) areas experienced a decline of over 10% from 2000 to 2022, while agricultural land areas showed a 6.2% increase within the same timeframe. Forestland remained dominant in the region and had no significant change; in contrast, pastureland showed a noticeable 8.67% increase over the two decades.
The SWAT-CUP program, utilizing the SUFI-2 algorithm, was employed to adjust and evaluate the outputs of the SWAT model. This was carried out using the daily observed streamflow for both the calibration (2013–2017) and validation (2006–2010) of the study region. The results showed an excellent agreement between the simulated and observed streamflow values for each LULC change scenario during the calibration and validation periods. During the calibration period, the Nash–Sutcliffe efficiency (NSE) was 0.9, 0.89, and 0.89 for the 2000, 2013, and 2022 LULC scenarios, respectively, while for the validation period, the NSE values were 0.82, 0.78, and 0.8 for 2000, 2013, and 2022, respectively. The model performance indicator (R2, NSE, and PBIAS) values indicated that the model was able to replicate the daily observed streamflow, which also satisfied Moriasi et al.’s [49] recommended values.
The groundwater recharge value in the study region has decreased over the past two decades, likely due to the expansion of agricultural land, pastureland, and urban areas. This indicates a possible drop in the groundwater table in the region. Specifically, the study showed a decline of 1.15% in the groundwater recharge between 2000 and 2022 in the study watershed. At the sub-basin level, changes in LULC contributed to high recharge occurrence in the southeastern part of the region over the same period. In terms of water yield, the model output noted a 1.47% increase in the watershed between the years 2000 and 2022. This was primarily due to an increase in surface runoff from 218.5 mm to 252.7 mm for the same timeframe of the LULC scenario. The changes in urban area coverage and agricultural practices in the catchment were major factors influencing the surface runoff. Our study also assessed evapotranspiration (ET), which exhibited a 1.4% decrease in its contribution to the hydrological cycle in the watershed over the LULC change scenario period. This decrease can be attributed to the expansion of pastureland and agricultural practices in the region.
In summary, our research has shown that changes in LULC have had a notable impact on hydrological responses within the study watershed. Hence, this information could prove invaluable for policymakers as they make critical choices regarding the management of water resources. Moreover, the model findings of this study can be used as input data for the further assessment of groundwater recharge and abstraction using an integrated hydrological model.

Author Contributions

Conceptualization and methodology, H.H.W., S.W.C., J.E.L. and I.-M.C.; validation, H.H.W. and I.-M.C.; resources and data curation, S.W.C., J.E.L. and I.-M.C.; writing- original draft preparation, H.H.W.; writing-review and editing, H.H.W., S.W.C., J.E.L. and I.-M.C.; supervision, I.-M.C.; project administration, I.-M.C.; funding acquisition, I.-M.C. All authors have read and agreed to the published version of the manuscript.

Funding

The research for this paper was carried out under the KICT Research Program (Development of IWRM-Korea Technical Convergence Platform Based on Digital New Deal) funded by the Ministry of Science and ICT.

Data Availability Statement

Data are contained within the article.

Conflicts of Interest

The authors declare no conflicts of interest.

References

  1. Mensah, J.K.; Ofosu, E.A.; Yidana, S.M.; Akpoti, K.; Kabo-bah, A.T. Integrated Modeling of Hydrological Processes and Groundwater Recharge Based on Land Use Land Cover, and Climate Changes: A Systematic Review. Environ. Adv. 2022, 8, 100224. [Google Scholar] [CrossRef]
  2. Owuor, S.O.; Butterbach-Bahl, K.; Guzha, A.C.; Rufino, M.C.; Pelster, D.E.; Díaz-Pinés, E.; Breuer, L. Groundwater Recharge Rates and Surface Runoff Response to Land Use and Land Cover Changes in Semi-Arid Environments. Ecol. Process. 2016, 5, 1–21. [Google Scholar] [CrossRef]
  3. Afonso de Oliveira Serrão, E.; Silva, M.T.; Ferreira, T.R.; Paiva de Ataide, L.C.; Assis dos Santos, C.; Meiguins de Lima, A.M.; de Paulo Rodrigues da Silva, V.; de Assis Salviano de Sousa, F.; Cardoso Gomes, D.J. Impacts of Land Use and Land Cover Changes on Hydrological Processes and Sediment Yield Determined Using the SWAT Model. Int. J. Sediment Res. 2022, 37, 54–69. [Google Scholar] [CrossRef]
  4. Andaryani, S.; Nourani, V.; Trolle, D.; Dehgani, M.; Asl, A.M. Assessment of Land Use and Climate Change Effects on Land Subsidence Using a Hydrological Model and Radar Technique. J. Hydrol. 2019, 578, 124070. [Google Scholar] [CrossRef]
  5. Yifru, B.A.; Chung, I.-M.; Kim, M.-G.; Chang, S.W. Assessing the Effect of Land/Use Land Cover and Climate Change on Water Yield and Groundwater Recharge in East African Rift Valley Using Integrated Model. J. Hydrol. Reg. Stud. 2021, 37, 100926. [Google Scholar] [CrossRef]
  6. Kim, J.H.; Kwon, O.S.; Ra, J.H. Urban Type Classification and Characteristic Analysis through Time-Series Environmental Changes for Land Use Management for 31 Satellite Cities around Seoul, South Korea. Land 2021, 10, 799. [Google Scholar] [CrossRef]
  7. Zhang, H.; Wang, B.; Liu, D.L.; Zhang, M.; Leslie, L.M.; Yu, Q. Using an Improved SWAT Model to Simulate Hydrological Responses to Land Use Change: A Case Study of a Catchment in Tropical Australia. J. Hydrol. 2020, 585, 124822. [Google Scholar] [CrossRef]
  8. Mengistu, T.D.; Chung, I.-M.; Kim, M.-G.; Chang, S.W.; Lee, J.E. Impacts and Implications of Land Use Land Cover Dynamics on Groundwater Recharge and Surface Runoff in East African Watershed. Water 2022, 14, 2068. [Google Scholar] [CrossRef]
  9. Martínez-Retureta, R.; Aguayo, M.; Stehr, A.; Sauvage, S.; Echeverría, C.; Sánchez-Pérez, J.M. Effect of Land Use/Cover Change on the Hydrological Response of a Southern Center Basin of Chile. Water 2020, 12, 302. [Google Scholar] [CrossRef]
  10. Lee, J.; Park, M.; Min, J.H.; Na, E.H. Integrated Assessment of the Land Use Change and Climate Change Impact on Baseflow by Using Hydrologic Model. Sustainability 2023, 15, 12465. [Google Scholar] [CrossRef]
  11. Im, S.; Kim, H.; Kim, C.; Jang, C. Assessing the Impacts of Land Use Changes on Watershed Hydrology Using MIKE SHE. Environ. Geol. 2009, 57, 231–239. [Google Scholar] [CrossRef]
  12. Tam, V.T.; Nga, T.T.V. Assessment of Urbanization Impact on Groundwater Resources in Hanoi, Vietnam. J. Environ. Manag. 2018, 227, 107–116. [Google Scholar] [CrossRef]
  13. Koneti, S.; Sunkara, S.L.; Roy, P.S. Hydrological Modeling with Respect to Impact of Land-Use and Land-Cover Change on the Runoff Dynamics in Godavari River Basin Using the HEC-HMS Model. Int. J. Geo-Inf. 2018, 7, 206. [Google Scholar] [CrossRef]
  14. Sinha, R.K.; Eldho, T.I. Effects of Historical and Projected Land Use/Cover Change on Runoff and Sediment Yield in the Netravati River Basin, Western Ghats, India. Environ. Earth Sci. 2018, 77, 111. [Google Scholar] [CrossRef]
  15. Aragaw, H.M.; Goel, M.K.; Mishra, S.K. Hydrological Responses to Human-Induced Land Use/Land Cover Changes in the Gidabo River Basin, Ethiopia. Hydrol. Sci. J. 2021, 66, 640–655. [Google Scholar] [CrossRef]
  16. Andrade Abe, C.; de Lucia Lobo, F.; Berhan Dibike, Y.; Pereira de Farias Costa, M.; Dos Santos, V.; Márcia, M.; Novo, E.L. Modelling the Effects of Historical and Future Land Cover Changes on the Hydrology of an Amazonian Basin. Water 2018, 10, 932. [Google Scholar] [CrossRef]
  17. Teklay, A.; Dile, Y.T.; Asfaw, D.H.; Bayabil, H.K.; Sisay, K. Impacts of Climate and Land Use Change on Hydrological Response in Gumara Watershed, Ethiopia. Ecohydrol. Hydrobiol. 2021, 21, 315–332. [Google Scholar] [CrossRef]
  18. Das, P.; Behera, M.D.; Patidar, N.; Sahoo, B.; Tripathi, P.; Behera, P.R.; Srivastava, S.K.; Roy, P.S.; Thakur, P.; Agrawal, S.P.; et al. Impact of LULC Change on the Runoff, Base Flow and Evapotranspiration Dynamics in Eastern Indian River Basins during 1985–2005 Using Variable Infiltration Capacity Approach. J. Earth Syst. Sci. 2018, 127, 19. [Google Scholar] [CrossRef]
  19. Getachew, B.; Manjunatha, B.R.; Bhat, H.G. Modeling Projected Impacts of Climate and Land Use/Land Cover Changes on Hydrological Responses in the Lake Tana Basin, Upper Blue Nile River Basin, Ethiopia. J. Hydrol. 2021, 595, 125974. [Google Scholar] [CrossRef]
  20. Gassman, P.W.; Sadeghi, A.M.; Srinivasan, R. Applications of the SWAT Model Special Section: Overview and Insights. J. Environ. Qual. 2014, 43, 1–8. [Google Scholar] [CrossRef]
  21. Molina-Navarro, E.; Bailey, R.T.; Andersen, H.E.; Thodsen, H.; Nielsen, A.; Park, S.; Jensen, J.S.; Jensen, J.B.; Trolle, D. Comparison of Abstraction Scenarios Simulated by SWAT and SWAT-MODFLOW. Hydrol. Sci. J. 2019, 64, 434–454. [Google Scholar] [CrossRef]
  22. Liu, W.; Park, S.; Bailey, R.; Molina-Navarro, E.; Andersen, H.E.; Thodsen, H.; Nielsen, A.; Jeppesen; Jensen, E.; Skødt, J.; et al. Comparing SWAT with SWAT-MODFLOW Hydrological Simulations When Assessing the Impacts of Groundwater Abstractions for Irrigation and Drinking Water. Hydrol. Earth Syst. Sci. Discuss. 2019, 1–51. [Google Scholar] [CrossRef]
  23. Liu, W.; Wu, J.; Xu, F.; Mu, D.; Zhang, P. Modeling the Effects of Land Use/Land Cover Changes on River Runoff Using SWAT Models: A Case Study of the Danjiang River Source Area, China. Environ. Res. 2024, 242, 117810. [Google Scholar] [CrossRef] [PubMed]
  24. Ashraf, S.; Ali, M.; Shrestha, S.; Hafeez, M.A.; Moiz, A.; Sheikh, Z.A. Impacts of Climate and Land-Use Change on Groundwater Recharge in the Semi-Arid Lower Ravi River Basin, Pakistan. Groundw. Sustain. Dev. 2022, 17, 100743. [Google Scholar] [CrossRef]
  25. Siddik, M.S.; Tulip, S.S.; Rahman, A.; Islam, M.N.; Haghighi, A.T.; Mustafa, S.M.T. The Impact of Land Use and Land Cover Change on Groundwater Recharge in Northwestern Bangladesh. J. Environ. Manag. 2022, 315, 115130. [Google Scholar] [CrossRef] [PubMed]
  26. Chauhan, N.; Kumar, V.; Paliwal, R. Quantifying the Impacts of Decadal Landuse Change on the Water Balance Components Using Soil and Water Assessment Tool in Ghaggar River Basin. SN Appl. Sci. 2020, 2, 1777. [Google Scholar] [CrossRef]
  27. Lee, J.E.; Chung, I.M.; Lee, J.; Kim, M.G. Estimation of Exploitable Groundwater in the Jinju Region by Using a Distributed Hydrologic Model. KSCE J. Civ. Environ. Eng. Res. 2021, 41, 655–662. [Google Scholar] [CrossRef]
  28. Lopes, T.R.; Zolin, C.A.; Mingoti, R.; Vendrusculo, L.G.; de Almeida, F.T.; de Souza, A.P.; de Oliveira, R.F.; Paulino, J.; Uliana, E.M. Hydrological Regime, Water Availability and Land Use/Land Cover Change Impact on the Water Balance in a Large Agriculture Basin in the Southern Brazilian Amazon. J. S. Am. Earth Sci. 2021, 108, 103224. [Google Scholar] [CrossRef]
  29. Wagner, P.D.; Bhallamudi, S.M.; Narasimhan, B.; Kantakumar, L.N.; Sudheer, K.P.; Kumar, S.; Schneider, K.; Fiener, P. Dynamic Integration of Land Use Changes in a Hydrologic Assessment of a Rapidly Developing Indian Catchment. Sci. Total Environ. 2016, 539, 153–164. [Google Scholar] [CrossRef]
  30. Seyoum, W.M.; Milewski, A.M.; Durham, M.C. Understanding the Relative Impacts of Natural Processes and Human Activities on the Hydrology of the Central Rift Valley Lakes, East Africa. Hydrol. Process. 2015, 29, 4312–4324. [Google Scholar] [CrossRef]
  31. Chen, M.; Gassman, P.W.; Srinivasan, R.; Cui, Y.; Arritt, R. Analysis of Alternative Climate Datasets and Evapotranspiration Methods for the Upper Mississippi River Basin Using SWAT within HAWQS. Sci. Total Environ. 2020, 720, 137562. [Google Scholar] [CrossRef]
  32. Chung, I.-M.; Lee, J. Preliminary Hydrological Design for Sand Dam Installation at the Valley of Seosang-Ri, Chuncheon. KSCE J. Civ. Environ. Eng. Res. 2019, 39, 725–733. [Google Scholar] [CrossRef]
  33. Choi, J.R.; Kim, B.S.; Kang, D.H.; Chung, I.M. Evaluation of Water Supply Capacity of a Small Forested Basin Water Supply Facilities Using SWAT Model and Flow Recession Curve. KSCE J. Civ. Eng. 2022, 26, 3665–3675. [Google Scholar] [CrossRef]
  34. Qi, P.; Xu, Y.J.; Wang, G. Quantifying the Individual Contributions of Climate Change, Dam Construction, and Land Use/Land Cover Change to Hydrological Drought in a Marshy River. Sustainability 2020, 12, 3777. [Google Scholar] [CrossRef]
  35. Ma, K.; Huang, X.; Liang, C.; Zhao, H.; Zhou, X.; Wei, X. Effect of Land Use/Cover Changes on Runoff in the Min River Watershed. River Res. Appl. 2020, 36, 749–759. [Google Scholar] [CrossRef]
  36. Arnold, J.G.; Srinivasan, R.; Muttiah, R.S.; Williams, J.R. Large Area Hydrologic Modeling and Assessment Part I: Model Development. J. Am. Water Resour. Assoc. 1998, 34, 73–89. [Google Scholar] [CrossRef]
  37. Arnold, J.; Kiniry, R.; Williams, E.; Haney, S.; Neitsch, S. Soil & Water Assessment Tool. In Input/Output Documentation Version 2012; TR-439; Texas Water Resources Institute: College Station, TX, USA, 2012. [Google Scholar]
  38. Sertel, E.; Imamoglu, M.Z.; Cuceloglu, G.; Erturk, A. Impacts of Land Cover/Use Changes on Hydrological Processes in a Rapidly Urbanizing Mid-Latitude Water Supply Catchment. Water 2019, 11, 1075. [Google Scholar] [CrossRef]
  39. Ware, H.H.; Mengistu, T.D.; Yifru, B.A.; Chang, S.W.; Chung, I.-M. Assessment of Spatiotemporal Groundwater Recharge Distribution Using SWAT-MODFLOW Model and Transient Water Table Fluctuation Method. Water 2023, 15, 2112. [Google Scholar] [CrossRef]
  40. Welcome to the National Academy of Agricultural Sciences. Available online: http://www.naas.go.kr/ (accessed on 11 November 2023).
  41. Korea Soil Information System. Available online: https://soil.rda.go.kr/soil/koreaSoils/soilSearch.jsp (accessed on 10 October 2023).
  42. Environmental Spatial Information Service. Available online: https://egis.me.go.kr/intro/land.do (accessed on 10 October 2023).
  43. Metrological Agency Weather Data Service. Available online: https://data.kma.go.kr/cmmn/main.do (accessed on 11 November 2022).
  44. Water Resources Management Information System. Available online: http://www.wamis.go.kr/ (accessed on 11 November 2022).
  45. Moriasi, D.; Arnold, J. Evaluating Hydrology of the Soil and Water Assessment Tool (SWAT) with New Tile Drain Equations. Artic. J. Soil Water Conserv. 2012, 67, 513–524. [Google Scholar] [CrossRef]
  46. Abbaspour, K.C. SWAT-CUP SWATCalibration and Uncertainty Programs. Arch. Orthop. Trauma Surg. 2010, 130, 965–970. [Google Scholar]
  47. Abbaspour, K.C.; Rouholahnejad, E.; Vaghefi, S.; Srinivasan, R.; Yang, H.; Kløve, B. A Continental-Scale Hydrology and Water Quality Model for Europe: Calibration and Uncertainty of a High-Resolution Large-Scale SWAT Model. J. Hydrol. 2015, 524, 733–752. [Google Scholar] [CrossRef]
  48. Yang, J.; Reichert, P.; Abbaspour, K.C.; Xia, J.; Yang, H. Comparing Uncertainty Analysis Techniques for a SWAT Application to the Chaohe Basin in China. J. Hydrol. 2008, 358, 1–23. [Google Scholar] [CrossRef]
  49. Moriasi, D.N.; Arnold, J.G.; Van Liew, M.W.; Bingner, R.L.; Harmel, R.D.; Veith, T.L. Veith Model Evaluation Guidelines for Systematic Quantification of Accuracy in Watershed Simulations. Trans. ASABE 2007, 50, 885–900. [Google Scholar] [CrossRef]
  50. Dogan, F.N.; Karpuzcu, M.E. Effect of Land Use Change on Hydrology of Forested Watersheds. Ecohydrology 2022, 15, e2367. [Google Scholar] [CrossRef]
  51. Yifru, B.A.; Chung, I.-M.; Kim, M.-G.; Chang, S.W. Assessment of Groundwater Recharge in Agro-Urban Watersheds Using Integrated SWAT-MODFLOW Model. Sustainability 2020, 12, 6593. [Google Scholar] [CrossRef]
  52. Huang, T.C.C.; Lo, K.F.A. Effects of Land Use Change on Sediment and Water Yields in Yang Ming Shan National Park, Taiwan. Environments 2015, 2, 32–42. [Google Scholar] [CrossRef]
  53. Phuong, T.T.; Vo, C.; Thong, T.; Bich, N.; Huynh, N.; Chuong, V. Modeling Soil Erosion within Small Moutainous Watershed in Central Vietnam Using GIS and SWAT. Resour. Environ. 2014, 4, 139–147. [Google Scholar] [CrossRef]
  54. Gessesse, A.A.; Melesse, A.M.; Abera, F.F.; Abiy, A.Z. Modeling Hydrological Responses to Land Use Dynamics, Choke, Ethiopia. Water Conserv. Sci. Eng. 2019, 4, 201–212. [Google Scholar] [CrossRef]
  55. Santillan, J.R.; Amora, A.M.; Makinano-Santillan, M.; Gingo, A.L.; Marqueso, J.T. Analyzing the impacts of land cover change to the hydrologic and hydraulic behaviours of the philippines’ third largest river basin. ISPRS Ann. Photogramm. Remote Sens. Spat. Inf. Sci. 2019, 4, 41–48. [Google Scholar] [CrossRef]
  56. Akpoti, K.; Antwi, E.; Hydrology, A.K. Impacts of Rainfall Variability, Land Use and Land Cover Change on Stream Flow of the Black Volta Basin, West Africa. Hydrology 2016, 3, 26. [Google Scholar] [CrossRef]
  57. Hengade, N.; Eldho, T.I. Relative Impact of Recent Climate and Land Cover Changes in the Godavari River Basin, India. J. Earth Syst. Sci. 2019, 128, 94. [Google Scholar] [CrossRef]
  58. Staal, A.; Flores, B.M.; Aguiar, A.P.; Bosmans, J.H.; Fetzer, I.; Tuinenburg, O.A. Feedback between Drought and Deforestation in the Amazon. Environ. Res. Lett. 2020, 15, 044024. [Google Scholar] [CrossRef]
  59. Aladejana, O.O.; Salami, A.T.; Adetoro, O.I.O. Hydrological Responses to Land Degradation in the Northwest Benin Owena River Basin, Nigeria. J. Environ. Manag. 2018, 225, 300–312. [Google Scholar] [CrossRef]
  60. Farinosi, F.; Arias, M.E.; Lee, E.; Longo, M.; Pereira, F.F.; Livino, A.; Moorcroft, P.R.; Briscoe, J. Future Climate and Land Use Change Impacts on River Flows in the Tapajós Basin in the Brazilian Amazon. Earth’s Future 2019, 7, 993–1017. [Google Scholar] [CrossRef]
  61. Hassaballah, K.; Mohamed, Y.; Uhlenbrook, S.; Biro, K. Analysis of Streamflow Response to Land Use and Land Cover Changes Using Satellite Data and Hydrological Modelling: Case Study of Dinder and Rahad Tributaries of The Blue Nile (Ethiopia–Sudan). Hydrol. Earth Syst. Sci. 2017, 21, 5217–5242. [Google Scholar] [CrossRef]
  62. Baker, T.J.; Miller, S.N. Using the Soil and Water Assessment Tool (SWAT) to Assess Land Use Impact on Water Resources in an East African Watershed. J. Hydrol. 2013, 486, 100–111. [Google Scholar] [CrossRef]
  63. de Moraes, T.C.; dos Santos, V.J.; Calijuri, M.L.; Torres, F.T.P. Effects on Runoff Caused by Changes in Land Cover in a Brazilian Southeast Basin: Evaluation by HEC-HMS and HEC-GEOHMS. Environ. Earth Sci. 2018, 77, 250. [Google Scholar] [CrossRef]
  64. Pandey, B.K.; Khare, D.; Kawasaki, A.; Meshesha, T.W. Integrated Approach to Simulate Hydrological Responses to Land Use Dynamics and Climate Change Scenarios Employing Scoring Method in Upper Narmada Basin, India. J. Hydrol. 2021, 598, 126429. [Google Scholar] [CrossRef]
Figure 1. Anyang site map with digital elevation model (DEM) and others.
Water 16 00528 g001
Figure 2. Anyang watershed soil types: (a) local soil classes used in the SWAT model; (b) hydrological soil group for soil types.
Water 16 00528 g002
Figure 3. Study watershed LULC types and their distribution for (a) 2000, (b) 2013, and (c) 2022.
Water 16 00528 g003
Figure 4. LULC area coverage in percentages for the study watershed.
Water 16 00528 g004
Figure 5. Observed vs. simulated streamflow hydrograph, including precipitation during calibration and validation for (a) 2000, (b) 2013, and (c) 2022 LULC changes.
Water 16 00528 g005
Figure 6. Mean annual groundwater recharge spatiotemporal distribution across the years 2004—2018 for LULC in (a) 2000, (b) 2013, and (c) 2022.
Water 16 00528 g006
Figure 7. Mean monthly water balance components of the watershed for (a) 2000, (b) 2013, and (c) 2022 during the period 2004–2018.
Water 16 00528 g007
Figure 8. Average annual water yield spatiotemporal distribution for the years (a) 2000, (b) 2013, and (c) 2022 of the study watershed for the period of 2004–2018.
Water 16 00528 g008
Figure 9. Average annual spatiotemporal distribution of ET for LULC change scenarios of (a) 2000, (b) 2013, and (c) 2022 within the span of 2004—2018.
Water 16 00528 g009
Table 1. SWAT model calibration parameters with their description, range, and fit values.
ParametersDescriptionsRange ValueFit Value
r__CN2.mgtInitial SCS runoff curve no. for moisture condition II−0.2–0.2−0.18
v__ALPHA_BF.gwBaseflow alpha factor (days)0–10.7
v__GW_DELAY.gwGroundwater delay (days)1–11
v__GWQMN.gwThreshold depth of water in the shallow aquifer required for return flow to occur (mm)0–15001141.5
v__GW_REVAP.gwGroundwater “revap” coefficient0.02–0.20.005
v__ESCO.hruSoil evaporation compensation factor (-)0–10.084
v__EPCO.hruPlant uptake compensation factor (-)0–10.173
r__SOL_AWC().solAvailable water capacity of the soil layer (mm mm−1)−0.3–0.3−0.23
v__RCHRG_DP.gwDeep aquifer percolation fraction0–10.57
r__SOL_K().solSaturated hydraulic conductivity (mm/h)−0.2–0.2−0.18
r__SOL_BD().solMoist bulk density−0.2–0.3−0.12
v__REVAPMN.gwThreshold depth of water in the shallow aquifer for “revap” to occur (mm)0–500274.5
r__HRU_SLP.hruAverage slope steepness (m/m)0–0.20.076
r__OV_N.hruManning’s “n” value for overland flow−0.2–0.2−0.037
r__SLSUBBSN.hruSurface runoff lag coefficient−0.2–0.2−0.02
Note: r__ means multiplied by (1 + adjusted value); v__ means substitute the parameter value.
Table 2. Statistical variable indicators performance for calibration and validation of SWAT LULC scenarios.
Year200020132022
Statistical variableCalibrationValidationCalibrationValidationCalibrationValidation
R20.910.860.900.850.900.86
NSE0.900.820.890.780.890.80
PBIAS11.3−10.47.4−17.68.3−15.9
Table 3. Average annual values of hydrological segments of the study watershed within the period from 2004 to 2018 considering LULC change scenarios.
Hydrological ComponentsLULC-2000LULC-2013LULC-2022
Precipitation, mm1266.81266.81266.8
Surface runoff, mm (%)218.48 (17.25)263.5 (20.80)252.69 (19.96)
Lateral flow, mm (%)289.48 (22.85)289.54 (22.86)288.33 (22.76)
Water yield, mm (%)711.17 (56.14)733.06 (57.87)729.84 (57.61)
Recharge, mm (%)208.18 (16.43)184.84 (14.59)193.63 (15.28)
ET, mm (%)549.3 (43.36)528.3 (41.70)531.6 (41.96)
Note: Water yield = surface runoff + lateral flow + groundwater flow—tile flow—transmission loss.
Disclaimer/Publisher’s Note: The statements, opinions and data contained in all publications are solely those of the individual author(s) and contributor(s) and not of MDPI and/or the editor(s). MDPI and/or the editor(s) disclaim responsibility for any injury to people or property resulting from any ideas, methods, instructions or products referred to in the content.

