Article

The Effects of a Fishery Complementary Photovoltaic Power Plant on the Near-Surface Meteorology and Water Quality of Coastal Aquaculture Ponds

1
Third Institute of Oceanography, Ministry of Natural Resources, Xiamen 361005, China
2
College of Fisheries, Jimei University, Xiamen 361021, China
3
Fujian Provincial Key Laboratory of Marine Fishery Resources and Eco-Environment, Xiamen 361021, China
*
Authors to whom correspondence should be addressed.
Water 2024, 16(4), 526; https://doi.org/10.3390/w16040526
Submission received: 3 January 2024 / Revised: 30 January 2024 / Accepted: 5 February 2024 / Published: 7 February 2024
(This article belongs to the Topic Carbon-Energy-Water Nexus in Global Energy Transition)

Abstract

:
To date, most studies focus on the ecological and environmental effects of land-based photovoltaic (PV) power plants, while there is a dearth of studies examining the impacts of water-based PV power plants. The effects of a fishery complementary PV power plant, a kind of water-based PV technology, on the near-surface meteorology and aquaculture water environment were investigated in coastal aquaculture ponds in southeast China. The results showed that PV prevented 89~93% of the solar radiation on the surface of the pond, resulting in an average reduction in water temperature of 1.5 °C and a substantial decrease in light intensity of 94%. Furthermore, it weakened the wind speed by 41~50% and elevated the surface air temperature by an average of 0.6 °C. In addition, PV power results in an impressive decrease in chlorophyll-α of 72~94% and a notable increase in dissolved oxygen (DO) concentrations of 8~24%. PV power also reduced the concentration of labile phosphate, active silicate, total nitrogen, total phosphorus, and total organic carbon. However, the PV power did not have a substantial influence on the concentrations of nitrate and ammonium. Our results highlight that fishery complementary PV power plants may be able to improve water quality and benefit shade-loving species.

1. Introduction

To manage the global energy crisis and climate change, vigorously developing renewable energy has become the leading direction of low-carbon energy transformation [1]. As an important part of renewable energy, photovoltaic (PV) power generation is developing rapidly. According to the Renewables 2023 Global Status Report [2], the newly installed capacity of global PV power generation in 2022 was 243 GW, and the total installed capacity reached 1185 GW, accounting for 6.2% of global power generation. Since 2012, China and other Asian countries have gradually become the main contributors to the growth of the global capacity of PV installations. For instance, the average annual growth rate of the cumulative installed capacity of PV power generation from 2013 to 2021 in China reached 61.08%. In 2022, the cumulative installed capacity of PV power generation was predicted to reach 414.5 GW, ranking first in the world [2,3]. To achieve the dual carbon strategic goal of carbon peak and carbon neutrality, China’s 14th Five-Year Plan for renewable energy development clearly states the following measures: during the period from 2021 to 2025, while increasing the construction of PV bases and promoting the centralized development of PV power, China should actively promote the comprehensive utilization of PV plus plants and encourage PV composite development models, such as fishery complementary PV power plants; by 2025, China aims to double its capacity for both PV and wind power generation; by 2030, the cumulative installed capacity for wind power and PV generation is projected to reach an impressive scale of 1.2 × 10⁹ kW [4].
To date, the Chinese PV industry is in a stage of leapfrog development. Due to the lack of large flat land resources suitable for building concentrated PV power plants in central and eastern China, particularly in the eastern coastal areas, investors have begun to actively deploy PV power on water surfaces to improve land utilization [5]. Compared to land-based PV power, water-based PV power offers several advantages including land conservation, the prevention of module shading, enhanced power generation efficiency, simplified module cleaning procedures, and reduced risk of module damage. These benefits present a novel approach for the sustainable development of China’s PV industry [6,7]. Water-based PV power plants mainly adopt the PV plus surface mode, with freshwater bodies such as ponds, small lakes, reservoirs, and canals [8]. In recent years, to improve the utilization efficiency of marine resources and increase the economic benefits of coastal aquaculture areas, the Chinese government has encouraged enterprises to use coastal aquaculture areas to build water-based PV power plants. This initiative has promoted the rapid development of fishery complementary PV power plants in coastal aquaculture areas. The integration of water-based PV technology into marine areas and its combination with fishery production systems in coastal aquaculture regions represents a novel approach known as fishery complementary PV technology. The purpose of this technology is to reduce the energy cost and corresponding carbon emissions of aquaculture activities in coastal aquaculture areas, thereby enhancing production efficiency per unit of marine area [9,10].
Some studies have shown that the synergistic effect of a water-based PV power plant, coupled with the dual utilization of water areas for aquaculture, can be realized on the premise of improved environmental and aquacultural benefits [11,12,13]. The same is true for fishery complementary PV power plants in coastal aquaculture areas.
To date, the use of overhead support to deploy PV modules on the water surfaces of aquaculture ponds is the mainstream method for fishery complementary PV power plants in China [14,15]. Due to the shading effect of the PV panels (mainly on solar radiation and wind speed), alterations in light penetration into aquaculture water bodies have a series of effects on the various physical and chemical properties of aquaculture ponds including water temperature, dissolved oxygen (DO), nutrients, primary productivity, chlorophyll-α (Chl-α), and plankton [8], as well as the growth of different aquaculture organisms [16]. Water-based PV power plants in China are currently in the early stage of development, and they still face the challenge of achieving an equilibrium between economic and environmental benefits [11]. However, our understanding of the environmental impact of PV systems remains constrained. In this paper, the effects of a fishery complementary PV power plant on near-surface meteorology and water quality were investigated in a coastal aquaculture area, and the possible pathways for producing these effects were discussed and analyzed. By comparing the PV area and the control area, this study explored the effects of a fishery complementary PV power plant on near-surface meteorology and coastal aquaculture water bodies. The results of this study could provide a reference for the development of fishery complementary PV power plants in the coastal aquaculture areas of China. Furthermore, it is crucial to acknowledge that aquaculture plays a pivotal role as a significant food source. A comprehensive and profound comprehension of the impact of PV power on the aquaculture environment can effectively foster collaborative and sustainable development.

2. Materials and Methods
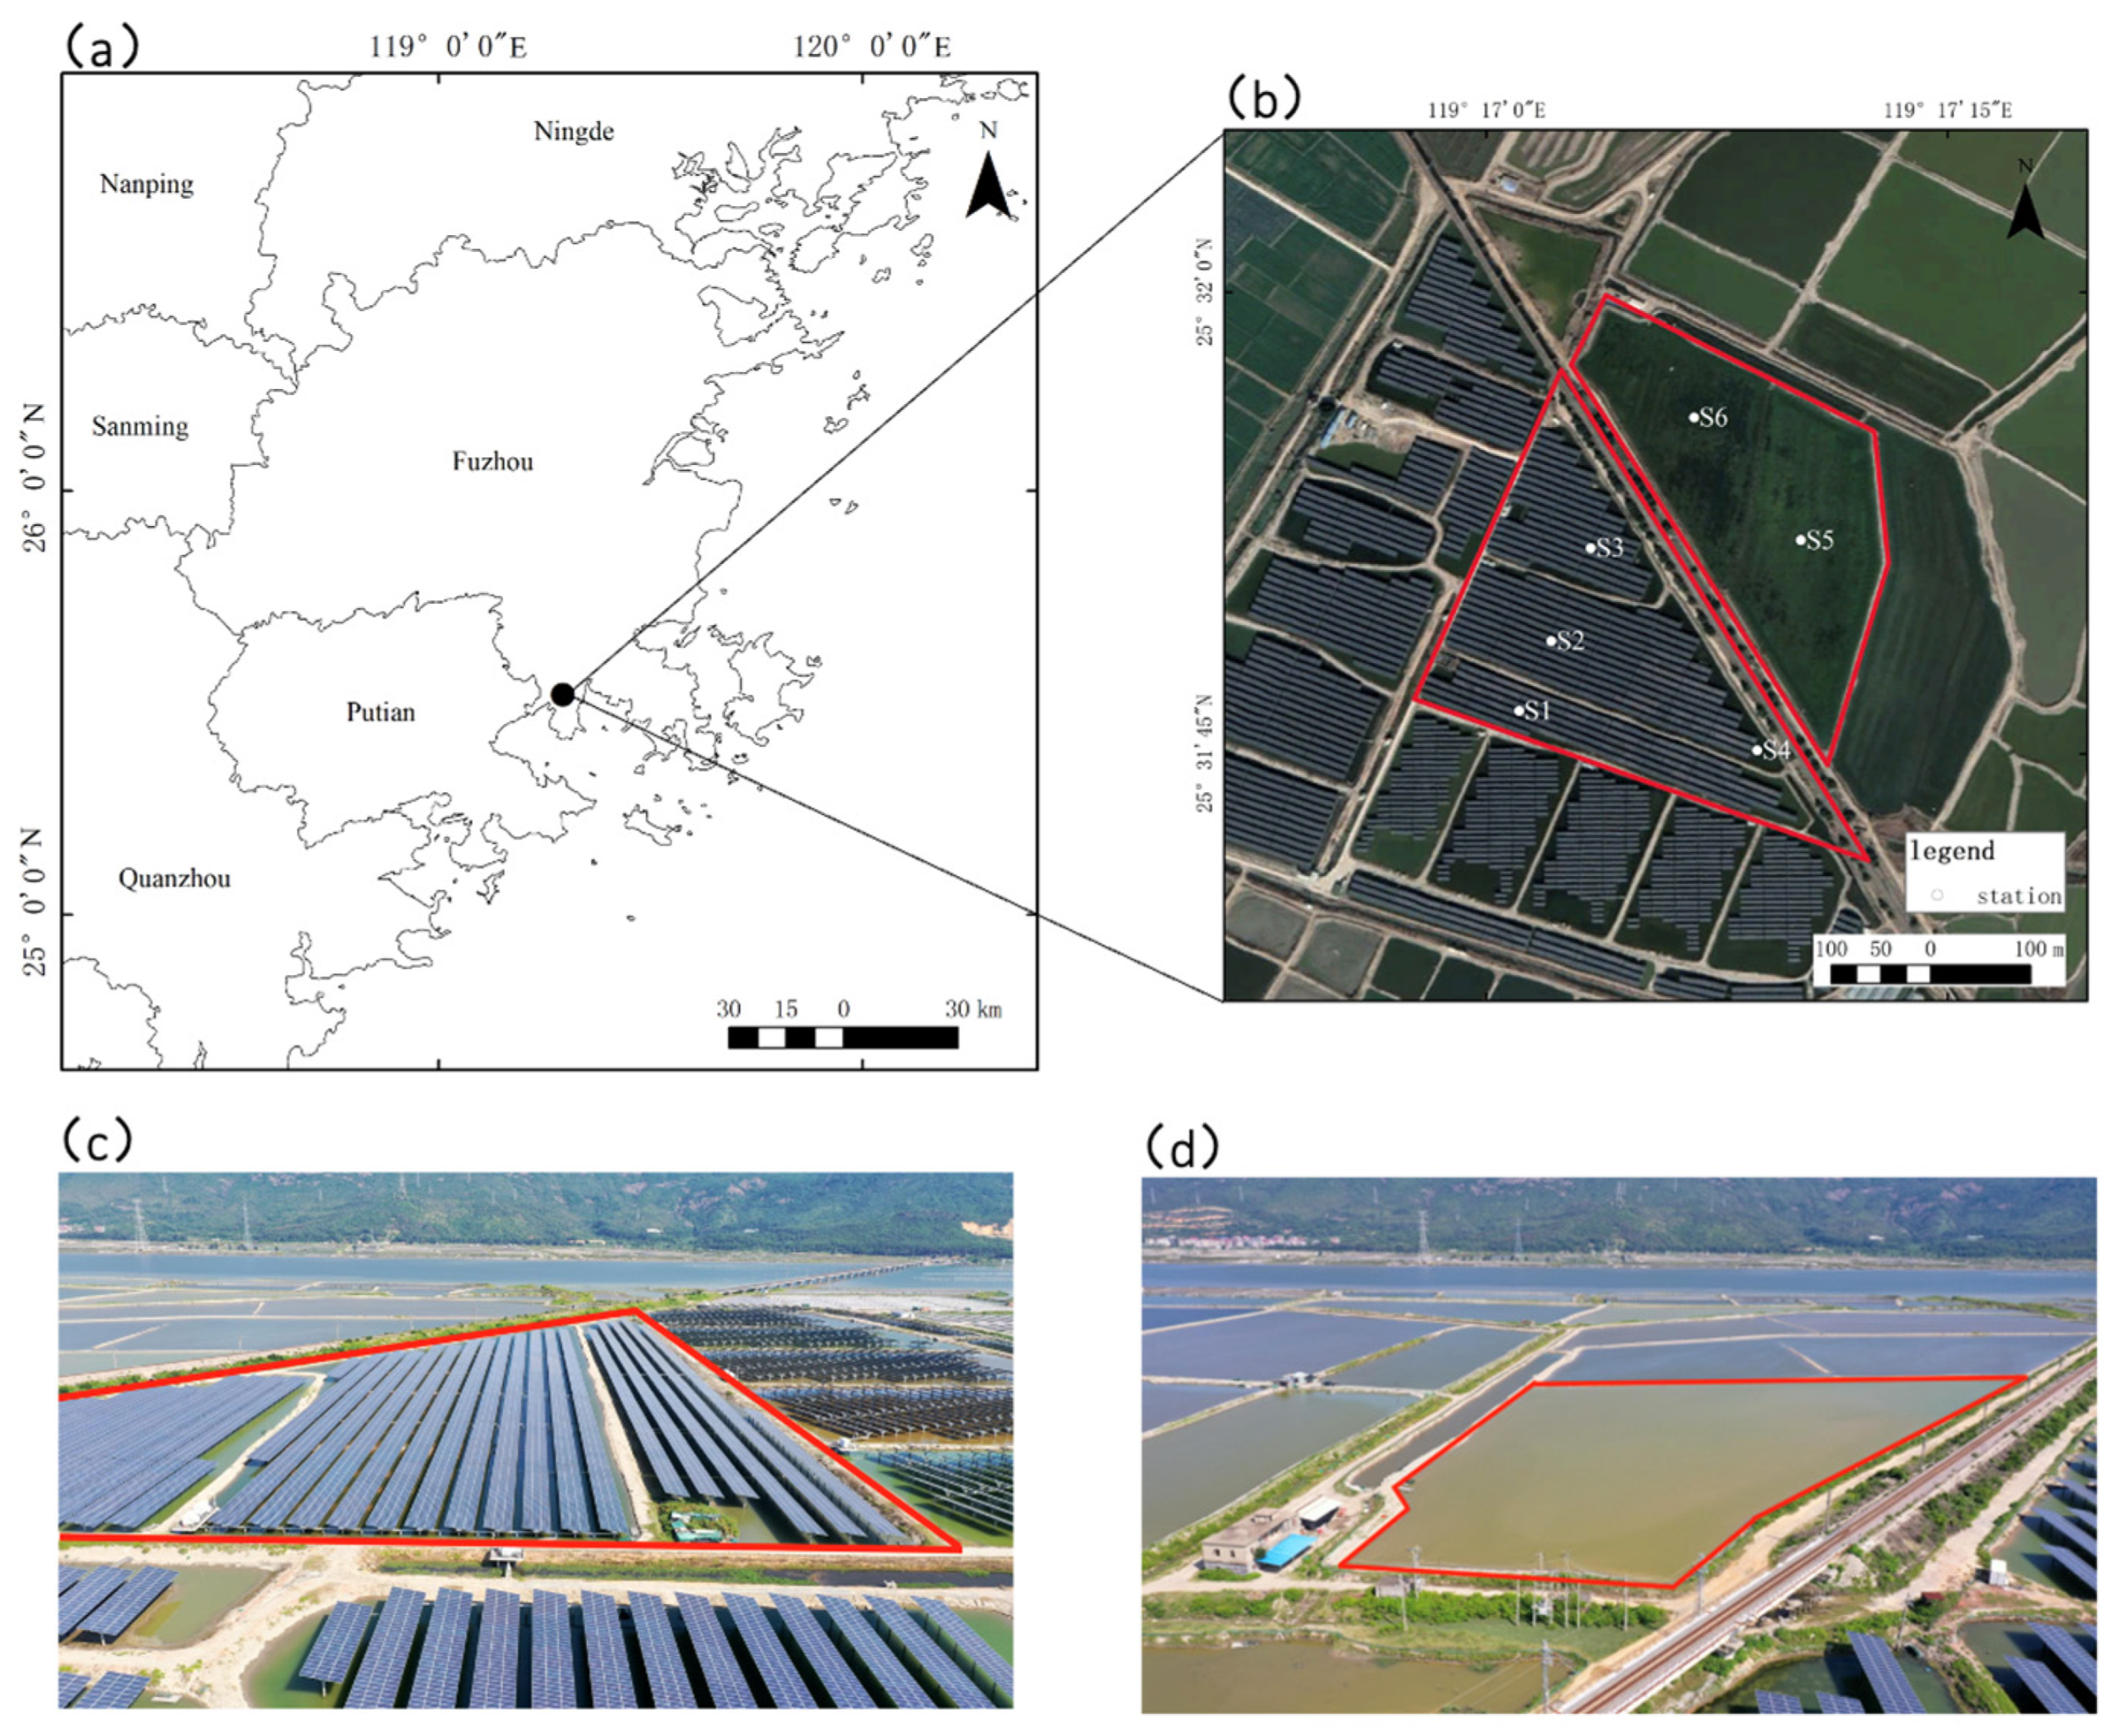
2.1. Study Area

The study area is in the aquaculture ponds of Guoqiaoshan, Fuqing city, Fujian province, China (25°31′48″ N, 119°17′24″ E) (Figure 1). The installed PV capacity is 20 MW. The breeding species is mud crab (Scylla serrata), with a breeding density of about 15,000 per hectare. The PV area has an 80% PV coverage rate, while the control area has no PV coverage (Figure 1). The water depth in both areas ranges from 0.4 to 1.4 m. The combined land area encompasses 12 hectares. The row spacing of the PV array is 7.8 m, and the pile foundation spacing is 5.0 m. The distance between the surface and the central point of the PV panel is 2.35~3.02 m.
Clams (Mactra veneriformis and Potamocorbula laevis) were only used for feeding mud crabs both in the PV area and the control area. In addition, other methods like the water level and feeding frequency and amount are the same in the two areas. Unless affected by wind, the ponds remain a closed water body outside the intake period.

2.2. Sampling and Analysis Methods

A total of 6 stations are arranged in this sampling area (Figure 1). The arrangement is as follows: 4 stations are arranged in the PV area, of which 3 are under PV systems (S1, S2 and S3) and 1 is outside a PV system (S4). Two stations (S5 and S6) are arranged in the control area. In addition, near-surface meteorological parameters without PV coverage near S1, S2, and S3 were measured to guarantee comparability. In this paper, the PV area is represented by S1, S2 and S3, while the control area is represented by S5 and S6.
Near-surface meteorological parameters are measured for about 20 min at each station and the sensor is 1.5~1.7 m above the water surface. Water samples are collected twice at a depth of 0.1 m at the same time. Since the control area is open and unobserved, near-surface meteorological parameters are measured once at S5 and S6. Near-surface meteorological parameters are measured once every minute using a micrometeorological station (TRM-ZS1, Jinzhou Sunshine Meteorological Science and Technology Co., Ltd., Jinzhou, China) and a net total radiometer (TBB-2, Jinzhou Sunshine Meteorological Science and Technology Co., Ltd., Jinzhou, China). Water samples are collected and determined in accordance with the specifications for oceanographic survey (GB/T 12763-2007) [17] and the specification for marine monitoring (GB 17378.4-2007) [18]. All measurements and sample collection were completed on 2 March 2023.

2.3. Statistical Analysis

R4.0.3 was used to analyze the data, including a two-sample t-test and Pearson correlation coefficient calculations. MATLAB (R2022a) was used to draw the position distribution of the parameters. To test whether there is a significant difference between the parameters in the PV area and the control area, the two-sample t-test method was used, and the p-value was marked in the station distribution map of the parameters. Pearson correlation analysis was carried out for water temperature and other parameters to explore the influencing mechanism of PV power on temperature and other parameters.

3. Results

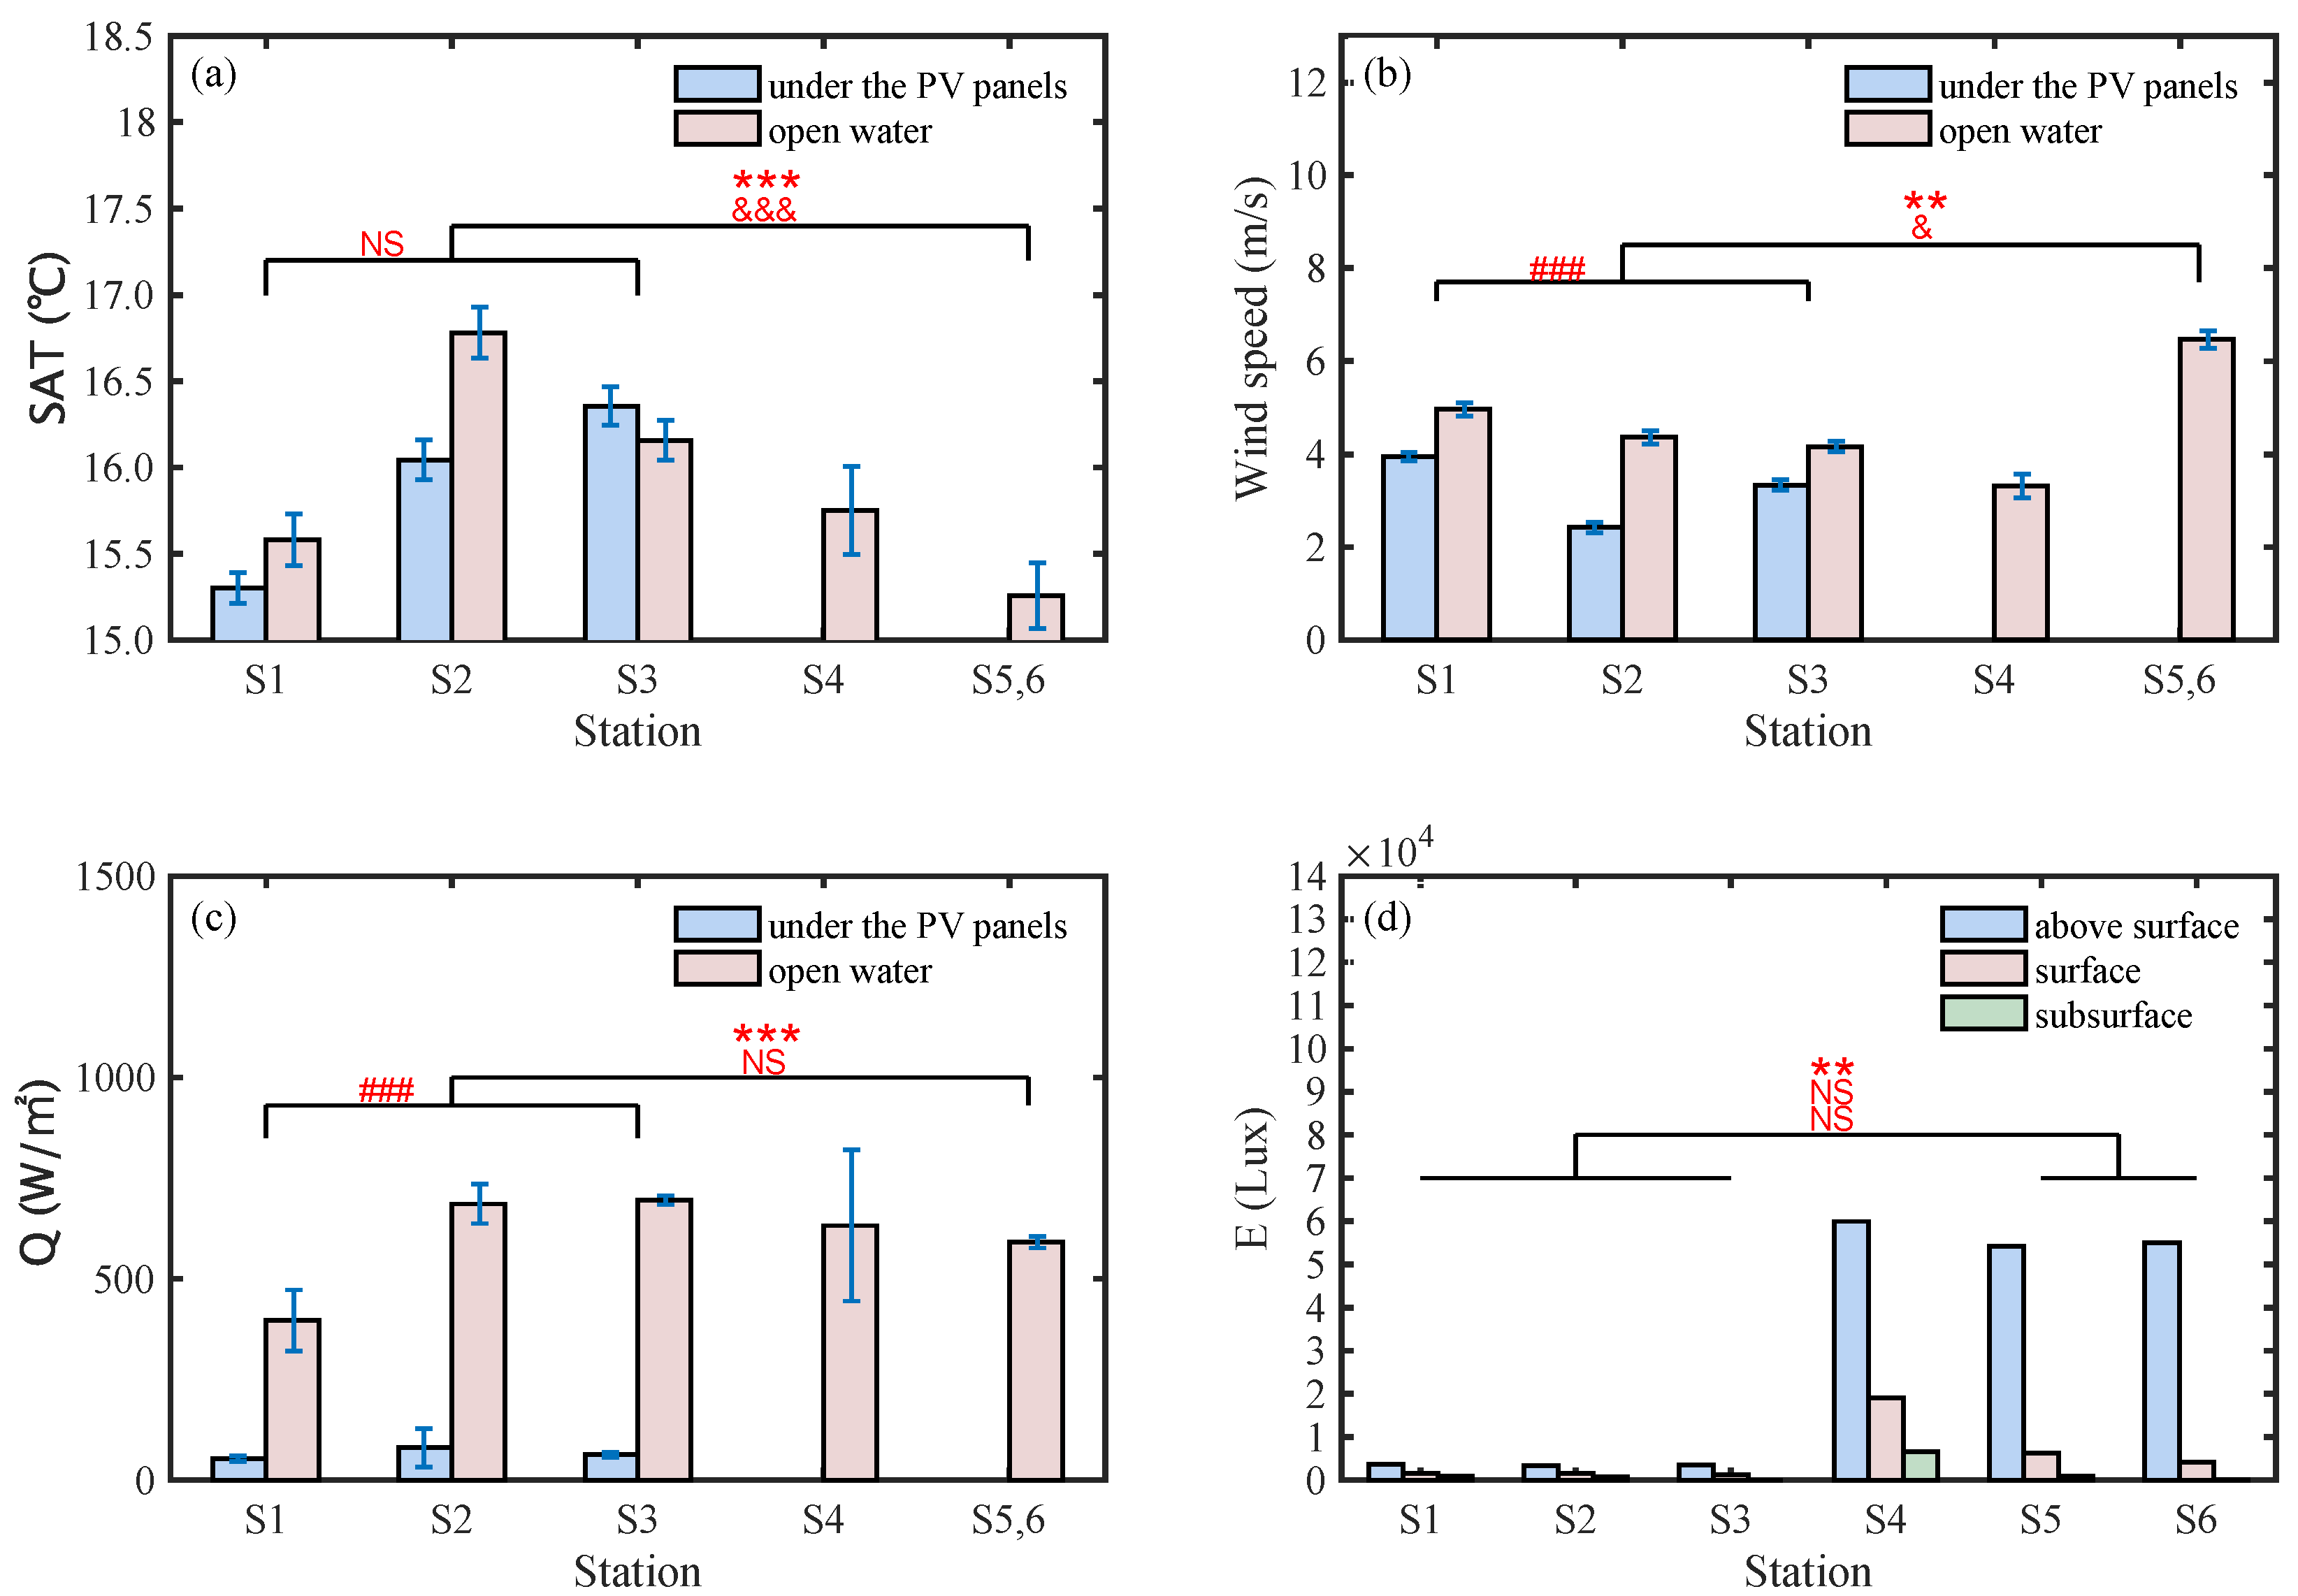
3.1. Near-Surface Meteorology

The distributions of surface air temperature (SAT), wind speed, net total radiation (Q), and light intensity (E) at different stations are shown in Figure 2. The figure shows that the SAT in the PV area is higher compared to the control area, while the wind speed, Q and E are lower in the PV area compared to the control area.
The average SAT of the PV area is higher compared to the control area. The average SAT in the PV area is 15.9 °C, while the average SAT in the control area is 15.3 °C. In addition, the SATs of open water beside S1 and S2 are 0.3 and 0.8 °C higher compared to S1 and S2, respectively, while the SAT of open water beside S3 is 0.2 °C lower compared to S3. In the PV area, the average SAT of the open water is 0.2 °C higher compared to the PV area. Wind speed shows an obvious downward trend under the influence of PV power. The wind speeds at S1, S2, and S3 decrease by 20%, 45%, and 21%, respectively, relative to the wind speed in the open water. Overall, the average wind speed in the PV area decreases by 41% and by 50% in the control area relative to open water. The Q value decreases significantly under the PV panel, and the average Q value under the PV panel decreases by 89% compared with that under open water. The field measurement data show that the longwave and shortwave radiation changed significantly, but the difference in Q is mainly from the change in shortwave radiation. Due to the existence of PV panels, the shortwave radiation under PV is greatly reduced (incoming: 95%; outgoing: 92%), resulting in net shortwave radiation from an average of 717 W/m2 to 26 W/m2. There is a certain increase in longwave radiation under the PV panel, with a 32% increase in incidence and a 6% decrease in outgoing radiation, changing the net longwave radiation from a negative value in the control area (−102 W/m2) to a positive value in the PV area (44 W/m2). The E value decreases significantly under the influence of PV power. The surface E value of the PV area decreases by an average of 93% compared with that of the control area. In addition, the E value of each station decreases with increasing water depth. At the same water depth position, the average surface E of the PV area is still 71% lower compared to the control area. However, the subsurface E value of the PV area increases by 30% on average compared with that of the control area.

3.2. Water Quality

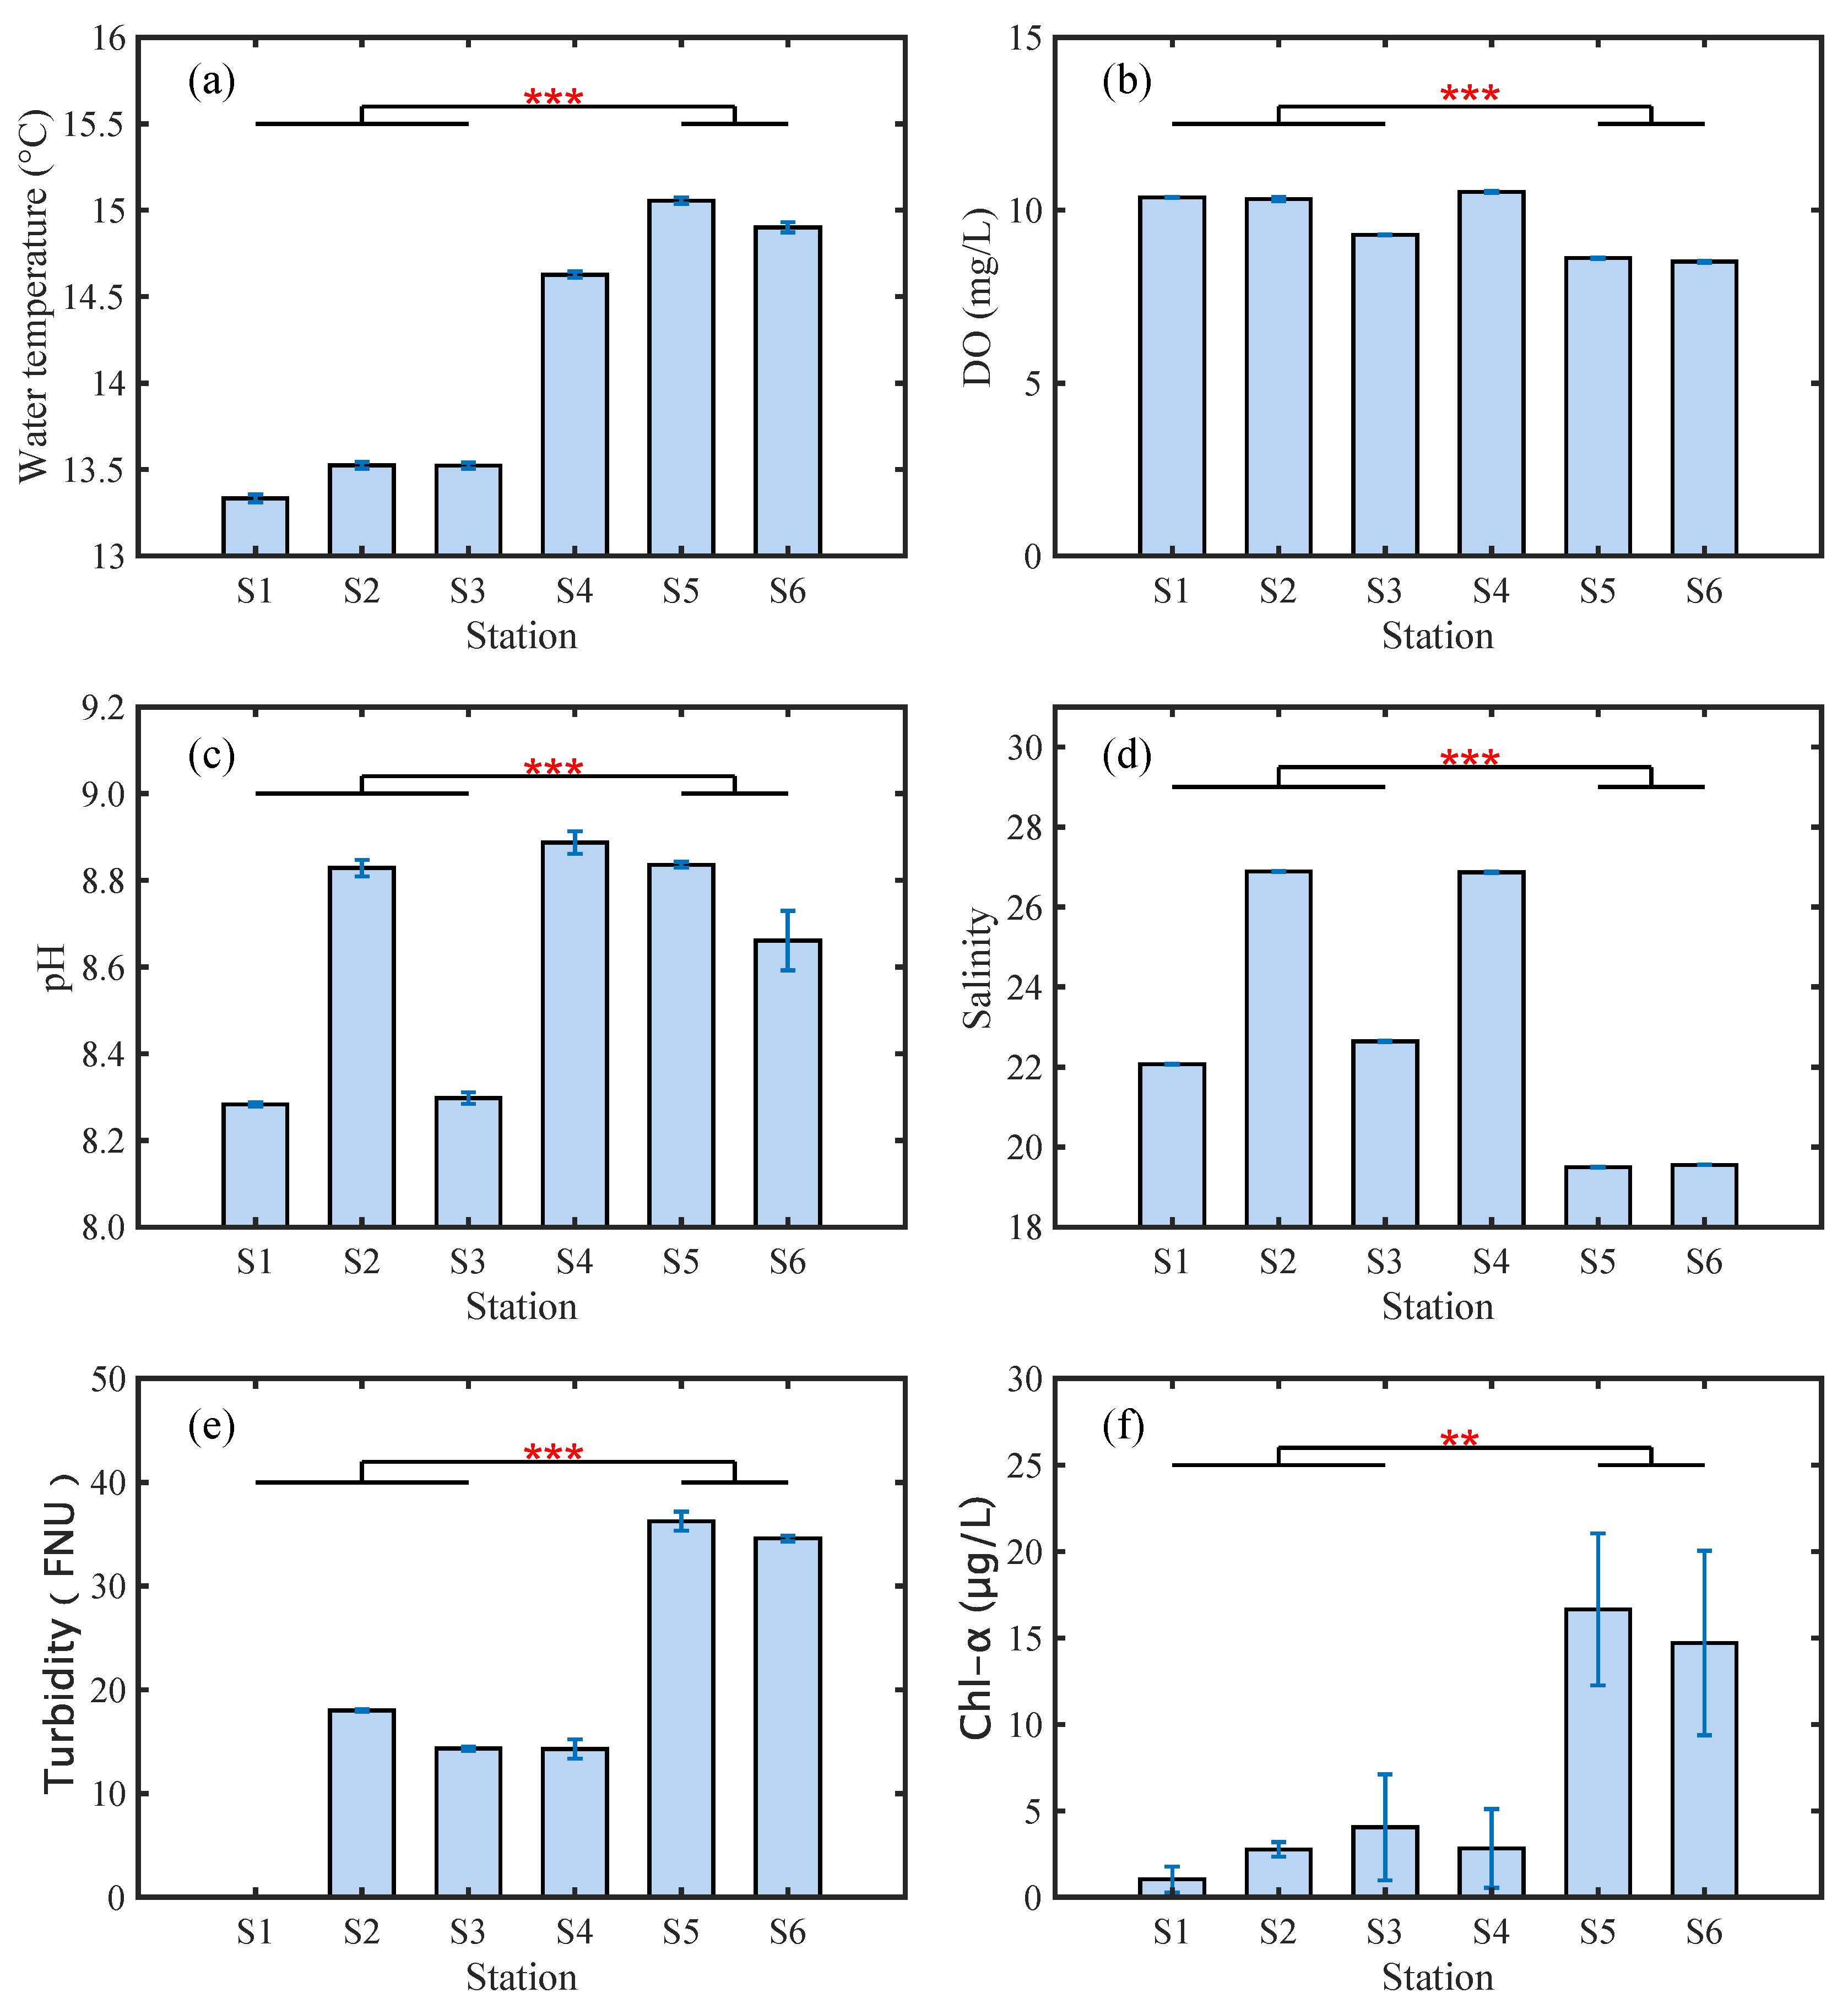
3.2.1. Water Temperature, DO, pH, Salinity, Turbidity, and Chl-α
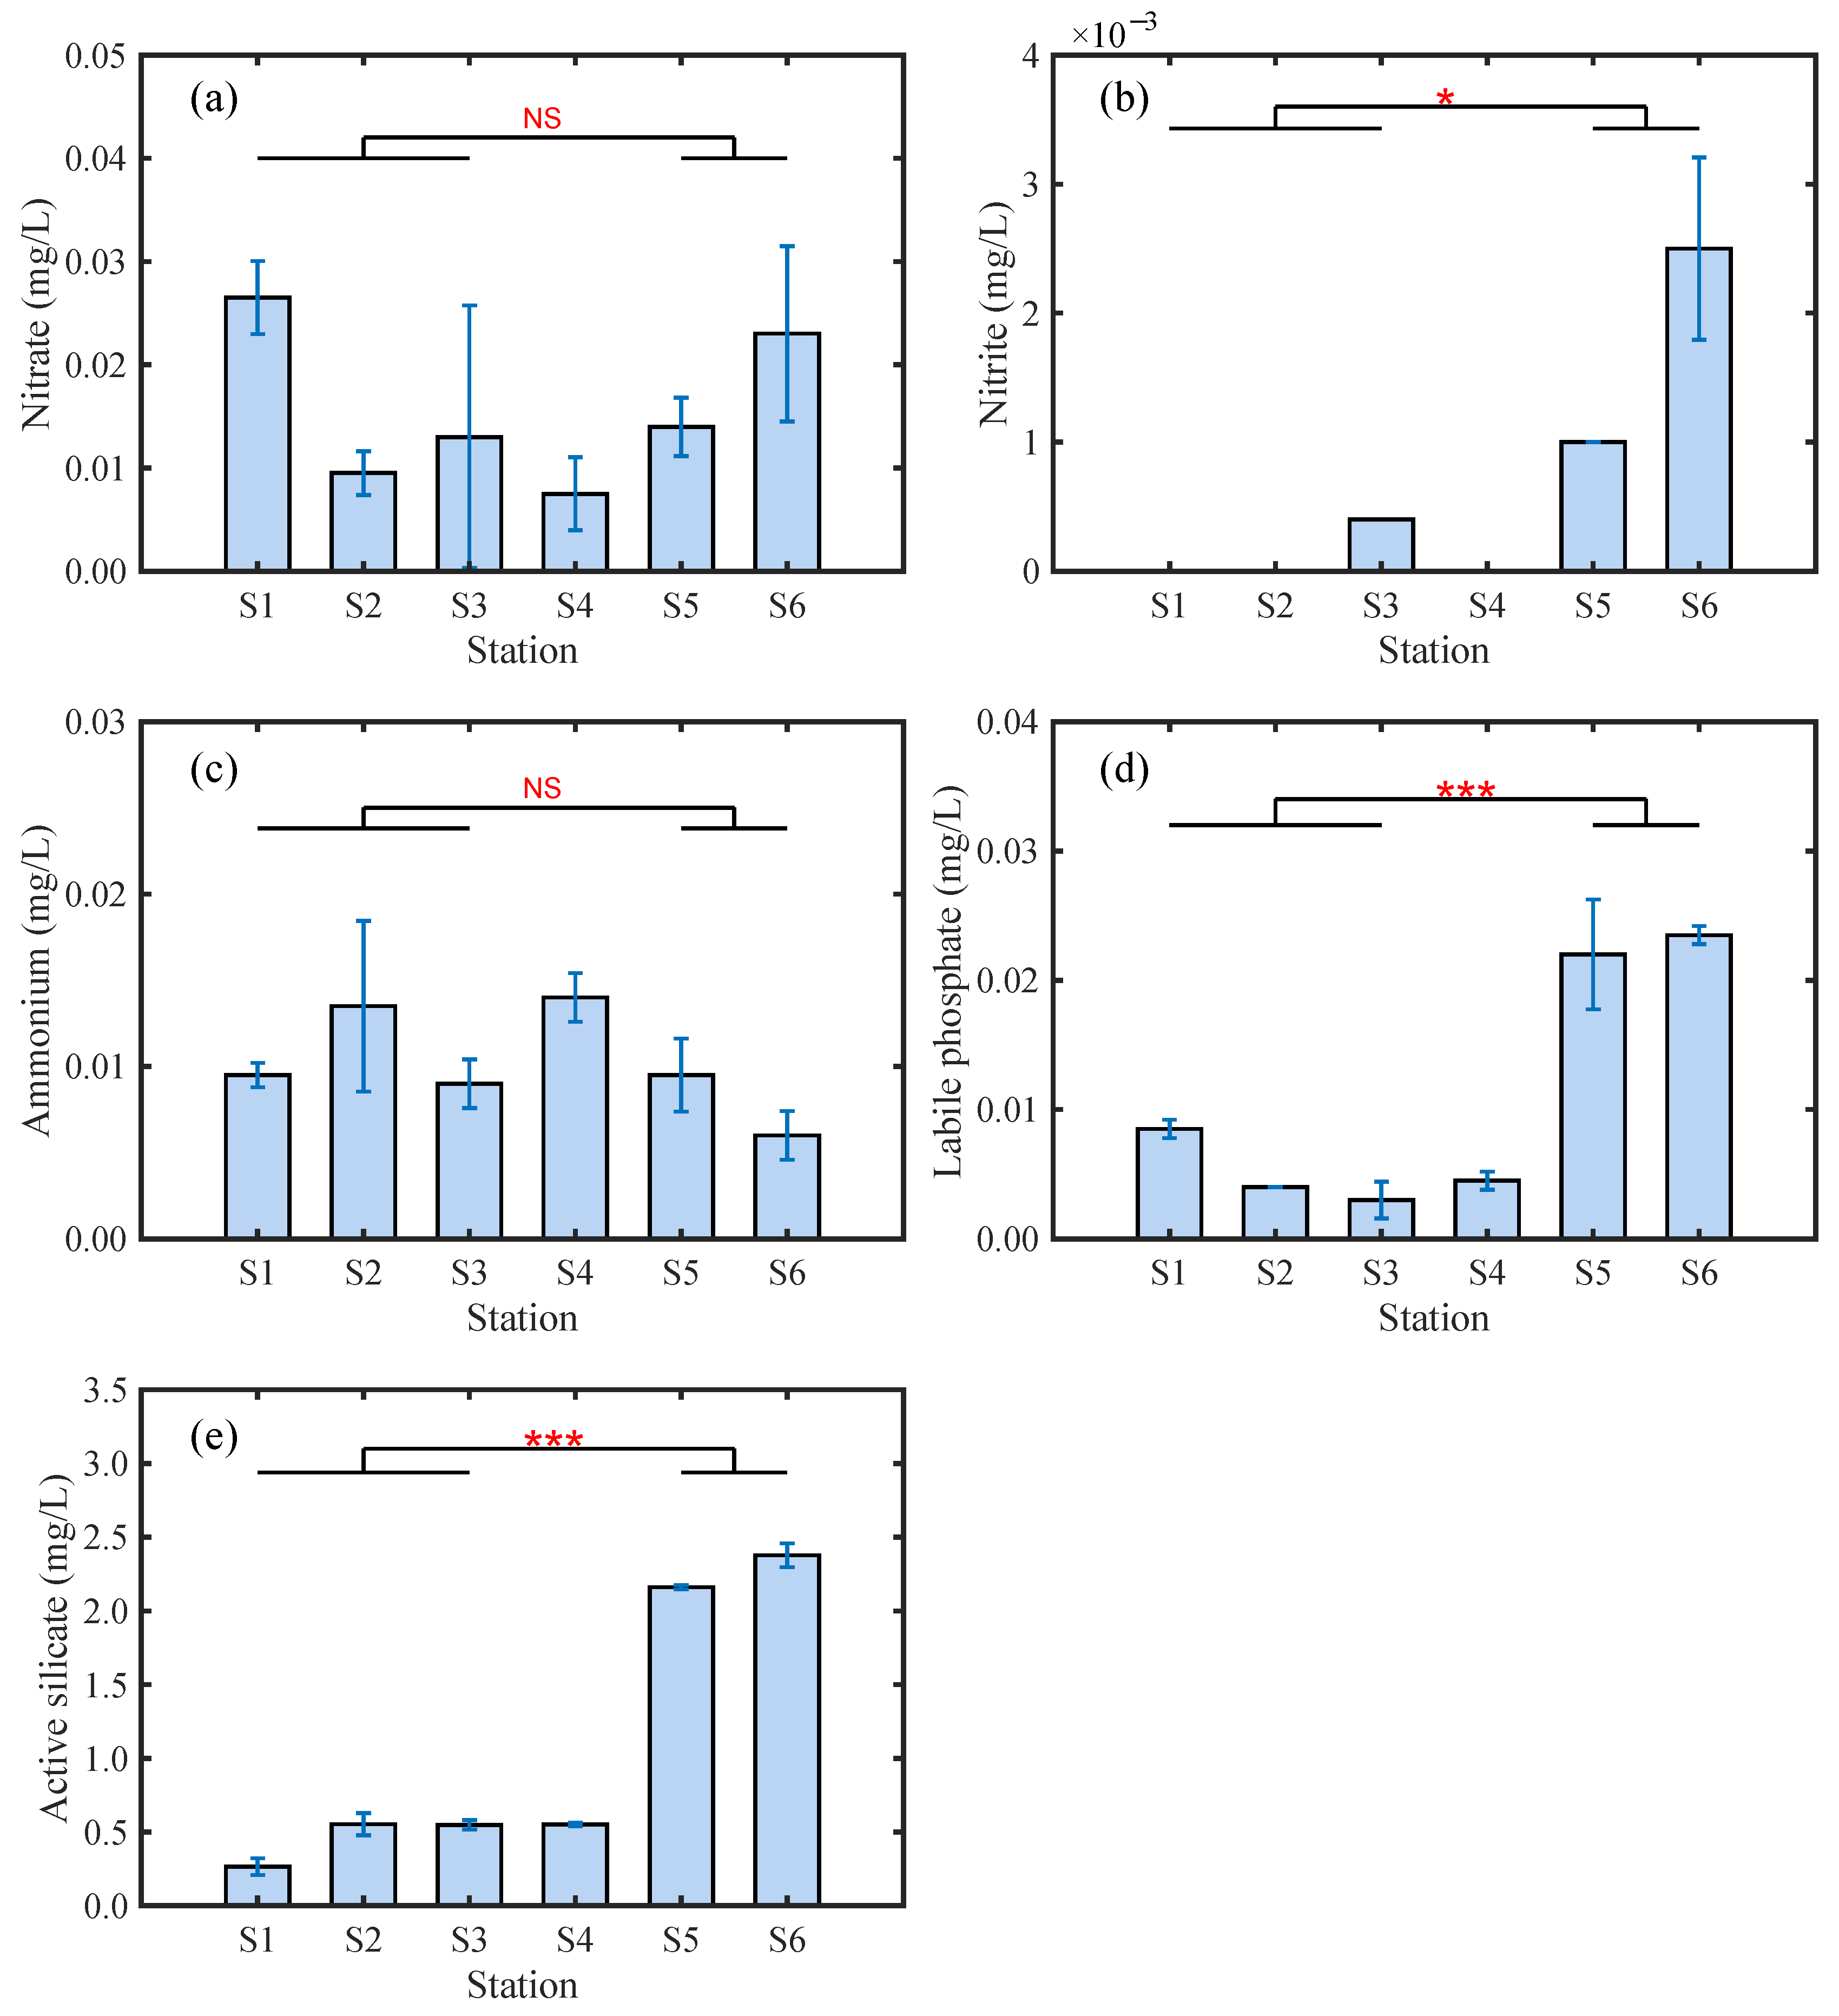
The distributions of water temperature, DO, pH, salinity, turbidity, and Chl-α at the different stations are shown in Figure 3. The water temperature, pH, turbidity, and Chl-α values in the PV area are lower compared to the control area, while the DO and salinity are higher compared to the control area.
The water temperature is lower than the SAT in the range of 13.3~15.1 °C. The average water temperature in the PV area (13.5 °C) is 1.5 °C lower compared to the control area (15.0 °C). In addition, the water temperature of S4 (14.6 °C), which is in the PV area in open water, is 0.4 °C lower compared to the average water temperature of the control area (15.0 °C) and 1.1 °C higher compared to the PV area (13.5 °C). The DO is in the range of 8.5~10.5 mg/L. The average DO in the PV area is 17% higher compared to the control area In addition, the DO at S4 is 0.2 mg/L higher compared to that at S2 in the same pond. The mean pH of the PV area is 0.28 lower compared to the control area, but the pH values of S2 and S4 are 8.83 and 8.89 higher compared to the control area, respectively. The salinity of the PV area is generally higher compared to the control area. The average salinity of the PV area is 23.87, which is 22% higher compared to the control area. The turbidity of the PV area is generally lower compared to the control area, and the average turbidity is reduced by 70% compared to the control area. Compared with the control area, the average Chl-α concentration in the PV area is decreased by 83%. The average Chl-α concentration in the control area is 15.68 μg/L, and for the PV area, it is 2.62 μg/L.

3.2.2. Nutrients

The distributions of nitrate, nitrite, ammonium, labile phosphate, and active silicate at the different stations are shown in Figure 4. The nitrites, labile phosphate, and active silicate in the PV area are lower compared to the control area, while the nitrate and ammonium are not significantly different from those in the control area.
The average concentrations of nitrate and ammonium in the whole study area are 0.016 and 0.01 mg/L, respectively. The minimum nitrate concentration of 0.008 mg/L appears at S4, and the maximum nitrate concentration of 0.027 mg/L appears at S1. The minimum ammonium concentration of 0.006 mg/L occurs at S6, and the maximum concentration of 0.014 mg/L occurs at S2 and S4. The concentration of nitrite is low and undetected in half of the stations, with the highest value of 0.0025 mg/L in the control area. The average concentrations of labile phosphate in the PV area and control area are 0.005 mg/L and 0.023 mg/L, respectively, compared with a 77% decrease in the PV area. The average concentrations of active silicate in the PV area and control area are 0.456 mg/L and 2.269 mg/L, respectively, which are reduced by 80% in the PV area.

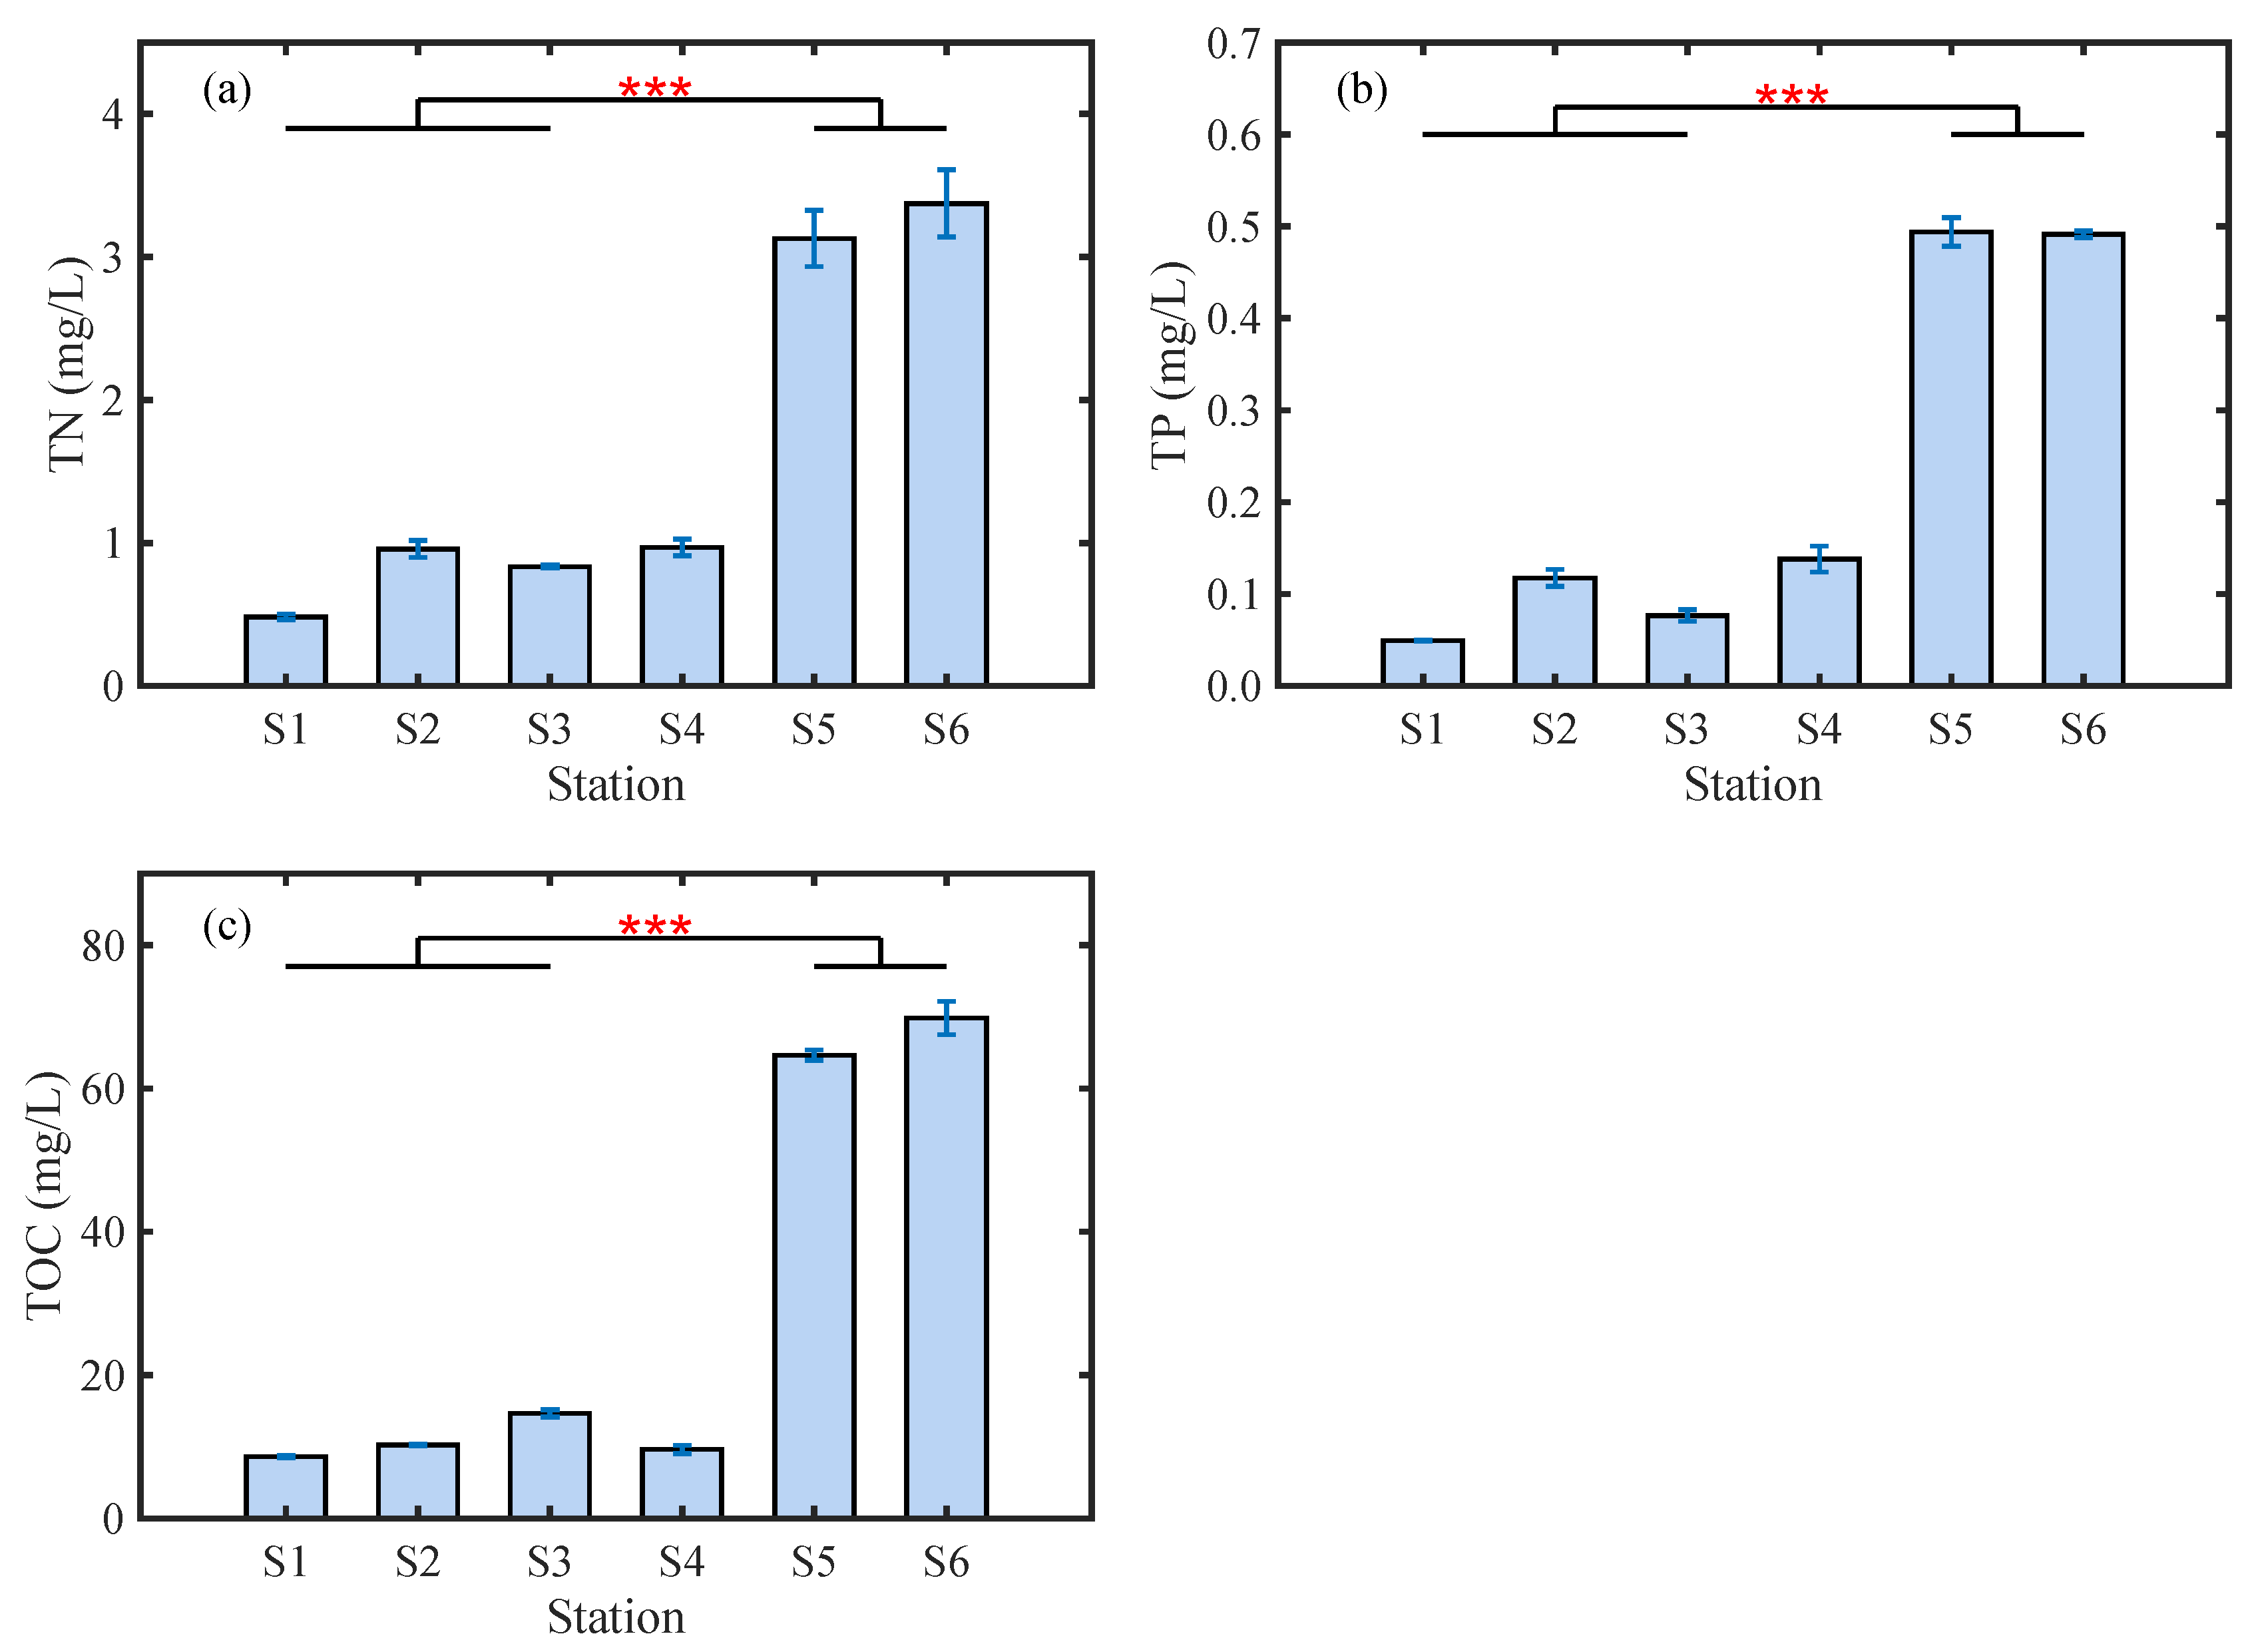
3.2.3. TN, TP, and TOC

The distributions of total nitrogen (TN), total phosphorus (TP), and total organic carbon (TOC) at the different stations are shown in Figure 5. The TN, TP, and TOC values in the PV area are lower than those in the control area.
The concentrations of TN and TP range from 0.483 to 3.375 mg/L and 0.050 to 0.494 mg/L, respectively. The average concentrations of TN and TP in the PV area are 0.759 mg/L and 0.081 mg/L, respectively, decreasing by 77% and 84% compared with the average concentrations of 3.253 mg/L and 0.493 mg/L in the control area. The TOC concentration is high, and the overall concentration ranges from 8.6 to 69.8 mg/L. The average concentration of TOC in the PV area is 11.174 mg/L, which is 83% lower compared to the average concentration of 67.228 mg/L in the control area.

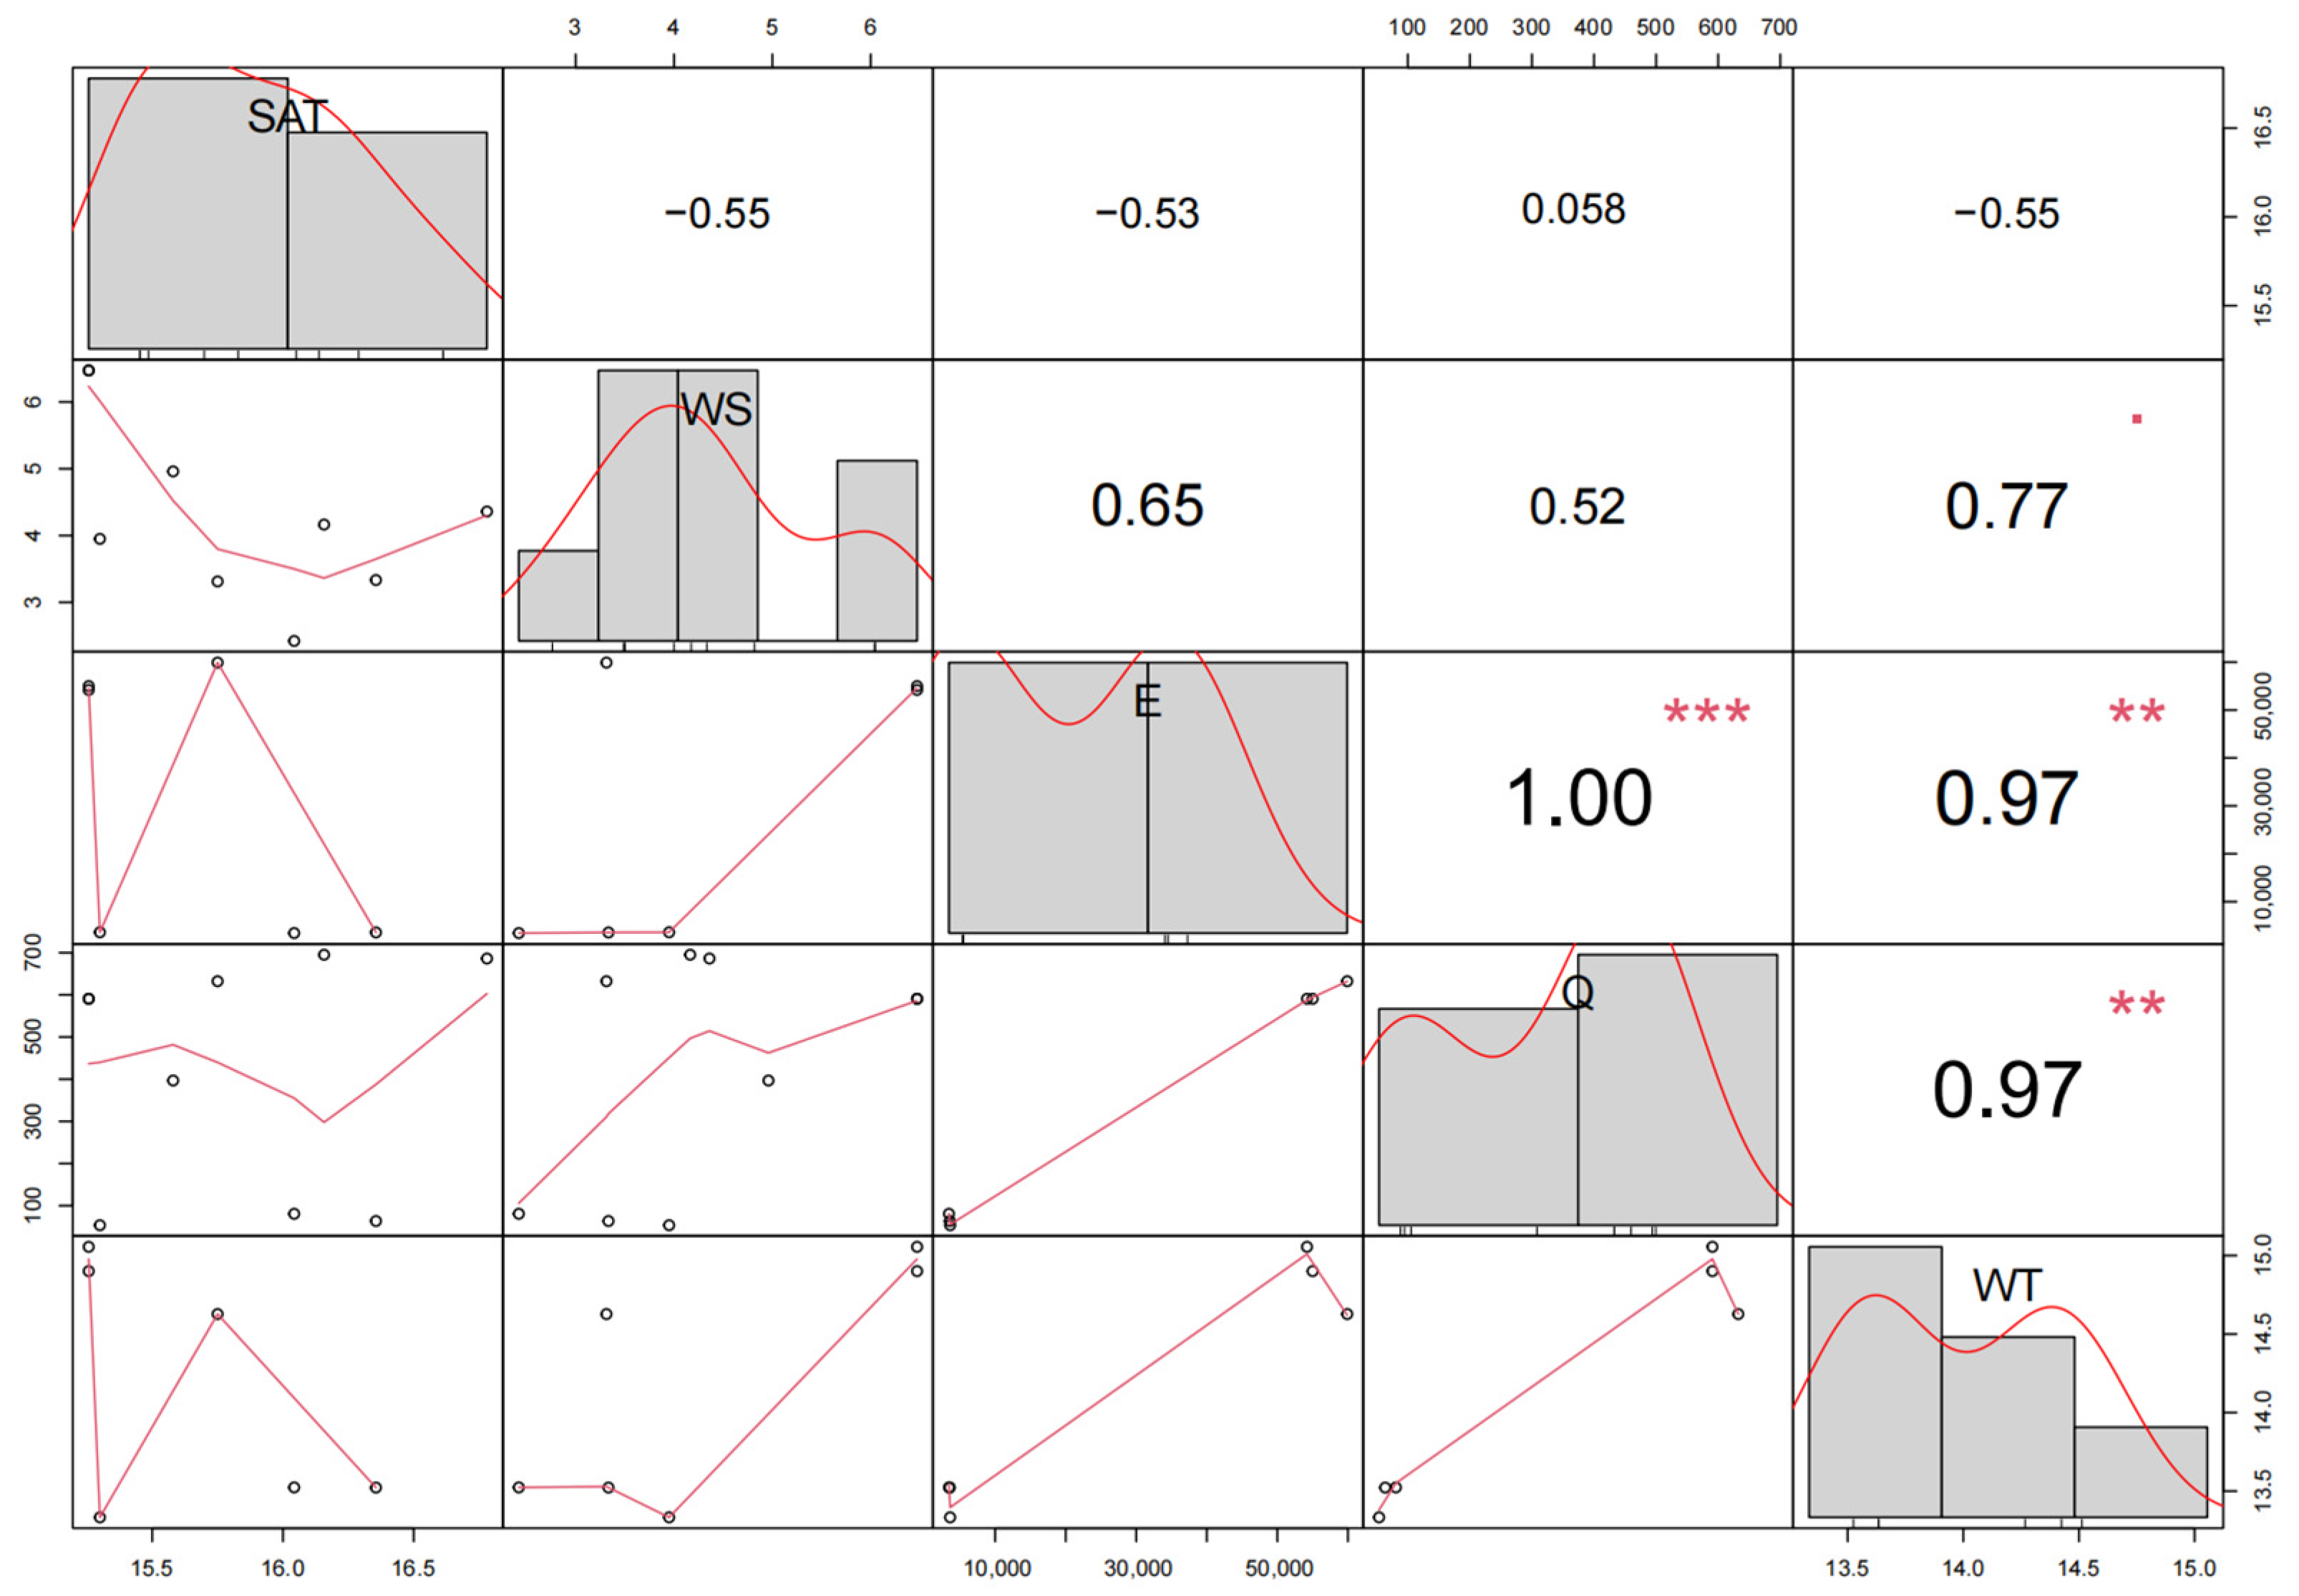
3.3. Correlation between Water Temperature and Near-Surface Meteorological Parameters

The Pearson correlation analysis results of water temperature and near-surface meteorological parameters are shown in Figure 6. As seen from the figure, water temperature is positively correlated with E and Q (p ≤ 0.01). There is no correlation with SAT or wind speed (p > 0.05). In addition, there is a significant positive correlation between E and Q (p ≤ 0.001).

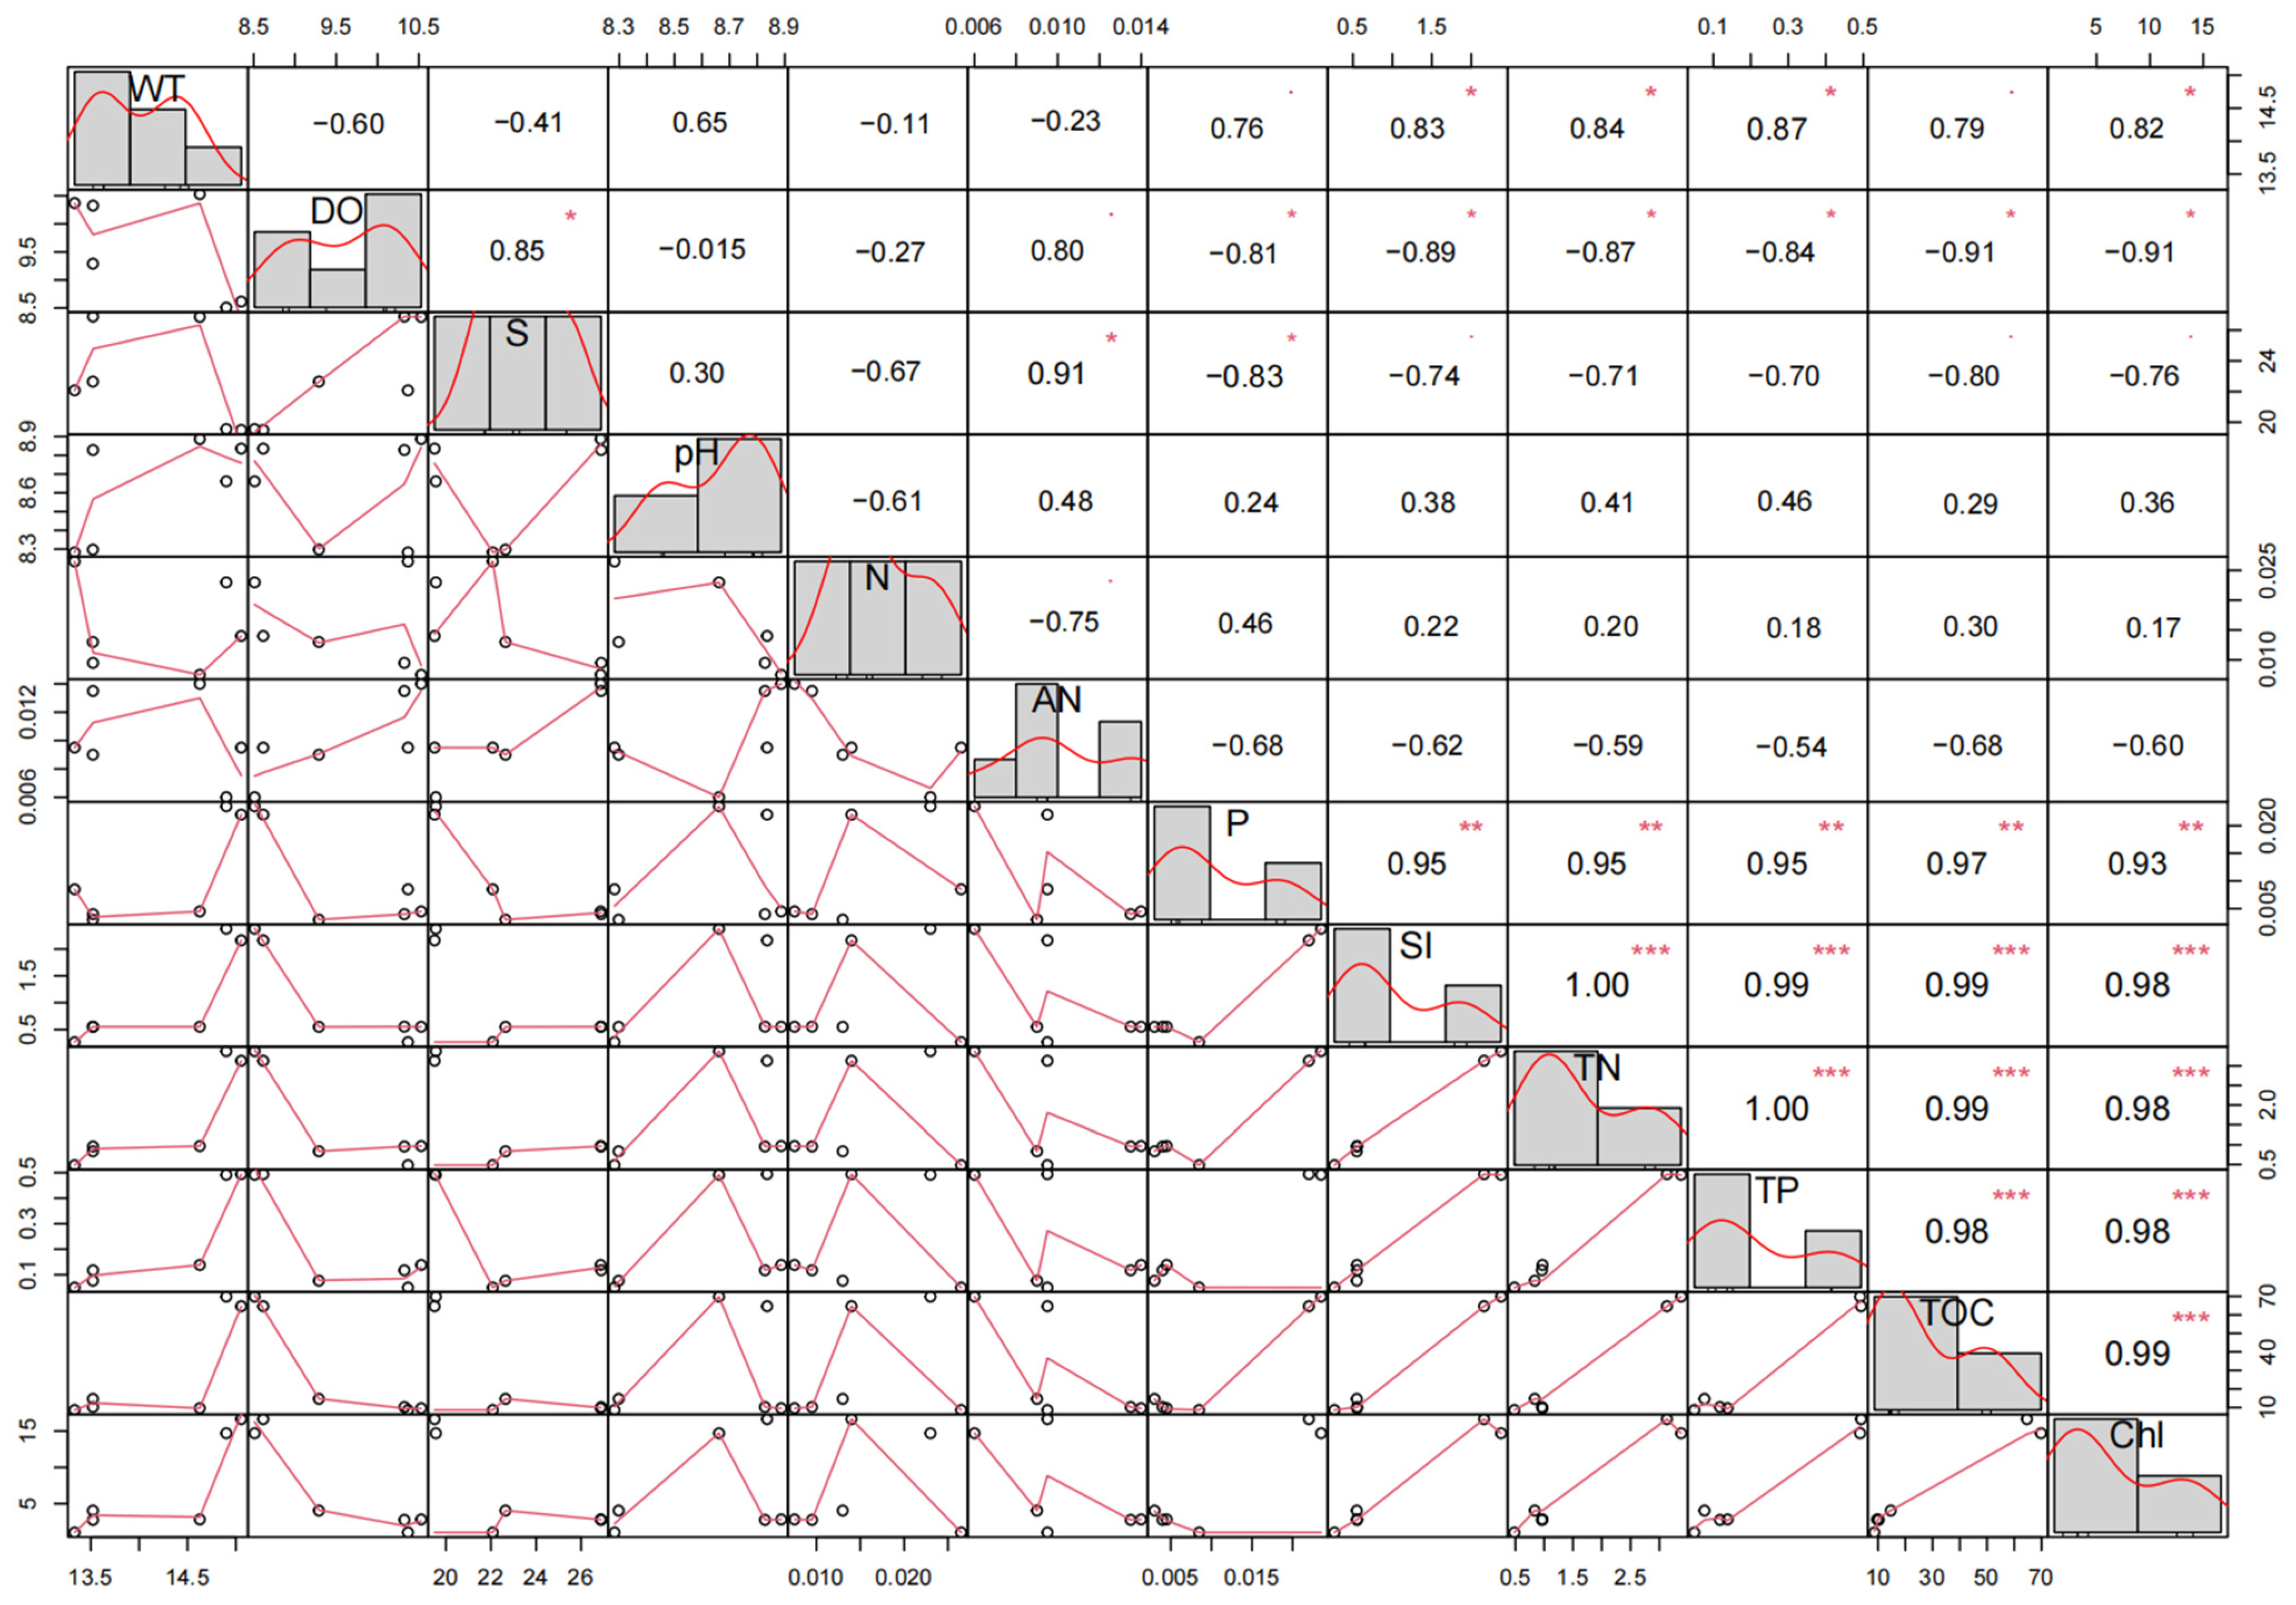
3.4. Correlations between Water Temperature and Water Quality Parameters

The Pearson correlation analysis results of water temperature and water quality parameters are shown in Figure 7. As seen from the figure, there are significant positive correlations between water temperature and Chl-α, active silicate, TN, and TP (p ≤ 0.05). There are no correlations with the other water quality parameters (p > 0.05).

4. Discussion

4.1. Effects of PV on Temperature

The average SAT in the PV area is 0.6 °C higher compared to the control area of the case study, while the average water temperature is 1.5 °C lower compared to the control area. The results in our case study are consistent with those of Li et al. [19]. They monitored air temperature and water temperature simultaneously and showed that the average air temperature at the PV site is 0.16 °C higher compared to that outside the PV site, and the water temperature is almost lower compared to that outside the PV site. What is the underlying cause for this phenomenon?
The coverage of PV power decreases the shortwave radiation within the PV area, which is conducive to a decrease in water and air temperature [20]. On the other hand, it should be noted that the PV panels emit long-wave radiation, thereby contributing to the heating of the surrounding atmosphere [19,21]. The average net shortwave radiation in the PV area (26 W/m2) decreased by 96% compared with that in the control area (717 W/m2) of the case study, while the net longwave radiation increased from −102 W/m2 in the control area to 44 W/m2. Because the reduction in shortwave radiation is much greater than the increase in longwave radiation, the Q in the PV area drops by 91%. There is a significant positive correlation between water temperature and Q (p ≤ 0.01) (Figure 6). In this regard, the decrease in water temperature in the PV area may be mainly caused by the reduction in shortwave radiation, which is consistent with the results of the reservoir PV simulation experiment by Ji et al. [22]. In addition, the increase in SAT mainly comes from the heating of PV panels.
However, the results by Yang et al. are not exactly consistent with our study. Yang et al. demonstrated that both air and water temperatures under PV panels are always higher than those in open water under the heating effect of PV panels with a peak temperature of 50 °C [21]. This phenomenon may be caused by different types of PV installations. The PV installation is fixed on a pile foundation of our case study, while it is floating in the their study [21]. The main difference between the two installations is the distance from the PV panels to the surface, which is connected to the wind speed below the PV panel. In our case study, the distances from the PV panel to the surface are 3.02 m, 2.35 m, and 2.50 m at S1, S2, and S3 corresponding to measured wind speeds of 4.0 m/s, 3.3 m/s, and 2.4 m/s, respectively. However, the distance from the floating PV installation to the surface is very small (0.15 m [21]), corresponding to a low wind speed (approximately 0 m/s) below it [22]. Evaporation is an important method of heat flux transfer at the air–water interface, and the change in wind speed affects the water temperature by influencing evaporation [21]. The water temperature probably increases when the drop in wind speed is much greater than the drop in solar radiation [23]. From the perspective of energy analysis, PV changes the energy balance of the water surface. In the study of Yang et al., the shortwave radiation energy in open water is balanced by sensible heat flux, latent heat flux, and longwave radiation. Since the wind speed under PV is 0 m/s and longwave radiation changes from negative to positive, longwave radiation is balanced by sensible heat flux [21]. Although the wind speed in this study is reduced by PV, the decrease does not exceed that of solar radiation, and the sensible heat flux and longwave radiation in the PV area are balanced by the latent heat flux.
In recent years, global climate change has had an impact on aquaculture, posing a threat to the security of fishery resources. For instance, the rising water temperature caused by global warming may exacerbate the incidence of red tides and severely affect fish production [24]. Therefore, it is necessary to take measures to mitigate the effects of climate change. In our research, we found that PV significantly reduces water temperature. Thus, adopting fishery complementary PV can alleviate water warming, which would be beneficial for aquaculture.

4.2. Effects of PV on Water Quality

The DO and salinity in the PV area are higher compared to the control area of the case study, while the pH, Chl-α, and some nutrients in the PV area are lower. In addition, the concentrations of nitrate and ammonium in the PV area are not significantly different from those in the control area.
Li et al. conducted a PV simulation experiment in a pond with a sunshade net and found that when there is PV coverage, DO increases, which is consistent with our results [25]. It is worth noting that when PV coverage is in the range of 0~50%, the DO increases with increasing PV coverage; when PV coverage is greater than 50%, the DO decreases with increasing PV coverage [25]. It is well known that DO is mainly related to the photosynthesis of phytoplankton, the respiration of organisms, and the temperature of the water. In our study, the respiration of organisms is weak at low temperatures (13.3~15.1 °C). In addition, the intensity of phytoplankton photosynthesis is weak due to the low E value below PV. Therefore, it is likely that the high DO concentration in the PV area of the case study is mainly caused by low water temperatures.
For shallow aquatic ecosystems, nutrient and light competition between phytoplankton and benthic algae can affect turbidity. Mei et al. found that elevated temperature promotes the growth of phytoplankton but inhibits that of benthic algae, resulting in an increase in the number of total suspended solids and a significant decrease in the light intensity of the sediment surface [26]. PV coverage is conducive to the increase in subsurface E of the case study, but PV coverage reduces the light incident on the water body; thus, the final E of the water body depends on the relative effect of the above two factors. The turbidity of the PV area is 70% lower compared to the control area of the case study. The E of the above surface and surface in the PV area is lower compared to the control area of the case study by 51,050 and 3745 lux, respectively, while the E of the subsurface in the PV area is 140 lux higher compared to the control area. This finding shows that close to the bottom, the influence of turbidity on E is relatively great. Therefore, the low turbidity in the PV area is conducive to the acquisition and utilization of light by organisms in the water body and, to a certain extent, the adverse impact of reduced E on primary production [27], further reducing the impact of phytoplankton photosynthesis on DO.
The concentration of Chl-α in the PV area is significantly lower compared to the control area of the case study, which is consistent with the conclusions of existing studies. For example, in the modelling study of Yang et al., under 30% PV coverage, the concentration of Chl-α decreased by 30% [28]. Hass et al. conducted a detailed modelling experiment on Chl-α with 0–100% PV coverage (increasing by 10%) and found that the concentration of Chl-α decreases with increasing coverage. When the coverage reaches 20~30%, the concentration of Chl-α decreases significantly, and when the coverage exceeds 70%, the concentration of Chl-α decreases significantly. The concentration of Chl-α is below the threshold of 0.4 μg/L in oligotrophic lakes [29]. Although PV coverage reaches 80%, the lowest Chl-α concentration is still greater than 1 μg/L of the case study. This phenomenon may occur because our study area is a closed water body with low flow rates. However, turbines are deployed in the research area of Hass et al., which can maintain a relatively high flow rate and strong mixing of water bodies [29]. Exley et al. conducted PV simulation experiments under three flow rate scenarios at high, middle, and low levels and found that the concentration of Chl-α decreases exponentially with increasing PV coverage at high and middle flow rates, and the concentration of Chl-α with only 60% coverage drops below 1 μg/L at high flow rates. However, reducing the low flow rate to the same Chl-α concentration requires at least 90% coverage [30]. This finding further indicates that a high flow rate can enhance the effect of PV on Chl-α concentration reduction.
In the study of Li et al., pH decreases with increasing PV coverage, but the decrease is very small. Compared with the control area, the pH decreases by only 0.2 units under 100% coverage [25]. The average pH of the PV area is reduced by only 0.28 units compared to the control area. The pH of the water body is affected by the difference in photosynthesis and respiration intensity. Both photosynthesis and respiration in the PV area are weakened due to the decrease in E and water temperature, and the decrease in pH indicates that the effects of PV on respiration may be higher than those on photosynthesis. Experiments on the effects of evaporation are popular topics in recent water-based PV research. PV reduces solar radiation and wind speed, reducing evaporation in water bodies to varying degrees [31,32,33]. From the perspective of evaporation, the salinity of the PV area should be lower compared to the control area, but the salinity of the PV area of the case study is significantly higher compared to the control area, and the specific reasons remain to be studied.
In the modelling analysis of the impact of the floating PV installation on water quality, compared with the control area, nitrate in the PV area decreases and ammonium increases, but the magnitude is small (0.16% and 0.4% in summer; 0.05% and 0.24% in winter) [34]. In the PV simulation experiment of the sunshade grid, the concentrations of ammonium and active phosphorus in water with a 75% coverage rate decrease by 43.1% and 24.9%, respectively, and the concentration of nitrite increases by 45.5% [25]. This finding shows that inorganic nutrients vary greatly in different types of PV power or under different scenarios. According to the results of the t-test, there are no significant differences between the concentrations of nitrate and ammonium in the PV area and the control area in our study. The nitrite concentration is extremely low in the PV area, and the highest value in the control area is only 0.0025 mg/L, which may be influenced by the high DO concentration in the water body in the study area; a high DO concentration can promote the production of nitrate. The concentrations of labile phosphate, active silicate, TN, and TP in the PV area are lower compared to the control area of the case study. This finding is consistent with the research results of Li et al. [25]. Labile phosphate is more easily adsorbed under aerobic conditions [35]. The DO in the PV area is significantly higher compared to the control area of the case study, which may be one of the reasons for the concentration of labile phosphate in the PV area being lower compared to the control area. Temperature affects the labile phosphate concentration. The rising water temperature accelerates the degradation of sediment humus by microorganisms, and organic matter is released into the water layer in the form of phosphate [36]. The temperature of the PV area is reduced, and the labile phosphate concentration is reduced. In addition, rainwater erosion enhances phosphorus release from sediments [37]. PV power may reduce the concentration of labile phosphate in the PV area by attenuating the scouring effect. Some studies have shown that the species composition of phytoplankton in the water in PV areas changes. For example, Exley et al. found through modelling that under the scenario of a low flow rate and high coverage rate (90%), diatoms occupy a dominant position in the phytoplankton community most of the time, while under the scenario of a low coverage rate (30%), green algae are dominant [30]. This study area exhibits a low flow rate and high PV coverage. The decline in active silicate concentration within the PV area can potentially be attributed to the rise in diatoms and other groups. Despite a significant decrease in Chl-α concentration within the PV area, the increased proportion of diatoms may still be the primary factor contributing to the decline in active silicate concentration. Furthermore, the Pearson correlation analysis revealed a noteworthy positive correlation between water temperature and active silicate. The potential influence of water temperature on active silicate through its impact on diatoms necessitates further investigation to elucidate the specific underlying mechanism.
The overall concentrations of TN, TP, and TOC area are high in the case study, especially TOC. This finding indicates that the inorganic process of the water body is relatively slow, which is consistent with the characteristics of slow biological activity in winter. In addition, the TN, TP, and TOC in the PV area are significantly lower compared to the control area. In the modelling study of Yang et al., when the PV coverage rate is 30%, the TOC concentration of the reservoir decreases by 15% compared with the control area [28]. The relatively low TN, TP, and TOC values in the PV area may be related to the relatively low primary production and slow accumulation of organic matter. According to Pearson correlation analysis, there is a significant positive correlation between water temperature and TP, indicating that a decrease in water temperature can lead to a decrease in TP.
Previous studies have demonstrated that the coverage of PV panels could influence the production of fish and crabs. The installation of PV panels may have a negative impact on milkfish (Chanos chanos) production and a positive impact on Chinese Mitten Crab (Eriocheir sinensis) production [13,38]. Further investigations will be focused on the yield and size of mud crab in the study area.

5. Conclusions

Based on the measurement and sampling analyses of near-surface meteorology and water quality parameters in PV areas and control areas, we studied the influence of a fishery complementary PV power plant on the water quality of coastal aquaculture ponds. The conclusion that can be drawn from this study is that PV power inhibits most of the solar radiation received by the surface and weakens the wind speed to a certain extent. As a result, water quality is significantly affected, whereby the water temperature, pH, Chl-α, turbidity, nitrite, labile phosphate, active silicate, TN, TP, and TOC in the PV area are lower and DO and salinity are higher compared to the control area. In conclusion, the coverage of PV power could influence the water quality and subsequently have an impact on the aquaculture. In particular, shading and cooling provide advantageous conditions for shade-loving species. In the future, long-term monitoring should be conducted to further clarify the relationship between the change in the water quality parameters and aquaculture production.

Author Contributions

Conceptualization, L.M.; methodology, F.S., L.M. and Z.L.; software, F.S.; validation, Z.G. and Z.L.; formal analysis, L.M. and Y.W.; investigation, F.S., Z.G. and Y.W.; resources, Z.L.; data curation, L.M.; writing—original draft preparation, F.S.; writing—review and editing, F.S., L.M. and Z.L.; visualization, F.S. and Z.G.; supervision, L.M.; project administration, L.M.; funding acquisition, Z.L. All authors have read and agreed to the published version of the manuscript.

Funding

This research was funded by the Natural Science Foundation of Fujian Province, China, grant number 2020J01667.

Data Availability Statement

The data presented in this study are available on request from the corresponding author.

Acknowledgments

We would like to thank the reviewers for their time spent on reviewing our manuscript and their comments which helped us to improve the article.

Conflicts of Interest

The authors declare no conflicts of interest.

References

  1. Gorjian, S.; Sharon, H.; Ebadi, H.; Kant, K.; Scavo, F.B.; Tina, G.M. Recent technical advancements, economics and environmental impacts of floating photovoltaic solar energy conversion systems. J. Clean. Prod. 2021, 278, 124285. [Google Scholar] [CrossRef]
  2. Ren21. Renewables 2023 Global Status Report. Available online: https://www.ren21.net/gsr-2023/ (accessed on 16 October 2023).
  3. Snapshot of Global PV Markets 2023. Available online: https://iea-pvps.org/wp-content/uploads/2023/04/IEA_PVPS_Snapshot_2023.pdf (accessed on 16 October 2023).
  4. National Development and Reform Commission. China’s 14th Five-Year Plan for Renewable Energy Development. Available online: https://www.ndrc.gov.cn/xwdt/tzgg/202206/P020220602315650388122.pdf (accessed on 16 October 2023).
  5. Geng, S.; Lin, L.; Zhang, L.; Liu, X.; Huang, Z. Site selection framework of fishing photovoltaic hybrid project under interval-valued intuitionistic fuzzy environment. J. Clean. Prod. 2020, 252, 119774. [Google Scholar] [CrossRef]
  6. Golroodbari, S.Z.; van Sark, W. Simulation of performance differences between offshore and land-based photovoltaic systems. Prog. Photovolt. 2020, 28, 873–886. [Google Scholar] [CrossRef]
  7. SERIS. Where Sun Meets Water: Floating Solar Market Report. Available online: https://openknowledge.worldbank.org/handle/10986/31880 (accessed on 16 October 2023).
  8. Ma, C.; Liu, Z. Water-surface photovoltaics: Performance, utilization, and interactions with water eco-environment. Renew. Sustain. Energy Rev. 2022, 167, 15. [Google Scholar] [CrossRef]
  9. Vo, T.T.E.; Ko, H.; Huh, J.H.; Park, N. Overview of Solar Energy for Aquaculture: The Potential and Future Trends. Energies 2021, 14, 20. [Google Scholar] [CrossRef]
  10. Bostock, J.; McAndrew, B.; Richards, R.; Jauncey, K.; Telfer, T.; Lorenzen, K.; Little, D.; Ross, L.; Handisyde, N.; Gatward, I.; et al. Aquaculture: Global status and trends. Philos. Trans. R. Soc. B-Biol. Sci. 2010, 365, 2897–2912. [Google Scholar] [CrossRef] [PubMed]
  11. Liu, D.; Li, C.B.; Sun, M.; Zeng, W. Assessment model of economic and environmental synergies for water surface photovoltaic projects based on spectral analysis. Renew. Energy 2020, 145, 937–950. [Google Scholar] [CrossRef]
  12. Pringle, A.M.; Handler, R.M.; Pearce, J.M. Aquavoltaics: Synergies for dual use of water area for solar photovoltaic electricity generation and aquaculture. Renew. Sustain. Energy Rev. 2017, 80, 572–584. [Google Scholar] [CrossRef]
  13. Chateau, P.A.; Wunderlich, R.F.; Wang, T.W.; Lai, H.T.; Chen, C.C.; Chang, F.J. Mathematical modeling suggests high potential for the deployment of floating photovoltaic on fish ponds. Sci. Total Environ. 2019, 687, 654–666. [Google Scholar] [CrossRef]
  14. Zhang, D.M.; Xiong, Q.; Csepdi, C. Designing Probing of Connection Type Between the Stand and Foundation in the Photovoltaic Power Station Constructed Above the Water. Appl. Energy Technol. 2017, 7, 12–14. [Google Scholar] [CrossRef]
  15. Xia, Z.L.; Li, Y.J.; Guo, X.N.; Chen, R.S. High-resolution mapping of water photovoltaic development in China through satellite imagery. Int. J. Appl. Earth Obs. Geoinf. 2022, 107, 11. [Google Scholar] [CrossRef]
  16. Wang, T.W. Effects of floating photovoltaic systems on water quality of aquaculture ponds. Aquac. Res. 2022, 53, 1304–1315. [Google Scholar] [CrossRef]
  17. GB/T 12763-2007; Specifications for Oceanographic Survey. Standards Press of China: Beijing, China, 2007.
  18. GB 17378.4-2007; The Specification for Marine Monitoring. Standards Press of China: Beijing, China, 2007.
  19. Li, P.D.; Gao, X.Q.; Li, Z.C.; Zhou, X.Y. Physical analysis of the environmental impacts of fishery complementary photovoltaic power plant. Environ. Sci. Pollut. Res. 2022, 29, 46108–46117. [Google Scholar] [CrossRef] [PubMed]
  20. Armstrong, A.; Page, T.; Thackeray, S.J.; Hernandez, R.R.; Jones, I.D. Integrating environmental understanding into freshwater floatovoltaic deployment using an effects hierarchy and decision trees. Environ. Res. Lett. 2020, 15, 114055. [Google Scholar] [CrossRef]
  21. Yang, P.; Chua, L.H.C.; Irvine, K.N.; Imberger, J. Radiation and energy budget dynamics associated with a floating photovoltaic system. Water Res. 2021, 206, 117745. [Google Scholar] [CrossRef] [PubMed]
  22. Ji, Q.; Li, K.; Wang, Y.; Feng, J.; Li, R.; Liang, R. Effect of floating photovoltaic system on water temperature of deep reservoir and assessment of its potential benefits, a case on Xiangjiaba Reservoir with hydropower station. Renew. Energy 2022, 195, 946–956. [Google Scholar] [CrossRef]
  23. Exley, G.; Armstrong, A.; Page, T.; Jones, I.D. Floating photovoltaics could mitigate climate change impacts on water body temperature and stratification. Sol. Energy 2021, 219, 24–33. [Google Scholar] [CrossRef]
  24. Ahmed, N.; Thompson, S.; Glaser, M. Global Aquaculture Productivity, Environmental Sustainability, and Climate Change Adaptability. Environ. Manag. 2019, 63, 159–172. [Google Scholar] [CrossRef]
  25. Li, P.; Gao, X.; Jiang, J.; Yang, L.; Li, Y. Characteristic Analysis of Water Quality Variation and Fish Impact Study of Fish-Lighting Complementary Photovoltaic Power Station. Energies 2020, 13, 4822. [Google Scholar] [CrossRef]
  26. Mei, X.; Gao, S.; Liu, Y.; Hu, J.; Razlustkij, V.; Rudstam, L.G.; Jeppesen, E.; Liu, Z.; Zhang, X. Effects of Elevated Temperature on Resources Competition of Nutrient and Light Between Benthic and Planktonic Algae. Front. Environ. Sci. 2022, 10, 908088. [Google Scholar] [CrossRef]
  27. Karpouzoglou, T.; Vlaswinkel, B.; van der Molen, J. Effects of large-scale floating (solar photovoltaic) platforms on hydrodynamics and primary production in a coastal sea from a water column model. Ocean Sci. 2020, 16, 195–208. [Google Scholar] [CrossRef]
  28. Yang, P.; Chua, L.H.C.; Irvine, K.N.; Nguyen, M.T.; Low, E.W. Impacts of a floating photovoltaic system on temperature and water quality in a shallow tropical reservoir. Limnology 2022, 23, 441–454. [Google Scholar] [CrossRef]
  29. Haas, J.; Khalighi, J.; de la Fuente, A.; Gerbersdorf, S.U.; Nowak, W.; Chen, P.J. Floating photovoltaic plants: Ecological impacts versus hydropower operation flexibility. Energy Convers. Manag. 2020, 206, 112414. [Google Scholar] [CrossRef]
  30. Exley, G.; Page, T.; Thackeray, S.J.; Folkard, A.M.; Couture, R.M.; Hernandez, R.R.; Cagle, A.E.; Salk, K.R.; Clous, L.; Whittaker, P.; et al. Floating solar panels on reservoirs impact phytoplankton populations: A modelling experiment. J. Environ. Manag. 2022, 324, 116410. [Google Scholar] [CrossRef]
  31. Taboada, M.E.; Cáceres, L.; Graber, T.A.; Galleguillos, H.R.; Cabeza, L.F.; Rojas, R. Solar water heating system and photovoltaic floating cover to reduce evaporation: Experimental results and modeling. Renew. Energy 2017, 105, 601–615. [Google Scholar] [CrossRef]
  32. Bontempo Scavo, F.; Tina, G.M.; Gagliano, A.; Nižetić, S. An assessment study of evaporation rate models on a water basin with floating photovoltaic plants. Int. J. Energy Res. 2020, 45, 167–188. [Google Scholar] [CrossRef]
  33. Abd-Elhamid, H.F.; Ahmed, A.; Zeleňáková, M.; Vranayová, Z.; Fathy, I. Reservoir Management by Reducing Evaporation Using Floating Photovoltaic System: A Case Study of Lake Nasser, Egypt. Water 2021, 13, 769. [Google Scholar] [CrossRef]
  34. Baradei, S.E.; Sadeq, M.A. Effect of Solar Canals on Evaporation, Water Quality, and Power Production: An Optimization Study. Water 2020, 12, 2103. [Google Scholar] [CrossRef]
  35. Liikanen, A.; Murtoniemi, T.; Tanskanen, H.; Vaisanen, T.; Martikainen, P.J. Effects of temperature and oxygen availability on greenhouse gas and nutrient dynamics in sediment of a eutrophic mid-boreal lake. Biogeochemistry 2002, 59, 269–286. [Google Scholar] [CrossRef]
  36. Li, H.Y.; Xu, J.; Xu, R.Q. The Effect of Temperature on the Water Quality of Lake. Adv. Mater. Res. 2013, 821–822, 1001–1004. [Google Scholar] [CrossRef]
  37. Spears, B.M.; Carvalho, L.; Paterson, D.M. Phosphorus partitioning in a shallow lake: Implications for water quality management. Water Environ. J. 2007, 21, 47–53. [Google Scholar] [CrossRef]
  38. Wu, L.F.; Niu, C.; Zhang, H.; Wu, Z.W.; Cheng, Y.X.; Li, N.F.; Cheng, Y.H.; Chen, X.Y.; Zhang, F.; Ou, J.H.; et al. Comparison study of the growth of Eriocheir sinensis in the photovoltaic and non-photovoltaic area in the Yuguangyiti ponds. Freshw. Fish. 2021, 51, 108–112. [Google Scholar] [CrossRef]
Figure 1. (a) Guoqiaoshan, Fuqing city, Fujian province, China (25°31′48″ N, 119°17′24″ E); the black dot is the location of this study; (b) distribution of sampling stations (S1–S6); (c) overview of the PV area; (d) overview of the control area.
Water 16 00526 g001
Figure 2. Distribution of (a) surface air temperature, (b) wind speed, (c) net total radiation, and (d) light intensity in the Guoqiaoshan aquaculture ponds. In (ac), the asterisks represent differences between the PV area (S1~3 blue) and the control area (S5, 6) (** p ≤ 0.01; *** p ≤ 0.001); differences between the PV area (S1~3 blue) and the open water in the PV area (S1~3 pink) (### p ≤ 0.001); differences between the open water in the PV area (S1~3 pink) and the control area (S5, 6) (& p ≤ 0.05; &&& p ≤ 0.001). In (d), the asterisks represent differences in the above surface between the PV area (S1~3 blue) and the control area (S5~6 blue) (** p ≤ 0.01). S5,6 indicates that a group of samples are collected on S5 and S6. “NS” represent no significance (p > 0.05).
Water 16 00526 g002
Figure 3. Distributions of (a) water temperature, (b) DO, (c) pH, (d) salinity, (e) turbidity, and (f) Chl-α in the Guoqiaoshan aquaculture ponds. Asterisks represent differences between the PV area (S1~3) and the control area (S5~6) (** p ≤ 0.01, *** p ≤ 0.001).
Water 16 00526 g003
Figure 4. Distributions of (a) nitrate, (b) nitrite, (c) ammonium, (d) labile phosphate, and (e) active silicate in the Guoqiaoshan aquaculture ponds. Asterisks represent differences between the PV area (S1~3) and the control area (S5~6) (* p ≤ 0.05; *** p ≤ 0.001; NS no significance).
Water 16 00526 g004
Figure 5. Distributions of (a) TN, (b) TP, and (c) TOC in the Guoqiaoshan aquaculture ponds. Asterisks represent differences between the PV area (S1~3) and the control area (S5~6) (*** p ≤ 0.001).
Water 16 00526 g005
Figure 6. Pearson correlation analysis of water temperature and near-surface meteorological parameters. WS: wind speed, WT: water temperature. The value in the figure is the Pearson correlation coefficient. (. p ≤ 0.1, * p ≤ 0.05, ** p ≤ 0.01, and *** p ≤ 0.001).
Water 16 00526 g006
Figure 7. Pearson correlation analysis of water temperature and water quality parameters. S: salinity, N: nitrate, AN: ammonium, P: labile phosphate, SI: active silicate, TN: total nitrogen, TP: total phosphorus, TOC: total organic carbon, Chl: Chl-α. (. p ≤ 0.1, * p ≤ 0.05, ** p ≤ 0.01, and *** p ≤ 0.001).
Water 16 00526 g007
Disclaimer/Publisher’s Note: The statements, opinions and data contained in all publications are solely those of the individual author(s) and contributor(s) and not of MDPI and/or the editor(s). MDPI and/or the editor(s) disclaim responsibility for any injury to people or property resulting from any ideas, methods, instructions or products referred to in the content.

