Article

The Influence of Typhoon Events on the Design Storm for the Shanghai Metropolitan Area in the Yangtze River Delta, China

1
Department of Hydraulic Engineering, Tongji University, Shanghai 200092, China
2
Key Laboratory of Yangtze River Water Environment, Ministry of Education, Tongji University, Shanghai 200092, China
3
Bureau of Hydrology (Information Center) of Taihu Basin Authority, Shanghai 200080, China
*
Authors to whom correspondence should be addressed.
Water 2024, 16(3), 508; https://doi.org/10.3390/w16030508
Submission received: 7 December 2023 / Revised: 30 January 2024 / Accepted: 31 January 2024 / Published: 5 February 2024

Abstract

:
Given the fact that the high frequency of extreme weather events globally, in particular typhoons, has more of an influence on flood forecasting, there is a great need to further understand the impact of typhoon events on design storms. The main objectives of this paper are to examine the magnitude, occurrence, and mechanism of typhoon events in southeast coastal China and their contribution to the design storm study. We take Shanghai, which is a typical metropolitan region in the Yangtze River Delta, China, as an example. The impact of typhoons on the rainfall frequency analysis is quantitatively evaluated using stochastic storm transposition (SST)-based intensity–duration–frequency (IDF) estimates with various temporal and spatial structures under different return periods. The results show that there is significant variability in the storm magnitude within the transposition domain across different durations, highlighting the spatiotemporal heterogeneity over the coastal area. Moreover, the probability of random storm transposition exhibits an uneven distribution. The frequency of typhoon rainfall events within the transposition domain is notably high, and there is considerable variability in the structure of rainfall. Typhoon rainfall amplifies the intensity of design storms, and its contribution increases with return periods. The variability in design storms increases accordingly. Based on the advantages of SST, which retains the spatiotemporal structure of the rainfall in the generated scenarios, the overall framework provides an effective way to examine the impact of diverse characteristics of typhoon rainfall on frequency analysis and facilitate a deeper exploration of the direct impact of various types of extreme storms on the intensity, spatial, and temporal distributions of design storms amidst evolving environmental conditions over this metropolitan region.

1. Introduction

The determination of a design storm (hyetograph) is fundamental for water safety management. In recent years, attributed to global warming and rapid urbanization, the frequency of extreme rainfall events and subsequent flooding disasters in urban areas has increased dramatically [1,2,3]. In the eastern coastal areas of China, typhoons are one of the most catastrophic events that cause severe consequences in this area, and there remains an urgent need to improve our understanding of the impact of typhoons on their design storms.
Conventional design storm calculations rely on station data and idealized settings, assuming information consistency, a uniform distribution of surface rainfall, and predetermined rain patterns [4], while neglecting the spatial and temporal heterogeneity of rainfall. However, the storm structure, including its fine-scale variability and motion, is a crucial determinant of flood response [5,6,7]. The advent of satellite radar technology has enabled the use of high-precision rainfall information for design storm calculations, which incorporate the storm structure characteristics and are of great significance in improving the urban flood protection design standards [8,9,10,11]. Stochastic storm transposition (SST) [12], a regional rainfall frequency analysis method that combines probabilistic resampling and the spatial transformation of storms and originated in Australia [13], is now widely used in various regions of the United States [14,15,16]. The method involves delineating a storm displacement area with the target region as the core; selecting a series of extreme rainfall events as the “storm catalog” within the area; simulating and extending the storm sequence based on a combination of probabilistic resampling and geographic displacement; and subsequently carrying out frequency analysis calculations. Wright et al. have used rainfall remote sensing data with SST to simulate rainfall-driven disasters such as floods and landslides [17]. Zhou and Zhu et al. have extended the method by considering the impacts of the spatial heterogeneity of rainfall and rainfall structure on the frequency analysis of rainfall [18,19,20]. Zhuang et al. have combined SST with copula theory to explore the spatiotemporal storm feature dependence for bivariate rainfall frequency analysis [21]. The primary advantage of the SST method is that it avoids the assumption of data consistency required in the traditional method while also describing the spatial distribution changes in storms, in addition to the storm intensities and magnitudes, thus reducing the uncertainty of the design values.
The probability of widespread rainfall and flooding occurrences being instigated by typhoons has escalated in the past century, with climate change elevating the likelihood of such incidents by a factor of 1.5–5 [22,23,24]. Moreover, the frequency of typhoon events has been further amplified due to human activities [25,26,27]. Knutson et al. have projected that anthropogenically influenced climate change will have augmented the intensity of typhoons by 11% by the conclusion of the century [28,29]. Additionally, Sadya et al. have suggested that urbanization exerts an amplifying impact on the precipitation levels associated with severe typhoons [30].
The focus of this study is the city of Shanghai, situated within the Yangtze River Basin and renowned as one of China’s most urbanized areas. The region is particularly susceptible to a range of extreme rainfall events, including monsoons, plum rain, and typhoons, with urban flooding posing a significant threat to its development [31,32,33]. The complex spatial and temporal heterogeneity of extreme rainfall in this urban setting [7,34,35], compounded by the subsurface conditions [36,37], necessitates thorough consideration in the development of urban flood protection strategies. Therefore, the incorporation of the storm frequency analysis method, along with an assessment of spatial and temporal heterogeneity, is crucial for flood mitigation management in this region. Typhoon events exert a particularly severe impact on the area [38,39,40,41], underscoring the importance of isolating their contribution to extreme events and further examining the influence of various types of extreme storms on the design of rainfall in response to evolving environmental conditions. It is important to explore the impact of typhoon rainfall events on the spatial and temporal distribution of design storms when performing design storm calculations for metropolitan regions.

2. Materials and Methods

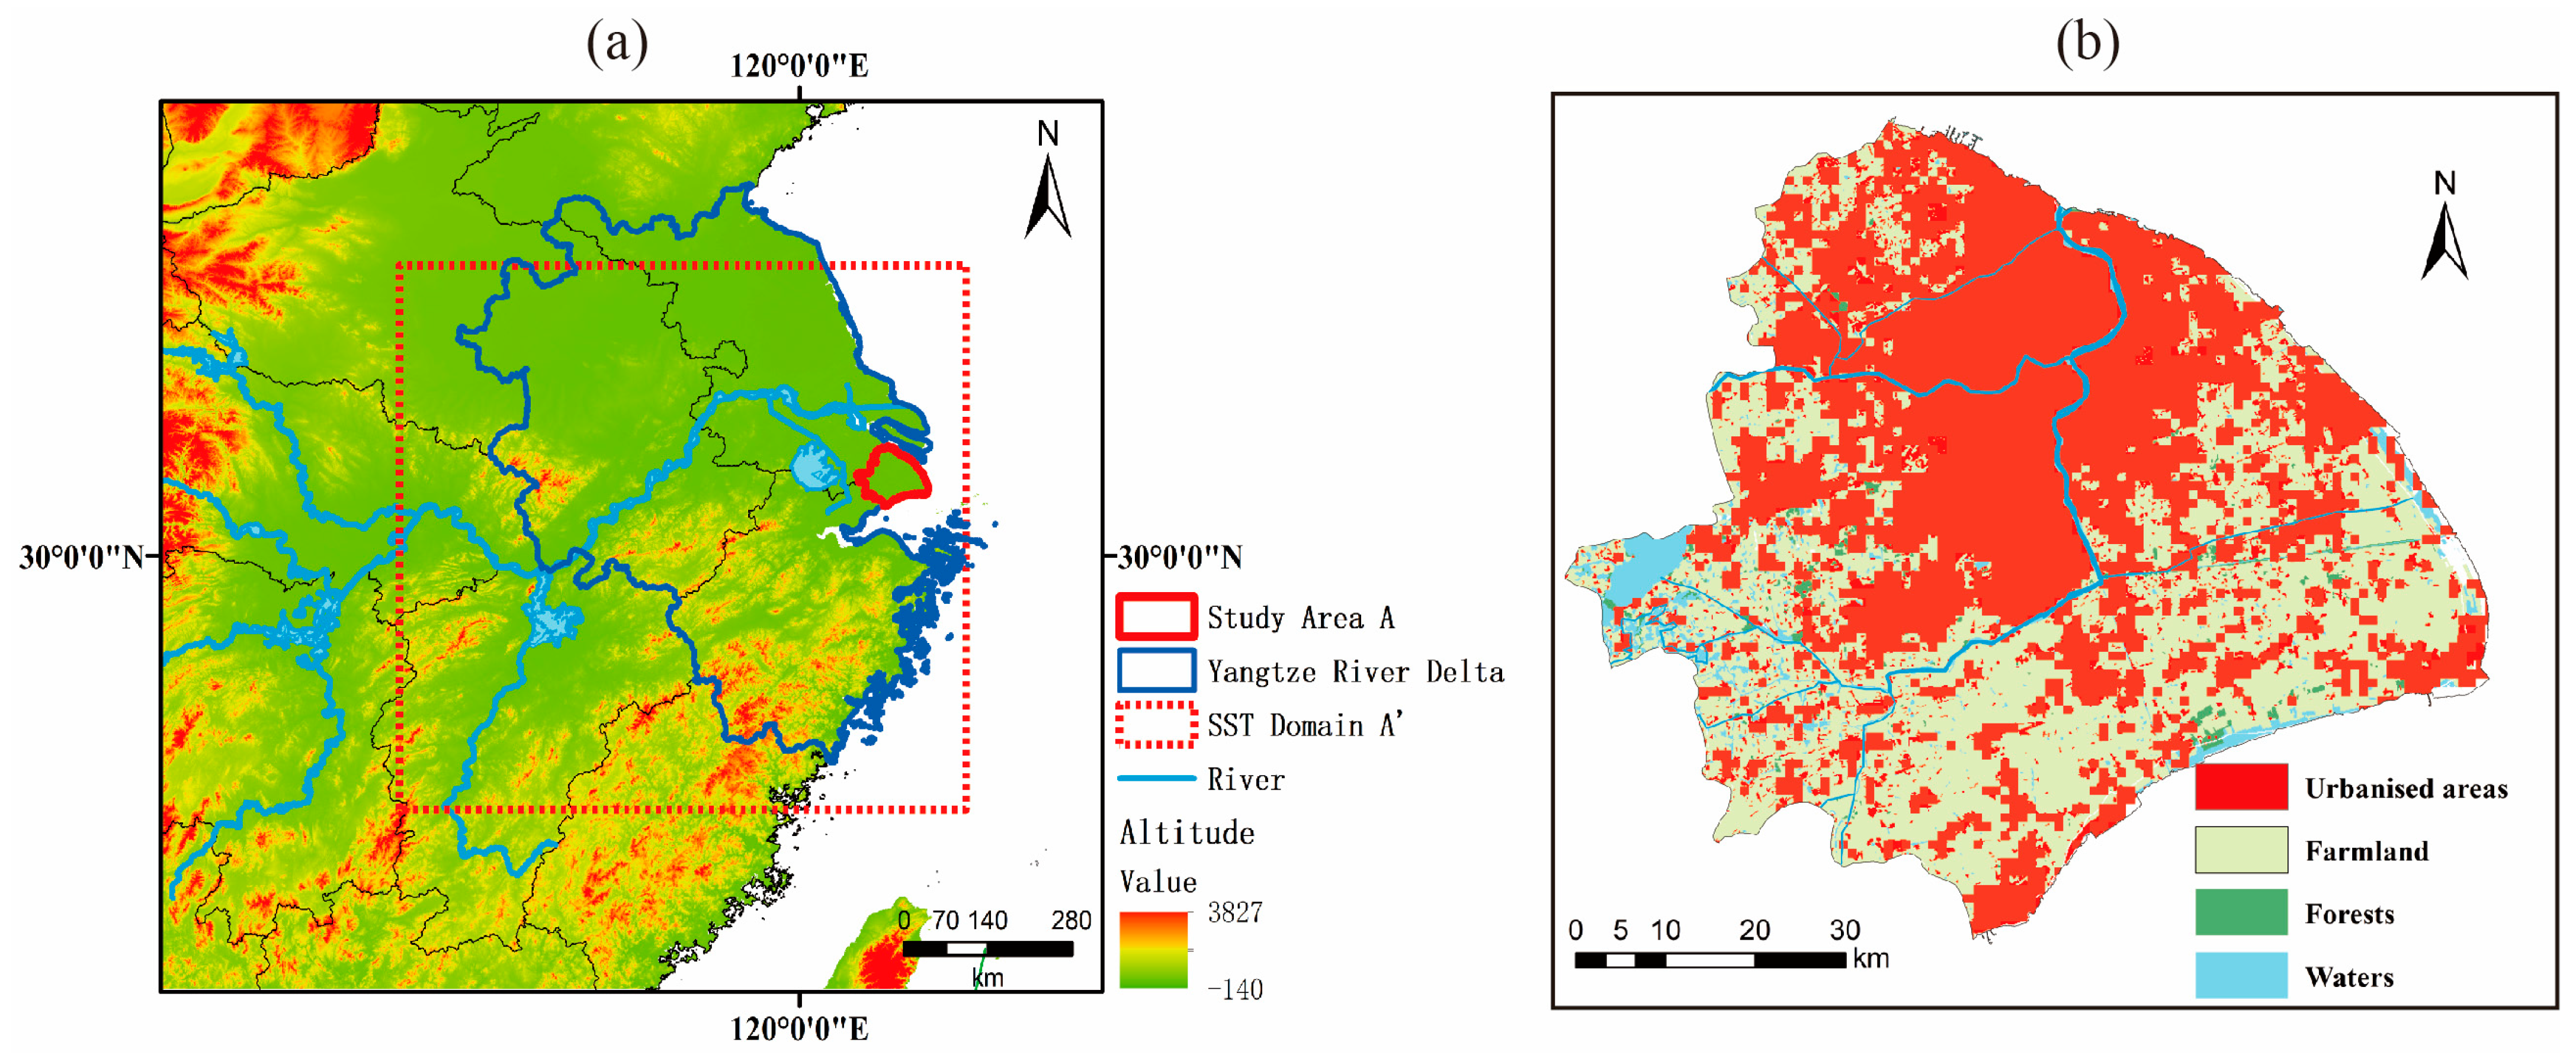
2.1. Study Area and Data

The study region is centered on Shanghai, a metropolitan region in the Yangtze River Delta, China. Shanghai is located between 120°52′~122°12′ E and 30°40′~31°53′ N, with a total area of 6340.5 km2, and is a coastal mega-city. The average annual rainfall is 1398 mm, with flood season conditions of 16 °C and 674 mm of rain [42]. Statistical analysis reveals that the study area encountered over 220 occurrences of typhoon incidents within the time frame of 1961 to 2020, resulting in significant challenges for flood prevention and management [43]. In 1997, Typhoon Winnie brought winds of level 8–10 and widespread heavy rainfall exceeding 50 mm, with localized areas experiencing over 150 mm of rainfall in Shanghai. The tidal levels at the mouths of the Yangtze River and Huangpu River surpassed historical records. The urban flood control wall broke in three places, leading to flooding in nearly 20 locations, resulting in the collapse of over 500 houses and damage to more than 2000, affecting approximately 500 km2 of the city’s outskirts [44]. In 2013, Typhoon Fit in Shanghai brought extreme rainfall, with a maximum rainfall of 327.7 mm, along with strong winds and high tides and waves, causing serious road flooding. In 2019, Typhoon Lichima triggered torrential to heavy rainfall across Shanghai, with most areas receiving between 150 and 250 mm of rainfall, averaging 167.0 mm and reaching over 276 mm in some areas [45]. This affected 16 districts within the city, leading to the evacuation of over 259,000 individuals. Figure 1 shows the location of the study area and the storm transposition zone used in this study.
The GPM-IMERG gridded satellite rainfall data (e.g., IMERG Final Run) provided by NASA (https://gpm.nass.gov/data/directory (accessed on 30 April 2023)) are used in this study. The data range from 1 January 2001 to 30 April 2023, with a temporal resolution of 30 min and a spatial resolution of 0.1° × 0.1° (approximately 10 km × 10 km in the study region). It has been shown that this dataset has good adaptation in China and has also proved to be superior to other satellite products for application in urban areas [48,49].
The typhoon data are obtained from the CMA-TC database provided by the China Meteorological Administration (https://tcdata.typhoon.org.cn (accessed on 30 April 2023)). The CMA-TC database includes the historical or real-time locations (i.e., best track and landfall), intensity, dynamic and thermal structures, wind strengths, precipitation amounts, and frequency of the typhoons that have passed through the Western North Pacific (WNP) and South China Sea (SCS) since 1949 [50,51].

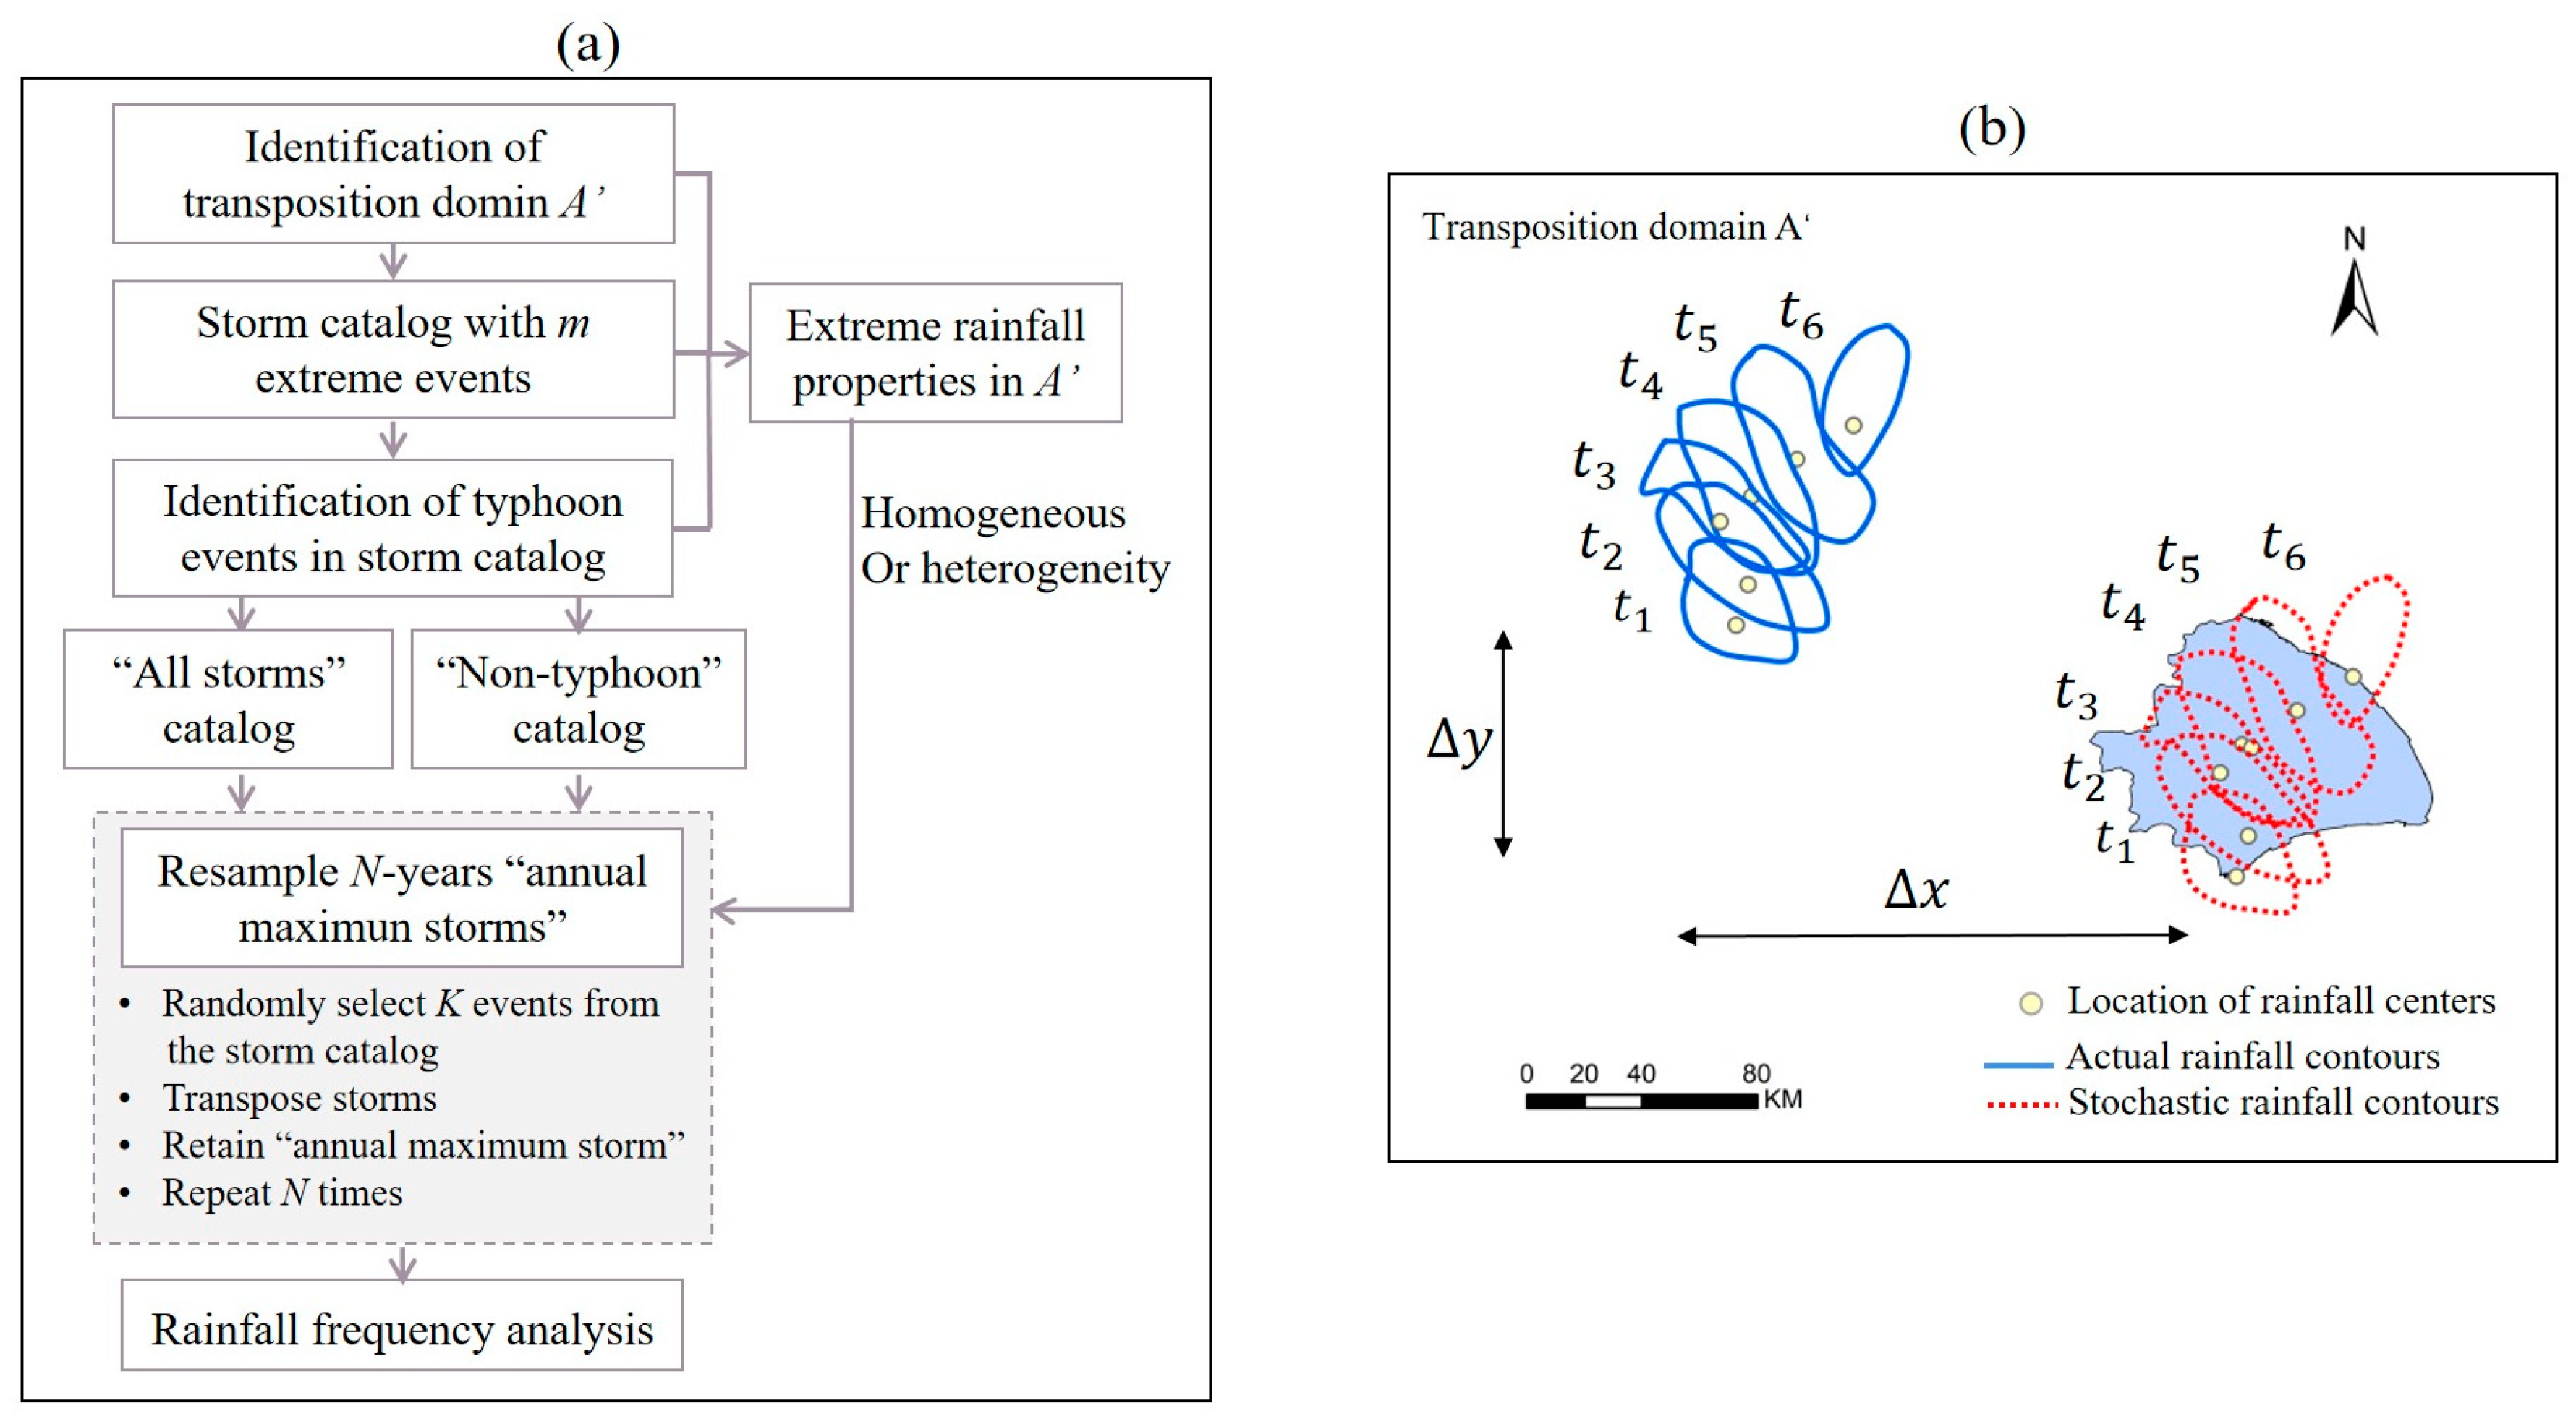
2.2. The Stochastic Storm Transposition (SST) Method

The SST frequency analysis model used in this paper is based on RainyDay, an open-source software package [52]. The main steps in applying the SST method to a regional design storm study are summarized as follows and shown in Figure 2a [53]. A more detailed description of the SST method can be found in the literature [17].
(1)
A region including the study area (e.g., A = 4900 km2 shown in Figure 1) is defined as the transposition domain area A’ (e.g., A’ = 494,000 km2 shown in Figure 1), for which the chosen storm catalog area is determined. The transposition domain is usually determined based on a comprehensive analysis of the regional hydro-meteorological and geographical characteristics [52]. The transposition domain of this research is chosen in the middle and lower Yangtze River Basin, as the region shares more similar weather systems, and the main drivers of its extreme rainfall are both landfall typhoons and low-pressure vortices [54,55]. To explore the impact of typhoons on the study area, part of the offshore area was selected for the transposition domain.
(2)
The maximum m storms at the t-hour time scale (at least 12 h in the interval between rainfall events) in the transposition domain are selected from the n-year satellite rainfall series to form a subset containing spatial and temporal rainfall data, a “storm catalog”. For the selected storms, to better characterize the storm properties and flood response characteristics of the study area, the m largest storms (m = 200 used in this study) are selected to determine the shape and orientation of the study area. In this study, we have chosen 3, 12, 24, and 72 h as the storm durations to generate four sets of corresponding t-hour storm catalogs. Comparing the central paths and occurrence times of the typhoon events in the CMA-TC, the typhoon events in the storm catalogs are identified.
(3)
We randomly select k storms from the storm catalogs following Poisson distribution. The parameter of Poisson distribution is λ = m / n , where there are m storms selected from the n-year radar record. For the storm catalogs in this study, if m = 200 and n = 23 , then λ = 8.696 . For storm transposition, if A’ is a “homogeneous area”, the storm will be transposed under a uniform distribution. When the displacement area A’ is a “heterogeneous area”, that means that there is spatial heterogeneity in the distribution of storms in the area. The probability of storm occurrence and magnitude in different parts of the transposition domain varies. The probability of occurrence of storm events can be determined by the location (longitude and latitude) of m storms, based on the non-parametric estimation method of Gaussian kernel density. A storm in the “heterogeneous area” would be transposed under a non-uniform distribution based on Gaussian kernel density. During the transposition, the motion and evolution of the entire storm field in all periods are not changed, only the spatial location of the storm occurrence (see Figure 2). This paper calculates the frequency of rainfall events based on the premise that the transposition domain is a “heterogeneous area”. After k shifts, the maximum value of t h rainfall accumulation in study area A was retained as the “annual maximum rainfall”.
(4)
The above process is repeated N times to construct an “N-year annual maximum storms” sequence with the duration of t h for N years. Note that since the shifted storms are randomly selected from the rainfall catalog, the shifting process is also called “resampling”. Therefore, the cumulative rainfall calculated in the target area A for each resampling process will not be repeated. After resampling, the “annual maximum storms” sequence is obtained for N years. The annual exceedance probability for each instance of rainfall i is p i = i / T max , and the recurrence period T i = 1 / p i . The calculation results can be plotted as empirical IDF curves or put into hydrological models.

2.3. Identification of Typhoons

For each storm catalog, typhoon events are identified based on the central paths and occurrence times of typhoon events in the CMA-TC database. Spatially, a 50 km radius range is defined with the central path of the typhoon as the center, and the spatial identification condition is satisfied when the rainfall center of the storm catalog occurs within this range. Temporally, the identification condition is satisfied when the time of the storm event is within the corresponding typhoon generation–extinction time range and the typhoon level is 2 or higher within that time range. When both of these conditions are satisfied, the storm event in the storm catalog is defined as a typhoon event (see Figure 3).

3. Results

The storm catalogs generated 200 storms with 3, 12, 24 and 72 h events, respectively. The distributions of the average storm magnitude and the probability of the occurrence of storm events (Figure 3) are diagnosed to examine the spatial heterogeneity of the transposition domain. Taking the 72 h storm catalog as an example (Figure 3a), the average rainfall distribution of the 200 storm events shows an overall increasing trend in magnitude from north to south. The maximum rainfall is located on the south–central and southeastern coasts of the transposition domain, and the minimum rainfall is located in the northwestern part. The spatial probability distribution of the occurrence of storm events based on the locations of the centers of the 200 storms (Figure 3b) is calculated using the Gaussian kernel density estimation method of non-parametric estimation. The spatial occurrence distribution corresponds to the spatial distribution of rainfall quantities. The two diagnosis maps demonstrate the significant spatial heterogeneity of rainfall in the transposition domain.

3.1. Storm Catalog Analysis

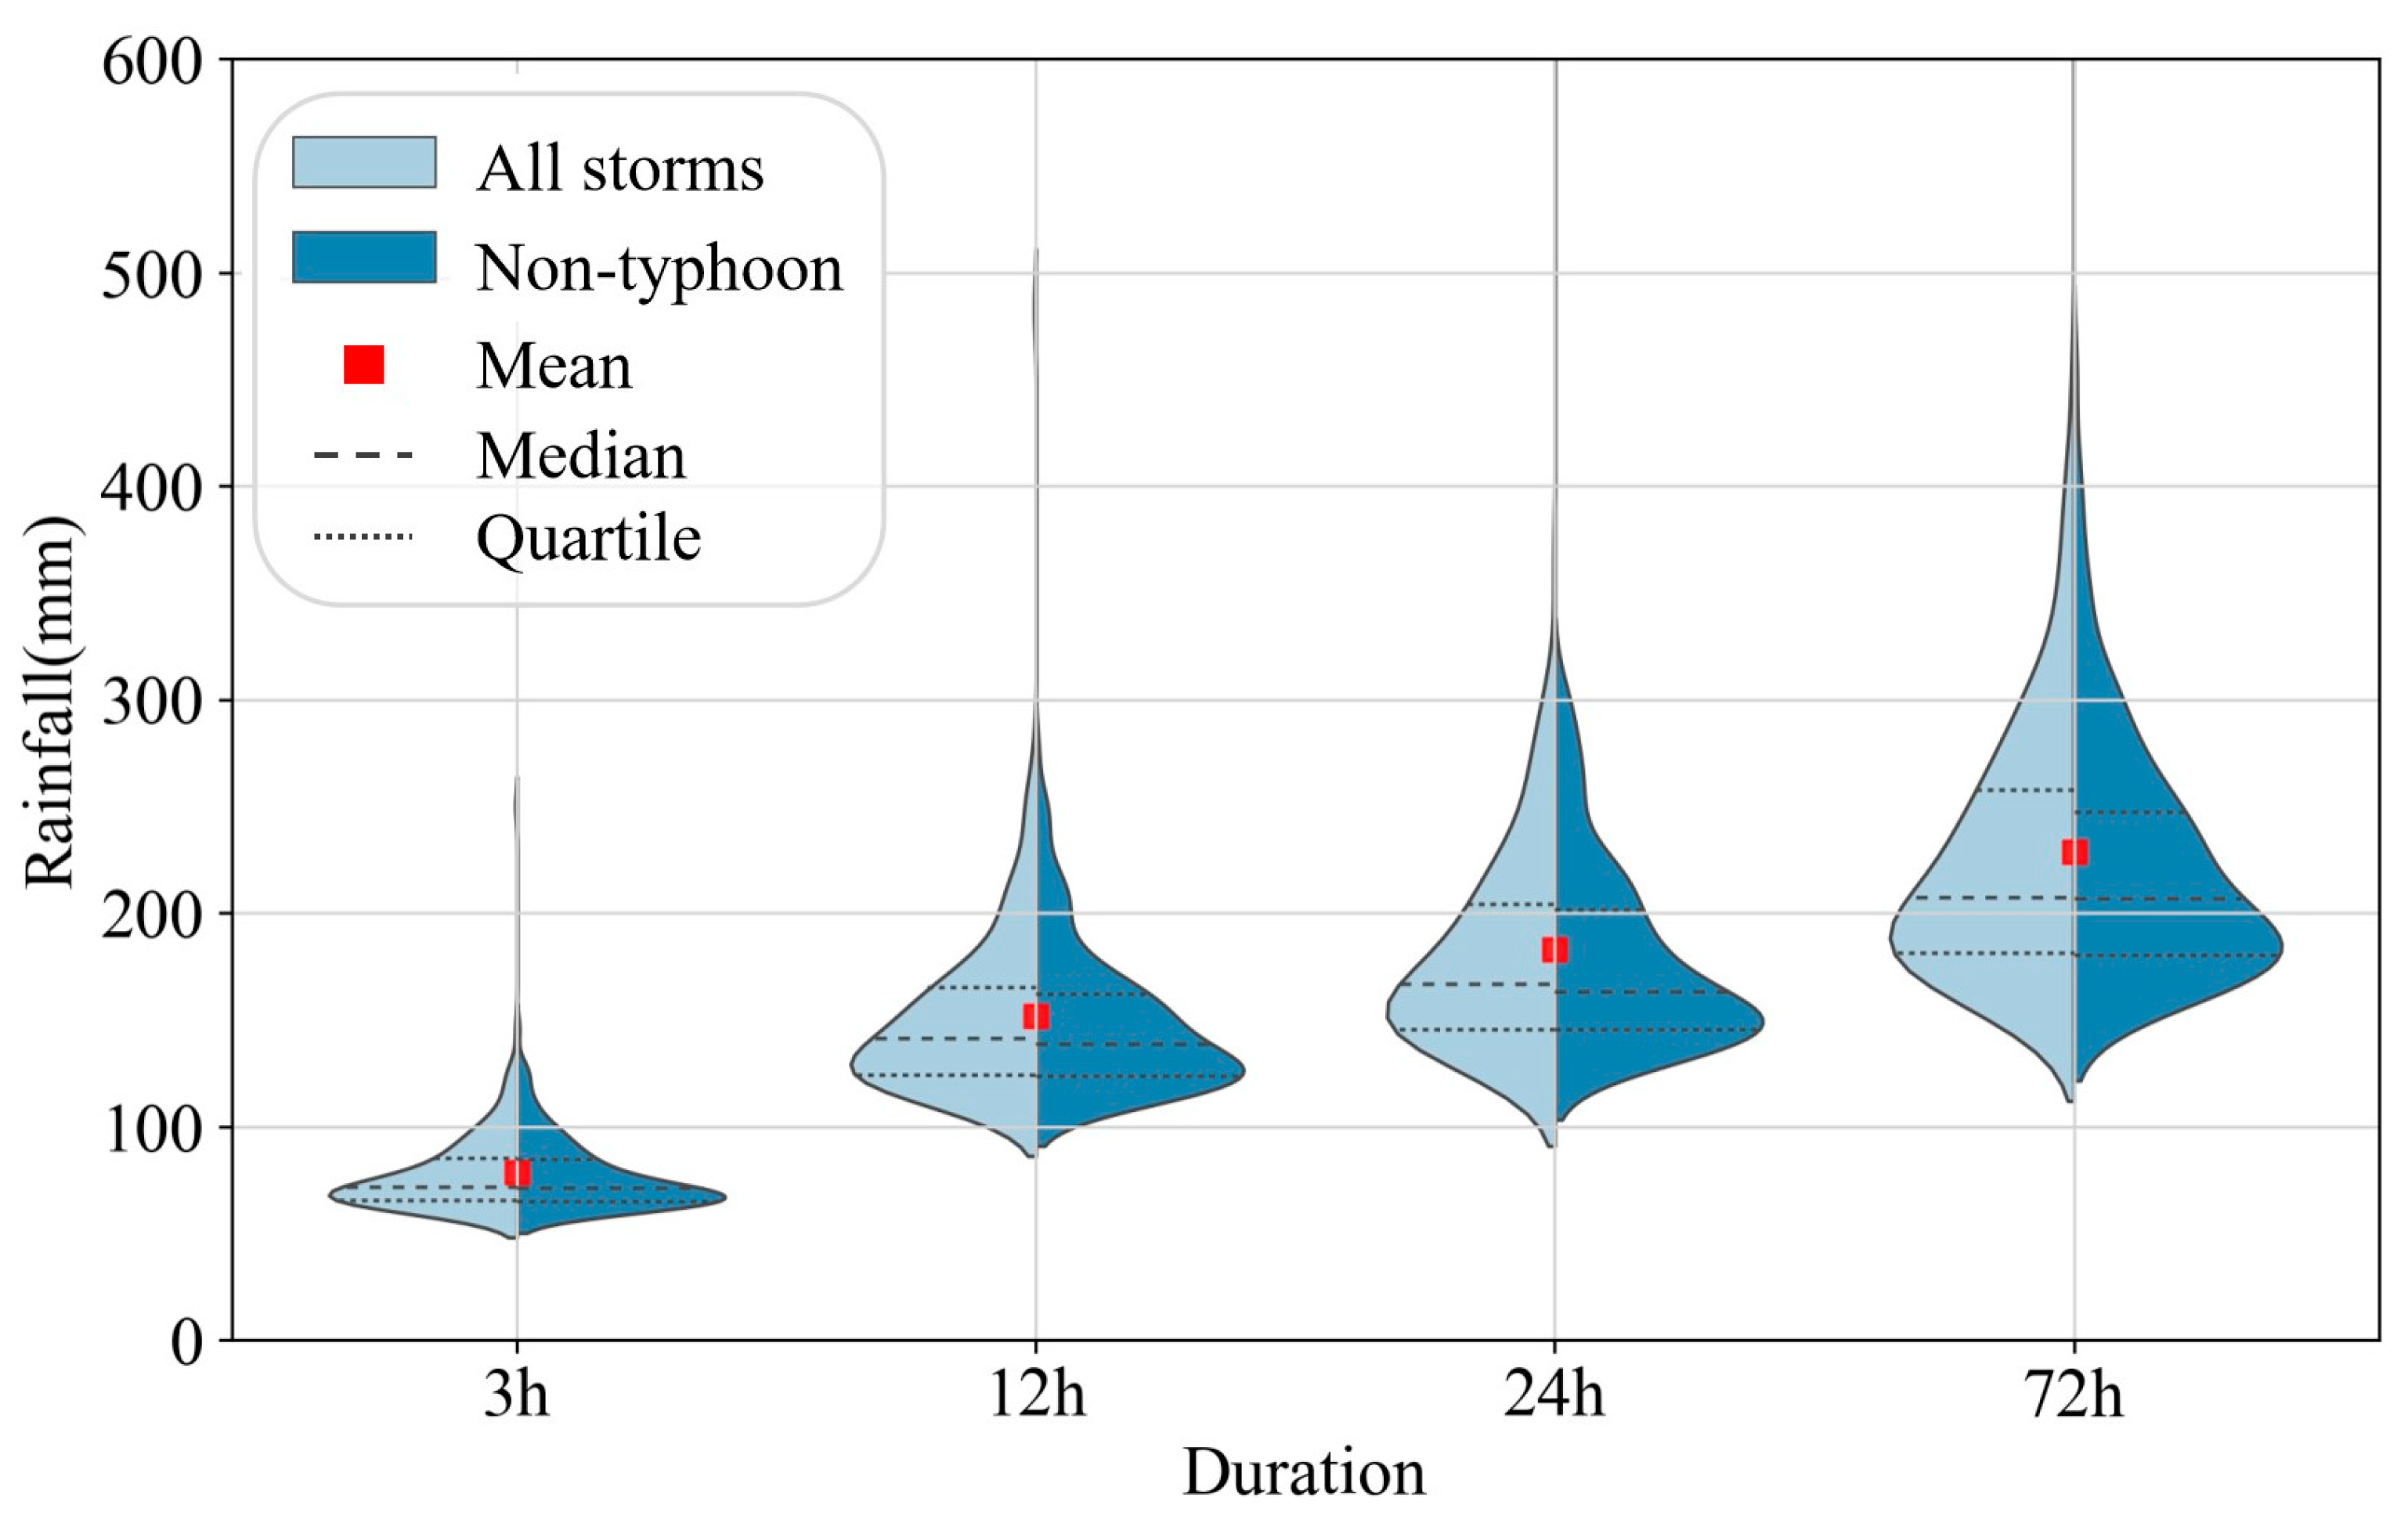
3.1.1. The Magnitude of Storm Events

The storm magnitude characteristics are depicted as violin plots of the rainfall accumulation from the storm catalog under four durations (Figure 4). The magnitude of storm events in this study is represented by the cumulative rainfall in the study area over the corresponding duration. From the figure, it can be seen that the rainfall is right-skewed under all durations, and the mean rainfall accumulation (red spot) is higher than the median (dotted lines). The rainfall variance increases and the outliers decrease with an increasing duration. There is a large variability in the rainfall magnitude at different durations. The dispersion of the rainfall magnitude distribution is the smallest for the 3 h duration and relatively larger for the 12 h and 72 h durations. We compare the storm catalogs between all events and non-typhoon events. When typhoon rainfall is excluded from the catalogs, there is a slight decrease in the mean rainfall accumulation and a large decrease in the variance and dispersion. The above results highlight that typhoon rainfall events have a large impact on the variability in the rainfall amount, implying that extreme events are caused by typhoons in this area.

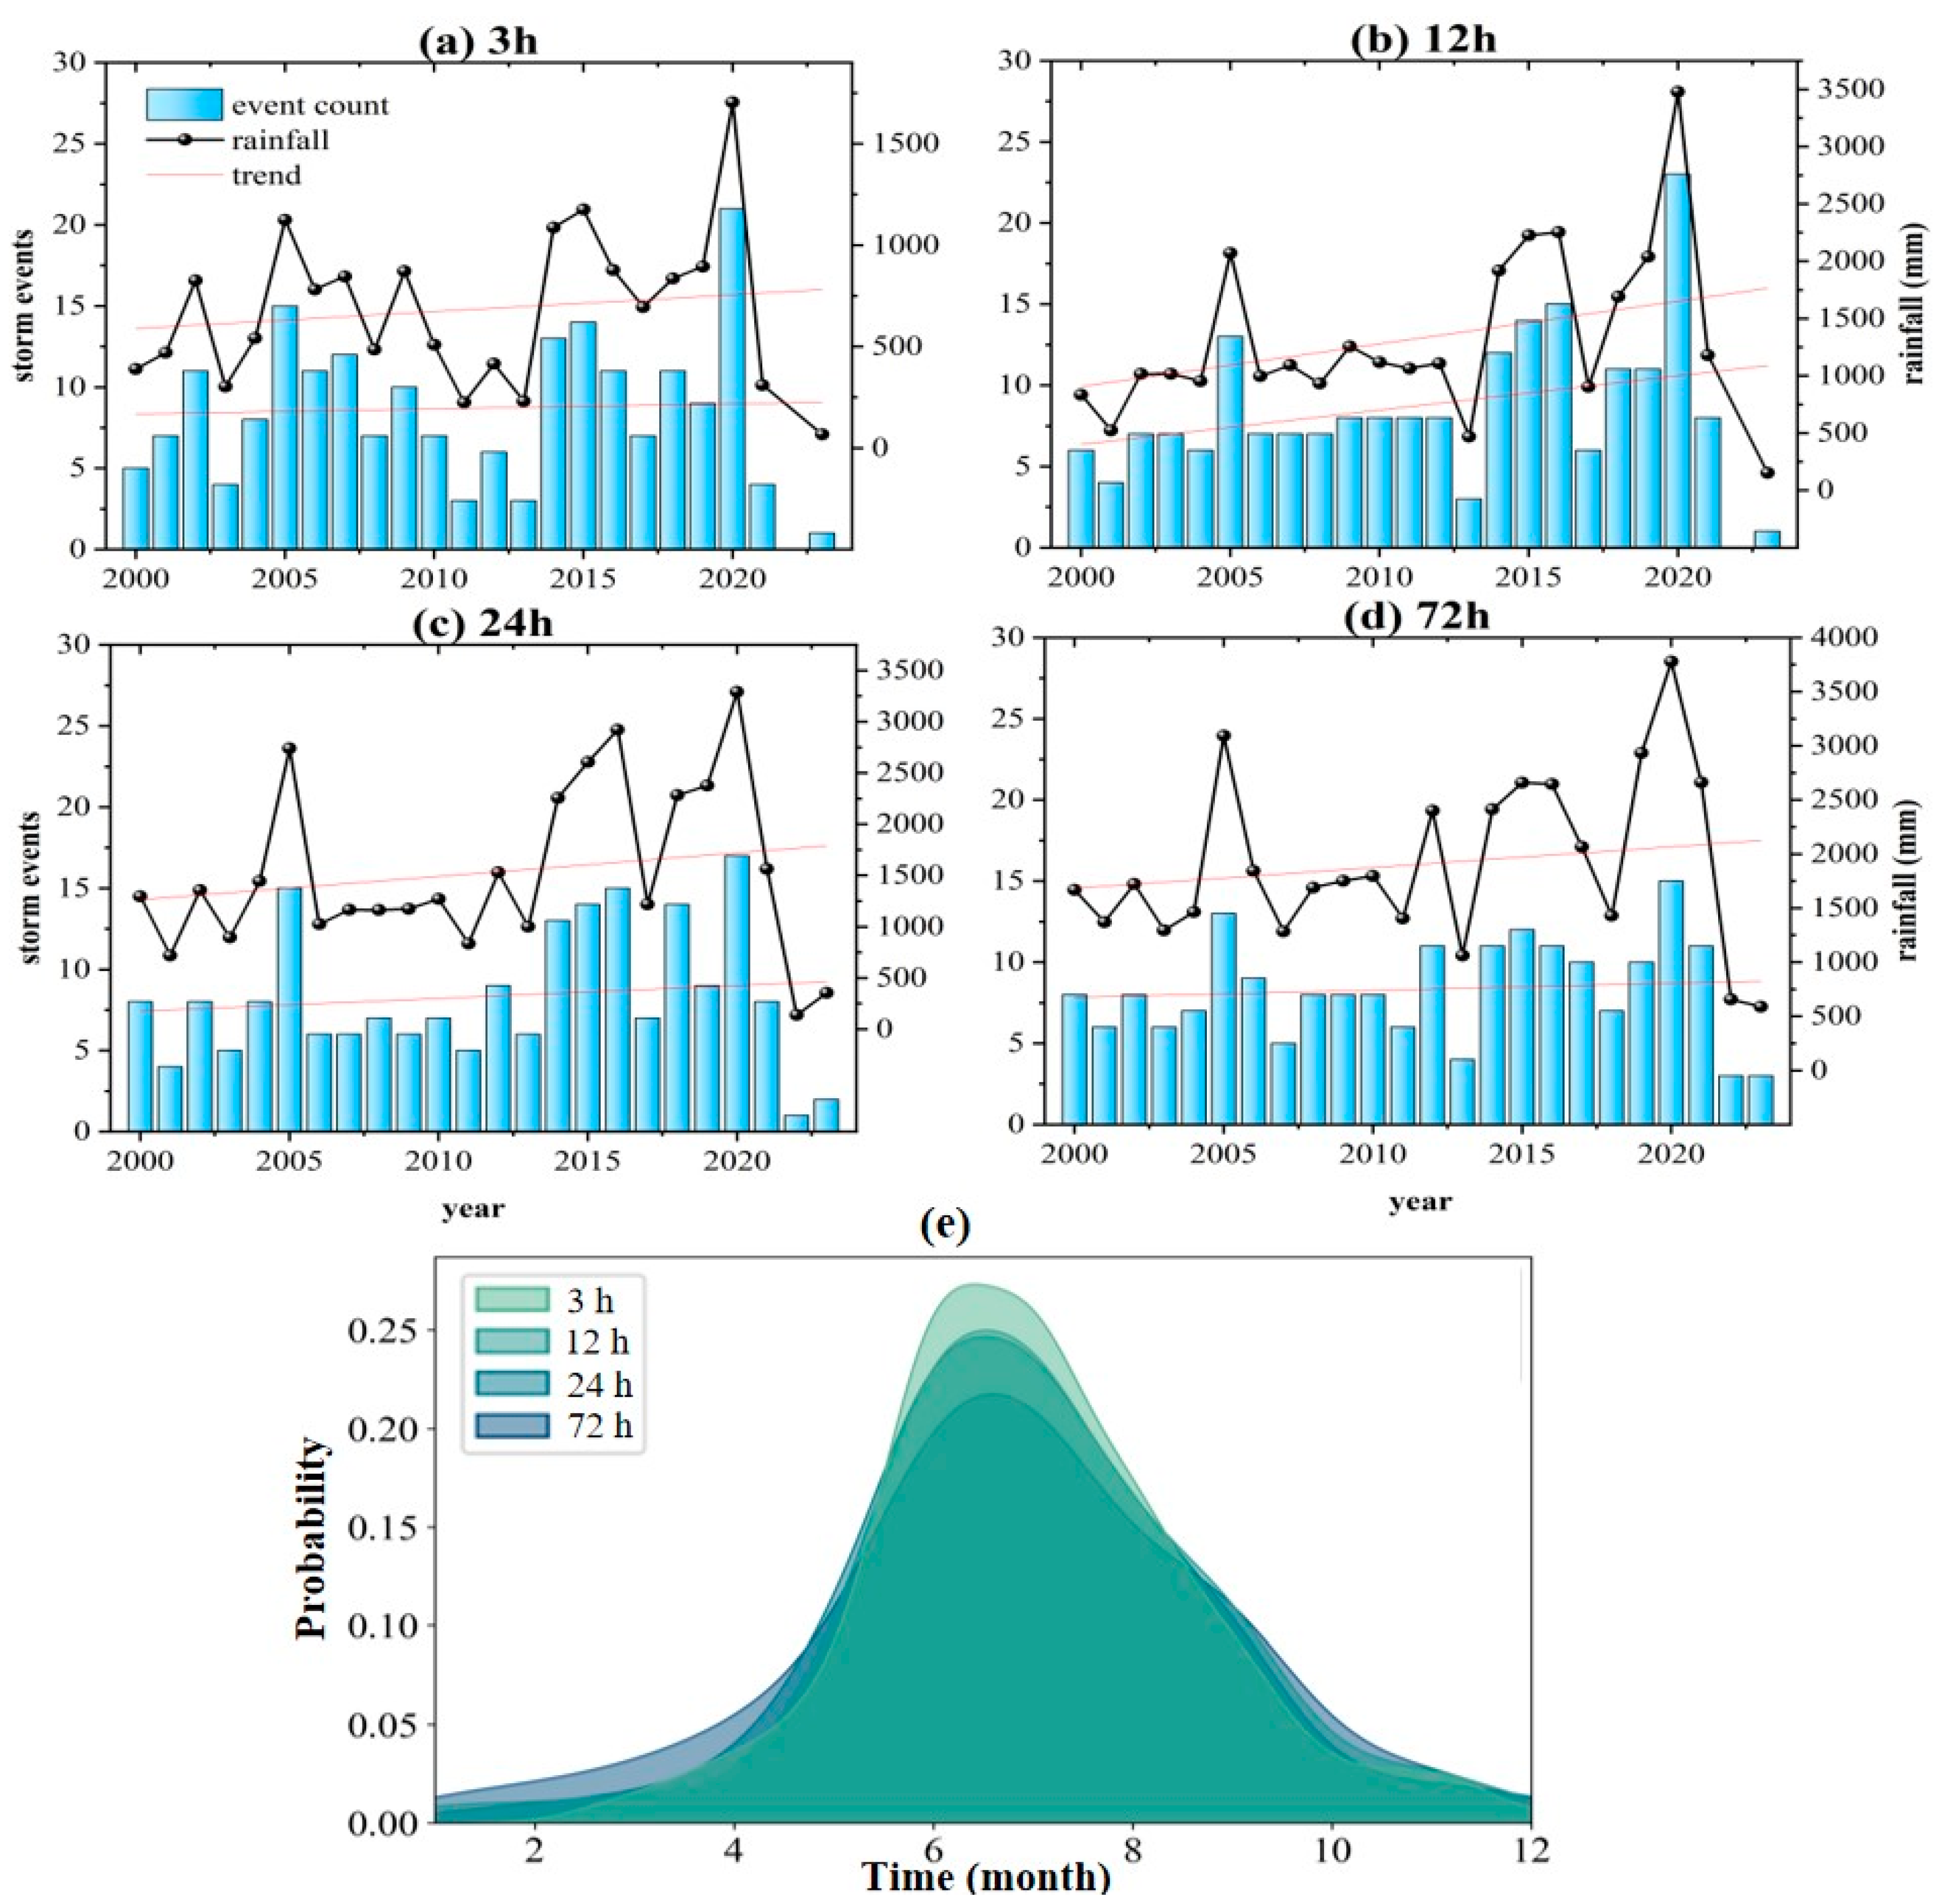
3.1.2. The Occurrence of Storm Events

The inter-annual variability and intra-annual distribution of storm events are analyzed for each duration (Figure 5). From the inter-annual variation (Figure 5a–d), the number of storm events and extreme rainfall mainly show fluctuating trends within the study period, with extreme values occurring in 2005, 2016, and 2020. In terms of the intra-annual distribution, there is seasonality in the storm events (Figure 5e), with the extreme value of the frequency of storm events under each duration occurring in June. The peak of the probability density curve of the occurrence of storm events decreases with an increase in the duration and tends to flatten out, with the peak shifted to the right. In this region, more than 65% of extreme rainfall occurs during the flood season (from June to September), which coincides with the season in which the region is affected by typhoons.

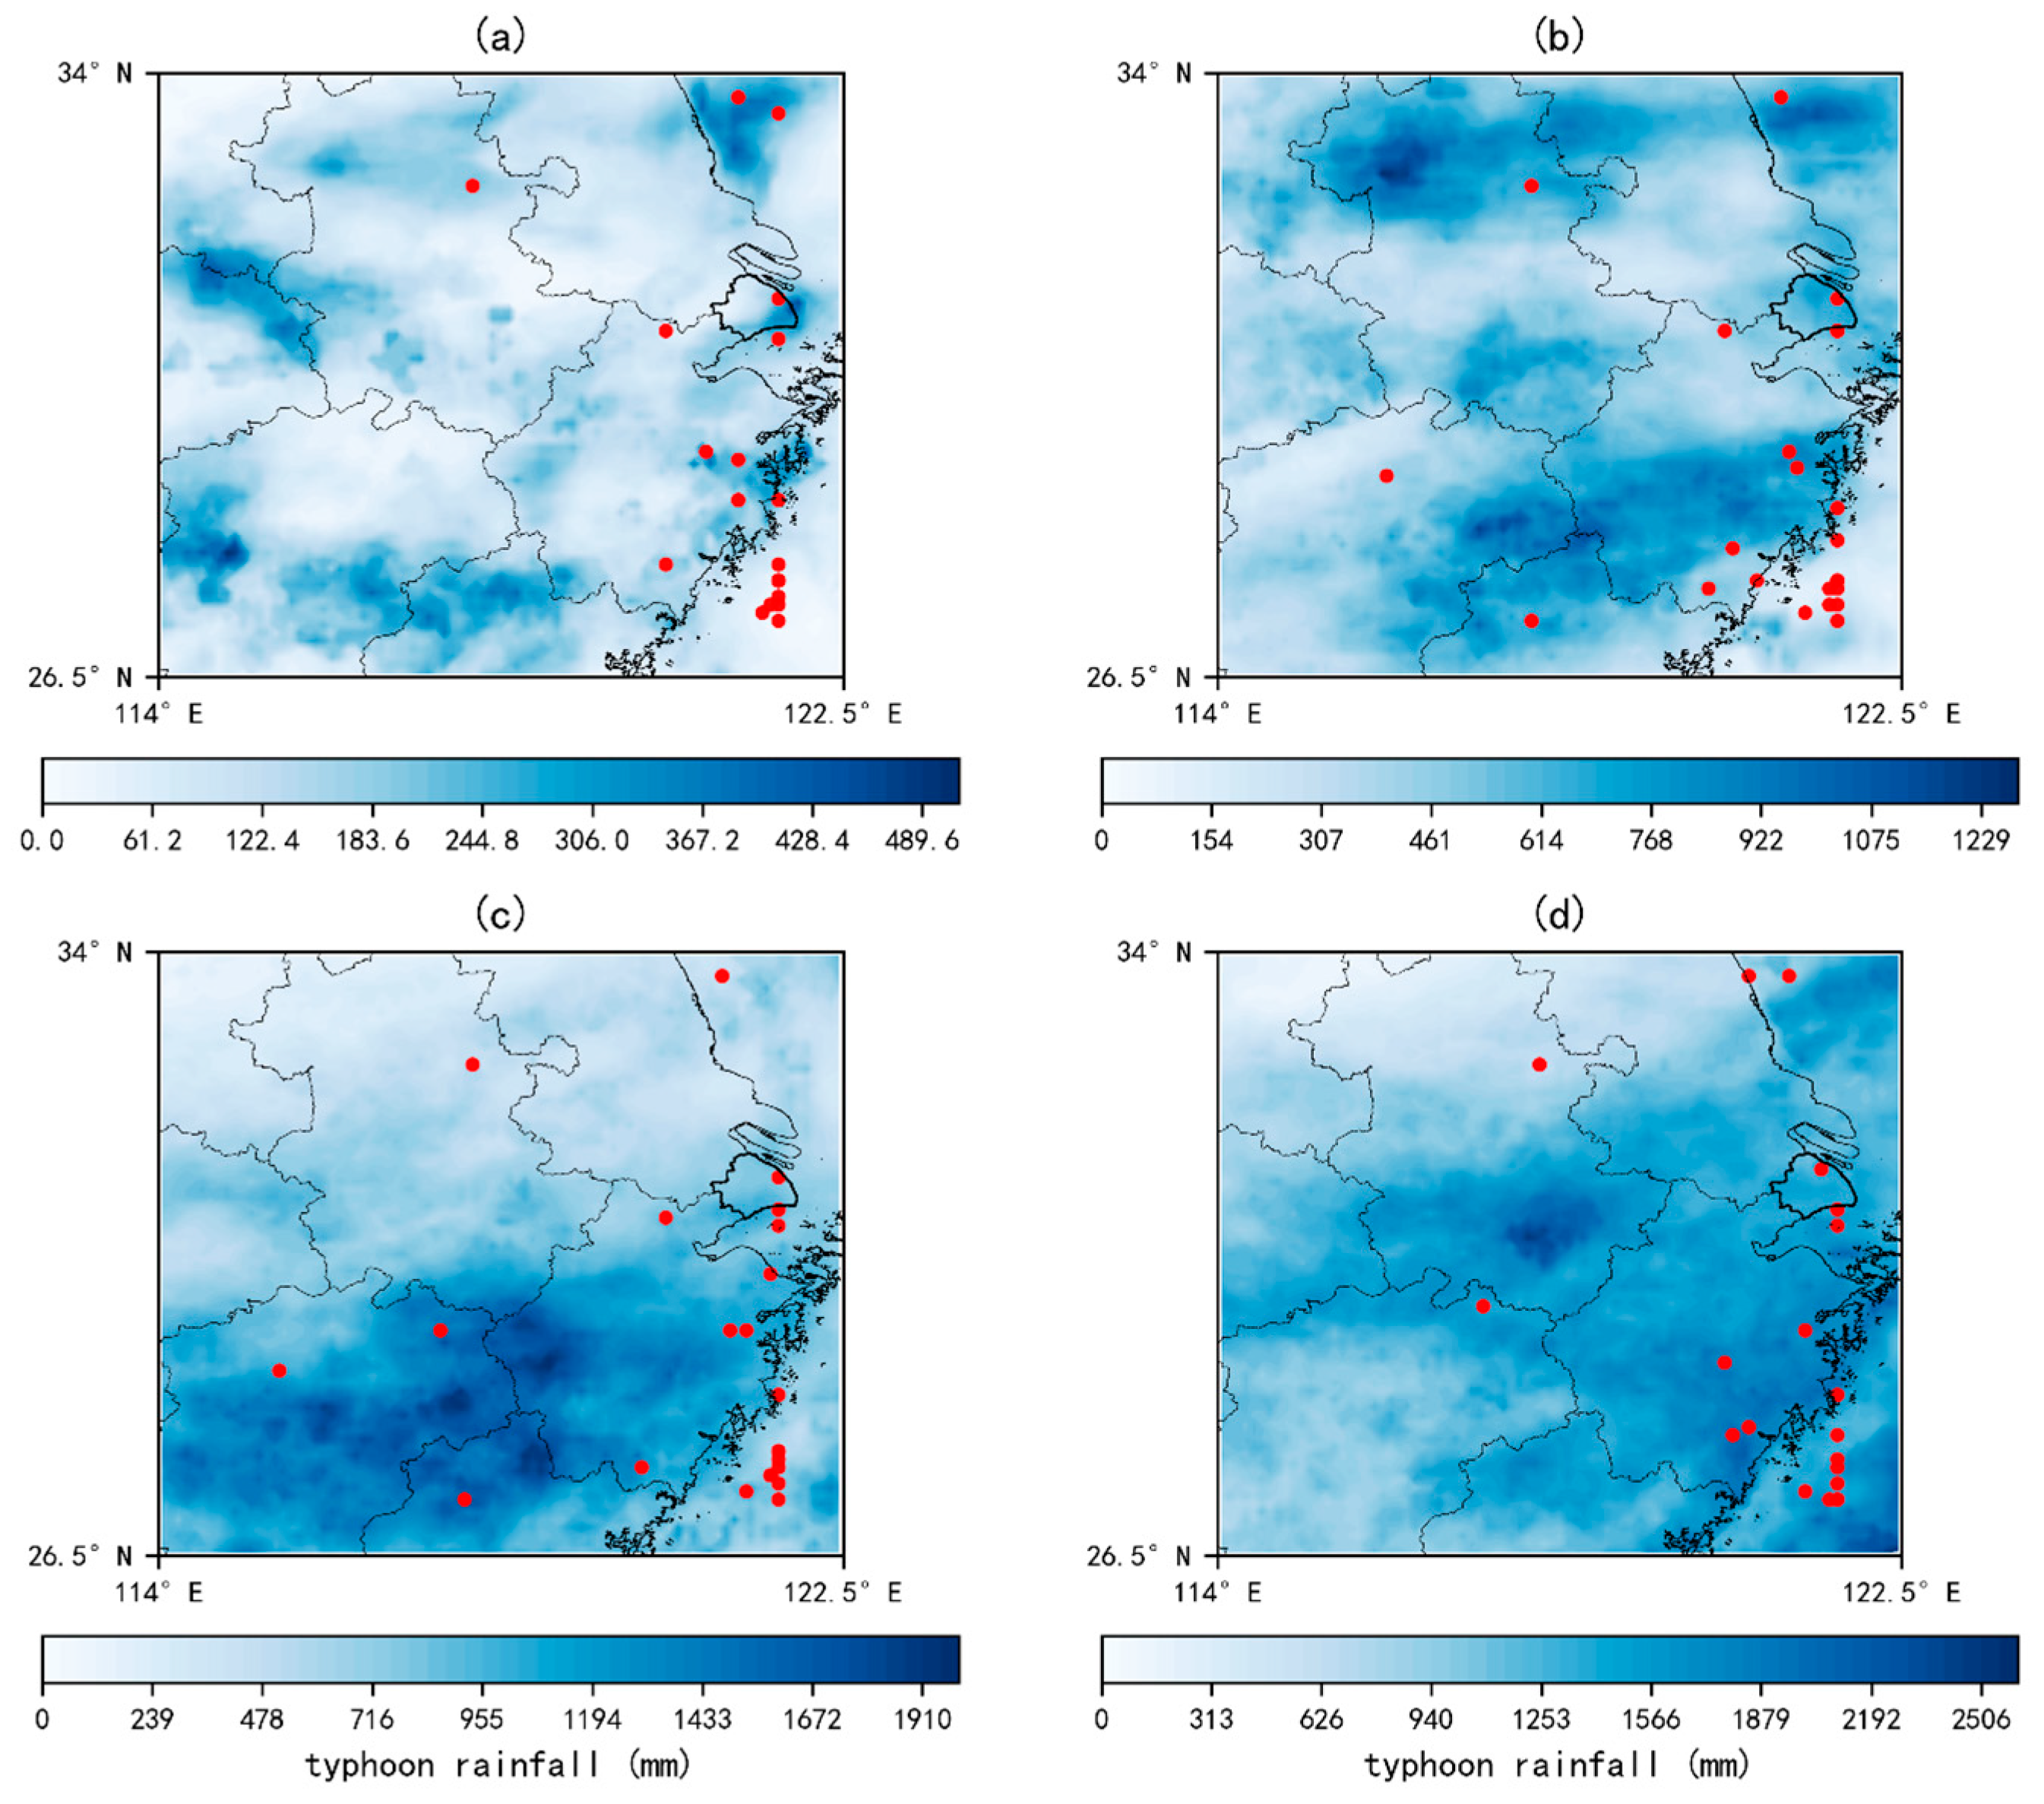
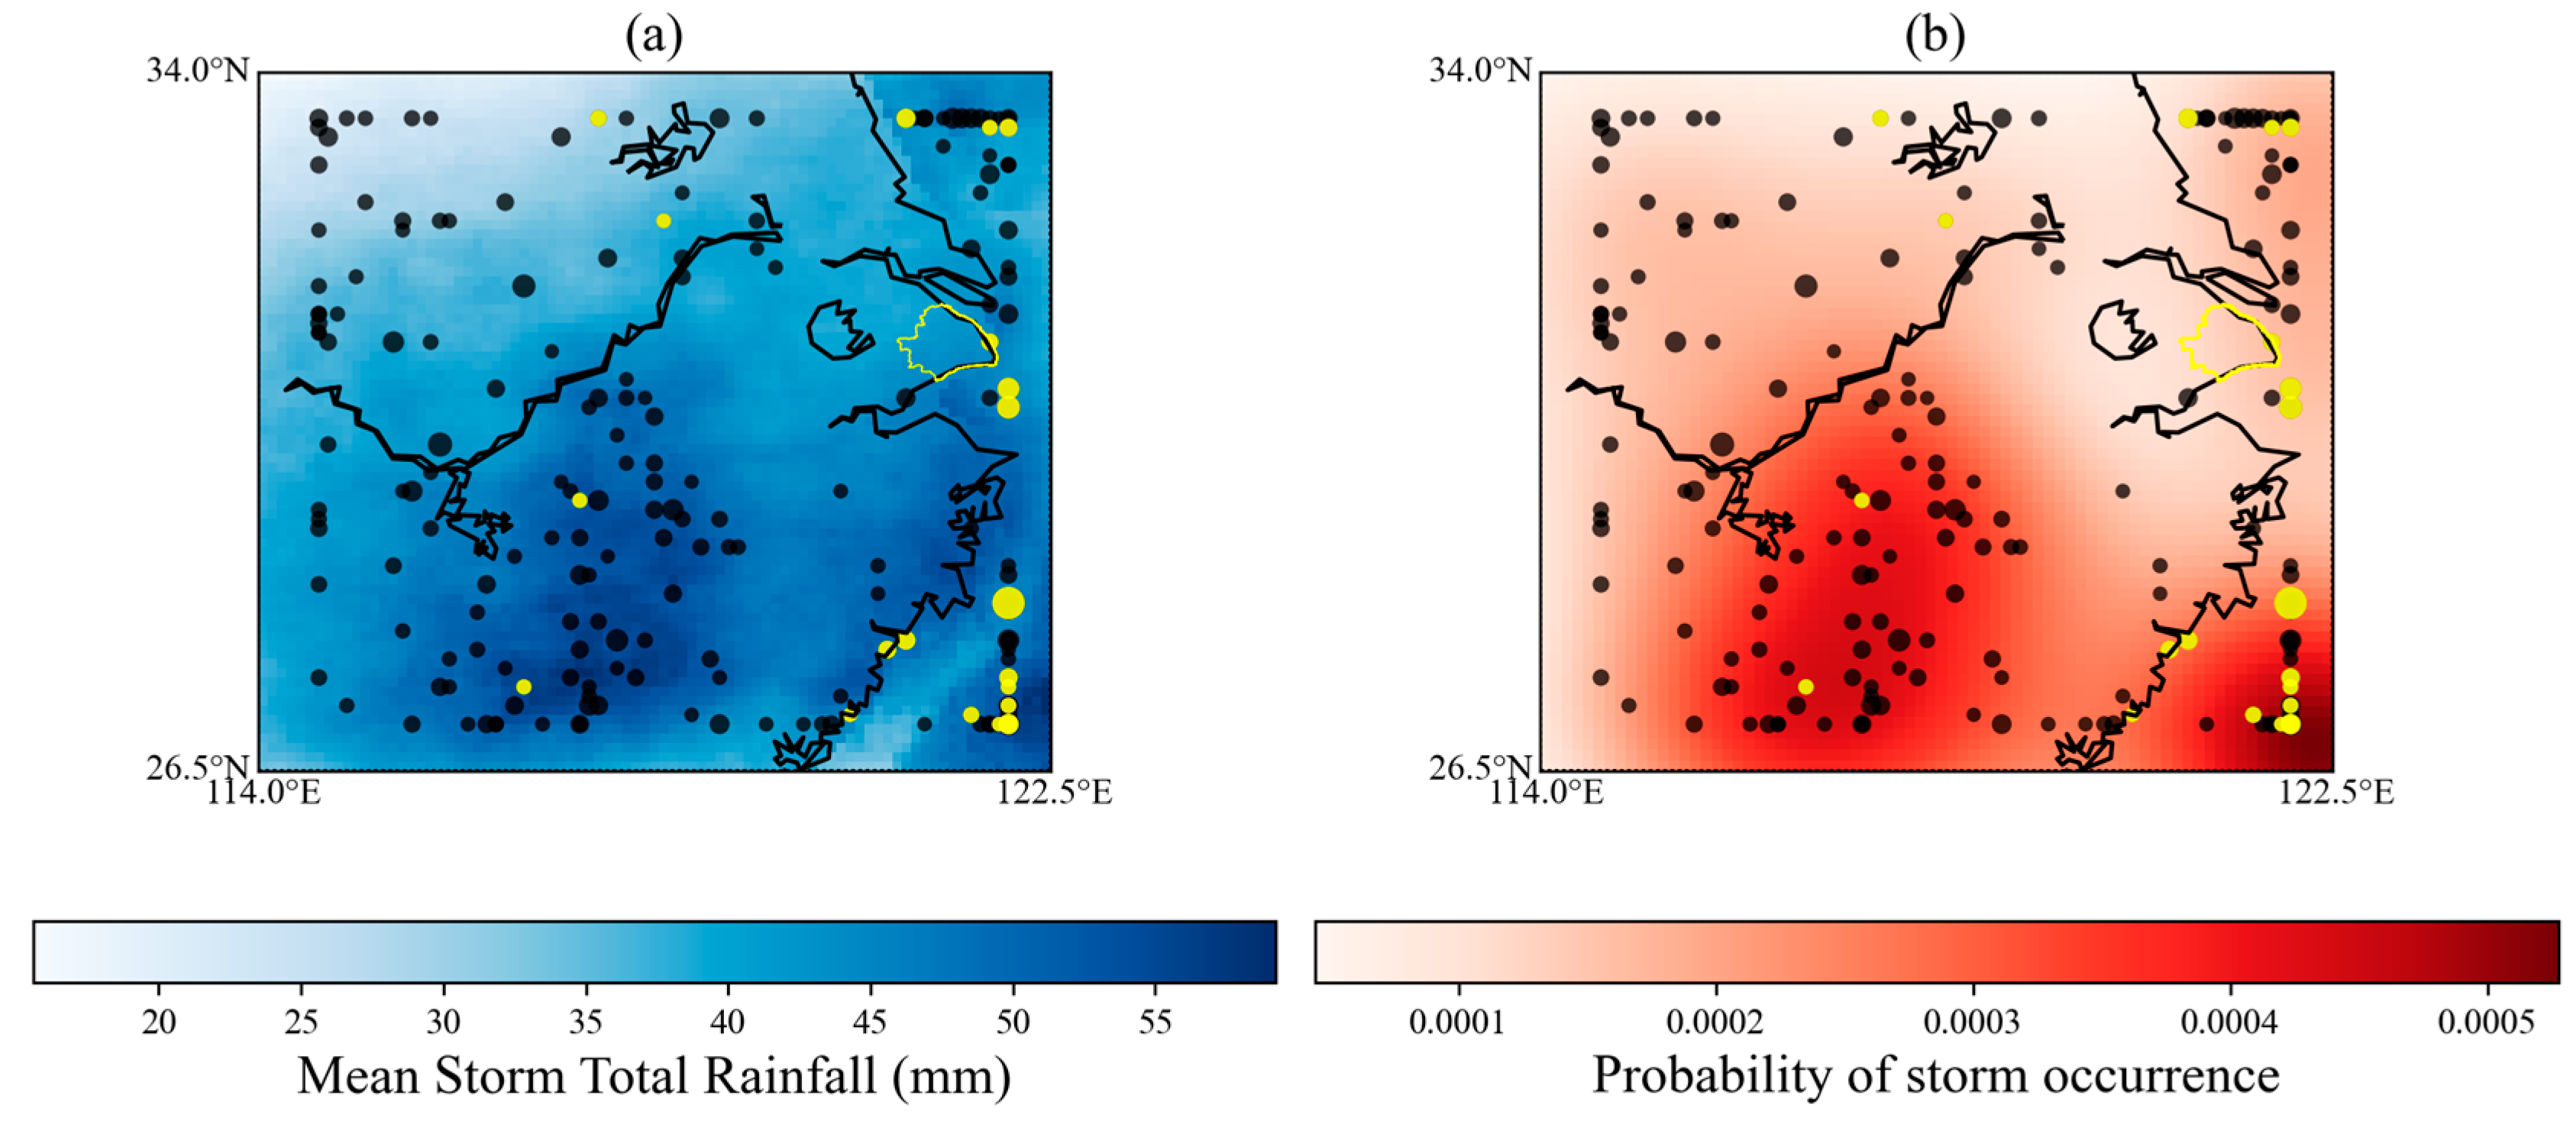
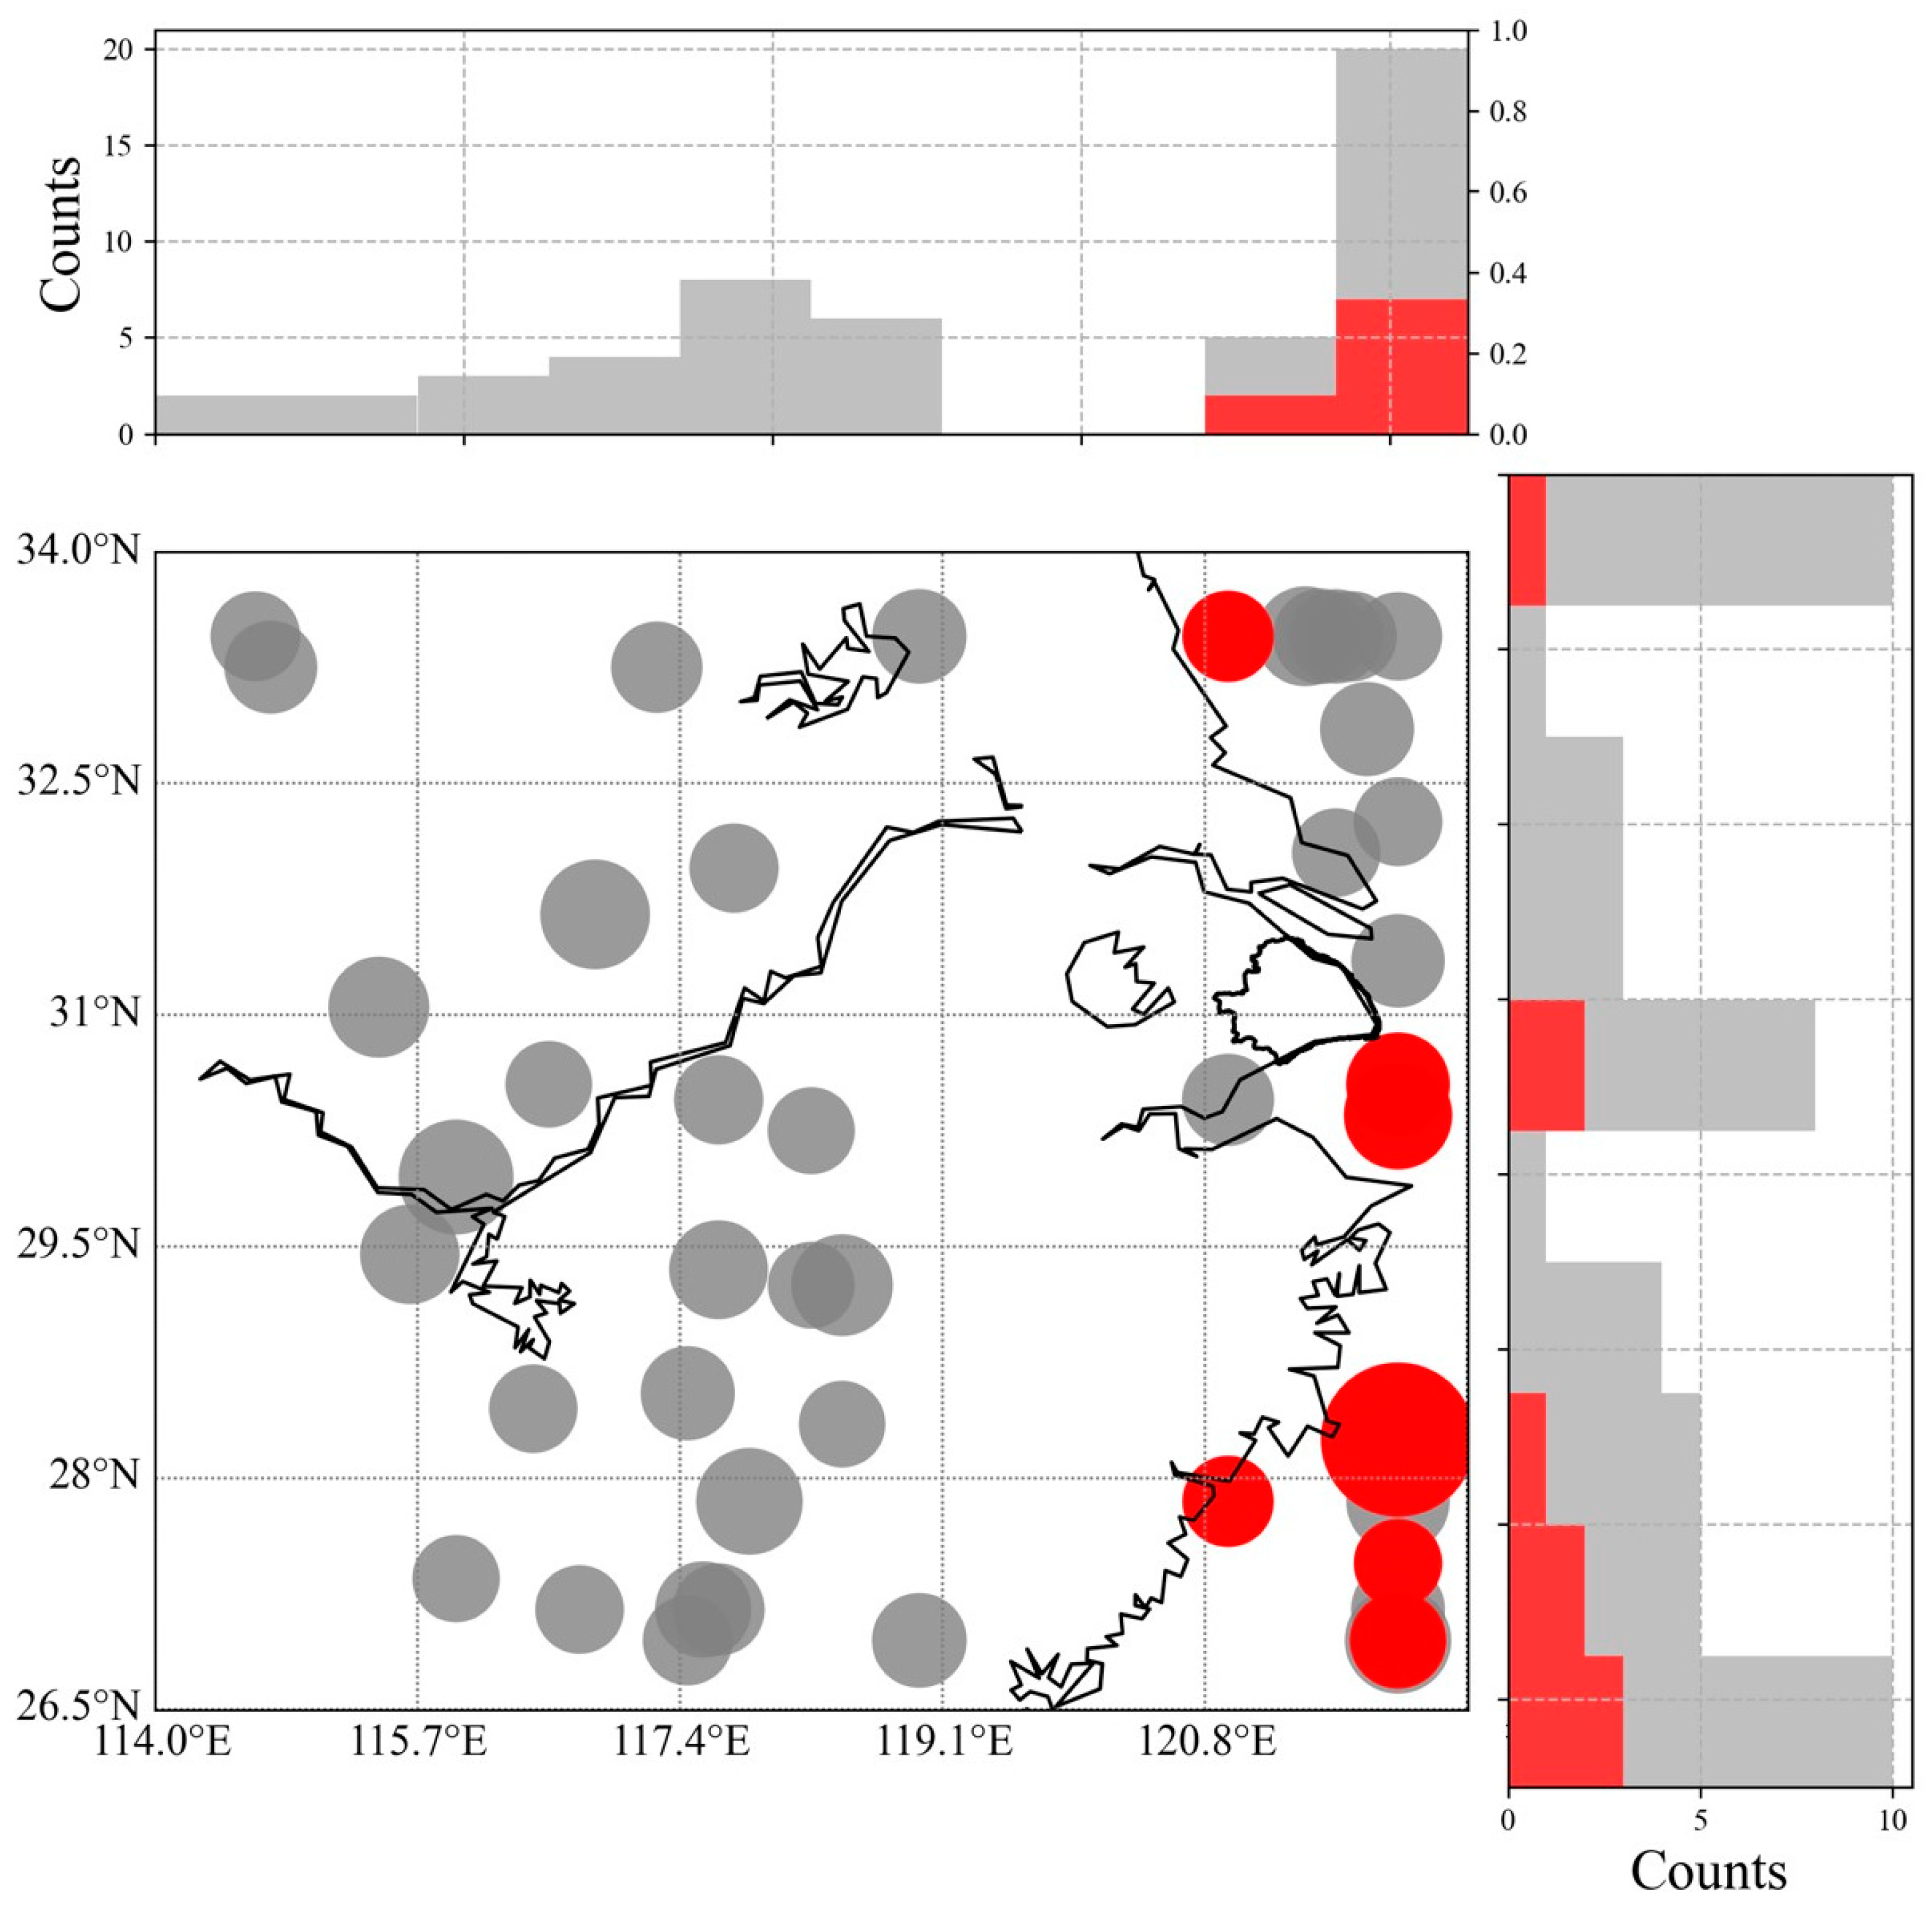
3.1.3. The Spatial Distribution of Storm Events

To demonstrate the spatial heterogeneity of extreme rainfall events, we use the 72 h storm catalog as an example to explore the spatial distribution of storm events. The spatial distribution of the largest 50 storm events in this storm catalog is selected to show the spatial distribution characteristics of extreme rainfall in the region (Figure 6). The storm events show an increasing trend from west to east in the east–west direction, and there is no obvious change in the north–south direction. Extreme rainfall events mainly occur in the eastern coastal area, and the frequency of storm events is higher in the area range of 115–118° E. In terms of the storm event intensity (circle radius) distribution, the heaviest storm events occur in the southeastern coastal area of the transposition domain. Typhoon events accounted for 18% of the maximum 50 events in the storm catalog and were mainly concentrated in the eastern coastal area. The above results show that there is a more pronounced heterogeneity in the spatial distribution of extreme rainfall in this displacement area.

3.2. The Typhoon Events

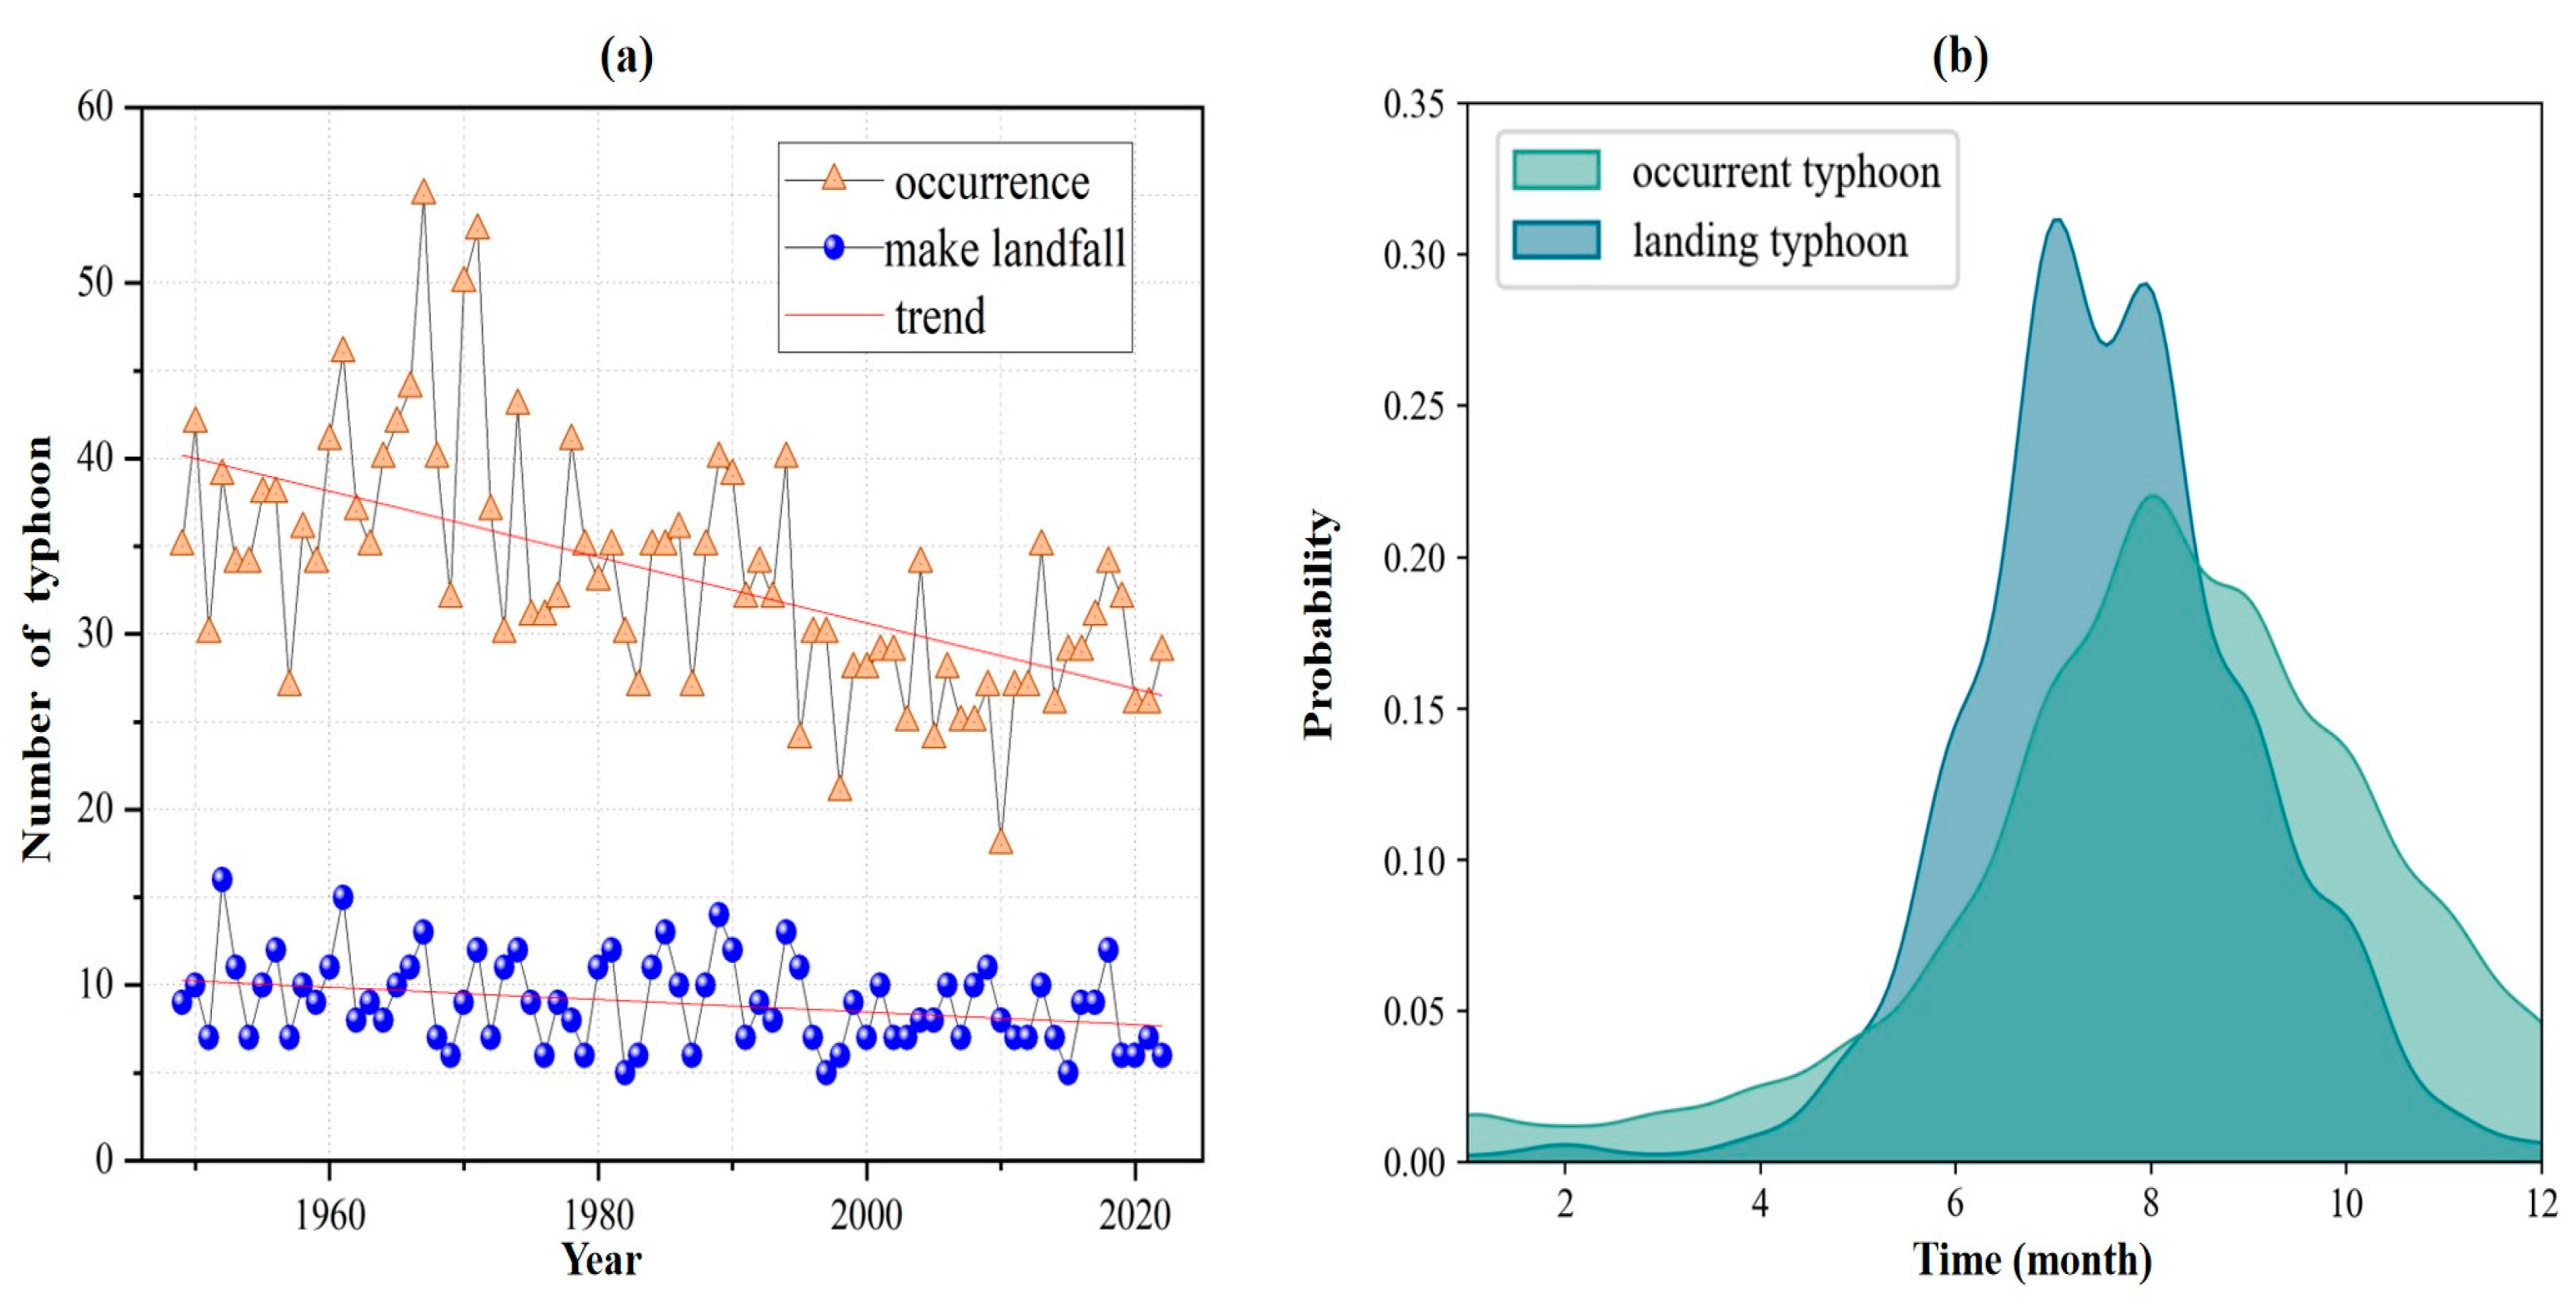
3.2.1. The Occurrence of Typhoon Events

Typhoon events occur with a high frequency in the coastal areas of China [56,57]. From 1949 to 2022, the CMA dataset recorded 2648 typhoon events and 664 landfall typhoon events in the Western Pacific. From 2000 to 2022, the CMA dataset recorded 643 typhoon events and 184 landfall typhoon events in the Western Pacific. In terms of the inter-annual variability, typhoon generation shows a decreasing trend according to the MK trend significance test, and the number of landfall typhoon events does not show a significant trend (Figure 7a). The average landfall ratio of typhoon events was 27.25%, showing an increasing trend, but did not pass the MK trend significance test. In the intra-annual distribution, both typhoon event generation and the number of landfalls showed significant inhomogeneity (Figure 7b). The most extreme frequency of typhoon generation in the Western Pacific occurs in August, with more than 63% of typhoon events occurring in June–September and a lower frequency of typhoon events in January–May. The most extreme frequency of landfall typhoon events occurs in August, with more than 73% of landfall events occurring in July–September and more than 93% of landfall events occurring in June–September, while the frequency of landfall events in January–May is extremely low, with only one landfall typhoon event occurring in January in the past 63 years. The analyses show a decreasing trend in the frequency of typhoon events over the study periods, with a clear seasonality pattern within years. The number of landfall typhoon events shows an insignificant change in between years, with a more pronounced seasonal pattern in the intra-annual distribution.

3.2.2. The Spatial Distribution of Typhoon Events

The cumulative rainfall at China’s national meteorological stations within the spatial and temporal ranges of typhoon event impacts is interpolated to reflect the cumulative typhoon rainfall magnitude during 1949–2022. The typhoon rainfall shows a decreasing trend from south to north and from coast to inland (Appendix A, Figure A2). The maximum rainfall accumulation is in the east, with a cumulative rainfall of about 15,900 mm. The cumulative rainfall shows a decreasing trend from the southeast to the northwest, while the northwest has the smallest rainfall, of about 1230 mm, with a significant difference in magnitude. The most extreme value of typhoon accumulation in the study area is in the northwest, with a cumulative rainfall of 11,010 mm. Typhoon rainfall shows a decreasing trend from southwest to north, with the smallest amount of rainfall at the northern boundary, about 8240 mm. The cumulative rainfall shows significant magnitude differences, with the same characteristics in the spatial distribution of typhoon rainfall as those of the typhoons selected using the SST (Figure A1c).
The spatial distribution characteristics of typhoon rainfall identified in the 3, 12, 24, and 72 h storm catalogs in the transposition domain are shown (Appendix A, Figure A3a–d). The typhoon rainfall is widely distributed in the transposition domain, and the distribution of short-duration typhoon rainfall is rare, with a greater impact in the south and north of the transposition domain. Typhoon rainfall is widely distributed in the displacement area, and the distribution of short-duration typhoon rainfall is irregular, with a greater impact in the southern and northern parts of the displacement area. The 24 h rainfall shows a decreasing trend from south to north, and the 72 h rainfall study area shows a decreasing trend from west to east. The rainfall centers are mainly concentrated in the southeastern coastal areas, and some of the rainfall centers for the long-duration typhoon events are in the central part of the transposition domain. The spatial distribution of typhoon rainfall with different durations in the storm catalogs is slightly different in Shanghai, mainly showing a decreasing trend from south to north. The distribution of typhoon rainfall events within the transposition domain shows a decreasing trend from the southeast coastal area to the northwest inland, and the study area of Shanghai is highly affected by typhoon rainfall.

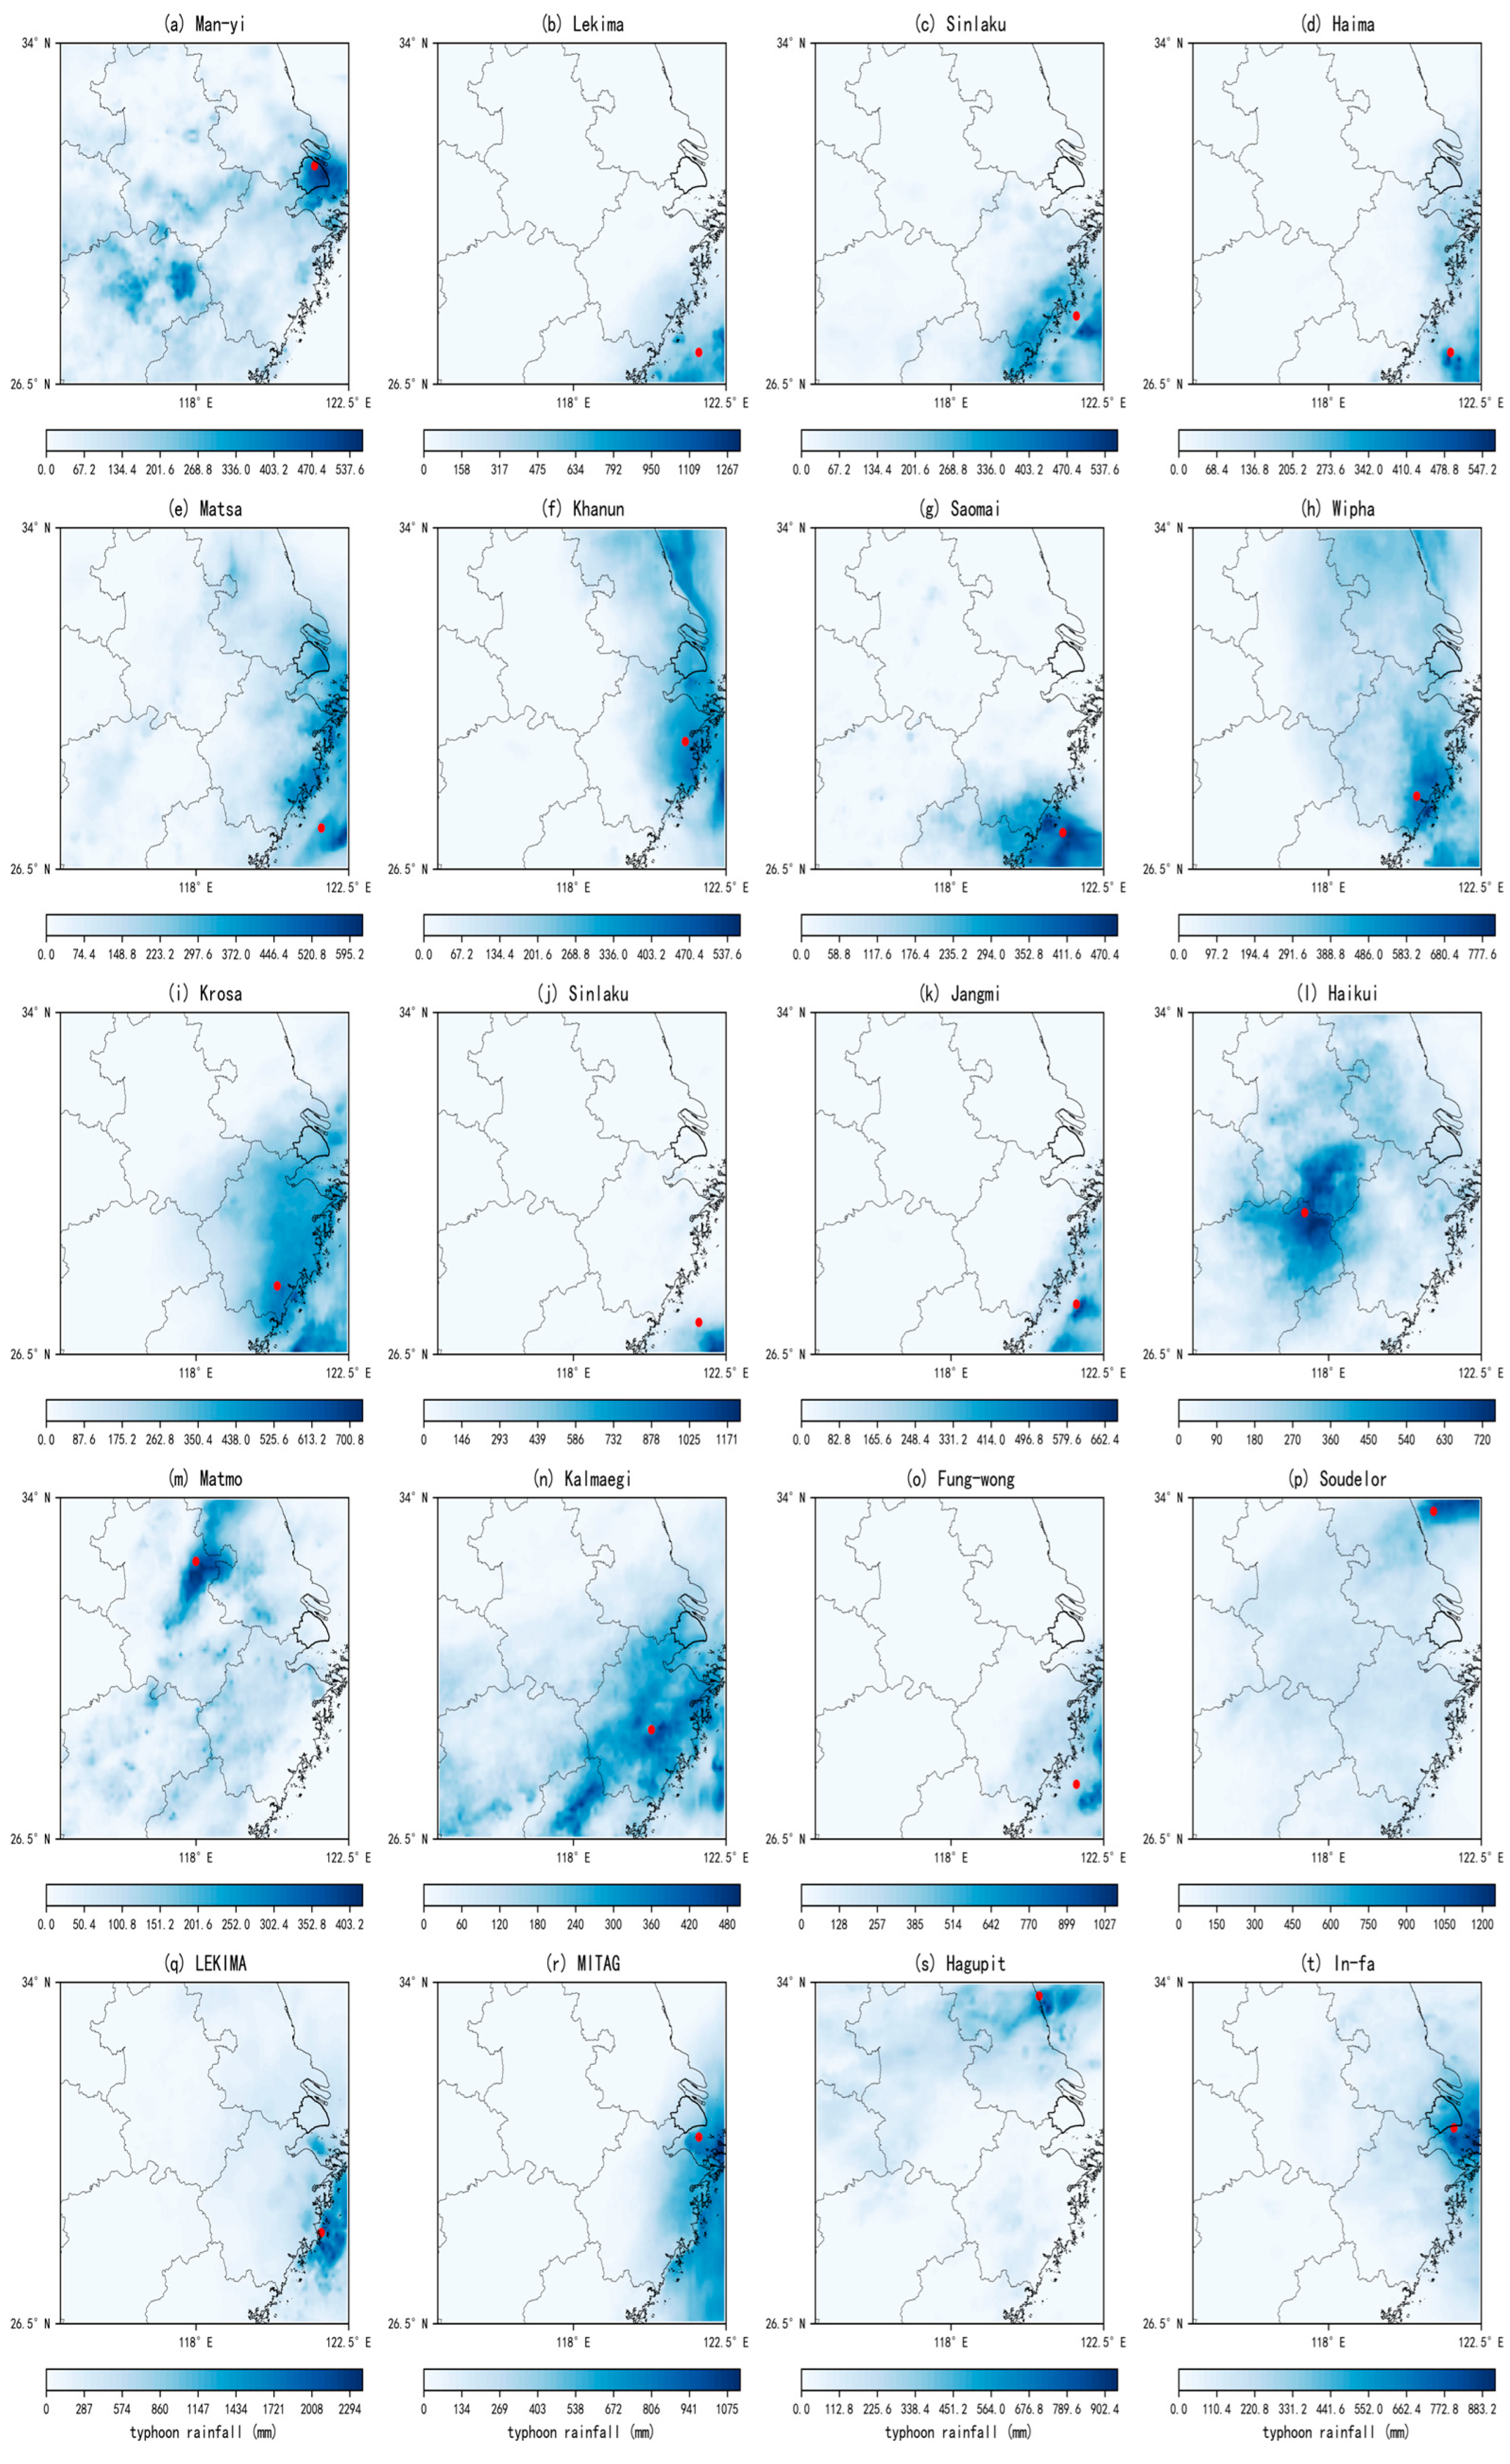
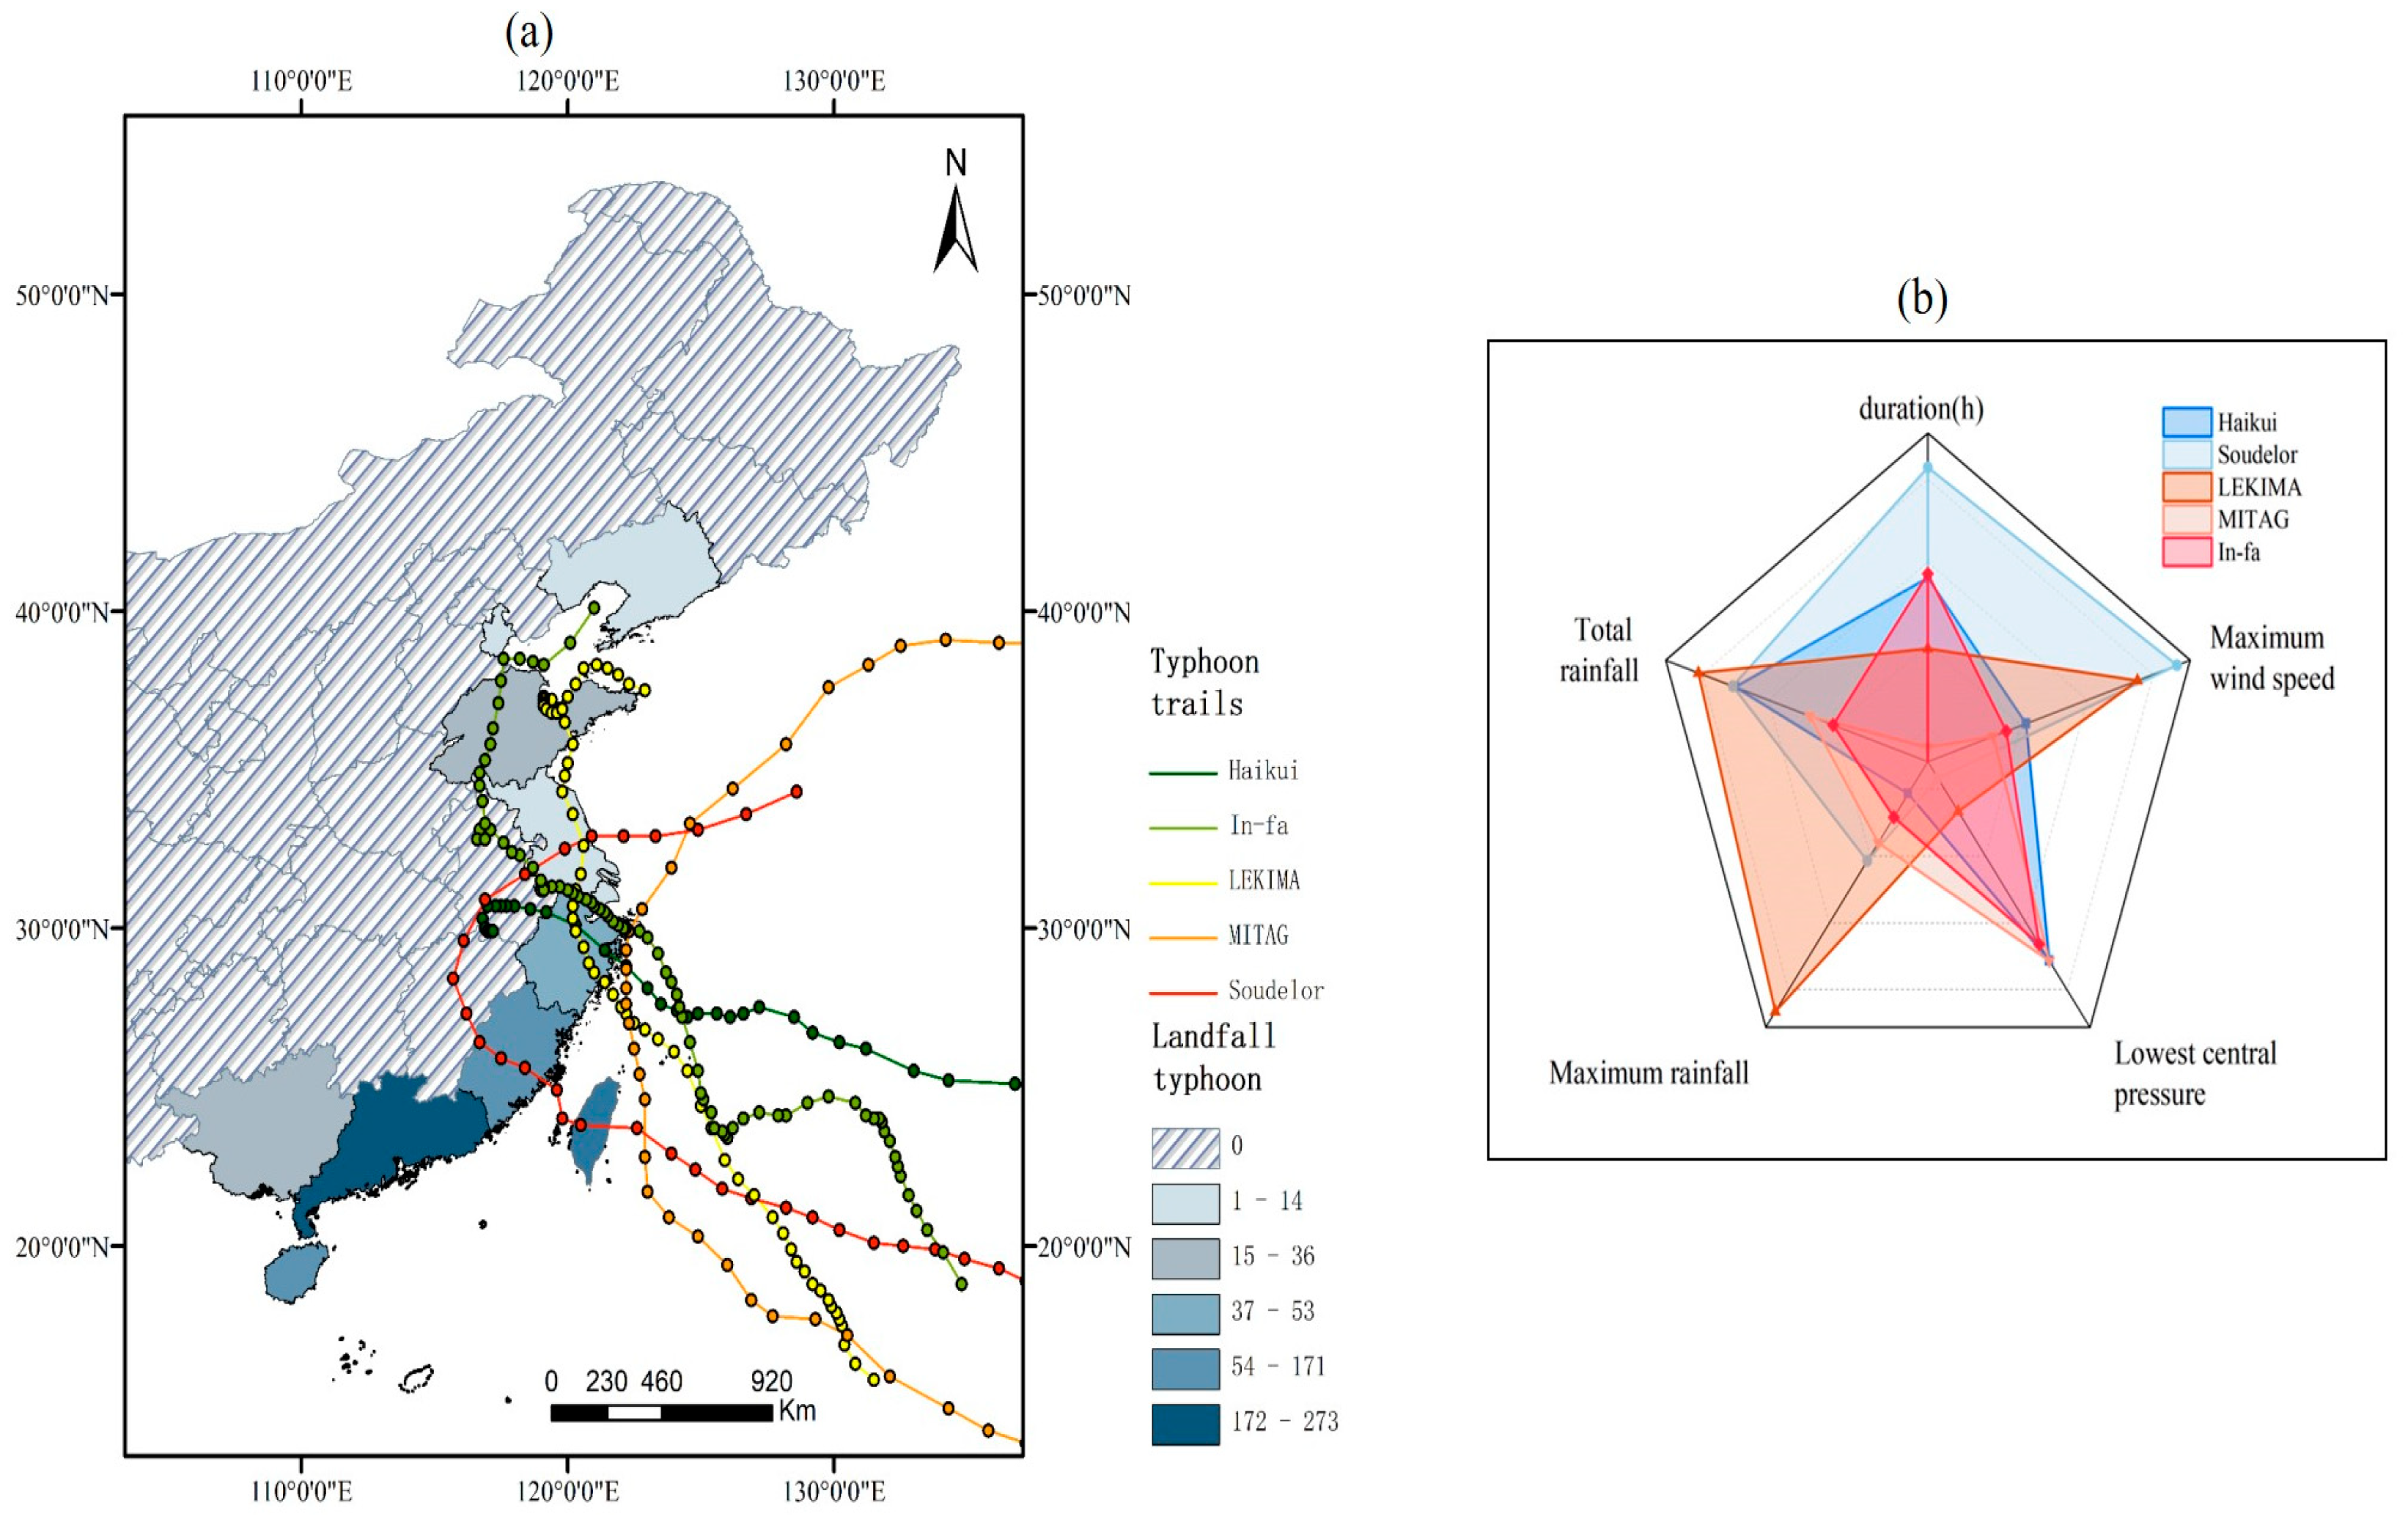
3.2.3. The Characteristics of Selected Typhoon Events

In the storm catalogs of four durations, about 20–24 different typhoon rainfall events are selected (Table 1). Identification of typhoons is shown in Section 2.3. We use the 72 h storm catalog with 20 typhoon events (Table 2) as an example to analyze the characteristics of the typhoon events.
The rainfall for each identified typhoon event is plotted over a 72 h duration (Appendix A, Figure A3). The centers of the typhoon rainfall events are mainly concentrated in the southwestern coastal area of the transposition domain, and two of them are centered in the central part of the transposition domain, with obvious characteristics of typhoon rainfall event distribution. The spatial distribution characteristics of the typhoon rainfall events are characterized by the coefficient of variation (Cv), and the Cv of the typhoon events ranges from 0.894 to 4.073, which shows that the spatial aggregation characteristics of each typhoon event vary significantly.
C v = i = 1 n ( x i x ¯ ) 2 x ¯
in which x i is the rainfall value in the center of the ith grid cell, x ¯ is the average rainfall of all grid cells over the observed scene, and n is the number of grid cells.
The Sinlaku event, which occurred in 2018, had the highest Cv value, a high spatial aggregation of rainfall, and a narrow event impact area, but the maximum rainfall intensity of the event was relatively large, and the heavy rainfall had a high regional impact (Appendix A, Figure A3j). The Soudelor event, which occurred in 2015, had the lowest Cv value, and although there was a large aggregation of rainfall in extremes, the heavy rainfall covered a large area, and the event had a wide range of impacts (Appendix A, Figure A3p). Another unnamed typhoon event that occurred in 2014 had similarly low Cv values, but the event had a low spatial aggregation of extreme rainfall and a high extreme rainfall coverage area. The rainfall center was located in a land area, with a wide range of impacts and intensity (Appendix A, Figure A3n). Analysis of the impact of typhoon events on the study area shows that 7 out of 20 typhoon events had an impact on the study area with extreme rainfall and 5 typhoon events with heavy rainfall impacted the study area. The above results show that different from local convective storms, the spatial aggregation of typhoon events is generally large, and the impact of heavy rainfall is large-scale.
Based on the total rainfall amount and rainfall intensity, five representative typhoons are selected in this study to demonstrate the characteristics of typhoons. Taking the selected typhoons Haikui, Soudelor, LEKIMA, MITAG, and In-fa as examples, a comparative analysis of the characteristics of the five typhoon events and the paths of the typhoon centers is presented (Figure 8). The intensity of the maximum rainfall and the magnitude of total rainfall are more or less consistent for each typhoon event, except for the Haikui event. The Haikui event had the second highest total rainfall and the lowest maximum rainfall intensity. Comparison with Appendix A, Figure A3 shows that the 72 h rainfall center of Haikui was farther away from the ocean as the end point of its typhoon track, which characterizes the rainfall characteristics of a typhoon that moves farther after landfall. The minimum central pressure of the typhoon has a significant negative correlation with the maximum central wind speed, and the correlation coefficient with the maximum rainfall intensity is 0.44, which is not significant. The most extreme value for the minimum central pressure occurred in the Souderlor event. The regularity of the characteristics of typhoon events is not obvious, and the rain pattern varies greatly, so there may be large uncertainty in the generalized calculation of typhoon rainfall using a predetermined rain pattern according to the traditional method.

3.3. SST-Based Frequency Analysis

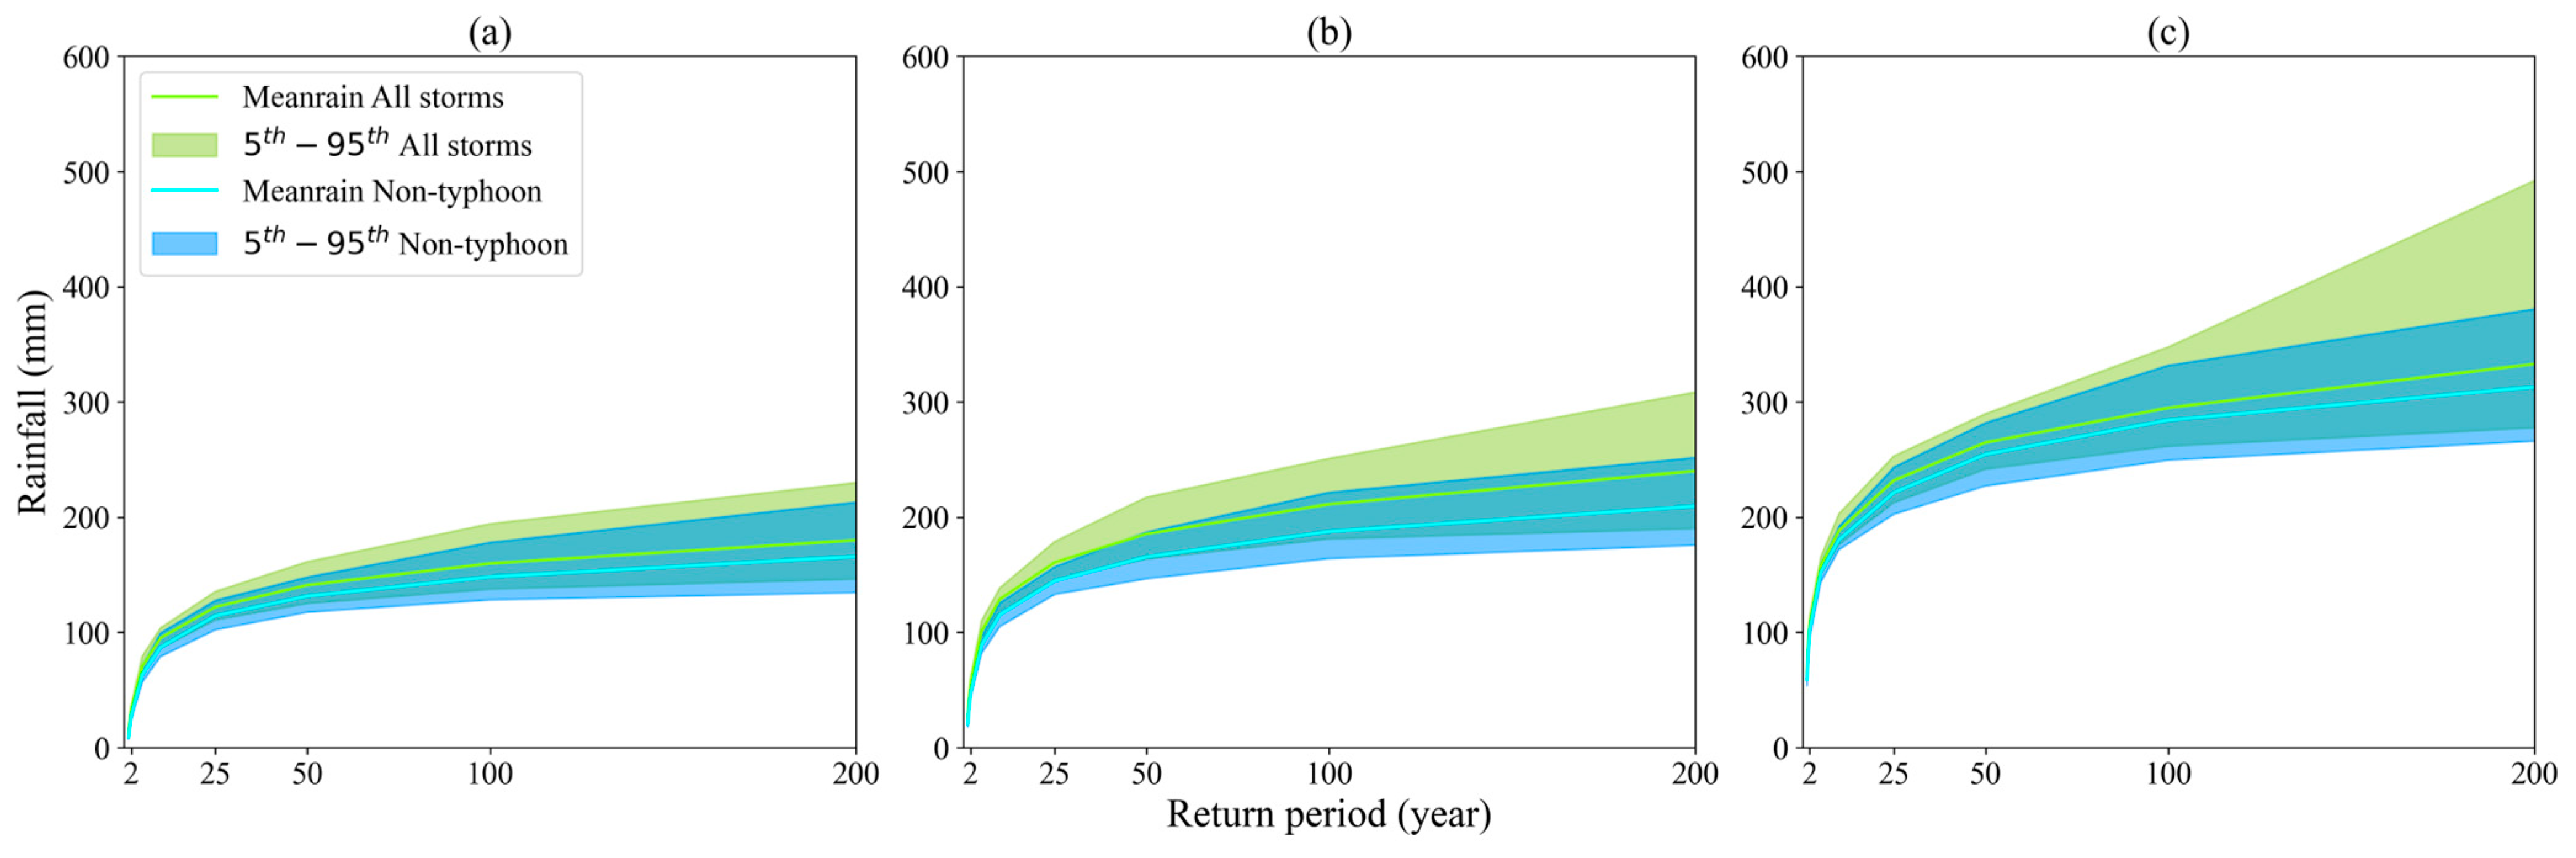
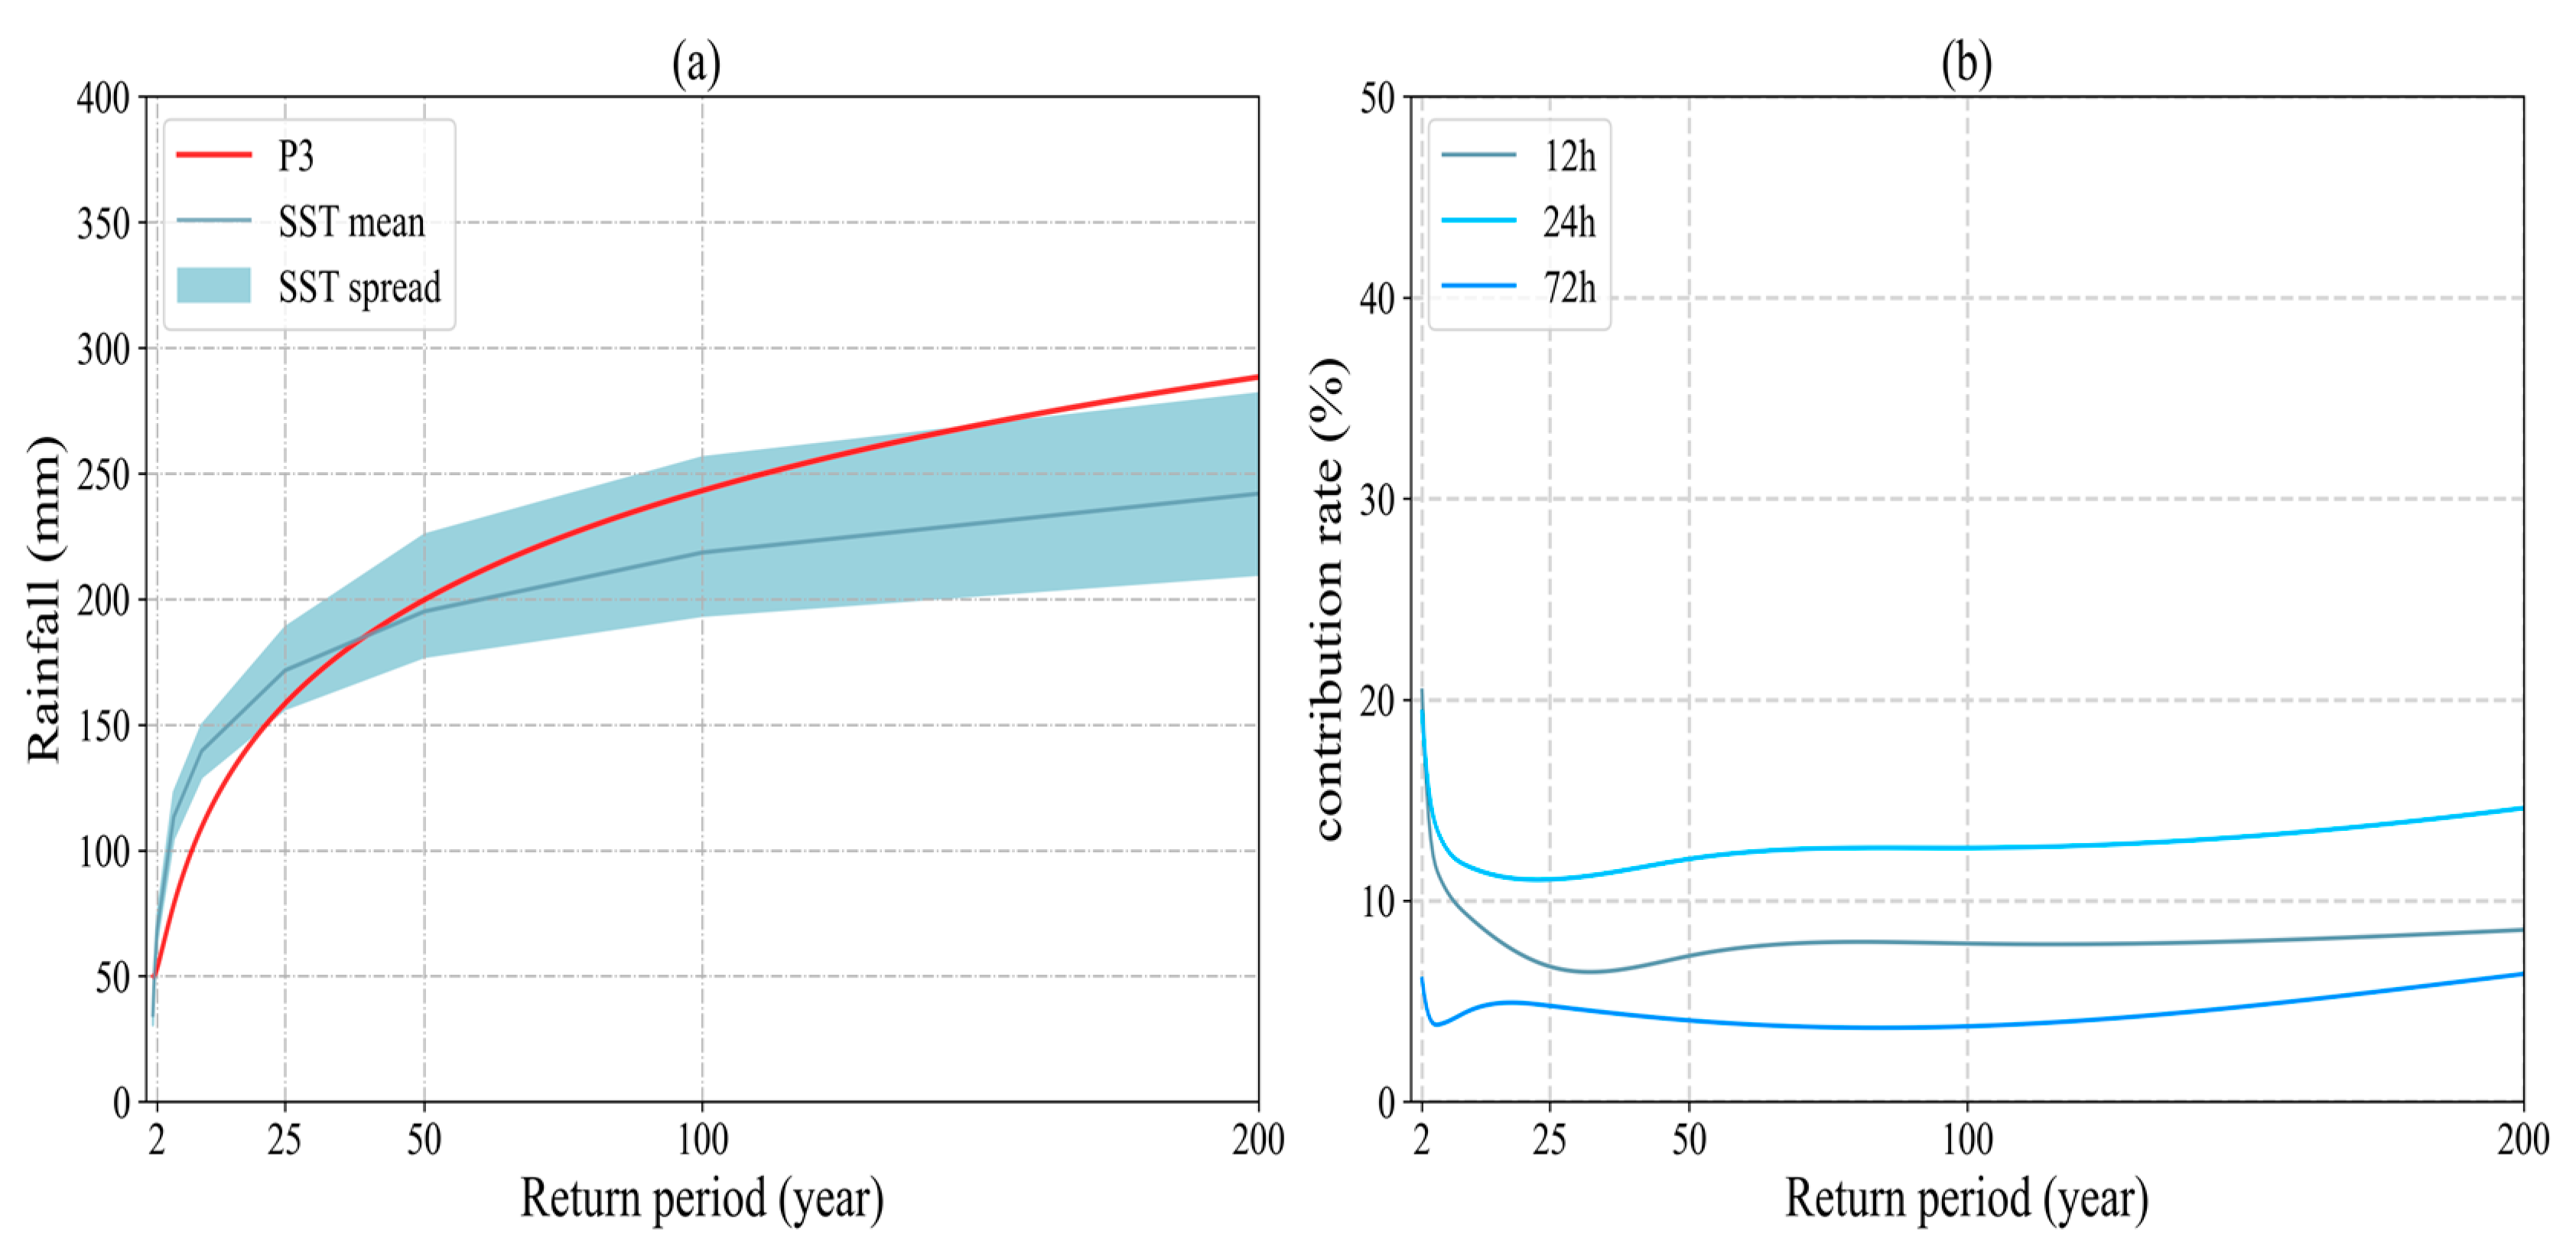
3.3.1. IDF Estimated Value

Based on the 3, 12, 24 and 72 h storm catalogs, 500 maximum rainfall sequences of N = 1000 years are generated according to steps (3) and (4) in the SST method, under the two categories of including all storm events and excluding the typhoon events, respectively. Design storm intensity estimation is performed, which is represented by an intensity–duration–frequency (IDF) curve. The upper and lower intervals of the IDF curve are the 95th and 5th quartiles of the 500 estimates generated using SST, respectively, and the true value of the IDF curve is represented by the median of the estimates (Figure 9).
The SST results are compared with the results of conventional frequency analysis based on the method of moments estimation (Figure 10). The Pearson type-III distribution function is a theoretical line shape widely used in hydrological calculations, and the method of moments estimation based on this distribution is widely used in design storm analysis in many regions. The 24 h duration SST estimates are more similar to those calculated using the method of moments estimation, but the overall results are lower than those estimated using the method of moments estimation. The SST method gives slightly larger values than the method of moments estimation when the return period is less than a 25-year return period and smaller values than the method of moments estimation when the return period is greater than a 140 y return period. It can be concluded that the design storm results obtained using the SST method are reasonable and reliable.
To explore the impact of typhoon events on the rainfall frequency analysis, we compare the IDF curves generated from the storm catalogs with and without the typhoon events (Figure 10). The design storm intensity from the SST based on all storm types is larger than that without typhoon events, and the effect of typhoon events on the design storm intensity decreases with an increase in the return period and eventually stabilizes. For the 12 h duration, the impact of typhoon events on the 5-year return period is 11.29% and on the 25-year return period is 6.73%. The intensity of the impact eventually converges to 7.5%. Typhoon events have the most impact on the intensity of the 24 h duration design storm with 12.08% using a 50-year return period and the least impact on the 72 h duration design storm, with 4.05% using a 50-year return period. The SST estimation confidence intervals become larger when the typhoon rainfall is included, and the range of the confidence intervals increases with increases in the rainfall duration and return period. From the above analyses, it can be concluded that the contribution of typhoon events to the SST-based design storm rainfall intensity is not negligible, with a significant impact in the 24 h duration.

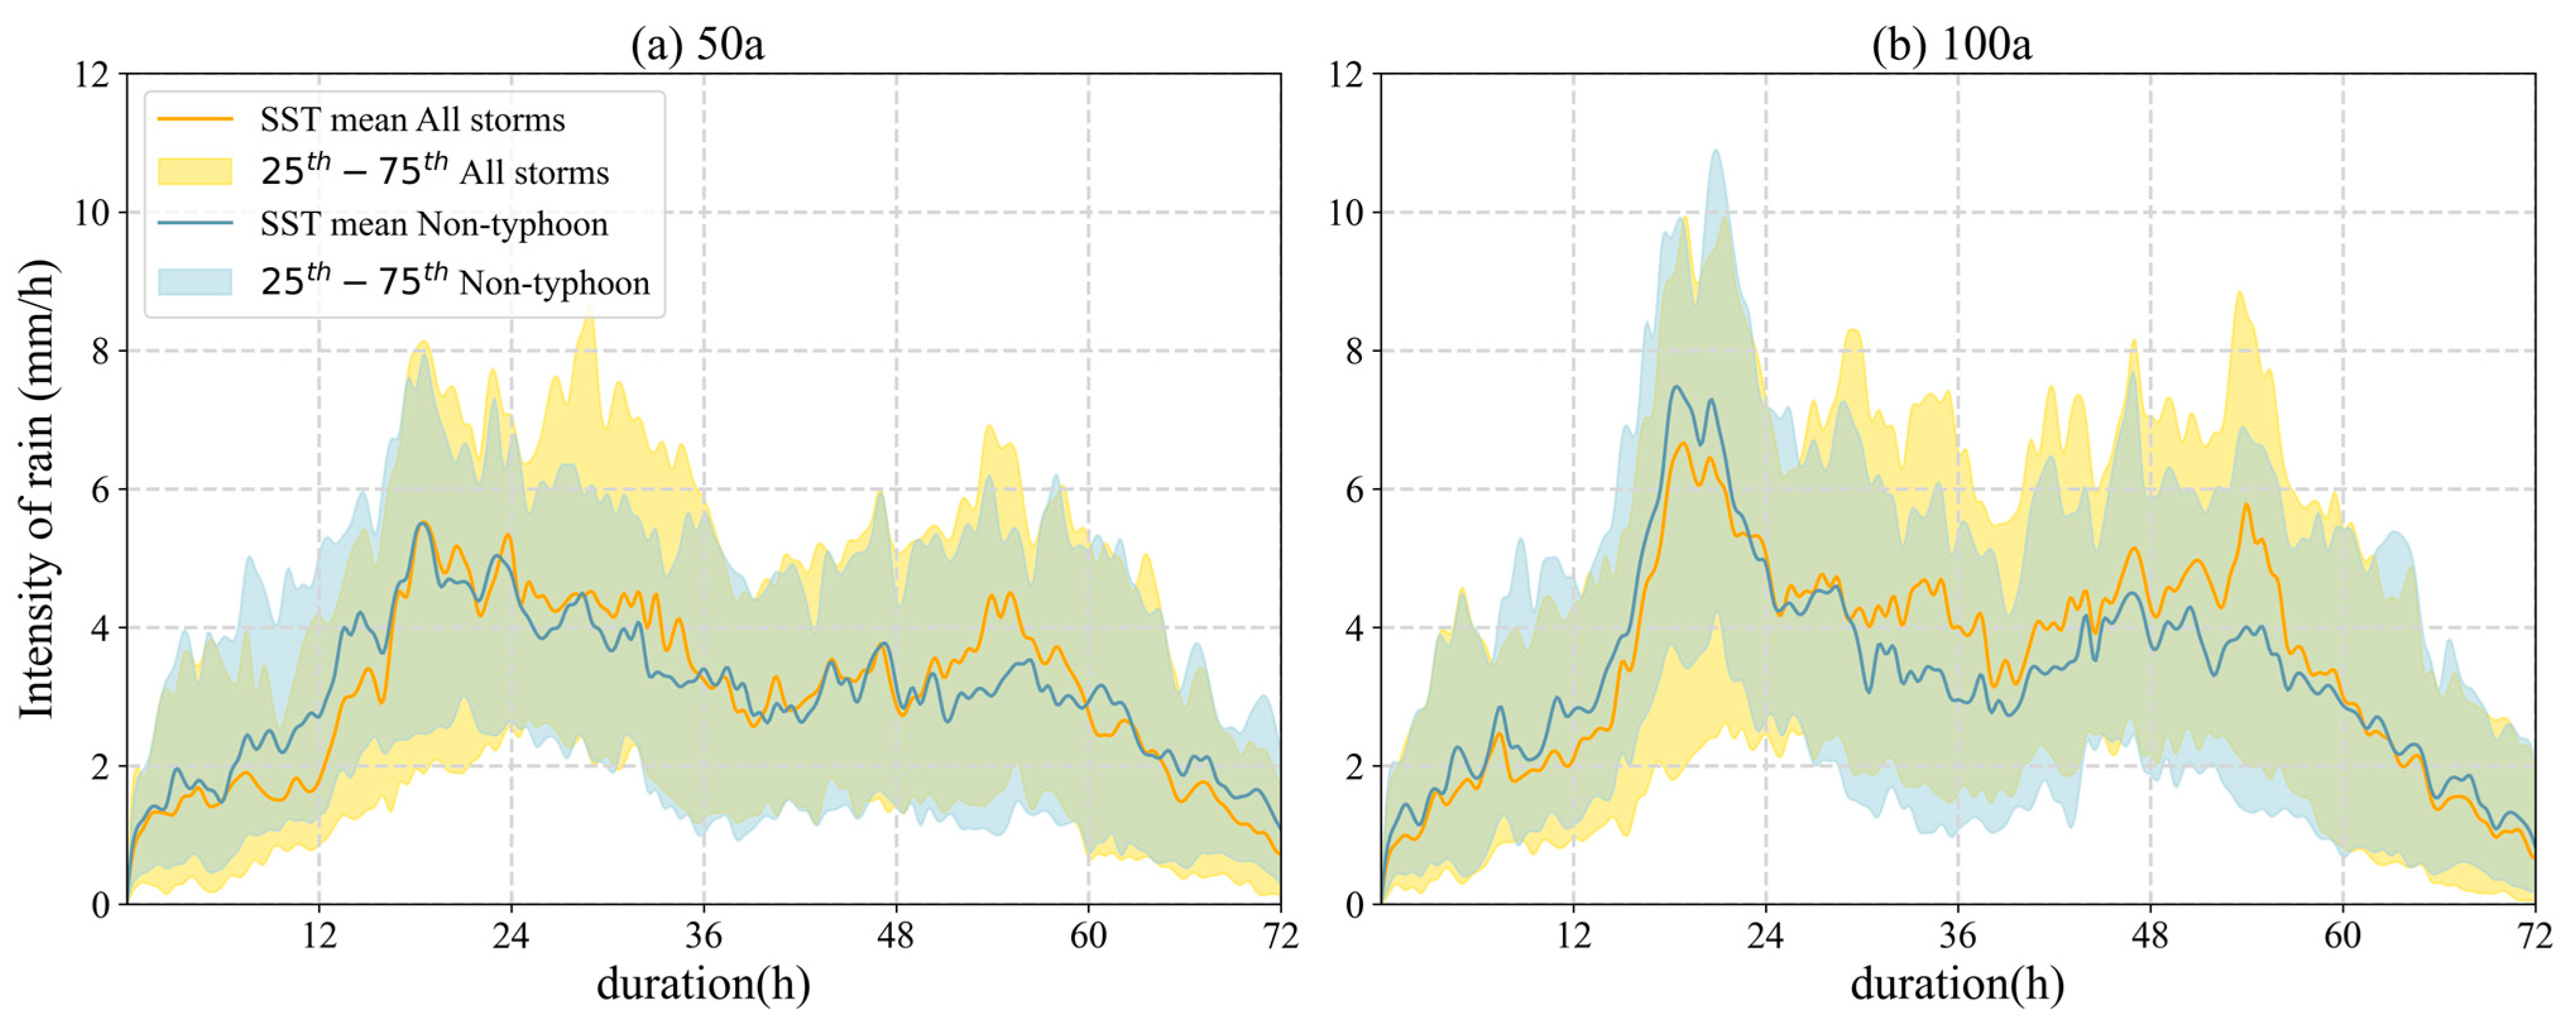
3.3.2. The Temporal Process of the SST-Based Design Storm

The SST-based design storm estimation contains not only the rainfall estimates under each return period but also the temporal process of the hyetographs, which is of vital importance in the flood control design standards. Taking the 72 h design storm as an example (Figure 11), the variability in the rainfall mechanism is high for different return periods but reduces as the return periods increase. A rainfall hyetograph based on all types of storms tends to have dual peaks at the 50-year and 100-year return periods, indicating that the standard single-peak rainfall hyetograph may not necessarily reflect the genuine storm process. When the rainfall hyetograph estimated using SST is compared for the 50-year and 100-year return periods, the “double-peak trend” in the rainfall hyetograph is larger while typhoon events are included, and the variability in the rainfall process is more severe. Typhoon events have a significant influence on the temporal structure of design storms, increasing their unpredictability and the complexity of the rainfall hyetograph.

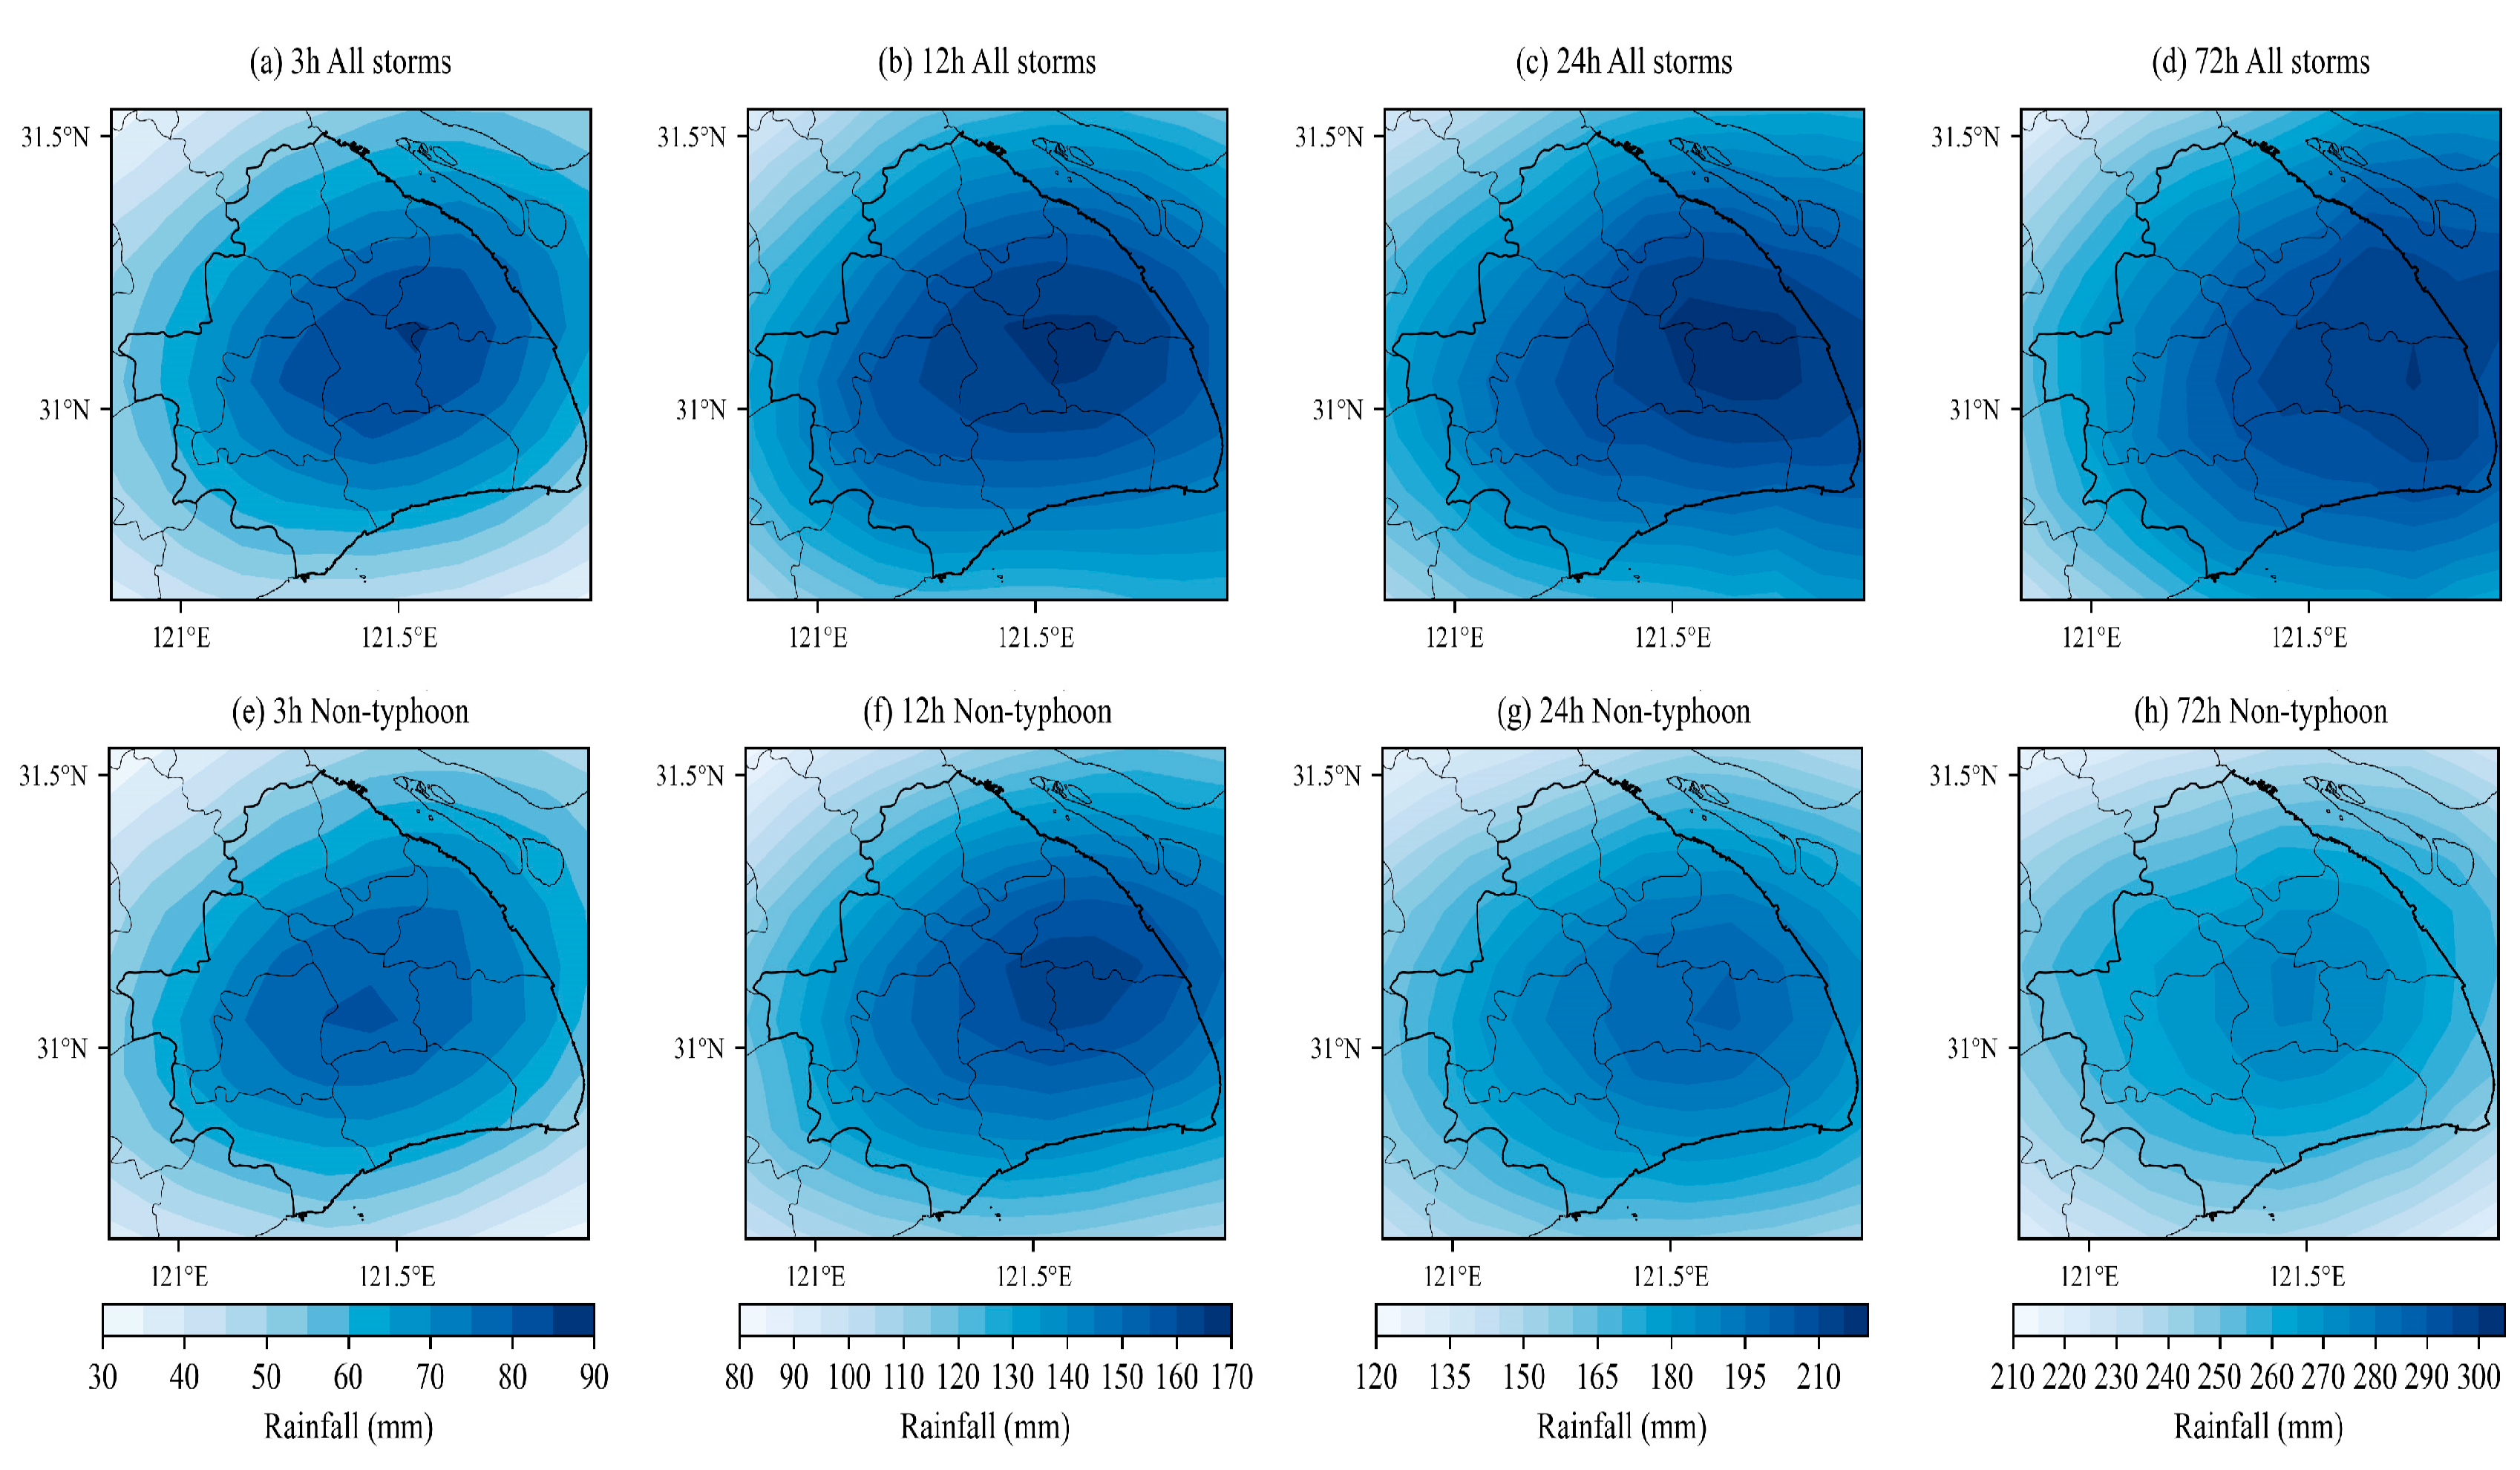
3.3.3. The Spatial Structure of the SST-Based Design Storm

The SST technique eliminates the rainfall field collectively while maintaining the storm catalog’s spatial structure of rainfall (Section 2.2 steps (3) and (4)), allowing for the estimation of the design rainfall’s spatial distribution at each duration. The study demonstrates that, during the 2-year to 200-year return period, the design rainfall is mostly concentrated in the core city areas and diminishes gradually in all directions (Figure 12). The design rainfall for the 500-year return period is concentrated in the northeastern part of the study area; thus, the accuracy of the spatial estimation of the design rainfall using the SST method needs to be further improved for a large return period. As the return period increases, the coverage of extreme rainfall expands, with the rainfall center moving towards the eastern coastal region. Urban areas receive the majority of the short-duration rainfall during various return periods, whereas long-duration rainfall is distributed more widely. This distribution of 3 h and 12 h storms is seen for the return periods larger than 100 years, whereas the distribution of 24 h and 72 h storms is more erratic. There is non-uniformity in the rainfall spatial distribution, which is especially noteworthy for large return periods.
Typhoon events have a considerable influence on the spatial distribution of the SST design storm when comparing the findings of SST estimation based on all storm catalogs. Using the 50-year return period design storms for each duration as an example, we can see that the trend in decreasing rainfall from the west is more clearly reversible, the north–south and east–west spatial variability increases, and the center of the SST design storms move west when ignoring the occurrence of typhoon events.

4. Discussion

4.1. The Uncertainties of the SST Method

When comparing the results of SST estimation with those obtained using the method of moments estimation, it is observed that the SST method yields slightly larger estimates than the method of moments in the context of a short duration. Conversely, in the case of a long duration, the SST method produces smaller estimates compared to the method of moments estimation. Previous studies have identified an underestimation of heavy rainfall using the SST method in the context of a large duration. This underestimation may be attributed to the limited capability for GPM satellites to detect heavy rainfall, leading to errors in the identification of extreme rainfall events within the rainfall field. Additionally, it may be influenced by the fact that storms designed for large return periods are primarily derived from the time-shifting of a few storms in the storm catalog, potentially resulting in an upper limit on the estimation value.
Specifically, in the context of a 24 h duration, the rainfall estimates for a 100-year return period are derived from a limited number of rainfall events, with a significant portion of the estimates being attributed to a few specific events. For instance, the typhoon events on “2019-08-09” and “2019-10-02” account for up to 34% of the estimate for a 100-year return period. This heavy reliance on specific rainfall events represents a major limitation of the SST method and is a key factor contributing to the underestimation in the context of large return periods. Furthermore, the dependence on the same rainfall event in the design storm is substantially reduced when typhoon-related rainfall events are excluded, indicating the need for further exploration of the impact of extreme rainfall events in the storm catalog on the selection of SST-transposed storms.
To mitigate the influence of specific rainfall events on the frequency analysis results for large return periods, future studies may consider introducing different intensity factors for the classification of events in the storm catalog, which could help regulate the magnitude of the displaced storms and improve the accuracy of the estimation results.

4.2. The Impact of Typhoon Rainfall on the SST Estimation Results

The spatial aggregation of extreme rainfall in typhoon events is typically extensive, and heavy rainfall has a widespread impact on the study area, which is highly susceptible to typhoon rainfall. The regularity of the distribution of typhoon rainfall at different durations within the transposition domain is not apparent. Therefore, a Gaussian kernel density distribution can be used to fit the distribution of the typhoon rainfall for further storm displacement. The characteristics of the typhoon events lack obvious regularity, and the rainfall patterns vary significantly. Consequently, there may be substantial uncertainty in generalizing typhoon rainfall using predetermined rain patterns according to the traditional method. In contrast, the SST method employed in this study preserves the rain pattern characteristics of extreme rainfall events, which facilitates the exploration of the influence of various typhoon rainfall characteristics on frequency analysis.
This study established two sets of SST-based rainfall frequency analysis systems, one including all storm types and one excluding the typhoon events, to assess the sensitivity of the SST method to the extreme rainfall events exemplified by typhoons (specifically, the LIEKIMA typhoon that occurred on 3 August 2019). Furthermore, the impact of typhoon events on the results of the design storm frequency analysis is analyzed in terms of the magnitude, rainfall hyetograph, and spatial distribution. The contribution of typhoon events to extreme events is separated out to further explore the direct impact of different extreme storms on the design storm intensity under changing environments. In the context of large return periods, there is a notable augmentation in the contribution of typhoon rainfall. The variability in the design storm estimates in the absence of typhoon events is relatively minor, apart from in the case of small return periods, where the variability in the estimates without typhoon events is considerably greater. Within the 24 h durations, the spatial correlation of typhoon events in the 24 h storm catalog is the most pronounced. A comparison of the rainfall hyetographs of the typhoon events reveals that these events exhibit a higher level of rainfall accumulation over 24 h. An examination of the return periods demonstrates that typhoon rainfall events during a 24 h duration have the most substantial impact under large return periods (Table 3). Furthermore, the variability in the design storms experiences a significant increase when typhoon events are taken into account.
The study area is affected by many different types of extreme rainfall other than typhoon events, such as plum rain and monsoons. In subsequent research, the SST method could be refined by integrating the characteristics of various types of extreme rainfall variability. In the future, it may be feasible to investigate the impacts of various types of extreme rainfall on the estimation outcomes of SST, thereby establishing a foundation for mitigating the uncertainty of the findings and enhancing the interpretability of the model.

5. Conclusions

In this study, we examined the magnitude, occurrence, and mechanism of typhoon events in southeast coastal China and their contribution to the design storm study. The main conclusions are as follows.
There is substantial variability in the rainfall magnitude with different rainfall durations, which amplifies with increasing durations. The seasonality of the intra-annual distribution is significant, with a prevalence of more than 65% during the flood season (June–September). There is apparent spatial heterogeneity in the distribution of heavy rainfall over the study area.
The occurrence frequency of typhoon rainfall events in the transposition domain is substantial. The study area is significantly impacted by typhoon rainfall. The rainfall characteristics of the typhoon events display considerable variation, and there is a notable variability in the rainfall distribution across different durations. Typhoon rainfall accounts for the highest recorded rainfall under all durations.
Typhoon rainfall elevates the intensity of the design storm, contributing significantly to the larger return periods and amplifying the variability in the design storm rainfall. The intensity of the design storm for a 24 h duration over a 50-year return period is increased by 12.08% due to the influence of the typhoon rainfall. Furthermore, typhoon events accentuate the “bimodal trend” in the rainfall hyetograph and enhance the variability in the rainfall process. This study segregates the contribution of typhoon events in extreme events to further elucidate the direct effect of various extreme storms on the intensity of the design rainfall under evolving environmental conditions.
The SST method retains the spatial and temporal distribution characteristics of the storm events, thereby facilitating an exploration of the specific impacts of various types of storm events on design storms. In future studies, the design storms derived using SST under diverse storm event conditions can be integrated with corresponding hydrological models to investigate the spatial and temporal distribution of the design storms and the flood response relationship, particularly under the corresponding extreme climatic conditions in urban areas.

Author Contributions

Conceptualization, Y.J. and S.L.; methodology, Z.Z., Q.Z. and Y.J.; software, Y.J.; validation, Y.J., Z.Z. and Q.Z.; formal analysis, Y.J.; investigation, S.L. and Z.Z.; resources, S.L. and M.L.; data curation, Y.J.; writing—original draft preparation, Y.J.; writing—review and editing, Z.Z., Q.Z. and M.L.; visualization, Y.J.; supervision, S.L.; project administration, S.L. and M.L.; funding acquisition, S.L. and Z.Z. All authors have read and agreed to the published version of the manuscript.

Funding

This research was funded by the National Natural Science Foundation of China, grant number 42271031; 42371030.

Data Availability Statement

The NASA GPM-IMERG data can be found at https://gpm.nasa.gov/data/directory (accessed on 30 April 2023). The China Meteorological Administration CMA-TC data can be found at https://tcdata.typhoon.org.cn (accessed on 30 April 2023).

Conflicts of Interest

The authors declare no conflicts of interest. The funders had no role in the design of the study; in the collection, analyses, or interpretation of data; in the writing of the manuscript, or in the decision to publish the results.

Appendix A

Figure A1. Typhoon rainfall accumulation maps in the 3, 12, 24, and 72 h storm catalogs of the transposition domain (ad).
Water 16 00508 g0a1
Figure A2. Typhoon cumulative rainfall, 1949–2022, site space interpolation.
Water 16 00508 g0a2
Figure A3. Rainfall spatial distribution of typhoon events selected in the 72 h storm catalog.
Water 16 00508 g0a3

References

  1. Allan, R.P.; Soden, B.J. Atmospheric warming and the amplification of precipitation extremes. Science 2008, 321, 1481–1484. [Google Scholar] [CrossRef]
  2. Alexander, L.V.; Zhang, X.; Peterson, T.C.; Caesar, J.; Gleason, B.; Tank, A.; Haylock, M.; Collins, D.; Trewin, B.; Rahimzadeh, F.; et al. Global observed changes in daily climate extremes of temperature and precipitation. J. Geophys. Res.-Atmos. 2006, 111. [Google Scholar] [CrossRef]
  3. Trenberth, K.E. Changes in precipitation with climate change. Clim. Res. 2011, 47, 123–138. [Google Scholar] [CrossRef]
  4. Chow, V.T. Handbook of Applied Hydrology; McGraw-Hill: New York, NY, USA, 1964. [Google Scholar]
  5. Paschalis, A.; Fatichi, S.; Molnar, P.; Rimkus, S.; Burlando, P. On the effects of small scale space-time variability of rainfall on basin flood response. J. Hydrol. 2014, 514, 313–327. [Google Scholar] [CrossRef]
  6. Emmanuel, I.; Andrieu, H.; Leblois, E.; Janey, N.; Payrastre, O. Influence of rainfall spatial variability on rainfall-runoff modelling: Benefit of a simulation approach? J. Hydrol. 2015, 531, 337–348. [Google Scholar] [CrossRef]
  7. Arnaud, P.; Bouvier, C.; Cisneros, L.; Dominguez, R. Influence of rainfall spatial variability on flood prediction. J. Hydrol. 2002, 260, 216–230. [Google Scholar]
  8. Tang, G.Q.; Ma, Y.Z.; Long, D.; Zhong, L.Z.; Hong, Y. Evaluation of GPM Day-1 IMERG and TMPA Version-7 legacy products over Mainland China at multiple spatiotemporal scales. J. Hydrol. 2016, 533, 152–167. [Google Scholar] [CrossRef]
  9. Skofronick-Jackson, G.; Petersen, W.A.; Berg, W.; Kidd, C.; Stocker, E.F.; Kirschbaum, D.B.; Kakar, R.; Braun, S.A.; Huffman, G.J.; Iguchi, T.; et al. The global precipitation measurement (gpm) mission for science and society. Bull. Am. Meteorol. Soc. 2017, 98, 1679–1695. [Google Scholar] [CrossRef]
  10. Hou, A.Y.; Kakar, R.K.; Neeck, S.; Azarbarzin, A.A.; Kummerow, C.D.; Kojima, M.; Oki, R.; Nakamura, K.; Iguchi, T. The global precipitation measurement mission. Bull. Am. Meteorol. Soc. 2014, 95, 701–722. [Google Scholar] [CrossRef]
  11. Ebert, E.E.; Janowiak, J.E.; Kidd, C. Comparison of near-real-time precipitation estimates from satellite observations and numerical models. Bull. Am. Meteorol. Soc. 2007, 88, 47–64. [Google Scholar] [CrossRef]
  12. Wright, D.B.; Yu, G.; England, J.F. Six decades of rainfall and flood frequency analysis using stochastic storm transposition: Review, progress, and prospects. J. Hydrol. 2020, 585, 124816. [Google Scholar] [CrossRef]
  13. Alexander, G. Application of probability to spillway design flood estimation. In Proceedings of the Leningrad Symposium on Floods and Their Computation, August 1967; International Association of Scientific Hydrology. 1969. Available online: https://unesdoc.unesco.org/ark:/48223/pf0000014623 (accessed on 30 April 2023).
  14. Yu, G.; Wright, D.B.; Li, Z. The Upper Tail of Precipitation in Convection-Permitting Regional Climate Models and Their Utility in Nonstationary Rainfall and Flood Frequency Analysis. Earth’s Future 2020, 8, e2020EF001613. [Google Scholar] [CrossRef]
  15. Wright, D.B.; Smith, J.A.; Baeck, M.L. Flood frequency analysis using radar rainfall fields and stochastic storm transposition. Water Resour. Res. 2014, 50, 1592–1615. [Google Scholar] [CrossRef]
  16. Gao, S.; Fang, Z. Using Storm Transposition to Investigate the Relationships between Hydrologic Responses and Spatial Moments of Catchment Rainfall. Nat. Hazards Rev. 2018, 19, 04018015. [Google Scholar] [CrossRef]
  17. Wright, D.B.; Smith, J.A.; Villarini, G.; Baeck, M.L. Estimating the frequency of extreme rainfall using weather radar and stochastic storm transposition. J. Hydrol. 2013, 488, 150–165. [Google Scholar] [CrossRef]
  18. Zhu, Z.; Wright, D.B.; Yu, G. The Impact of Rainfall Space-Time Structure in Flood Frequency Analysis. Water Resour. Res. 2018, 54, 8983–8998. [Google Scholar] [CrossRef]
  19. Zhou, Z.; Smith, J.A.; Wright, D.B.; Baeck, M.L.; Yang, L.; Liu, S. Storm Catalog-Based Analysis of Rainfall Heterogeneity and Frequency in a Complex Terrain. Water Resour. Res. 2019, 55, 1871–1889. [Google Scholar] [CrossRef]
  20. Zhou, Z.; Smith, J.A.; Baeck, M.L.; Wright, D.B.; Smith, B.K.; Liu, S. The impact of the spatiotemporal structure of rainfall on flood frequency over a small urban watershed: An approach coupling stochastic storm transposition and hydrologic modeling. Hydrol. Earth Syst. Sci. 2021, 25, 4701–4717. [Google Scholar] [CrossRef]
  21. Zhuang, Q.; Zhou, Z.; Liu, S.; Wright, D.B.; Araruna Junior, J.T.; Makhinov, A.N.; Makhinova, A.F. Bivariate rainfall frequency analysis in an urban Watershed: Combining copula theory with stochastic storm transposition. J. Hydrol. 2022, 615, 128648. [Google Scholar] [CrossRef]
  22. van Oldenborgh, G.J.; van der Wiel, K.; Sebastian, A.; Singh, R.; Arrighi, J.; Otto, F.; Haustein, K.; Li, S.; Vecchi, G.; Cullen, H. Attribution of extreme rainfall from Hurricane Harvey, August 2017. Environ. Res. Lett. 2017, 12, 124009. [Google Scholar] [CrossRef]
  23. Bhatia, K.; Baker, A.; Yang, W.C.; Vecchi, G.; Knutson, T.; Murakami, H.; Kossin, J.; Hodges, K.; Dixon, K.; Bronselaer, B.; et al. A potential explanation for the global increase in tropical cyclone rapid intensification. Nat. Commun. 2022, 13, 6626. [Google Scholar] [CrossRef]
  24. Knutson, T.R.; Sirutis, J.J.; Zhao, M.; Tuleya, R.E.; Bender, M.; Vecchi, G.A.; Villarini, G.; Chavas, D. Global Projections of Intense Tropical Cyclone Activity for the Late Twenty-First Century from Dynamical Downscaling of CMIP5/RCP4. 5 Scenarios. J. Clim. 2015, 28, 7203–7224. [Google Scholar] [CrossRef]
  25. Wu, L.G.; Zhao, H.K.; Wang, C.; Cao, J.; Liang, J. Understanding of the Effect of Climate Change on Tropical Cyclone Intensity: A Review. Adv. Atmos. Sci. 2022, 39, 205–221. [Google Scholar] [CrossRef]
  26. Ho, C.H.; Baik, J.J.; Kim, J.H.; Gong, D.Y.; Sui, C.H. Interdecadal changes in summertime typhoon tracks. J. Clim. 2004, 17, 1767–1776. [Google Scholar] [CrossRef]
  27. Emanuel, K. Tropical cyclones. Annu. Rev. Earth Planet. Sci. 2003, 31, 75–104. [Google Scholar] [CrossRef]
  28. Knutson, T.; Camargo, S.J.; Chan, J.C.L.; Emanuel, K.; Ho, C.H.; Kossin, J.; Mohapatra, M.; Satoh, M.; Sugi, M.; Walsh, K.; et al. Tropical Cyclones and Climate Change Assessment: Part II: Projected Response to Anthropogenic Warming. Bull. Am. Meteorol. Soc. 2020, 101, E303–E322. [Google Scholar] [CrossRef]
  29. Kossin, J.P.; Knapp, K.R.; Olander, T.L.; Velden, C.S. Global increase in major tropical cyclone exceedance probability over the past four decades. Proc. Natl. Acad. Sci. USA 2020, 117, 11975–11980. [Google Scholar] [CrossRef] [PubMed]
  30. Islam, S.; Villarini, G.; Zhang, W. Quantification of the role of urbanization in changing the rainfall associated with tropical cyclones affecting Charlotte, North Carolina. Urban Clim. 2023, 52, 101681. [Google Scholar] [CrossRef]
  31. Chen, J.; Yang, K.; Liu, L.; Li, B. Impact of 60 years land use change on rainfall-runoff in central shanghai. J. Nat. Resour. 2010, 25, 914–925. [Google Scholar]
  32. Liu, X.; Zou, L.; Xia, L. Analysis on the Characteristics and Reason of Heavy Rain and Strong Wind in Shanghai Caused by Typhoon Krosa. Meteorol. Mon. 2008, 34, 72–78. [Google Scholar]
  33. Liang, P.; Ding, Y.-H.; He, J.-H.; Tang, X. Study of relationship between urbanization speed and change in spatial distribution of rainfall over shanghai. J. Trop. Meteorol. 2013, 19, 97–103. [Google Scholar]
  34. Zhuang, Q.; Liu, S.G.; Zhou, Z.Z. Spatial Heterogeneity Analysis of Short-Duration Extreme Rainfall Events in Megacities in China. Water 2020, 12, 3364. [Google Scholar] [CrossRef]
  35. Zhuang, Q.; Liu, S.; Zhou, Z. The change of spatio-temporal precipitation and rainfall frequency analysis in shanghai. J. China Hydrol. 2021, 41, 74–80. [Google Scholar]
  36. Yang, L.; Smith, J.A.; Wright, D.B.; Baeck, M.L.; Villarini, G.; Tian, F.Q.; Hu, H.P. Urbanization and Climate Change: An Examination of Nonstationarities in Urban Flooding. J. Hydrometeorol. 2013, 14, 1791–1809. [Google Scholar] [CrossRef]
  37. Bloeschl, G.; Hall, J.; Viglione, A.; Perdigao, R.A.P.; Parajka, J.; Merz, B.; Lun, D.; Arheimer, B.; Aronica, G.T.; Bilibashi, A.; et al. Changing climate both increases and decreases European river floods. Nature 2019, 573, 108–111. [Google Scholar] [CrossRef] [PubMed]
  38. Wang, J.; Dai, J.; Yang, Y.; Lv, Y. Statistical analysis of the characteristics of typhoons in China from 1977 to 2018. Trans. Oceanol. Limnol. 2021, 43, 28–33. [Google Scholar]
  39. Fang, G.; Gao, Y.; Xu, L.; Hu, L.; Zhang, S. Analysis of precipitation change and the characteristics of disaster rainfalls in shanghai. Resour. Environ. Yangtze Basin 2012, 21, 1270–1273. [Google Scholar]
  40. Zong, Y.Q.; Chen, X.Q. Typhoon hazards in the Shanghai area. Disasters 1999, 23, 66–80. [Google Scholar] [CrossRef]
  41. Shi, J.; Xiao, F.; Mu, H.; Xu, J. Losses assessment of typhoon disaster in shanghai during 1949-2009. Resour. Environ. Yangtze Basin 2013, 22, 952–957. [Google Scholar]
  42. Wang, J.; Gao, W.; Xu, S.; Yu, L. Evaluation of the combined risk of sea level rise, land subsidence, and storm surges on the coastal areas of Shanghai, China. Clim. Chang. 2012, 115, 537–558. [Google Scholar] [CrossRef]
  43. Wang, Y.; Chen, A.S.; Fu, G.; Djordjevic, S.; Zhang, C.; Savic, D.A. An integrated framework for high-resolution urban flood modelling considering multiple information sources and urban features. Environ. Model. Softw. 2018, 107, 85–95. [Google Scholar] [CrossRef]
  44. Li, Y.; Chen, L.; Lei, X. Numerical study on impacts of upper-level westerly trough on the extratropical transition process of typhoon Winnie (1997). Acta Meteorol. Sin. 2006, 64, 552–563. [Google Scholar]
  45. Xiang, S.; Zhou, M.; Xu, Y.; Du, J. The Characteristics of typhoon “Lekima” and the cause of extreme rainfall. Mar. Forecast. 2020, 37, 76–85. [Google Scholar]
  46. Xu, X.; Liu, J.; Zhang, Z.; Zhou, W.; Zhang, S.; Li, R.; Yan, C.; Wu, S.; Shi, X. Time Series of Land Ecosystem Classification Dataset of China in Five-Year Increments. Digit. J. Glob. Chang. Data Repos. 2015. [Google Scholar] [CrossRef]
  47. Xu, X.; Liu, J.; Zhang, Z.; Zhou, W.; Zhang, S.; Li, R.; Yan, C.; Wu, S.; Shi, X. A Time Series Land Ecosystem Classification Dataset of China in Five-Year Increments (1990–2010). J. Glob. Chang. Data Discov. 2017, 1, 52–59. [Google Scholar] [CrossRef]
  48. Kazamias, A.-P.; Sapountzis, M.; Lagouvardos, K. Evaluation of GPM-IMERG rainfall estimates at multiple temporal and spatial scales over Greece. Atmos. Res. 2022, 269, 106014. [Google Scholar] [CrossRef]
  49. Li, P.; Xu, Z.X.; Ye, C.L.; Ren, M.F.; Chen, H.; Wang, J.J.; Song, S.L. Assessment on IMERG V06 Precipitation Products Using Rain Gauge Data in Jinan City, Shandong Province, China. Remote Sens. 2021, 13, 1241. [Google Scholar] [CrossRef]
  50. Ying, M.; Zhang, W.; Yu, H.; Lu, X.; Feng, J.; Fan, Y.; Zhu, Y.; Chen, D. An Overview of the China Meteorological Administration Tropical Cyclone Database. J. Atmos. Ocean. Technol. 2014, 31, 287–301. [Google Scholar] [CrossRef]
  51. Lu, X.; Yu, H.; Ying, M.; Zhao, B.; Zhang, S.; Lin, L.; Bai, L.; Wan, R. Western North Pacific Tropical Cyclone Database Created by the China Meteorological Administration. Adv. Atmos. Sci. 2021, 38, 690–699. [Google Scholar] [CrossRef]
  52. Wright, D.B.; Mantilla, R.; Peters-Lidard, C.D. A remote sensing-based tool for assessing rainfall-driven hazards. Environ. Model. Softw. 2017, 90, 34–54. [Google Scholar] [CrossRef]
  53. Zhengzheng, Z.; Shuguang, L.; Wright, D.B. Analysis of urban design storm based on stochastic storm transposition. Adv. Water Sci. 2020, 31, 583–591. [Google Scholar]
  54. Xiao, M.; Zhang, Q.; Singh, V.P. Influences of ENSO, NAO, IOD and PDO on seasonal precipitation regimes in the Yangtze River basin, China. Int. J. Climatol. 2015, 35, 3556–3567. [Google Scholar] [CrossRef]
  55. Tang, Y.; Huang, A.N.; Wu, P.L.; Huang, D.Q.; Xue, D.K.; Wu, Y. Drivers of Summer Extreme Precipitation Events Over East China. Geophys. Res. Lett 2021, 48, e2021GL093670. [Google Scholar] [CrossRef]
  56. Zhang, Q.A.; Wu, L.G.; Liu, Q.F. Tropical cyclone damages in China 1983-2006. Bull. Am. Meteorol. Soc. 2009, 90, 489–496. [Google Scholar] [CrossRef]
  57. Wu, L.G.; Wang, B.; Geng, S.Q. Growing typhoon influence on east Asia. Geophys. Res. Lett. 2005, 32. [Google Scholar] [CrossRef]
Figure 1. Location of the study region with city boundaries, rivers, and topography (a). Shanghai City (i.e., study area A) with the city boundaries and land use characteristics (b). The land use data provided by GCOSS (http://www.geodoi.ac.cn/WebCn/doi.aspx?Id=177 (accessed on 30 April 2023)) [46,47].
Water 16 00508 g001
Figure 2. Flowchart of the SST framework for rainfall frequency analysis (a). Depiction of stochastic storm transposition procedure for a single storm (b).
Water 16 00508 g002
Figure 3. Diagnosis maps for the 200 storms in the 72 h storm catalog. The solid yellow dots represent typhoon events in the storm catalog. (a) the total rainfall of the mean storm in the transposition domain, (b) the probability of storm occurrence in the transposition domain.
Water 16 00508 g003
Figure 4. Violin plots of the storms in the 3, 12, 24, and 72 h storm catalogs. The quartiles are labeled as the 75th and 25th percentiles from top to bottom.
Water 16 00508 g004
Figure 5. The inter-annual distribution of extreme rainfall events in the 3 h, 12 h, 24 h and 72 h storm catalogs (ad). The folded lines indicate the inter-annual distribution of extreme rainfall, and the bar charts indicate the inter-annual distribution of extreme rainfall events, with the red lines showing the trends in both. The intra-annual distribution of extreme rainfall events in the 3 h, 12 h, 24 h and 72 h storm catalogs (e).
Water 16 00508 g005
Figure 6. Spatial distribution of the largest 50 storm events in the 72 h storm catalog. Circles indicate the location of rainfall occurrence, circle radius indicates rainfall amount, bars indicate the number of storm events, red circles and bars indicate typhoon events, and gray circles and bars indicate the other extreme storm events.
Water 16 00508 g006
Figure 7. Description of the inter-annual vs. intra-annual occurrence pattern of typhoon events. Orange triangles and broken lines depict the inter-annual pattern of the number of typhoon events, blue circles and broken lines depict the inter-annual pattern of the number of landfall typhoon events, and red line shows a graph of the inter-annual trends in both (a). The curves and the enclosed area indicate the probability density of typhoon events and landfall typhoon events occurring within the year (b).
Water 16 00508 g007
Figure 8. Distribution of typhoon landfall numbers with five selected typhoon tracks (a); radar charts of five selected typhoon features (b).
Water 16 00508 g008
Figure 9. Comparison of IDF estimates from the SST based on all storm types and without typhoon events for different duration, 3 h (a), 12 h (b), 72 h (c).
Water 16 00508 g009
Figure 10. Comparison of IDF estimates between SST and moments method (a). Contribution of typhoon events to design rainfall (b).
Water 16 00508 g010
Figure 11. 72 h design storm hyetograph of total surface rainfall at 50- and 100-year return periods.
Water 16 00508 g011
Figure 12. The spatial structure of SST-based design storm at a 50-year return period.
Water 16 00508 g012
Table 1. The number of typhoon events identified in the storm catalogs for different durations.
DurationNumber of Detected TyphoonsPercentage
3 h2010%
12 h2311.5%
24 h2412%
72 h2010%
Table 2. Typhoon events selected in the 72 h storm catalog with Cv values.
Typhoon
Name
Date
(yy-mm-dd)
CvTyphoon
Name
Date
(yy-mm-dd)
Cv
Man-yi2001-08-010.997Jangmi2008-09-233.186
Lekima2001-09-212.770Haikui2012-08-010.933
Sinlaku2002-08-281.941Matmo2014-07-171.155
Haima2004-09-102.246Kalmaegi2014-08-180.894
Matsa2005-07-301.210Fung-wong2014-09-172.582
Khanun2005-09-051.506Soudelor2015-07-300.881
Saomai2006-08-052.223LEKIMA2019-08-031.582
Wipha2007-09-151.012MITAG2019-09-272.058
Krosa2007-10-011.364Hagupit2020-07-311.286
Sinlaku2008-09-084.073In-fa2021-07-161.601
Table 3. Variation in rainfall estimates under different return periods with Cv values.
DurationCatalog
Type
Return Period
5 a10 a25 a50 a100 a200 a500 a1000 a
3-hAll storms0.04990.04450.04190.03160.04370.05700.07850.1927
Non-typhoon0.05420.04790.04500.03430.04140.05430.06600.0953
12-hAll storms0.04140.03420.03150.03260.04020.05390.07520.1737
Non-typhoon0.04730.03570.03480.03410.04110.05250.07230.0944
24-hAll storms0.03250.02780.02690.03560.04440.06090.08210.3005
Non-typhoon0.03340.02950.02970.03070.03910.05050.06360.0789
72-hAll storms0.02020.01730.02330.03290.03760.05200.07820.1935
Non-typhoon0.02100.01780.02100.03310.03900.04460.06130.0789
Disclaimer/Publisher’s Note: The statements, opinions and data contained in all publications are solely those of the individual author(s) and contributor(s) and not of MDPI and/or the editor(s). MDPI and/or the editor(s) disclaim responsibility for any injury to people or property resulting from any ideas, methods, instructions or products referred to in the content.

