Abstract
Utah Lake is one of the largest freshwater bodies in the West and a valuable resource for agricultural and recreational activities in the region. However, it has suffered elevated trace metal and nutrient levels since the pioneer settlement in 1847. The objectives of this project were as follows: (1) investigate the temporal and spatial variations of trace metal and nutrient concentrations in Utah Lake and its tributaries; (2) model trace metal and nutrient concentrations across the lake using GIS spatial analysis techniques. We collected floc layer sediment samples quarterly as well as monthly water samples for trace metal and nutrient analyses at designated sites. GIS spatial analysis techniques were used to model the trace metal and nutrient concentrations in the lake. Elevated trace metal concentrations in river and lake water samples have been detected, especially in the month of June. The GIS modeling revealed that the highest trace metal and nutrient concentrations were located at the deepest part of the lake and near the Spanish Fork River inlet, respectively. Moreover, the results indicate that Utah Lake is not well mixed horizontally but well mixed vertically. Our findings can help state agencies address issues in water quality and management related to human–environment interactions.
1. Introduction
Utah, the second-driest state in the nation, faces a future encompassing population growth and climate change, both of which have the potential to impact the region’s hydrologic system. Consequently, these factors may affect both the availability and quality of water necessary for beneficial human use. Utah Lake is the largest freshwater lake in Utah. The lake is 35.4 km long and 16.1 km wide, with an average depth of 2.4 m and a maximum of 4 m [1]. It occupies much of Utah Valley and is used by the region as a water source for agriculture, irrigation, and water recreation. The major inflows to Utah Lake are the American Fork River, Provo River, Hobble Creek, and Spanish Fork River. The Provo River and Spanish Fork River account for nearly 60% of inflow into Utah Lake. Utah Lake has only one outlet, the Jordan River, which drains the lake north to the Great Salt Lake [2,3]. Although Utah Lake and its associated watershed have been of importance to humans for at least several millennia, Utah Lake has long been considered severely polluted after the pioneer settlement. This is largely caused by heavy loadings of various pollutants related to anthropogenic activities on Utah Lake [4,5]. Water quality issues primarily result from excessive nutrient inputs related to agricultural and animal farming practices, urban runoff, effluent from wastewater treatment plants, and elevated concentrations of trace metals associated with mining activities since the mid-1800s. Anthropogenic activities have shown an impact on both hydrological patterns and pollutant discharge within watersheds [6]. Microbes in these nutrient sources potentially alter the biogeochemical processes and lead to N2O emissions in waters to the atmosphere, which can, in turn, affect nitrification and denitrification processes [6,7,8]. Furthermore, increasing discharges of excessive fertilizers from farming lands, residential lawns, and effluent discharge gradually led to the eutrophication of Utah Lake. Lake eutrophication is often linked to nutrient changes over time [9,10]. Shallow lakes are far more vulnerable than deep-water ecosystems due to their limited capacity to assimilate contaminants or nutrient loads [11,12]. As a result, shallow lakes can easily transition from an “oligotrophic state” to a “eutrophic state” [13]. Consequently, the excess nutrient levels are resulting in periodic harmful algal blooms (HABs) in the lake. Severe HABs have occurred in the summer since 2016 (DEQ) [14], prompting the closure of several locations on Utah Lake. Utah lake eutrophication is a serious problem that imposes hazardous health effects on local communities in addition to its adverse impacts on the local economy and recreational activities.
Besides the eutrophication problem, Utah Lake, like other lakes in the world, often sequesters trace elements and other contaminants through several natural processes, including sediment trapping and bioaccumulation of contaminants in fish as well as precipitation of contaminants as insoluble solids in the water column [15]. Although many metals are biologically essential in trace amounts, such as magnesium (Mg), iron (Fe), copper (Cu), and zinc (Zn) [16], excessive quantities can interfere with physiological processes. Other metals, such as arsenic (As) and lead (Pb), can accumulate in the tissues of aquatic organisms and cause adverse biological impacts in aquatic organisms [17,18,19]. Wang et al. (2017) discovered that As concentration in the floc layer (the top 20 cm mixture of water and sediments at the lake bottom) along the Utah Lake-Jordan River transition area was significantly higher than background levels [20]. The floc layer is very important since it is the layer where benthivorous fish species take in nutrients and trace metals that will eventually affect the trace metal levels in their tissues. More importantly, many people consume fish from the lake, which makes it even more important to monitor trace metal levels in the lake. Furthermore, previous studies also indicated that Utah Lake is not as horizontally well mixed as previously thought [20,21]. Therefore, it is essential to capture and quantify the temporal and spatial variations of nutrients and trace metals in the inflows to the lake to set the stage for a better understanding of the current state of Utah Lake.
To address the temporospatial variations of the nutrient and trace metal concentrations in the lake, we applied Geographic Information System (GIS) geospatial analysis techniques to visualize the variations. Specifically, we utilized inverse distance weighting (IDW) interpolation, a common GIS interpolation method used to predict values for unmeasured locations within an area using existing sample data points. The underlying assumption of IDW is that proximate locations should exhibit more similar parameter values than distant locations [22]. As such, IDW can generate continuous surfaces using weighted averages of point measurements and is useful for interpolating values such as rainfall, temperature, chemical concentrations, and elevation between measurement locations [23]. In this study, we leveraged available lake and river data to conduct IDW analysis. The accuracy of IDW interpolation relies on the distribution of measured locations [22]. Notably, our lake sampling sites captured the major inlets for nutrient and trace metal loading. Therefore, these sites are well-suited for utilizing IDW geospatial analysis to generate interpolated estimates between data points within the lake system. While IDW has limitations, our measurement locations help minimize estimation errors and allow reasonable mapping of the temporal and spatial variations in trace metal and nutrient concentrations across the lake.
To elucidate the temporal and spatial trend of trace metal and nutrient concentration variations, we collected monthly water samples and quarterly floc layer sediment samples from the American Fork River, Provo River, Hobble Creek, Spanish Fork River, Jordan River, and Utah Lake to investigate the fluctuations of nutrient and trace metal concentrations at 10 sampling locations. The knowledge from this project can guide actions increasingly necessary to safeguard the services provided by the Utah Lake ecosystem amid mounting pressure on freshwater resources. The nutrient and trace metal findings will deliver vital information for pinpointing which inflows contribute the greatest contaminant loads into Utah Lake. Consequently, the data can assist state agencies in addressing critical questions in water quality, hydrologic, environmental, biogeochemical sciences, and management with respect to human–environment interactions. Moreover, our results will provide guidance on management and remediation strategies for other shallow lakes facing similar water quality challenges worldwide.
2. Materials and Methods
2.1. Field Sampling
Water and sediment samples were taken from 5 river sampling sites (red squares) as well as from the lake sites (yellow circles) between March 2015 and March 2016 to capture seasonal variations (Figure 1). Water samples were taken monthly at the river sites and quarterly at the lake sites. Sediment samples were taken quarterly at all sampling locations. The sampled rivers include the Spanish Fork River, Hobble Creek, Provo River, American Fork River, and the Jordan River. The distance between the corresponding river and lake sites varied from 2.2 km to 3.2 km, except for the Jordan River site, where the distance between the two places was approximately 300 m.
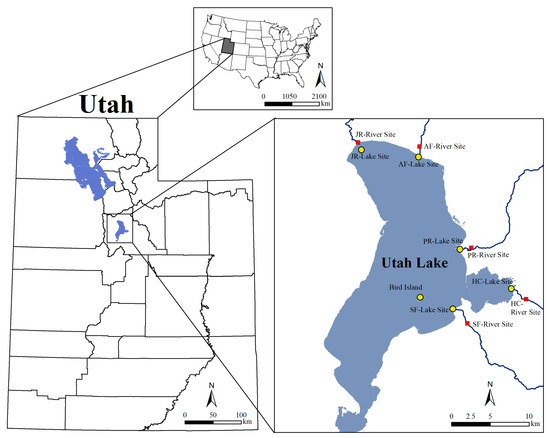
Figure 1.
Utah Lake sampling sites.
An electric Geotech Series II Peristaltic Pump filtering system was used to collect water samples. Water samples were taken approximately 30 cm below the surface. At the Bird Island location, the deepest part of the lake, water samples were taken at 50 cm intervals from the surface to the bottom to establish a depth profile. All water samples were stored in pre-washed 250 mL plastic bottles and kept in a refrigerator after sampling. Water samples were also tested in situ for ammonia and nitrite concentrations using a CHEMetrics V-2000 Model Multi-Analyte Photometer (CHEMetrics, LLC, Midland, VA, USA). A sediment sample (1 kg) was taken from the floc layer at each sampling site using a portable stainless steel lake sediment and sludge grab bucket, stored in Ziploc bags, and placed in a cooler after sampling. The top 20 cm sediment layer at the bottom of the lake or river is defined as the floc layer [1], where the sediments and water are mixed. All water nutrient testing was conducted in situ. Water and sediment samples for trace metal analyses were refrigerated and processed within 24 h of collection.
2.2. Laboratory Analysis
All samples were prepared for triplicates through a process of digestion and filtration and were tested for concentrations of the following trace elements: Al, Fe, Mg, As, Cr, Cu, Mn, Ni, Pb, Zn, Ag, and Cd. Samples were digested using the EPA’s Method 3015A for Microwave-Assisted Acid Digestion of Aqueous Samples and Extracts [24]. A 45 mL water sample was mixed with 0.5 ± 0.1 mL of 70% HNO3. The mixture was then microwaved in Teflon tubes using a CEM Microwave Accelerated Reaction System (MARS) X-Press digester (CEM Corporation, Matthews, NC, USA), where it was microwaved at 170 °C for 10 min at 1600 Watts. After cooling, samples were filtered with the CEM LabXPress gravity-fed filtering system using 0.45 µm filters (Osomic Inc., Minnetonka, MN, USA). For sediment samples, a 0.5 g duplicate sample (G100 mesh with an opening of 149 μm) was weighed into a Teflon digestion vessel (SCP Science, Champlain, NY, USA) and digested using the MARSXpress (CEM, Co. Matthews, NC, USA). 10 mL of 27% HNO3 was added to each sample. After being thoroughly mixed, the sample was placed into a carousel and digested in the MARS Express using the USEPA 3052 Method [24]. Following the digestion process, samples were filtered through a 0.45 µm membrane filter. All digested and filtered samples were subsequently analyzed in the Inductively Coupled Plasma Optical Emission Spectrometer (ICP-OES) (Perkin Elmer, Waltham, MA, USA, Optima 8000) for total trace elements in the Earth Science Laboratory at Utah Valley University. Each sample was run in triplicate. The average of the three triplicates was determined as the trace element concentration of that sample.
2.3. GIS Spatial Analysis
ArcGIS Desktop 10.4 was used to conduct spatial analysis. The As, Pb, ammonia (NH3), and nitrite (NO2−) concentration spatiotemporal distributions in Utah Lake were modeled using the IDW interpolation spatial analysis method [22]. After the interpolation, the Extract by Mask tool in ArcToolbox was used to display the interpolation for Utah Lake. Graduated symbols proportional to the concentration of trace metals and nutrients were used to display the concentration at each sampling site.
3. Results
3.1. Trace Metal Concentrations in Water Samples
Figure 2a shows that As in river water samples varied over time, and As in all JR-River Site samples was above the EPA’s As drinking water standard of 0.01 mg/L [25]. The highest As concentration of 0.022 mg/L occurred in September at the JR-River Site, and the lowest As concentration was at the AF-River Site in February 2016. As peaked at the SF-River Site and HC-River Site in June with a concentration of 0.021 mg/L and 0.019 mg/L, respectively. As peaked at the AF-River Site and the PR-River Site in July and April, respectively. The As pattern at the JR-River Site was different from that of the inlets. The highest As concentration at the JR-River Site occurred between June and October 2015. In contrast, the highest As concentration in four inlets was between April and July 2015. Compared to As, Pb (Figure 2b) in river water samples showed less variation and was near the EPA’s action level for lead in drinking water (0.015 mg/L) [25,26], except for two peaks of 0.179 mg/L and 0.048 mg/L at the AF-River Site in June and at the PR-River Site in August, respectively.
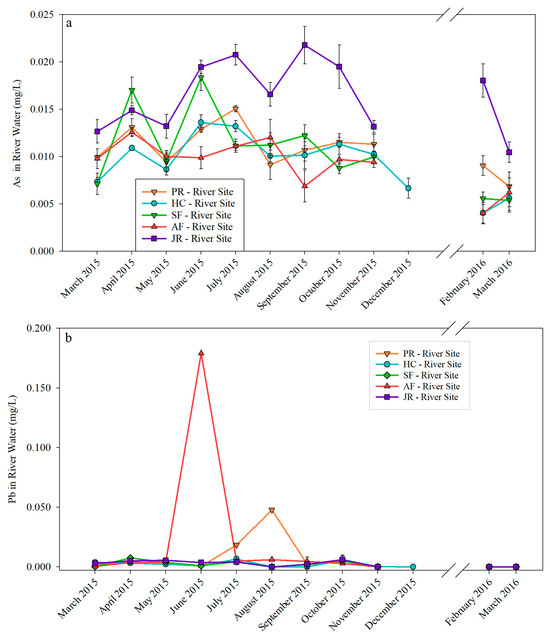
Figure 2.
As (a) and Pb (b) concentrations in river water samples.
Figure 3 shows As and Pb concentrations in lake water samples. As in all samples were above the EPA’s drinking water standard except for March at the PR-Lake Site. As for Pb, all samples were below the EPA’s drinking water standard. The highest concentrations for both trace metals occurred in June. The highest As concentration was 0.022 mg/L at the JR-Lake Site, and the lowest was 0.008 mg/L in March at the PR-Lake Site (Figure 3a). In contrast, the highest Pb concentration of 0.008 mg/L occurred in the HC-Lake Site, and the lowest was near zero in all measured samples in November. For Pb graphs, different scaling for the Y-axis was used for river and lake samples due to the large spikes that occurred in river samples.
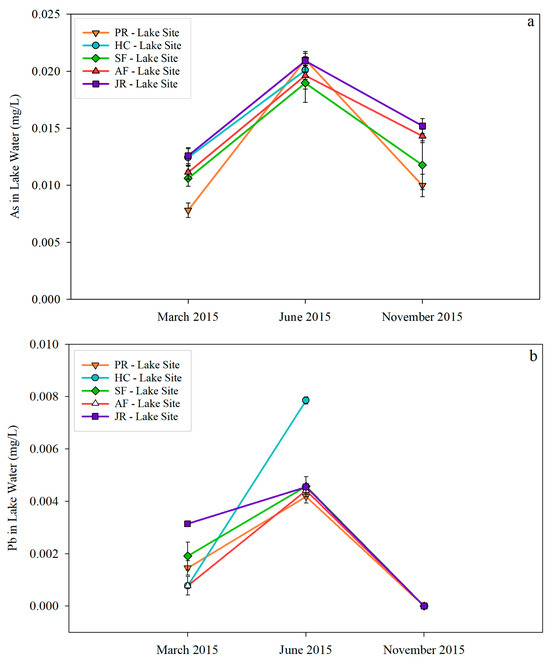
Figure 3.
As (a) and Pb (b) concentrations in lake water samples.
Comparing As concentrations in river (Figure 2a) and lake (Figure 3a) samples, there was no significant variation in March and November. However, lake water samples showed a higher As concentration (ranging from 0.0190 mg/L to 0.0210 mg/L) in June than that in river samples (ranging from 0.001 mg/L to 0.014 mg/L), except for JR-River Site (0.0195 mg/L) and SF-River Site (0.018 mg/L), which were close to the As concentration in June in the lake. As for Pb, lake samples did not differ significantly from river samples except for the two peaks that occurred in the river sites mentioned earlier.
3.2. Variations of As and Pb Concentrations in Utah Lake
The As interpolation in the lake in Figure 4 showed that the highest As in March 2015 was near Bird Island, the deepest part of the lake. In June 2015, As concentration was doubled compared to March. And the highest As concentration in June was found near the Spanish Fork River inlet and the mouth of the Jordan River Outlet. In November, As concentration decreased from June, and the highest As concentration was found near Bird Island, which showed a similar spatial distribution pattern as seen in March.
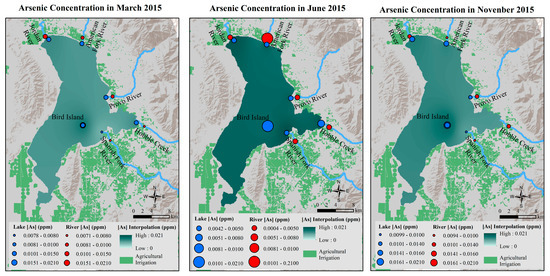
Figure 4.
As concentration variations in March, June, and November 2015 in Utah Lake.
Temporal Pb variation in the lake (Figure 5) was different from that of As. In March, Pb did not show spatial variation across the lake. In June, across the lake, Pb increased compared to March, and the highest Pb was near Bird Island. In November, Pb was low, near 0 mg/L in the lake, and no spatial variations were observed.

Figure 5.
Pb concentration variations in March, June, and November 2015 in Utah Lake.
3.3. Trace Metal in Sediment Samples
As and Pb in river sediment samples both showed an increasing trend from March to November (Figure 6). The highest As concentration of 0.120 mg/kg and the highest Pb concentration of 0.200 mg/kg were observed in November Jordan River sediment samples. As and Pb in lake sediments showed a similar trend to that in river sediments, with November concentrations being the highest at each respective site (Figure 7). The highest As (0.104 mg/kg) and Pb (0.37 mg/kg) were found in November at the AF-Lake Site. Both As and Pb concentrations in sediment samples were a magnitude higher than those in water samples.
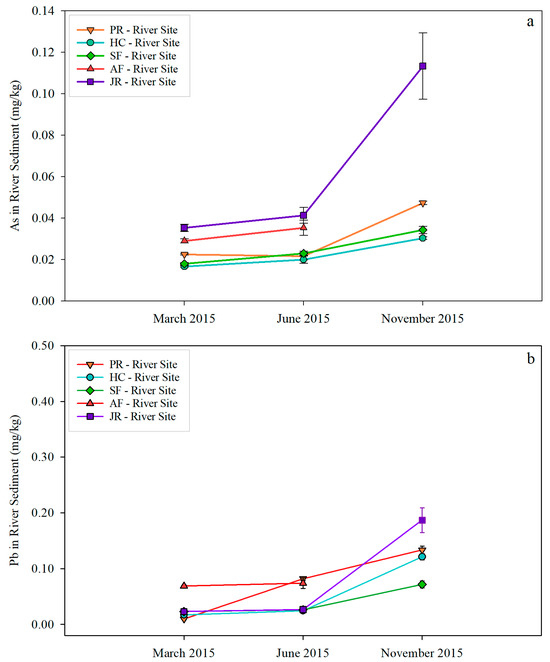
Figure 6.
As (a) and Pb (b) concentrations in river sediment samples.
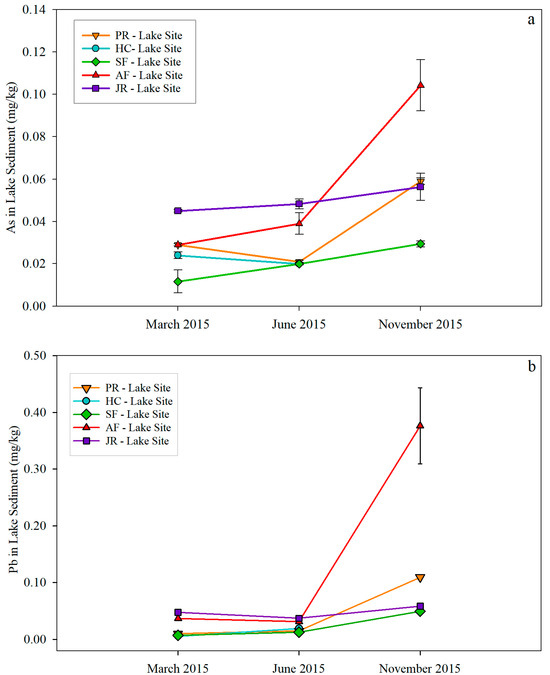
Figure 7.
As (a) and Pb (b) concentrations in lake sediment samples.
3.4. Trace Metal As and Pb Concentration Depth Profiles
In the As concentration depth profile (Figure 8), at all depths, the As concentration in all water samples was above the background concentration of 0.010 mg/L. In June samples, the As concentration was slightly higher than in the other two months. The As concentration at different depths was not significantly different. The Pb concentration in most of the samples was either below or near the background concentration of 0.0025 mg/L, except for a peak (0.175 mg/L) in the surface water sample in June. The Pb concentration did not vary significantly among the three months except for the spike observed in June surface water.
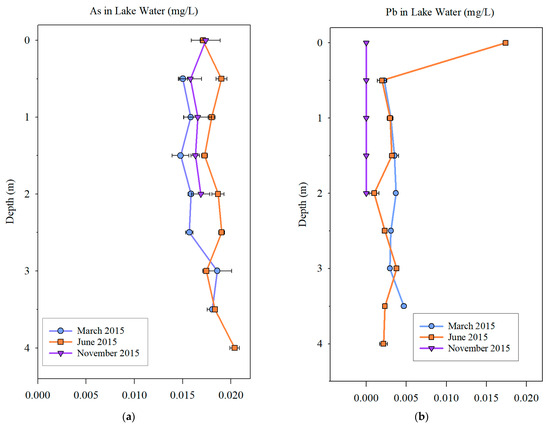
Figure 8.
As (a) and Pb (b) concentration depth profiles in Utah Lake.
3.5. NH3 and NO2− Concentrations in River and Lake Water Samples
For all four inlets, NH3 concentration peaked in June 2015, except for the HC-River Site, which had the highest NH3 concentration in October 2015. In contrast, there were large variations in NH3 concentration in the Jordan River. The highest NH3 concentration in the Jordan River occurred in May 2015, with a concentration of 1.79 mg/L, which is almost 30 times higher than the background concentration for freshwater aquaculture (0.06 mg/L) [27]. Among the four inlets, the SF-River site had the highest NH3 concentration of 0.84 mg/L in June 2015 (Figure 9a), which was 14 times higher than the background concentration. In contrast to NH3, NO2− concentration in all four inlets peaked in October 2015. Jordan River showed two NO2− peaks: one was in May, and the other in October coincided with the four inlets. The highest NO2− concentration of 0.17 mg/L was in the Jordan River in May 2015, which was 8.5 times higher than the background concentration for aquatic life (0.02 mg/L) [28]. Among the inlets, the PR-River Site had the highest NO2− of 0.07 mg/L in October, which is 3.5 times higher than the background concentration (Figure 9b).
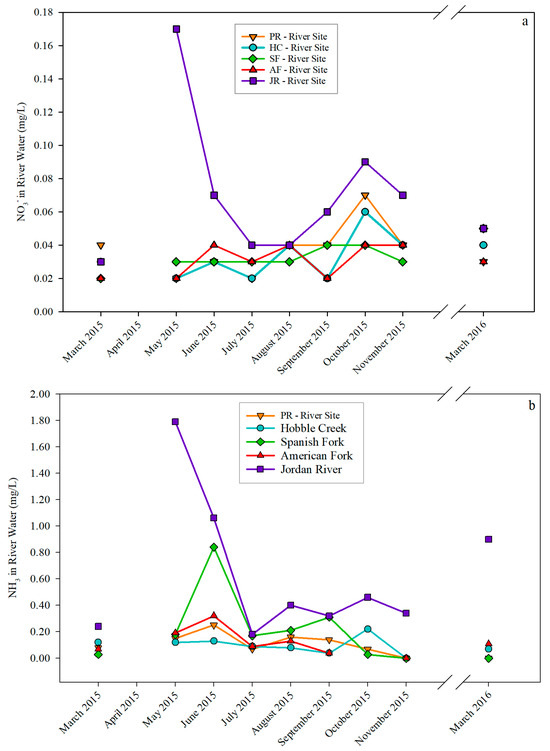
Figure 9.
NO2− (a) and NH3 (b) concentrations in river water samples.
Figure 10 shows the nitrite and ammonia ratios in river water samples. The ratio is a good indicator of nitrogen cycling and water quality [29]. From May to September, the ratio showed a general increasing trend at all sampling sites. For the Provo River and Spanish Fork River, the ratio peaked in October. The general increasing ratio suggests active nitrification and greater consumption of oxygen in the water column [29].
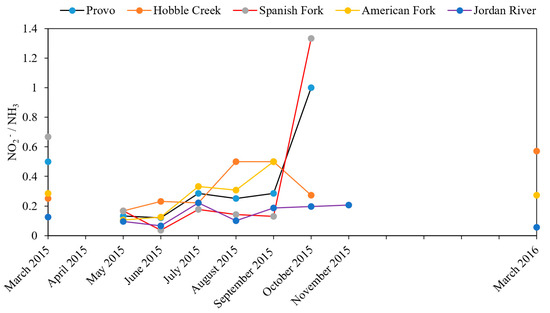
Figure 10.
NO2−/NH3 ratio in river water samples.
3.6. NH3 and NO2− Concentration Variations in Utah Lake
At all sampling sites, NH3 concentration in lake water showed greater seasonal variations than that of NO2−. The highest NH3 concentration of 1.08 mg/L was found at the SF-Lake Site, which was about 18 times higher than the background concentration for freshwater aquaculture. In addition, at the AF-Lake Site, the NH3 concentration had a different pattern, showing a slight decrease from March through November 2015 (Figure 11a). NO2− concentration did not show much seasonal variation at all sampling sites except at the SF-Lake site, where a NO2− concentration of 1 mg/L was measured, and it was 50 times higher than the background concentration for freshwater life (Figure 11b).
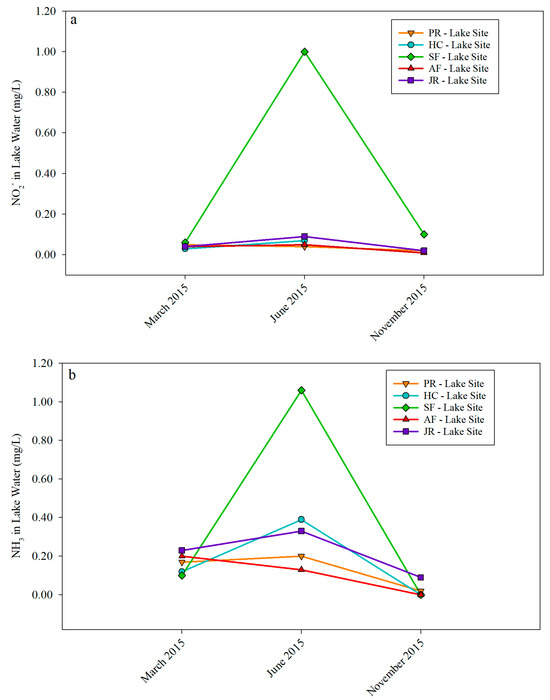
Figure 11.
NH3 (a) and NO2− (b) concentrations in lake water samples.
Figure 12 shows the NO2− and NH3 ratio in lake water samples. In March and June, the ratio was highest in the lake water samples collected close to the Spanish Fork River, whereas the samples collected close to the Provo River inlet showed a significant increase in the NO2− and NH3 ratio compared to March and June.
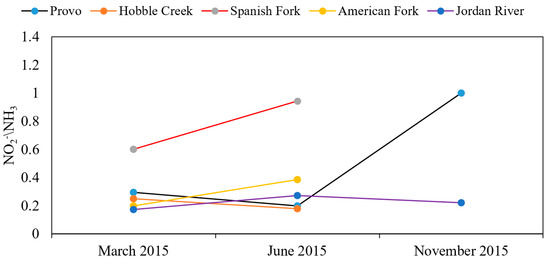
Figure 12.
NO2−/NH3 ratio in lake water samples.
3.7. NH3 and NO2− Concentration Interpolation in Utah Lake
NH3 concentration was low in the lake in March, with the highest concentration close to JR-Lake Site and JR-Lake Site. In June, NH3 concentration increased, and the greatest increase occurred at the SF-Lake Site. In November, the highest NH3 concentration occurred near the JR-Lake Site (Figure 13).
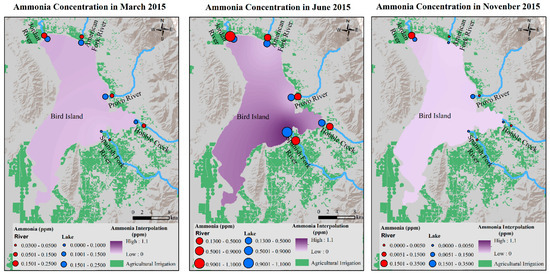
Figure 13.
NH3 concentrations in March, June, and November 2015 in Utah Lake.
Similar to NH3 concentration seasonal variations, NO2− concentrations increased from March to June and then decreased in November. In June, the most significant increase in NO2− concentration was at the SF-Lake Site (Figure 14).
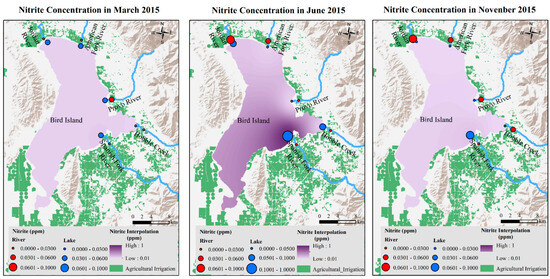
Figure 14.
NO2− concentrations in March, June, and November 2015 in Utah Lake.
4. Discussion
4.1. Trace Metals in Water and Sediment Samples
Trace metals in natural waters include essential elements such as Cu, Zn, Mn, and Fe, which may also be toxic at higher concentrations, as well as non-essential elements. The latter has long been recognized as poisonous to living organisms and humans, such as Pb and As [30,31,32,33]. Anthropogenic pollutants are primary sources of trace metals that adversely impact lake water quality. The release of potentially large quantities of these toxic metals, particularly in the watersheds of urbanized and industrialized areas, is creating issues in lakes and rivers [34]. These negative effects have been observed in both the water and floc layer sediments. The floc layer is sediment at the bottom of the lake that remains in continuous contact with the water body. Floc layer sediments are sensitive indicators for monitoring trace metals. Trace metals within the lake water can accumulate in floc layer sediments. Therefore, analysis of trace metals in floc layer sediments, along with water trace metal analysis, plays a crucial role in evaluating pollution status in an aquatic system [35,36,37].
In this study, As and Pb concentrations were investigated in water and sediment samples from Utah Lake, its inlets, and its outlet. As is a ubiquitous element found in the atmosphere, soils and rocks, natural waters, and organisms. However, human activities increased the amount of As found in the environment through mining activities and combustion of fossil fuels; the use of arsenical pesticides, herbicides, and crop desiccants; the use of As as an additive to livestock feed, particularly for poultry to promote growth and prevent disease in the chickens [38,39]; and the use of As for wood preservation. The impact on the environment of the use of arsenical compounds will remain for decades. In this study, elevated levels of As were found in water and sediment samples. For water samples, As concentrations at different sites peaked either in June or July. However, As concentrations in sediment samples showed an increasing trend from March to November. In addition, As in sediment samples was significantly higher than that in most of the water samples. Interestingly, the As concentration was low in the November water samples, whereas it was the highest in the river and lake sediment samples. Our data indicate that As accumulates in the floc layer sediment due to the metal absorption capacity of the organic matter. As is known to be present in inorganic pesticides and chicken feed [38], which could be the reason that As peaks were found in June or July in water samples. The continuous accumulation of As in floc layer sediments contributed to the increasing trend of As from March to November. The continuous As accumulation in the sediments and the prevailing wind blowing from the southwest to the northeast toward the Jordan River outlet led to the highest As in JR-Lake and River sites in November. Contamination with high levels of As is concerning because arsenic exposure can lead to numerous adverse human health effects. Several epidemiological studies have reported a strong association between As exposure and increased risks of both carcinogenic and systemic health issues [39].
In addition to As, Pb is another trace metal that could lead to serious health issues with high doses of exposure. Although lead occurs naturally in the environment, anthropogenic activities such as fossil fuel burning, mining, and manufacturing contribute to the release of high concentrations. Exposure to lead occurs mainly via inhalation of lead-contaminated dust particles or aerosols and ingestion of lead-contaminated food, water, and paints [40]. Lead is the most systemic toxicant and affects several organs in the body, including the kidneys, liver, central nervous system, hematopoietic system, endocrine system, and reproductive system [40]. Figure 2b shows that Pb in river water samples varied little and was below the background concentration (0.0025 mg/L) except for two peaks of 0.179 mg/L and 0.048 mg/L at the AF-River Site in June and at the PR-River Site in August, respectively. The lake water samples indicate that in March and November, Pb was below background concentration, with Pb concentration in November samples near 0. Our results did not show significant Pb input from the river inlets, which implies that Pb loading to the lake might be primarily from non-point upland drainage and airborne origin [39] to the lake from numerous mining sites around Utah Lake. In contrast, Pb in river and lake floc layer sediment samples was above the background concentration of 0.056 mg/L in all November sediment samples. The Pb interpolation maps (Figure 5) indicate strong Pb absorption by sediment occurred in the lake. The clay and organic matter in the bottom sediments of the lake and rivers absorb lead and precipitate this element as Pb hydroxide, Pb phosphate, and Pb carbonate [41]. Therefore, it is common that Pb is usually found in a minimal amount in surface waters.
4.2. Nutrients in Water Samples
That increase in nutrient loadings to lakes and the subsequent enhancement of lake biological standing stocks are widely recognized [42,43,44,45,46,47,48,49]. Natural (unpolluted) waters contain relatively small amounts of ammonia, usually <0.02 mg/L. Ammonia occurs naturally in water bodies, arising from the microbiological decomposition of nitrogenous compounds in organic matter. Fish and other aquatic organisms also excrete ammonia. Ammonia may also be discharged directly into water bodies by some industrial processes or as a component of domestic sewage or animal slurry. Ammonia can also arise in water from the decay of discharged organic waste. However, in eutrophic lakes, a potentially high concentration of organic matter implies a large potential pool of ammonia. For all our sampling sites, NH3 was above 0.02 mg/L and peaked in early summer. The results indicate that there was excessive external nutrient input to the lake during the late spring and early summer periods, which led to an increase in ammonia concentration in water samples through various processes, such as bacteria decomposition of organic matter, effluent input, and upland runoff from agricultural areas. NH3 peaked at the same time in early summer in the river and lake sites, which indicates the introduction of the external N loading to the lake from the river inlets.
As for nitrite, its concentration peaked in the fall at all sampling locations except the JR-River site, which had the highest nitrite concentration in early summer and a second peak in the fall. Nitrite is an intermediate in the oxidation of ammonia to nitrate. Many effluents, including sewage, are rich in ammonia, which in turn can lead to increased nitrite concentrations in receiving waters. Therefore, high levels of nitrite in river and lake waters may indicate pollution. In unpolluted waters, nitrite levels are generally low (<0.02 mg/L). Around Utah Lake, there are large areas of agriculture fields, orchards, and seven wastewater treatment plants. Agricultural fertilization and effluent from wastewater treatment plants could lead to high concentrations of nitrite in water bodies. The behavior of nitrite under lake eutrophication is relatively more complex than ammonia behavior. The concentrations of nitrite in lake surface waters increase clearly with lake trophic state only for shallow lakes [50]. An increase in the reductive characteristics of the environment with the lake trophic state [51] may explain both ammonia and nitrite intensification. The large ratios between nitrite and ammonia in both PR-River, SR-River, and corresponding lake sites in October and November indicate the excessive nutrient input to the lake from surrounding lands around Utah Lake, which may adversely impact the biological communities in the lake.
After interpolating the ammonia and nitrite concentrations from all sampling sites to the whole lake using GIS spatial analysis modeling, it shows that lake water NH3 in spring and fall was much lower in summer (Figure 13). The same trend was observed for nitrite concentrations (Figure 14). In both models, the area around the Spanish Fork River inlet showed the highest concentration of both ammonia and nitrite. The Spanish Fork River runs through intensive agriculture and animal farming lands before entering Utah Lake. The modeling results strongly indicate that one of the important nutrient sources of the lake was introduced to the lake through the application of commercial fertilizers and animal manure.
5. Conclusions
Our results from this project shed light on our understanding of spatial and temporal variations of nutrient and trace metal loading in Utah Lake. Our findings indicate the following:
- Utah Lake is not horizontally well mixed but is vertically well mixed;
- Lake sediments absorb trace metals and serve as a sink for As and Pb;
- Mining drainage is likely the major Pb input to the lake;
- Agricultural practices and animal farming may have led to the excessive nutrient and As levels in Utah Lake.
Author Contributions
W.W. managed the project, conducted the data analysis, and wrote the manuscript; A.Z. contributed to configuring the text in Methods, Results, and Discussion; E.C. performed the data analysis and revised the text; H.R. and H.P. contributed to the figures. All authors have read and agreed to the published version of the manuscript.
Funding
This research was funded by the iUTAH (innovative Urban Transitions and Arid Region Hydro-sustainability) Research Catalyst Grant through the National Science Foundation’s EPSCoR program (Experimental Program to Stimulate Competitive Research), grant number 1208732, and the Scholarly Activities Committee (SAC) at Utah Valley University.
Data Availability Statement
Data is available at HydroShare, https://doi.org/10.4211/hs.31e28db004f74d5788cfaf364c142e3f.
Acknowledgments
We thank UVU undergraduate students Jeremy Andreini, Kenneth Larsen, Thomas Murdock, and Joshua Jackson for their field and lab assistance.
Conflicts of Interest
The authors declare no conflicts of interest.
References
- Horns, D. (Ed.) Utah Lake Comprehensive Management Plan, Resource Document: Written for the Utah Division of Fire, Forestry, and Public Lands. 2005; p. 109. Available online: https://geodata.geology.utah.gov/pages/download.php?direct=1&noattach=true&ref=4690&ext=pdf&k= (accessed on 10 October 2019).
- Utah Lake TMDL: Pollutant Loading Assessment and Designated Beneficial Use Impairment Assessment (Final Draft). Available online: https://documents.deq.utah.gov/legacy/programs/water-quality/watersheds/docs/2009/02Feb/Final_Draft_Task2_Task3_Memo%20_08-01-07.pdf (accessed on 12 December 2019).
- Utah Lake Master Plan. Available online: https://ffsl.utah.gov/wp-content/uploads/UtahLakeMasterPlan6-26-09.pdf (accessed on 12 December 2019).
- Toole, T.W. Utah Lake-Jordan River Watershed Management Unit Stream Assessment; Division of Water Quality, Utah Department of Environmental Quality: Salt Lake City, UT, USA, 2002.
- Wingert, S. Final Report: PCBs in Utah Lake Sediment Study; Department of Water Quality: Salt Lake City, UT, USA, 2008.
- Liang, J.; Ding, J.; Zhu, Z.; Gao, X.; Li, S.; Li, X.; Yan, M.; Zhou, Q.; Tang, N.; Lu, L.; et al. Decoupling the heterogeneity of sediment microbial communities along the urbanization gradients: A Bayesian-based approach. Environ. Res. 2023, 238, 117255. [Google Scholar] [CrossRef]
- Liang, J.; Tang, W.; Zhu, J.; Li, S.; Wang, K.; Gao, X.; Li, X.; Tang, N.; Lu, N.; Li, X. Spatiotemporal variability and controlling factors of indirect N2O emission in a typical complex watershed. Water Res. 2023, 229, 119515. [Google Scholar] [CrossRef]
- Zhu, Z.; Li, X.; Bu, Q.; Yan, Q.; Wen, L.; Chen, X.; Li, X.; Yan, M.; Jiang, L.; Chen, G.; et al. Land–Water Transport and Sources of Nitrogen Pollution Affecting the Structure and Function of Riverine Microbial Communities. Environ. Sci. Technol. 2023, 57, 2726–2738. [Google Scholar] [CrossRef]
- Brenner, M.; Whitmore, T.J.; Lasi, M.A.; Cable, J.E.; Cable, P.H. A multi-proxy trophic state reconstruction for shallow Orange Lake, Florida, USA: Possible influence of macrophytes on limnetic nutrient concentrations. J. Paleolimnol. 1999, 21, 215–233. [Google Scholar] [CrossRef]
- Burkett, V.R.; Wilcox, D.A.; Stottlemyer, R.; Barrow, W.; Fagre, D.; Baron, J. Nonlinear dynamics in ecosystem response to climatic change: Case studies and policy implications. Ecol. Complex. 2005, 2, 357–394. [Google Scholar] [CrossRef]
- Jorgensen, S.E.; Vollenweider, R.A. (Eds.) Problems of lakes and reservoirs. In Guidelines of Lake Management; 1988; Volume 1, pp. 37–42. Available online: https://www.ilec.or.jp/en/guideline/ (accessed on 15 November 2020).
- Qin, B.Q.; Yang, L.Y.; Chen, F.Z.; Zhu, G.W.; Zhang, L.; Chen, Y.Y. Mechanism and control of lake eutrophication. Chin. Sci. Bull. 2006, 51, 2401–2412. [Google Scholar] [CrossRef]
- Kagalou, I.; Papastergiadou, E.; Leonardos, I. Long term changes in the eutrophication process in a shallow Mediterranean lake ecosystem of W. Greece: Response after the reduction of external load. J. Environ. Manag. 2008, 87, 497–506. [Google Scholar] [CrossRef]
- Utah Department of Environmental Quality. Available online: https://deq.utah.gov/water-quality/harmful-algal-blooms-home (accessed on 15 December 2019).
- Thevenon, F.; Graham, N.D.; Chiaradia, M.; Arpagaus, P.; Wildi, W.; Pote, J. Local to regional scale industrial heavy metal pollution recorded in sediments of large freshwater lakes in central Europe (lakes Geneva and Lucerne) over the last centuries. Sci. Tot. Environ. 2011, 412, 239–247. [Google Scholar] [CrossRef] [PubMed]
- Aradpour, S.; Noori, R.; Naseh, M.R.V.; Hosseinzadeh, M.; Safavi, S.; Ghahraman-Rozegar, F.; Maghrebi, M. Alarming carcinogenic and non-carcinogenic risk of heavy metals in Sabalan dam reservoir, Northwest of Iran. Environ. Pollut. Bioavailab. 2021, 33, 278–291. [Google Scholar] [CrossRef]
- Lau, D.C.W.; Wu, M.W. Manure composting as an option for utilization and management of animal waste. Resour. Conversat. 1987, 13, 145–156. [Google Scholar] [CrossRef]
- Hubeny, J.B.; King, J.W.; Cantwell, M. Anthropogenic influences on estuarine sedimentation and ecology: Examples from the varved sediments of the Pettaquamscutt River Estuary, Rhode Island. J. Paleolimnol. 2009, 41, 297–314. [Google Scholar] [CrossRef]
- Thevenon, F.; Graham, N.D.; Herbez, A.; Wildi, W.; Pote, J. Spatio-temporal distribution of organic and inorganic pollutants from Lake Geneva (Switzerland) reveals strong interacting effects of sewage treatment plant and eutrophication on microbial abundance. Chemosphere 2011, 84, 609–617. [Google Scholar] [CrossRef]
- Wang, W.; Walther, S.; Cadet, E.; Carling, G.; Rey, K.; Nelson, S.; Tingey, D.; Robertson, P.; Kerswell, B. The Historical Records of Stable Isotopes (δ13C and δ15N) and Trace Metals along Utah Lake–Jordan River Transition Zone, UTAH (USA). In UGA Guidebook: Geology and Resources-From Back to Front; Lund, W.R., Emerman, S.H., Wang, W., Zanazzi, A., Eds.; 2017; Volume 46, pp. 171–185. Available online: https://utahgeology.org/publications/guidebooks/2017-uga-46-geology-and-resources-of-the-wasatch-back-to-front (accessed on 15 November 2020).
- Zanazzi, A.; Wang, W.; Peterson, H. Stable Isotope Hydrology of Utah Lake (Utah, USA). Hydrology 2020, 7, 88–113. [Google Scholar] [CrossRef]
- Jin, L.; Heap, A.D. Spatial interpolation methods applied in the environmental sciences: A review. Environ. Model. Softw. 2013, 53, 173–189. [Google Scholar]
- Chen, F.; Liu, C. Estimation of the spatial rainfall distribution using inverse distance weighting (IDW) in the middle of Taiwan. Paddy Water Environ. 2012, 10, 209–222. [Google Scholar] [CrossRef]
- U.S. Environmental Protection Agency. Soil Screening Guidance: Technical Background Document; USEPA Report 540/R-95/128, U.S. Government Print Office: Washington, DC, USA, 1996. Available online: https://archive.epa.gov/region9/superfund/web/pdf/ssg_nonrad_technical-2.pdf (accessed on 5 May 2019).
- EPA Chemical Contaminant Rules. Available online: https://www.epa.gov/dwreginfo/chemical-contaminant-rules (accessed on 9 May 2023).
- EPA Drinking Water Regulations. Available online: https://www.epa.gov/dwreginfo/drinking-water-regulations (accessed on 9 May 2023).
- EPA Aquatic Life Criteria–Ammonia. Available online: https://www.epa.gov/wqc/aquatic-life-criteria-ammonia (accessed on 9 May 2023).
- EPA Water Quality Criteria. Available online: https://www.epa.gov/wqc/national-recommended-water-quality-criteria-aquatic-life-criteria-table (accessed on 10 May 2023).
- Camargo, J.A.; Alonso, A.; Salamanca, A. Nitrate toxicity to aquatic animals: A review with new data for freshwater invertebrates. Chemosphere 2005, 58, 1255–1267. [Google Scholar] [CrossRef]
- Alloway, B.J.; Ayres, D.C. Chemical Principles of Environmental Pollution, 2nd ed.; Blackie Academic and Professional, Chapman and Hall: London, UK, 1997; pp. 208–211. [Google Scholar]
- Yang, H.; Rose, N.L.; Battarbee, R.W. Distribution of some trace metals in Lochnagar, acottish mountain lake ecosystem and its catchment. Sci. Total Environ. 2002, 285, 197–208. [Google Scholar] [CrossRef]
- Bibi, H.; Ahmed, F.; Ishiga, H. Assessment of metal concentrations in lake sediments of southwest Japan based on sediment quality guidelines. Environ. Geol. 2007, 52, 625–639. [Google Scholar] [CrossRef]
- Machender, G.; Dhakate, R.; Prasanna, L.; Govil, P.K. Assessment of heavy metal contamination in soils around Balanagar industrial area, Hyderabad, India. Environ. Earth Sci. 1984, 63, 945–953. [Google Scholar] [CrossRef]
- Kamala-Kannan, S.; Batvari, B.P.D.; Lee, K.J.; Kannan, N.; Krishnamoorthy, R.; Shanthi, K.; Jayaprakash, M. Assessment of heavy metals (Cd, Cr and Pb) in water, sediment and seaweed (Ulva lactuca) in the Pulicat Lake, South East India. Chemosphere 2008, 71, 1233–1240. [Google Scholar] [CrossRef]
- Vandecasteel, B.; Quataert, P.; De Vos, B.; Tack, F.M.G. Assessment of the pollution status of alluvial plains: A case study for the dredged sediment derived soils along the Leie River. Arch. Environ. Contam. Toxicol. 2004, 47, 14–22. [Google Scholar] [CrossRef][Green Version]
- Pekey, H. The distribution and sources of heavy metals in Izmit Bay surface sediments affected by a polluted stream. Mar. Pollut. Bull. 2006, 52, 1197–1208. [Google Scholar] [CrossRef]
- Baia, J.; Cuia, B.; Chena, B.; Zhangb, K.; Dengc, W.; Gaoa, H.; Xiao, R. Spatial distribution and ecological risk assessment of trace metals in surface sediments from a typical plateau lake wetland, China. Ecol. Model. 2011, 222, 301–306. [Google Scholar] [CrossRef]
- Nachman, K.E.; Baron, P.A.; Raber, G.; Francesconi, K.A.; Navas-Acien, A.; Love, D.C. Roxarsone, Inorganic Arsenic, and Other Arsenic Species in Chicken: A U.S.-Based Market Basket Sample. Environ. Health Perspect. 2013, 121, 818–824. [Google Scholar] [CrossRef]
- Abarikwu, S.O. Lead, Arsenic, Cadmium, Mercury: Occurrence, Toxicity and Diseases. In Pollutant Diseases, Remediation and Recycling; Lichtfouse, E., Schwarzbauer, J., Robert, D., Eds.; Springer: Cham, Switzerland, 2013; Volume 4, pp. 351–386. [Google Scholar]
- Tchounwou, P.B.; Patlolla, A.K.; Centeno, J.A. Carcinogenic and systemic health effects associated with arsenic exposure—A critical review. Toxicol. Pathol. 2003, 31, 575–588. [Google Scholar] [CrossRef]
- Agency for Toxic Substances and Disease Registry (ATSDR). Toxicological Profile for Lead; Public Health Service; U.S. Department of Health and Human Services: Atlanta, GA, USA, 1999.
- Sakamoto, M. Primary production by the phytoplankton community in some Japanese lakes and its dependence on lake depth. Arch. Hydrobiol. 1966, 62, 1–28. [Google Scholar]
- Dillon, P.J.; Rigler, F.H. The phosphorus-chlorophyll relationship in lakes. Limnol. Oceanogr. 1974, 19, 767–773. [Google Scholar] [CrossRef]
- Schindler, D.W.; Fee, E.J.; Ruszczynski, T. Phosphorus input and its consequences for phytoplankton standing crop and production in the Experimental Lakes Area and in similar lakes. J. Fish. Res. Board. Can. 1978, 35, 190–196. [Google Scholar] [CrossRef]
- Hanson, J.M.; Leggett, W.C. Empirical prediction of fish biomass and yield. Can. J. Fish. Aquat. Sci. 1982, 39, 257–263. [Google Scholar] [CrossRef]
- Hanson, J.M.; Peters, R.H. Empirical prediction of crustacean zooplankton biomass and profundal macrobenthos biomass in lakes. Can. J. Fish. Aquat. Sci. 1984, 41, 439–445. [Google Scholar] [CrossRef]
- Bird, D.F.; Kalff, J. Empirical relationships between bacterial abundance and chlorophyll concentration in fresh and marine waters. Can. J. Fish. Aquat. Sci. 1984, 41, 1015–1023. [Google Scholar] [CrossRef]
- Yan, N.D. Empirical prediction of crustacean zooplankton biomass in nutrient-poor Canadian Shield lakes. Can. J. Fish. Aquat. Sci. 1986, 43, 788–796. [Google Scholar] [CrossRef]
- Brown, C.D.; Hoyer, M.V.; Bachmann, R.W.; Canfield, D.E. Nutrient-chlorophyll relationships: An evaluation of empirical nutrient-chlorophyll models using Florida and north-temperate lake data. Can. J. Fish. Aquat. Sci. 2000, 57, 1574–1583. [Google Scholar] [CrossRef]
- Quirós, R. The relationship between nitrate and ammonia concentrations in the pelagic zone of lakes. Limnetica 2003, 22, 37–50. [Google Scholar] [CrossRef]
- Stumm, W.; Morgan, J.J. Aquatic Chemistry: Chemical Equilibria and Rates in Natural Waters, 3rd ed.; John Wiley & Sons, Inc.: New York, NY, USA, 1996. [Google Scholar]
Disclaimer/Publisher’s Note: The statements, opinions and data contained in all publications are solely those of the individual author(s) and contributor(s) and not of MDPI and/or the editor(s). MDPI and/or the editor(s) disclaim responsibility for any injury to people or property resulting from any ideas, methods, instructions or products referred to in the content. |
© 2024 by the authors. Licensee MDPI, Basel, Switzerland. This article is an open access article distributed under the terms and conditions of the Creative Commons Attribution (CC BY) license (https://creativecommons.org/licenses/by/4.0/).