Article

An Assessment of Six Years of Precipitation Stable Isotope and Tritium Activity Concentration Records at Station Sv. Urban, Eastern Slovenia

1
Department of Environmental Sciences, Jožef Stefan Institute, Jamova cesta 39, 1000 Ljubljana, Slovenia
2
Jožef Stefan International Postgraduate School, Jamova cesta 39, 1000 Ljubljana, Slovenia
3
Department of Earth Science, University of Pisa, Via S. Maria 53, 56126 Pisa, Italy
4
Department of Civil and Industrial Engineering, University of Pisa, Largo Lucio Lazzarino, 56122 Pisa, Italy
*
Author to whom correspondence should be addressed.
Water 2024, 16(3), 469; https://doi.org/10.3390/w16030469
Submission received: 21 December 2023 / Revised: 25 January 2024 / Accepted: 30 January 2024 / Published: 31 January 2024
(This article belongs to the Section Hydrology)

Abstract

:
We present data from six years (January 2016–December 2021) of monitoring the isotope composition of precipitation at the Sv. Urban station in Eastern Slovenia. The 68 precipitation samples were collected as a monthly composite. The complete dataset (193 data pints) includes information on the stable isotope composition of hydrogen (δ2H) and oxygen (δ18O) and tritium activity concentration (A), obtained using isotope ratio mass spectrometry (IRMS) and liquid scintillation counting (LSC) following electrolytic enrichment (EE), respectively. The isotope data, together with meteorological data, are reported. Calculations of the deuterium excess (d-excess), monthly, seasonal, and annual unweighted and precipitation-weighted means and local meteoric water lines (LMWLs) were conducted. The mean values for δ2H, δ18O, d-excess, and A, weighted by precipitation, were −59.9‰, −8.81‰, 10.6‰, and 7.7 TU. The disparities between unweighted and precipitation-weighted δ2H, δ18O, d-excess, A, and LMWLs underscore the significance of non-uniformly distributed precipitation. Annual variations in slope and intercept of the LMWLs emphasize the importance of longer data records (48+ months) to capture consistent trends, while combining data over longer periods may distort accuracy due to distinct isotope differences between individual years related to the variability of climate conditions typical for Slovenia.

1. Introduction

For decades, isotopes in water molecules (1H, 2H, 3H, 16O, 17O, 18O) have been employed for the tracking of the path of water molecules in the water cycle, from precipitation to surface and groundwater, and further, into the drinking water supply. Isotopes are commonly used to quantify water, solutes, and particulate exchanges between hydrological compartments during different hydrological processes [1,2,3,4,5,6,7,8,9,10,11,12,13,14,15,16,17,18,19,20,21,22,23,24].
Precipitation over lands represents the first step of the continental water cycle. Soil, surface waters, and groundwater acquire their isotope signature mainly from atmospheric precipitation [6,9]. Consequently, knowledge of the isotope signature of precipitation is a sine qua non condition for all subsequent water tracing studies on land and water management applications. However, such knowledge can be acquired only through comprehensive and systematic monitoring programs.
In the 1960s, the International Atomic Energy Agency (IAEA) in Vienna and the World Meteorological Organization (WMO) in Geneva initiated the Global Network for Isotopes in Precipitation (GNIP). Its purpose was to characterize and monitor the diverse isotope composition of precipitation [3,6,25,26]. In addition to GNIP, other national networks are dedicated to monitoring the isotope composition of precipitation [9,23,26,27,28,29,30,31,32,33,34,35,36,37,38,39,40].
The first investigations of precipitation regarding oxygen and hydrogen isotope composition in Slovenia began in the 1970s [41]. Subsequently, in 1981, the first systematic monthly isotope monitoring began in Ljubljana [37,38]. This monitoring marked the inception of the Slovenian Network of Isotopes in Precipitations (SLONIP), a web-based interactive research platform with δ18O, δ2H, and 3H data and related references [37]. The SLONIP research network platform, established in 2020, comprises stations distributed across the country, for which δ18O, δ2H, and 3H values are measured by researchers from the Jožef Stefan Institute (JSI). The SLONIP platform [37], available at https://slonip.ijs.si/ (accessed on 13 December 2023) [42], contains, to date, 2572 monthly isotope data points derived from composite precipitation samples collected at eight locations. It also provides location, sampling, and analysis (including references) information and isotope data presented in numerical and graphical form. Monthly, seasonal, and annual means, precipitation weighted means, and Local Meteoric Water Lines (LMWLs) are calculated using different regression methods. In addition, the Python code [43], enabling the respective calculations available on the platform, is deposited on GitHub (https://github.com/nyuhanc/Isotopes-in-precipitation-statistics) (accessed on 8 July 2022). The platform aligns with FAIR data concepts [44], and the functionalities and tools available are valuable for people interested in isotope precipitation data, even if they lack experience in data treatment, analysis, and visualization. Therefore, SLONIP allows for an in-depth understanding of the isotope signature of precipitation over a geographically, morphologically, and meteorologically complex area such as in Slovenia and the broader Adriatic–Pannonian region [31,38,45,46,47]. The SLONIP data are also useful for researchers on the global level [48,49,50,51,52].
The present work summarizes the results of six years of δ18O and δ2H and tritium activity concentration (A) data from the Sv. Urban SLONIP monitoring station. Monthly isotope data variations for the period 2016–2021 are discussed in conjunction with basic meteorological parameters, including precipitation (P) and air temperature (T). Further, calculations of deuterium excess (d-excess), monthly, seasonal, and annual unweighted and precipitation-weighted means and LMWLs were determined for the six-year period. These new calculations will be used to update the existing three-year dataset for the Sv. Urban available at the SLONIP platform [37]. Together with neighboring data, the reported data will help create more reliable regional and global isoscapes.

2. Materials and Methods

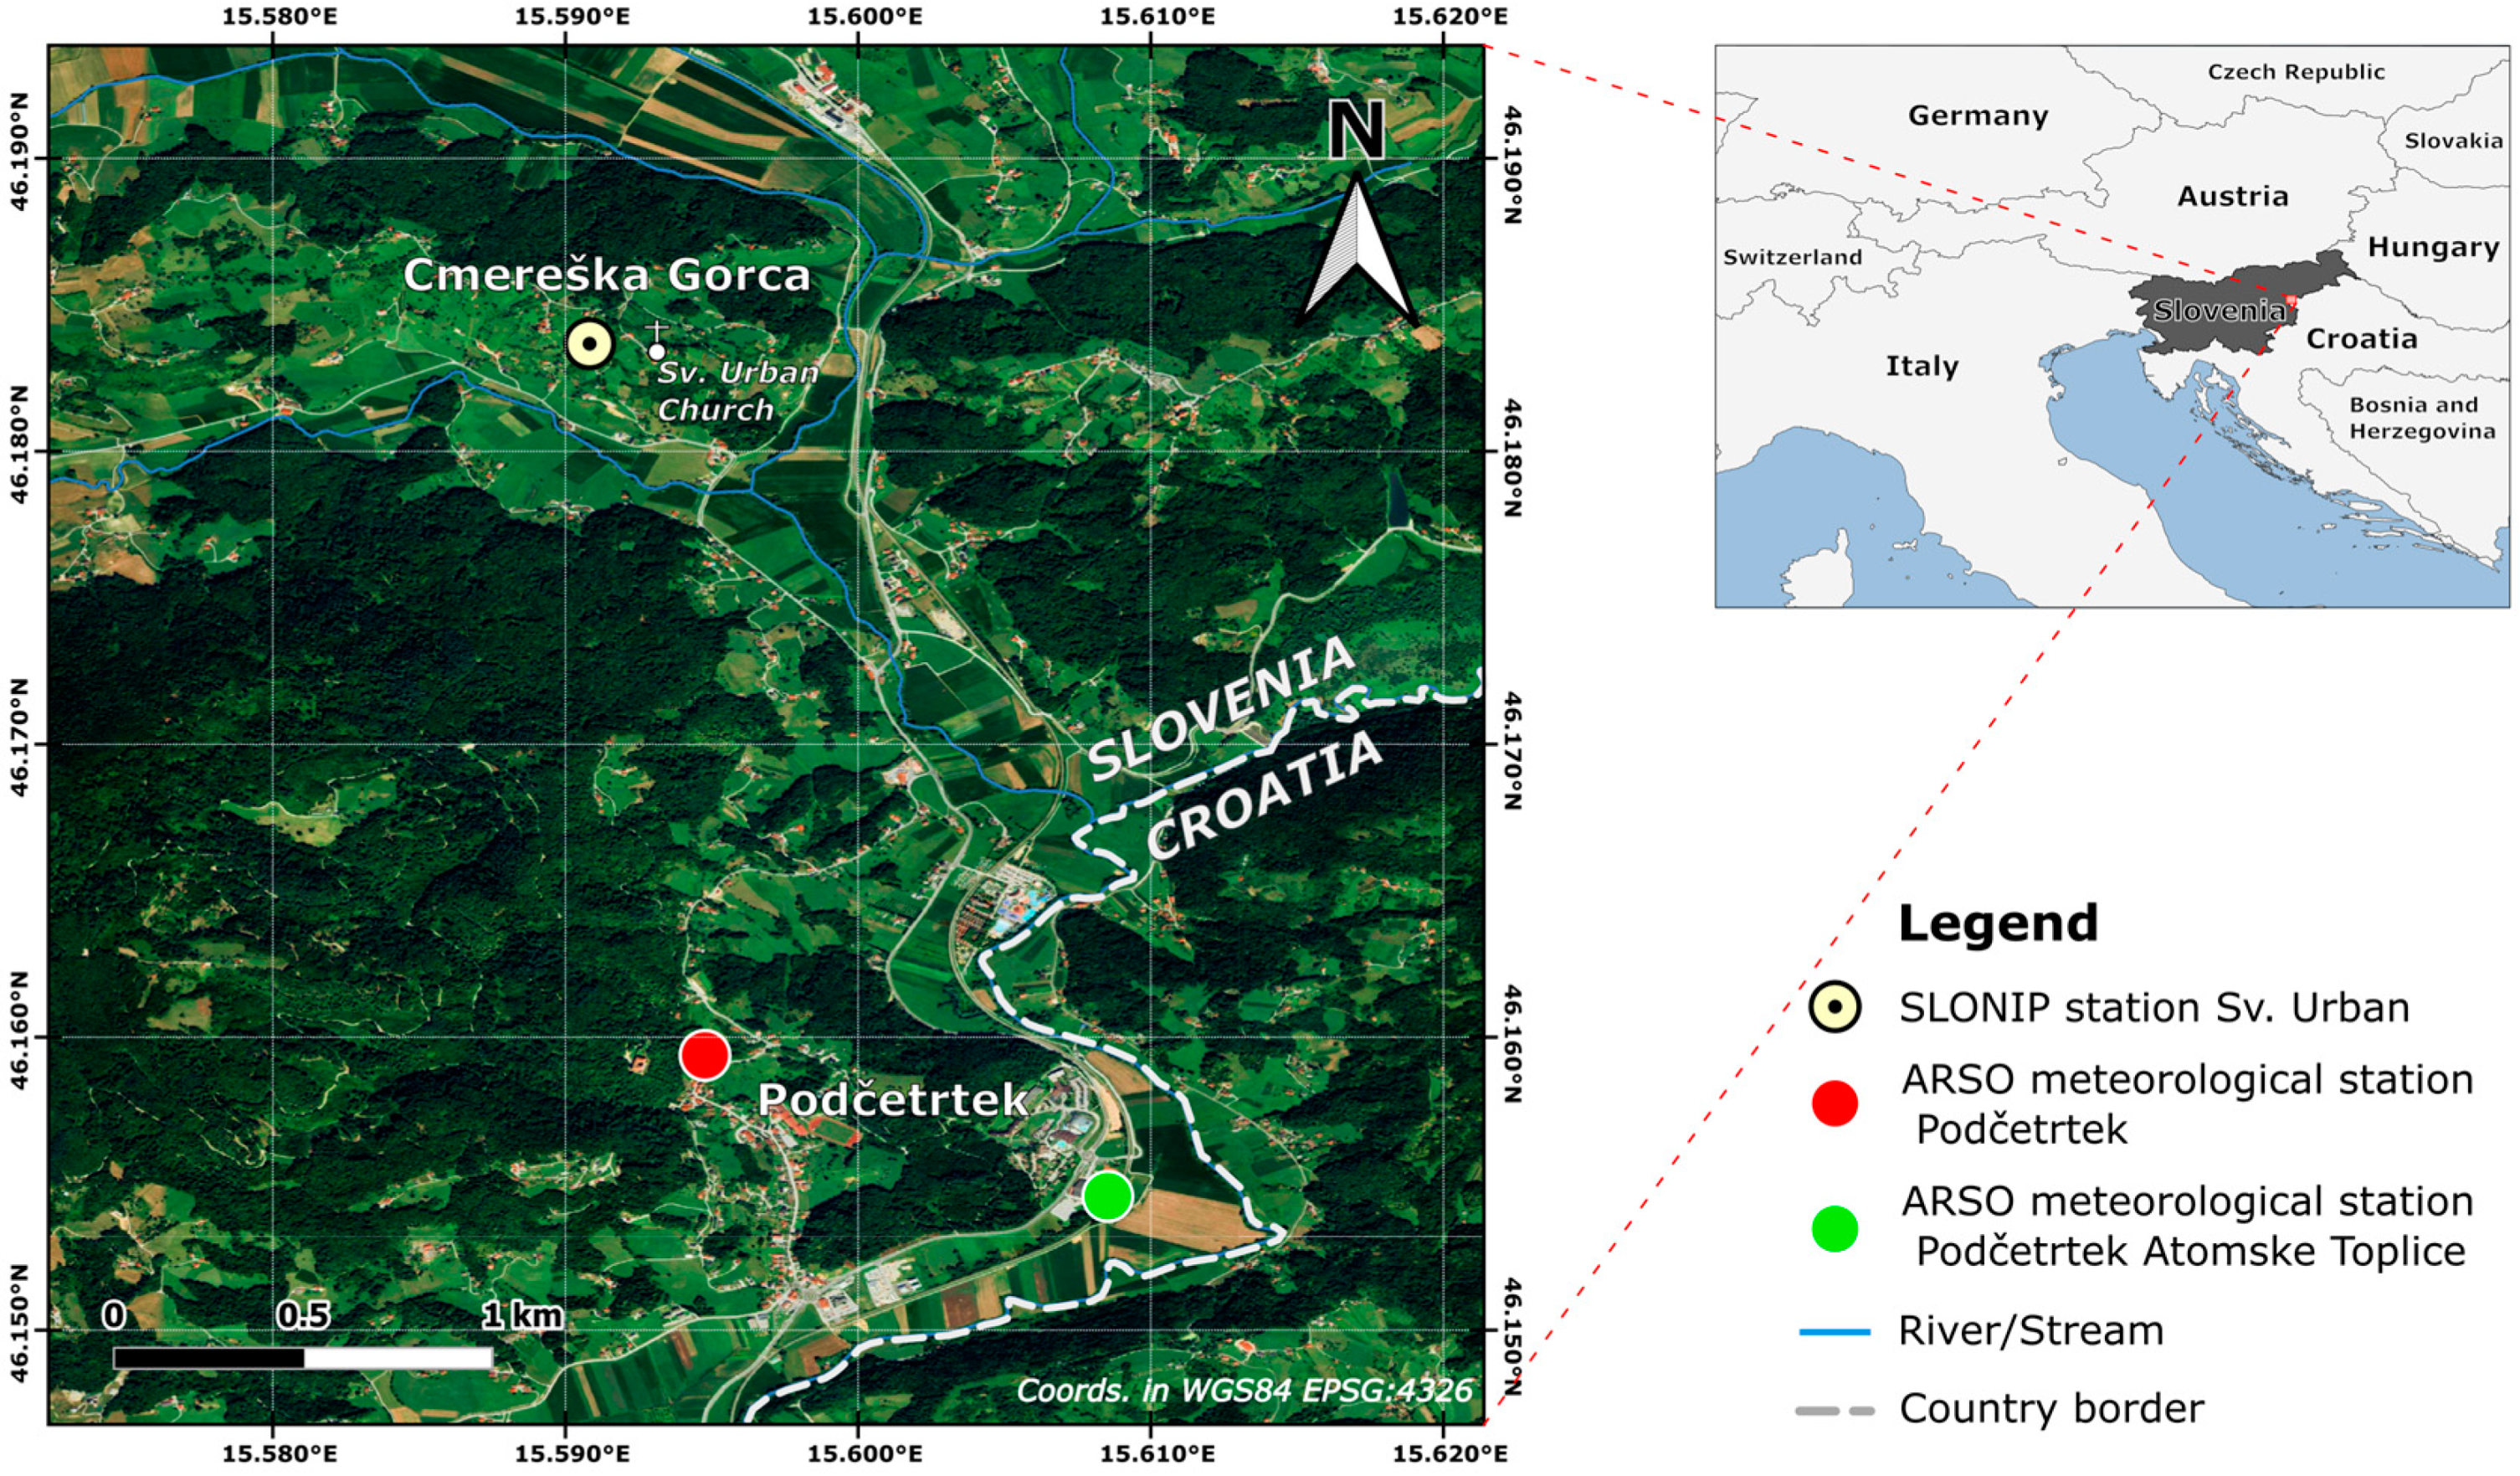
2.1. Study Site and Sampling

The sampling site is located at Cmereška Gorca, near Sv. Urban, Eastern Slovenia (SLONIP station Sv. Urban; WGS84: 46.183584° N, 15.590748° E, 283 m a.s.l., Figure 1). Sv. Urban is a village located in the municipality of Podčetrtek in the Savinjska statistical region, which is part of the Štajerska landscape. The area is mainly covered by forest and cropland and is renowned for its natural beauty and wellness tourism. Geologically, the region is composed of Miocene (M31-Sarmatian) clastic rocks such as marl, marly limestone, clayey marl, sand, and sandstone [53].
The local climate is similar to Zagreb in Croatia [54] and is classified as a Cfb subtype in the Köppen–Geiger climate classification [55,56], indicating a temperate climate with the coldest month averaging above 0 °C. It is also characterized by all months having average temperatures below 22 °C, at least four months averaging above 10 °C, and no significant precipitation difference between seasons (Table 1 and Table 2). According to the climate classification of Slovenia [57], the area belongs to the subcontinental climate, which is characteristic of the most continental and driest lowland of eastern and central Slovenia. Within this region, the altitude spans between 131 m and 650 m a.s.l., and the mean annual precipitation is slightly above 1000 mm (Table 3). It is the second warmest region in Slovenia with very high summer temperatures. During winter, temperatures fluctuate around 0 °C, and limited snow cover is observed due to low precipitation during the cold season.
The three-year isotope record of Sv. Urban from 2016 to 2018 is already included in SLONIP [37]. In the past, it was used as a testing station for the determination of the continental effect [45], 3H isoscapes [46], and the geostatistical evaluation of the design of precipitation-stable isotope monitoring networks across the Adriatic–Pannonian region [31]. However, a detailed description of sampling, analysis, and data evaluation was not reported or discussed.
Monthly composite precipitation was collected at Sv. Urban from January 2016 to December 2021 by a volunteer who owns the plot. Samples were collected using a self-made precipitation collector with a funnel diameter of 0.336 m, and a 50 L plastic container. The composite sample was collected from the beginning to the end of the month by pouring the water into a 10 L container after precipitation events and kept in the dark at room temperature until transport to the JSI laboratories. In the laboratory, the monthly volume (PSv. Urban) was recorded since August 2016 by weighing, and impurities (e.g., particulate matter) were removed by filtration (12–25 μm pore size ashless filter papers). For δ18O and δ2H measurements, samples were stored in glass bottles (minimum 30 mL), while for tritium activity concentration analysis, samples were stored in high-density polyethylene bottles (minimum 300 mL). Samples were kept in the dark at room temperature prior to analysis.
During the sampling period, the amount of water collected in December 2016 was insufficient for isotope analysis, and in January 2018, the sampling container was blown away by the wind. In spring 2020, the station could not be accessed frequently due to movement restrictions during the COVID-19 pandemic and consequently, a composite sample for March and April 2020 was collected. Samples for tritium activity concentration analysis have been collected since August 2016.

2.2. Stable Isotope Analysis

The isotope composition of hydrogen (δ2H) and oxygen (δ18O) was determined for 68 monthly and one two-month composite sample. The δ2H and δ18O values in samples collected from January to April 2016 were determined by isotope ratio mass spectrometry (IRMS) at the Istituto Nazionale di Geofisica e Vulcanologia (INGV), Italy, according to methods described by Kanduč et al. [58]. The δ2H and δ18O values in samples collected from May 2016 to December 2021 were determined using the H2–H2O [59] and CO2–H2O [5,60] equilibration technique at the JSI laboratories [37]. Measurements were performed on a dual inlet IRMS (DI IRMS, Finnigan MAT DELTA plus, Finnigan MAT GmbH, Bremen, Germany) with an automated H2–H2O and CO2–H2O HDOeq 48 Equilibration Unit (custom-built by M. Jaklitsch). The water bath temperature was 18 °C, and the water vapor trap (ethanol) was cooled to −55 °C. Samples of water were measured as independent duplicates. All measurements were performed in conjunction with laboratory reference materials (LRM), calibrated periodically against primary IAEA calibration standards VSMOW2 and SLAP2 to the VSMOW/SLAP scale. The results are expressed in the standard δ notation (in per mil, ‰), i.e., as the deviation of the sample (sp) from the standard (st):
δyX (‰) = (Rsp/Rst − 1) × 1000,
where yX is hydrogen (2H) or oxygen (18O), and R is 2H/1H or 18O/16O, respectively [61,62,63]. Results were normalized to the VSMOW/SLAP scale using the LIMS (Laboratory Information Management System for Light Stable Isotopes) program. Two in-house LRMs, with defined isotope values and estimated measurement uncertainties calculated by the Kragten method [64], were used for the normalization of results. For independent quality control, two in-house LRMs with estimated measurement uncertainties and USGS commercial reference materials (USGS 45, USGS 46, and USGS47) were used. The overall uncertainties were below 1‰ and 0.05‰ for δ2H and δ18O, respectively, and the average sample repeatability was 0.3‰ for δ2H and 0.02‰ for δ18O.

2.3. Tritium Activity Concentration Analysis

Tritium activity concentrations (A) were obtained for 61 monthly composite samples and one two-month composite sample using liquid scintillation counting (LSC) following electrolytic enrichment (EE). In order to achieve necessary detection limits in precipitation samples, electrolytic enrichment of tritium was performed. The samples were distilled prior to tritium enrichment in order to remove dissolved solids and other possible interferences. Approx. 380 mL of the sample was transferred to a 1 L distillation flask, and 1.5 g of activated charcoal was added to adsorb any volatile radionuclides present. Then, the flask was connected to a water-cooled condenser and a 300 mL receiving flask and heated until boiling. After approx. 300 mL of the sample was distilled, the distillation was discontinued, and the pH was checked. If the pH was out of the range (pH 4–9), the sample was redistilled. Tritium enrichment was achieved by electrolysis in an electrolysis cell constructed from a stainless steel tube (anode) and a perforated mild steel tube (cathode). The sample was transferred to a 250 mL volumetric flask, and 1.5 g of Na2O2 was added to act as an electrolyte. The sample was then transferred to a pre-weighed electrolysis cell and reweighed to determine the sample weight accurately before electrolysis. Three samples of tritiated water were electrolyzed with each batch of samples to monitor tritium enrichment factors. In addition, one blank deionized water sample was included in each batch to monitor possible contamination. The electrolysis cells were placed in their respective cooling tanks and filled with water and ethylene glycol. The cooling tanks were placed in a freezer kept at −3 °C. The hydrogen and oxygen outflows were connected to bubblers filled with silicone oil and vented outside the laboratory. The cells were connected to a DC power supply and electrolyzed starting with 4 A and then with an 8 A current until 670 Ah had passed through. The electrolysis cells were removed from the cooling tanks after electrolysis and allowed to warm to room temperature. The cells were then reweighed to calculate the mass of the sample that remained after electrolysis. The sample was then transferred to stainless steel distillation flasks for a second distillation. Then, these flasks were connected to a water-cooled condenser and receiving liquid scintillation vials and heated until boiling. At the end of distillation, the pH of the solution was checked. Then, 10 g of the sample solution was mixed with 12 mL of Ultima Gold LLT scintillation cocktail and measured in a Quantulus 1220 (Perkin Elmer, Waltham, MA, USA) liquid scintillation counter for 5 h together with a tritium-free water sample (dead water) to correct for detector noise and background, and standards were used for the determination of tritium detection efficiency.
Results are expressed in Bq/kg, and the final values are in Tritium Units (1 TU = 0.118 Bq/L), assuming 1 L = 1 kg of water. The combined measurement uncertainties were calculated according to JCGM 100:2008, considering all important uncertainty sources. The typical limit of detection, calculated according to ISO 11929, was 0.147 Bq/kg (1.2 TU).

2.4. Meteorological Data

In a few cases, the volume of collected water was not recorded. Therefore, monthly precipitation data (PARSO) were acquired from the nearest meteorological station, Podčetrtek (WGS84: 46.159559° N, 15.594570° E, 252 m a.s.l., Figure 1), which is part of the Slovenian National Meteorological Network maintained by the Slovenian Environmental Agency [65] (accessed on 4 September 2023). Mean monthly air temperature data (TARSO) were acquired for the ARSO meteorological station at Podčetrtek–Atomske Toplice (WGS84: 46.154740° N, 15.608344° E, 200 m a.s.l., Figure 1).

2.5. Data Evaluation and Visualization

First, the Pearson correlation coefficient r between available precipitation data PARSO and PSv. Urban was checked, and a high correlation was confirmed. Therefore, PARSO data were used for further calculations.
Thirty-two different data attributes were selected, as described by Vreča et al. [37], and used for the calculations of deuterium excess (d-excess) [‰] = δ2H − 8 × δ18O [3], as well as for monthly, seasonal, and annual unweighted and precipitation-weighted δ2H, δ18O, d-excess, and A means, performed using Python code [43]. For each data type, when calculating means and regression coefficients, we only took into account years in which eight or more monthly samples were measured. Also, for each data type, the sum of precipitation for all months with a known value must exceed 70% of the total precipitation sum for that year [42] (accessed on 13 December 2023). Therefore, the mean annual A value could not be calculated for 2016 (n = 4; 38% of annual precipitation collected). For comparison purposes, the LMWLs were calculated using different regression methods. The methods proposed by Hughes and Crawford [49] and Crawford et al. [66] are applied here, and are: 1—major axis regression (MA), 2—reduced major axis regression (RMA), 3—precipitation weighted MA (PWMA), and 4—precipitation weighted RMA (PWRMA), as described by Vreča et al. [37] in the Evaluation of data submenu of the SLONIP platform. However, none of these methods considered the known experimental uncertainties of the isotope data. Thus, minimizing the Sum of the Squares of the Weighted Residuals (SSWR) was applied to compute the LMWLs. In this method, the residual is the distance between the experimental point (δ18O, δ2H) and the corresponding estimated “best” point ( δ ^ 18O, δ ^ 2H) belonging to the straight line δ ^ 2H = b + a· δ ^ 18O measured in units of the experimental uncertainties, with a coverage factor of 2 to account for the unknown uncertainties related to sampling and storage procedures (hence, 0.1‰ for σδ18O and 2‰ for σδ2H).
S S W R = i = 1 N δ O 18 δ ^ O 18 σ δ O 18 2 + δ H 2 δ ^ H 2 σ δ H 2 2
To obtain the confidence intervals of the a and b coefficients, we ran Monte Carlo simulations. For each subset of monthly δ2H and δ18O values, 1000 random resamplings of each measured value were performed. Each resampled point was obtained by generating a couple of independent Gaussian random variables, with mean values obtained by the fit estimations and with the same standard deviations used as denominators in the computation of SSWR. For each resampling, the LMWL coefficients were obtained. Therefore, two “empirical” distributions of a and b were obtained from each Monte Carlo simulation, thus allowing the determination of the 95% confidence intervals for a and b. Moreover, 95% confidence intervals were also obtained for the SSWR values. These values agree with the theoretical confidence intervals that can be obtained through an analytical calculation, thus reinforcing the validity of the assumption of the chi-square distribution of the sum of squared residuals.
All results were visualized using OriginPro 2021 software (OriginLab, Northampton, PA, USA), and the spreadsheets and heat maps were created in Excel (Microsoft Office Professional Plus 2016) using conditional formatting. The geographical presentation of the sampling location was produced on QGIS 3.10 (v. A Coruña). The calculations of minimum, maximum, and mean values, as well as the linear relation between T and δ18O, were calculated using Excel.

3. Results and Discussion

All results of the monthly isotope composition of precipitation parameters (δ2H, δ18O, d-excess, and A) for Sv. Urban and monthly PARSO and TARSO data at ARSO meteorological stations from January 2016 to December 2021, are summarized in Table S1. The data attributes are described in the sheet Data attributes in Table S1a, and the data in Table S1b are parsed as required for the input file for calculations by the Python code [37,43]. Monthly precipitation data for Sv. Urban (PSv. Urban) are also reported for comparison with data from ARSO meteorological station, Podčetrtek, in Table S1c. Temporal variations of all parameters are shown in Figure 2, and the results of monthly PARSO, TARSO, δ18O, d-excess, and A are presented as heat maps in Table S2.
The mean monthly, seasonal, and annual values, as well as mean 2016–2021 PARSO and TARSO, along with precipitation-weighted monthly means of δ2H, δ18O, d-excess, and A, are presented in Table 1, Table 2 and Table 3. Results of regression analysis (MA, RMA, PWMA, and PWRMA), i.e., calculated slopes and intercepts with errors, for specific years, are presented as heat maps and summarized with mean values for the periods 2016–2018 and 2016–2021 in Table S3a,b. The δ2H, δ18O, d-excess, and A values for the March and April 2020 composite sample were −42.6‰, −6.72‰, 11.2‰, and 9.7 TU, respectively. These data are not reported in tables and were not used for mean and LMWL calculations but are presented in Figure 2 (marked with an arrow).

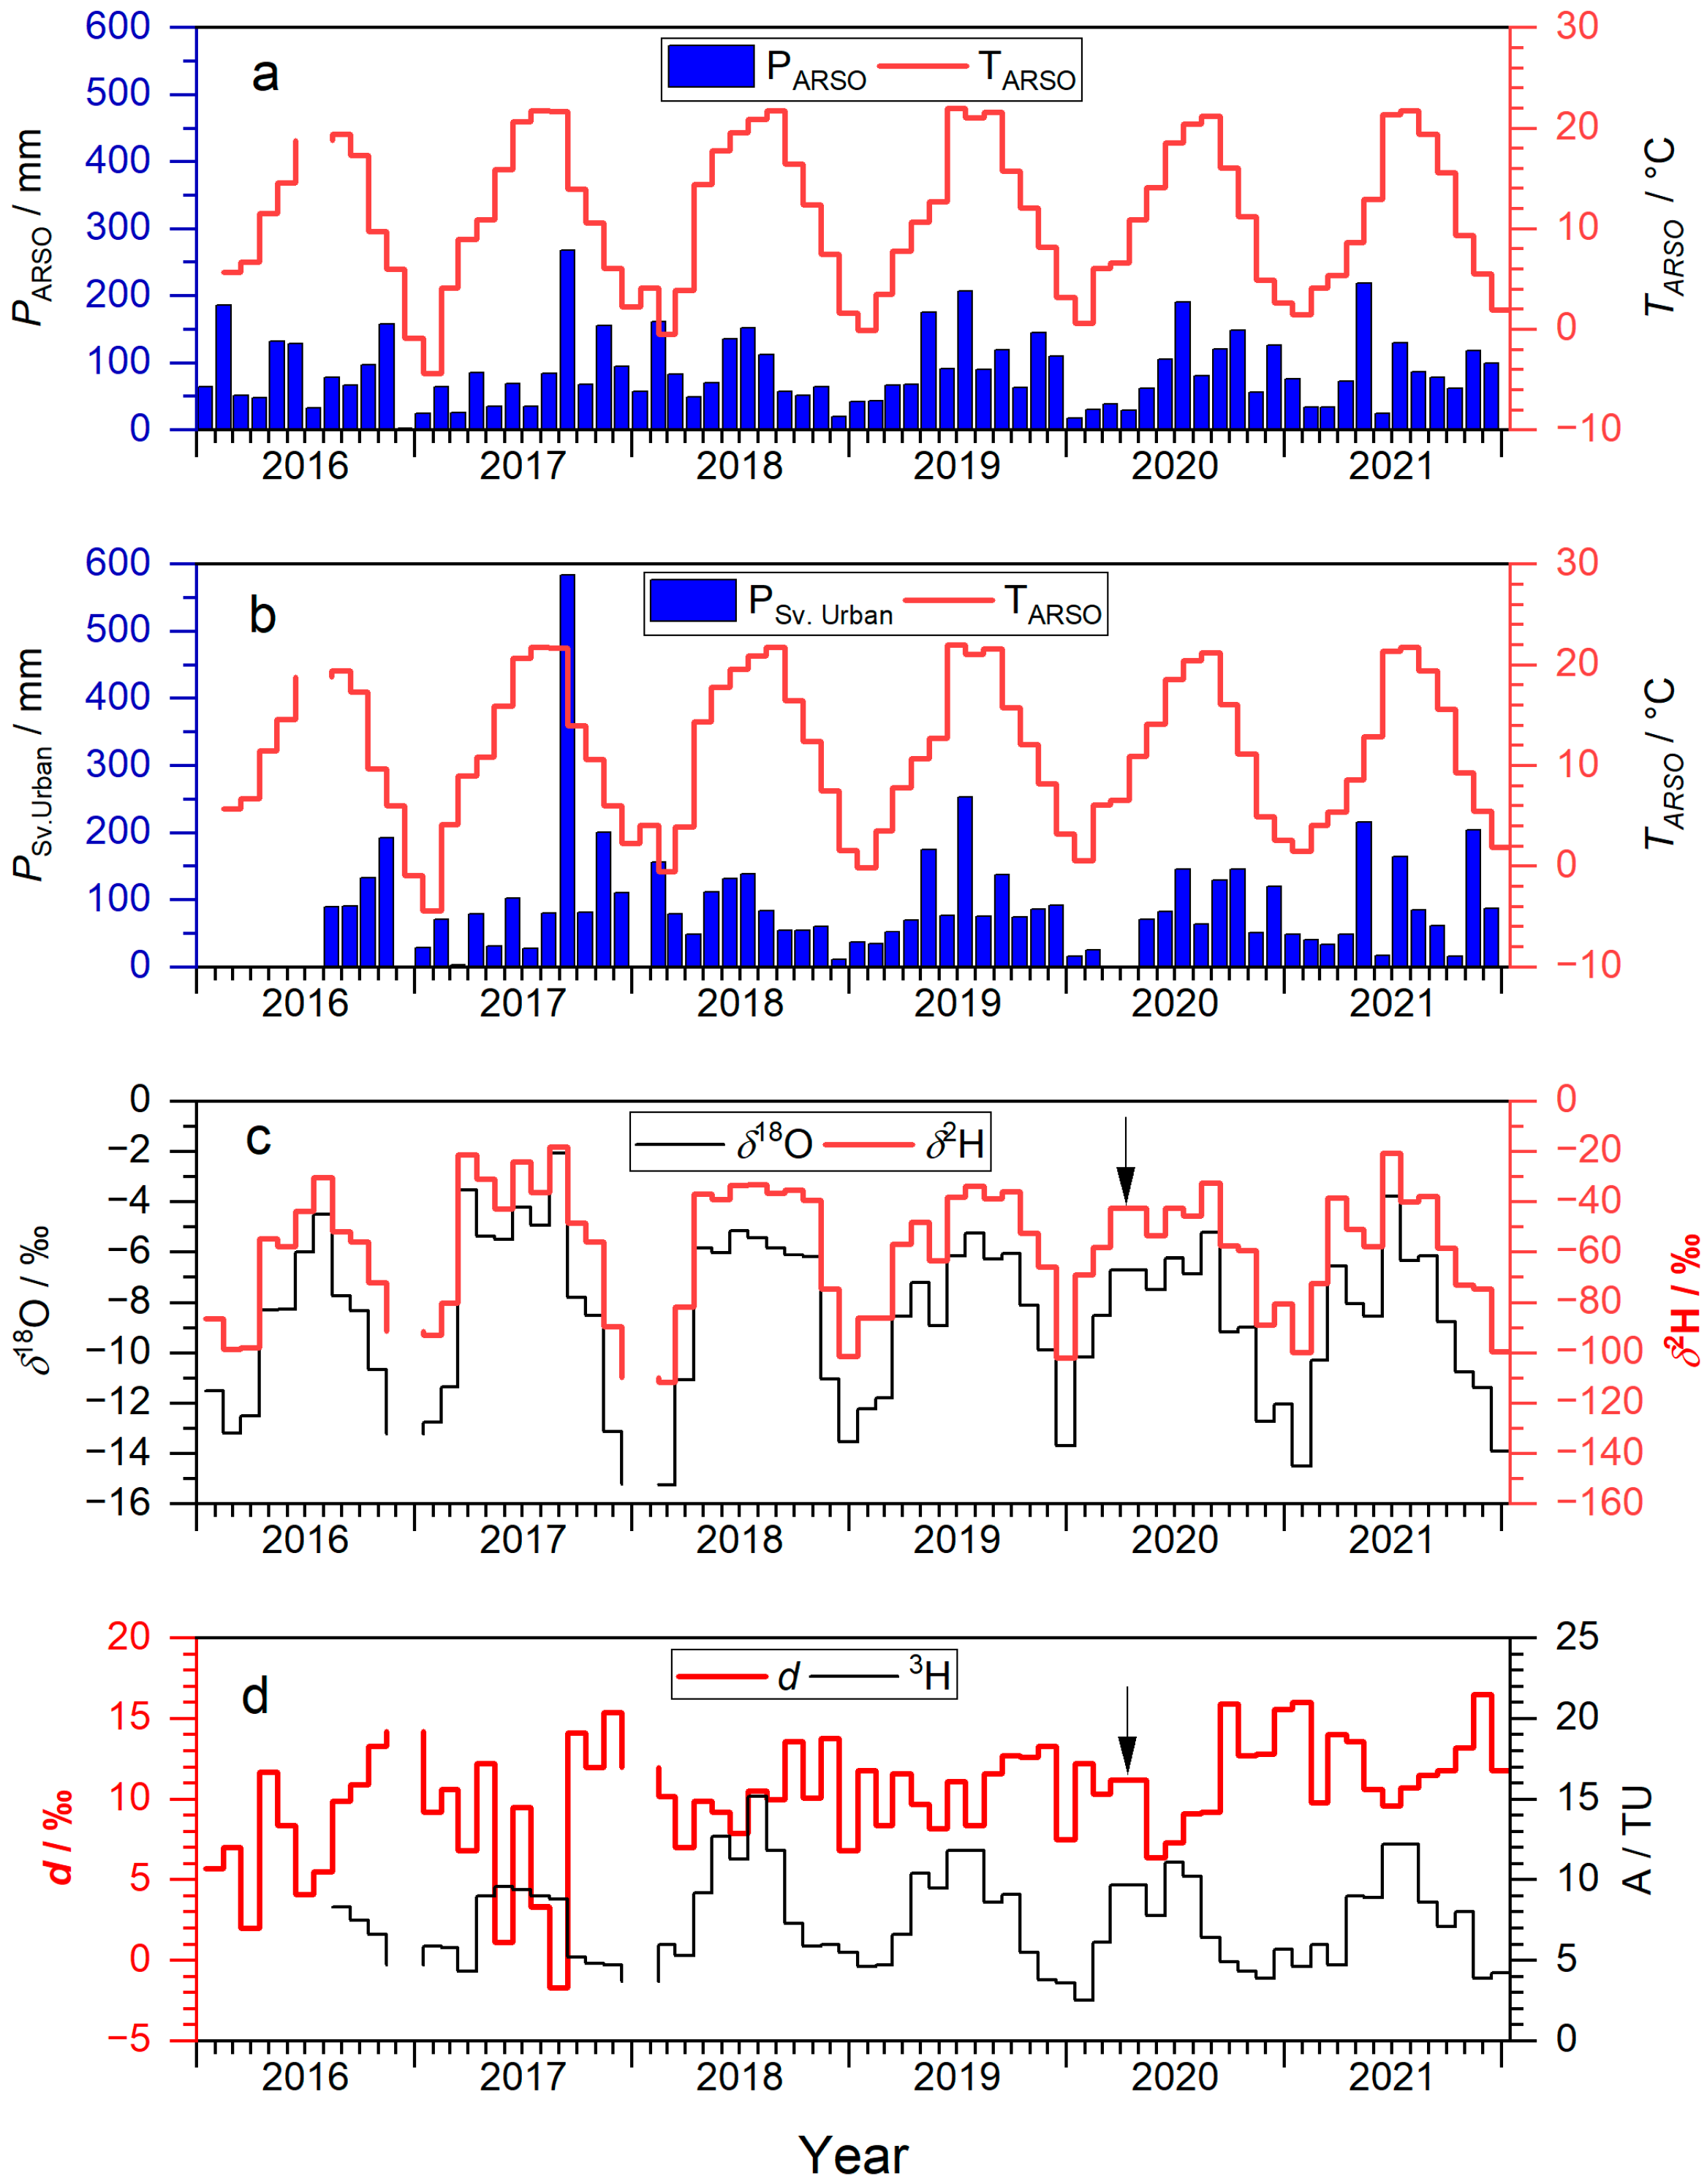
3.1. Meteorological Data

The lowest precipitation was recorded in December 2016 (PARSO = 2.1 mm), the highest in September 2017 (PARSO = 267.4 mm, PSv. Urban = 583.7 mm), and 75% of PARSO data exceeded 50 mm. In addition, no uniform distribution of P is observed (Figure 2a,b), with the highest monthly P range in 2017 (242 mm) and the lowest in 2018 (141 mm) (Table S2). Pearson’s correlation between PARSO and PSv. Urban is high (r = 0.87; n = 61). The lowest monthly variability in P was observed for August (35 mm) and the highest in September (210 mm) (Table S2). The largest difference between PARSO and PSv. Urban was observed for September 2017 (Figure 2a,b) and is related to local stormy events typical for Slovenia [67].
A typical seasonal air temperature variation is characteristic of the area, with winter minimums and summer maximums, as shown in Figure 2a and Table 2. The lowest T was recorded in January 2017 (TARSO = −4.4 °C) and the highest in June 2019 (TARSO = 22.0 °C). The maximum monthly mean T exceeded 20 °C every year except in 2016 when July data are missing. No trend in maximum T is observed for 2017–2021 period (Figure 2a,b). On the contrary, the minimum monthly mean T was below 0 °C only in 2016–2019 and showed an increasing trend up to 1.5 °C in 2021 (Figure 2a,b). The difference between the maximum and minimum monthly T varied from 20.3 °C in 2016 and 2021 to 26.2 °C in 2017 (Table S2). Similar T differences, characteristic of continental stations, were reported in Ljubljana [68] and Zagreb [54].
The lowest mean monthly P and T are characteristic for January, and the highest values are observed for July (Table 1). The seasonal P variability is small; however, slightly higher precipitation is characteristic of the summer and autumn months (Table 2). The annual precipitation varied between 1008 mm in 2020 and 1222 mm in 2019, with a mean value of 1057 mm (Table 3). The annual temperature varied between 10.6 °C in 2021 and 11.7 °C in 2018, with a mean value of 11.1 °C (Table 3).
The climate conditions of the area are similar to Zagreb [54]. However, Zagreb is situated at a lower elevation and thus has lower mean annual precipitation (933 mm, mean for 2012–2018) and higher air temperature (13.5 °C, mean for 2012–2018) than the area of Podčetrtek. As reported by Krajcar Bronić et al. [54] for the period 1976–2018, monthly precipitation exceeded 200 mm only four times, while in Podčetrtek, three such events (Table S2) were recorded in the much shorter 2016–2021 period and confirmed general predictions of changes in the precipitation regime in Slovenia [69].
As reported by Kozjek et al. [57], the region has experienced significant climate change marked by decreased precipitation and rising air temperatures since 1961. The mean annual precipitation decreased from 1085 mm to 1061 mm in reference periods 1961–1990 and 1981–2010 [70]. Meteorological data confirm that the climate in the different regions of Slovenia is changing, but the regions remain stable [57]. Bertalanič et al. [69] predicted, based on model simulations, a significant increase in the annual mean temperature by the end of the 21st century across entire Slovenia in all seasons. A noticeable increase in precipitation in winter and an uncertain change in summer are expected. However, heat waves and thunderstorms in summer and flooding in winter and spring pose the main hazards in the broader area. The impact of climate change is expected to be highly localized and specific to a particular location, with differences occurring between the seasons.

3.2. Stable Isotope Data (δ2H, δ18O, and d-excess)

The δ2H and δ18O monthly variations (Figure 2c) show patterns typical for the continental stations of the Northern Hemisphere [48], e.g., Ljubljana [67,68,71] and Zagreb [54], with minimum values in winter and maximum in summer (Figure 2c,d, Table 1, Table 2, and Table S1). Annual patterns are not uniform, and fluctuations were recorded during different years (Figure 2c,d). The lowest monthly δ2H value was recorded in February 2018 (−111.6‰) and the highest in August 2017 (−18.2‰). However, the lowest precipitation-weighted mean monthly values (Table 1) are recorded for December (−97.1‰), and the highest for August (−35.9‰). The δ18O record generally follows the δ2H (Figure 2c), with the lowest δ18O recorded in February 2018 (−15.23‰) and the highest in August 2017 (−2.06‰). The lowest precipitation-weighted mean monthly δ18O values (Table 1) are recorded for winter, i.e., December (−13.58‰), and the highest for summer, i.e., August (−5.55‰) and June (−5.54‰). The highest annual range between the monthly values of 93.4‰ in δ2H and 13.15‰ in δ18O was observed in 2017 and is related to the highest T and P monthly range. Such a range is slightly higher than the one observed for Ljubljana [67,71], and lower than recorded in Zagreb [54] and corresponds to the continental effect in the Adriatic–Pannonian region estimated to be −20‰/100 km δ2H and −2.4‰/100 km for δ18O [45].
The precipitation-weighted mean values for 2016–2021 were −59.9‰ for δ2H and−8.81‰ for δ18O and are slightly higher than values obtained for the shorter 2016–2018 period (Table 3). However, as reported by Vreča et al. [37] and presented on the SLONIP platform [42] (accessed on 13 December 2023), comparing mean and precipitation-weighted mean values shows no differences for some years but pronounced differences for others. Therefore, different δ2H and δ18O annual means indicate the importance of unequally distributed precipitation, which changes monthly and annually (Figure 2). The observed inter-annual and annual variability likely results from varying hydroclimatic conditions that are changing in space and time, and are observed on both regional [54,57] and global scales [72].
The d-excess was calculated to characterize the deviation of the isotope composition of precipitation from the Global Meteoric Water Line (GMWL, [73]) (Table 1, Table 2 and Table 3, Figure 2 and Figure 3). The monthly variations in d-excess are presented in Figure 2d. The lowest d-excess was recorded in August 2017 (−1.7‰) and the highest in November 2021 (16.5‰). Most d-excess values (96%) range between 3 and 17‰. Three monthly d-values are <3‰ (Table S2; i.e., March 2016, May and August 2017), while 38 are >10‰ (Table S2). The lowest precipitation-weighted mean monthly d-values (Table 1 and Table 2) are recorded for summer, i.e., June, and the highest for autumn, i.e., November. The highest annual range of 17.1‰ between the monthly values was observed in 2017 and is related to the highest T, P, δ2H, and δ18O monthly range (Table S2).
During the months with low d-excess (<3‰), precipitation varied between 35 mm and 84 mm. As Harvey [74] summarized, d-excess in precipitation is determined by air/sea interaction processes over the ocean surface, during which the value of d-excess is fixed and remains unchanged as air moves across the continents and loses moisture by rainout [75,76]. However, d-excess also identifies non-equilibrium processes, such as diffusion across a humidity gradient with the evaporation of droplets falling through dry air or the formation of precipitation in mixed-phase and ice clouds. It can also change as the air masses move inland due to secondary processes, like evaporation from an open surface water body that reintroduces moisture to the air [72,77,78,79,80]. In addition, d-values can change as the precipitation sample sits in the precipitation collector [74]. It was estimated that the initial d-values should not be less than 3‰, and lower values should be used cautiously unless the source of their evaporative enrichment is known [74]. Previous investigations in Slovenia showed that up to 24% of daily precipitation d-excess values were <0‰ at the coastal station Portorož, and were recorded mainly during days with <1 mm precipitation and at relative humidity <75% [81]. Therefore, negative d-excess was attributed to the evaporation of raindrops from the surface of the rain gauge at lower relative humidity. However, at Kozina, an inland station, negative d-values occurred only during the summer of 2003 [81] and could not be attributed only to evaporation from the rain gauge due to higher precipitation but also to secondary processes like partial evaporation of raindrops below the cloud base [82]. Similar to the conditions observed at Kozina, low d-values were recorded at Sv. Urban during months with sufficient precipitation. These observations cannot be attributed to the sampling method but are based on available data on the partial evaporation of raindrops below the cloud base.
During months when d > 10‰, the precipitation varied between 18 mm and 267 mm. As presented in previous studies in the Adriatic–Pannonia region [45,54,68,81], higher d-values have been linked to climate conditions related to Mediterranean cyclogenesis. This represents the most important precipitation air masses with high rain quantity [83], and it prevails during the colder seasons [45]. However, higher d-values could also be related to non-equilibrium processes during precipitation formation in mixed-phase clouds that, according to Putman et al. [72], occur in all seasons at all latitudes but are primarily responsible for snow formation in mixed-phase clouds. The process is typical for continental sites, where d-excess is higher in the cold than in the warm season [72] and is also observed at Sv. Urban (Table 2). At Sv. Urban, 10 of 16 winter monthly data are above 10‰, indicating the possible increased d due to precipitation formed in mixed-phase clouds. However, more detail meteorological investigations, beyond the scope of our research, would be necessary to discern between the influences of different non-equilibrium processes.

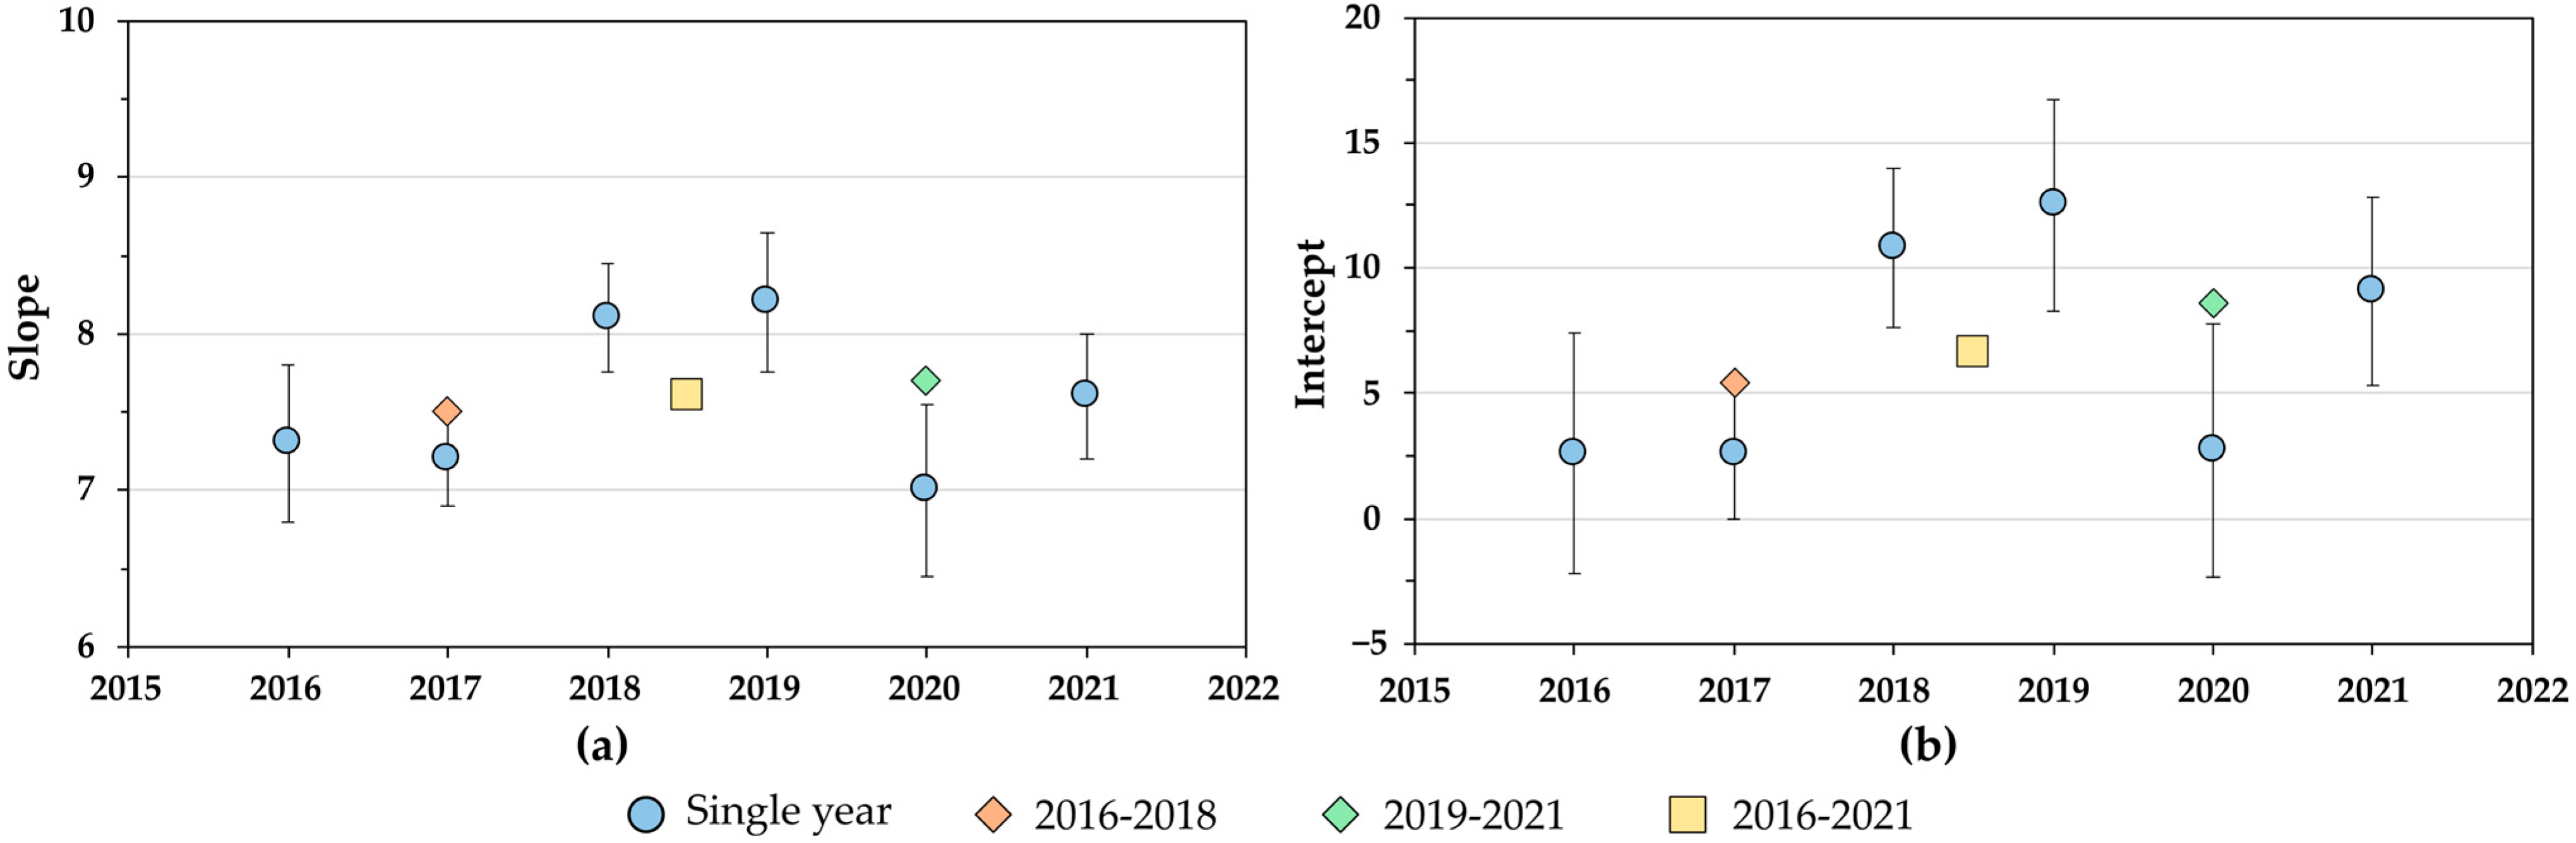
3.3. Local Meteoric Water Lines (LMWLs)

LMWLs are simplified site-specific long-term representations of the mean δ2H-δ18O relation and can provide a reference framework for interpreting isotope ratios measured in terrestrial and biologically derived waters [72]. They can also provide useful process-oriented checks on hydrology to aid in understanding water cycle interactions and serve as benchmarks for evaluating hydroclimatic processes in isotope-enabled atmospheric circulation models (iGCMs) [72]. They vary temporally and spatially in their slopes and intercepts on regional and local scales [47,48,72,73].
The δ2H-δ18O relation of monthly precipitation at Sv. Urban is shown in Figure 3, where we can see that all data align along Craig’s GMWL. The most negative values above the GMWL align with the classification according to Putman et al. [72] and are associated with precipitation from mixed-phase clouds. Conversely, the most positive values above the GMWL probably indicate the influence of continental recycling, and the highest value below the GMWL (Figure 3) reflects sub-cloud evaporation. As the regional hydroclimate and climate classes shift due to climate change, transitions to arid or tropical sites (Köppen–Geiger class C to B or A) are expected to be observe at temperate stations like Sv. Urban, which are reflected in the LMWLs.
Given the 6-year observation period at Sv. Urban, LMWLs were derived for the whole period, the first three years, and yearly. Results of calculations performed using different regression methods proposed by Crawford et al. [66], i.e., slopes and intercepts together with their errors, using Python code [43], are summarized in Table S3. The differences between different methods and specific years are presented as heat maps in separate sheets. Six-year mean values, standard deviation, maximum, minimum and range values are presented and compared to mean values for 2016–2018 [37]. No significant differences in the intercept and slope values, given the associated errors, were identified within each year.
The slopes and intercepts derived with the minimization of SSWR are reported in Table 4 and Figure 4. The LMWL for the whole period has a slope of 7.6 ± 0.2‰ and an intercept of 6.6 ± 1.6‰, and the 2016–2018 LMWL has a slope of 7.5 ± 0.2‰ and an intercept of 5.4 ± 2.0‰. While the slopes of these periods are almost identical, their intercept values differ; even if, given the intercepts’ confidence intervals, such differences are probably not statistically significant.
Given the derived confidence intervals, 2016, 2017, and 2020 have similar slope and intercept values (Table S3). These years also present the lowest yearly slope and intercept values in the observation period (Figure 4 and Table 4). Given the confidence intervals, the slopes and intercept values for 2018 and 2019 are similar and are also the highest yearly slopes and intercepts. Also, the slope and intercept values for 2016, 2017, and 2020 significantly differ from those of 2018 and 2019. The year 2021 has intermediate slope and intercept values.
The six-year record for Sv. Urban does not show a systematic trend but confirms the need for a record length threshold of 48 months to balance the significant variability observed on a yearly scale from shorter sampling period datasets [72]. A concluding observation regarding the quality of the fitted LMWLs is worth making. For the whole observation period, the 2016–2018 three-year period, and the year 2017, the regressions’ SSWR values (Table 4) fall outside the respective SSWR confidence intervals, suggesting a poor fit of the linear model, while the single-year LMWLs (except 2017) have SSWR within the confidence intervals (Table 4), proving the goodness of almost all yearly fits. The high SSWR for the whole period and the 2016–2018 period may be due to the merging of each year’s precipitation. Consequently, they are best fitted by separated linear models, thus further suggesting effective isotope differentiation between the single years.
Finally, the slopes and intercept values of the LMWLs derived with MA, PWMA, RMA, and PWRMA, and with the minimization of the SSWR (which accounts for experimental uncertainties) were compared. Almost all MA, PWMA, RMA, and PWRMA derived intercept and slope values fall within the confidence intervals derived from the minimization of the SSWR. The only exception is 2016, for which four data points were affected by higher analytical uncertainties as they were measured in a different laboratory. Generally, the MA and RMA regression were considered more appropriate for calculating the MWLs since both δ18O and δ2H are associated with measurement uncertainties [66]. However, neither the MA nor the RMA regressions use the actual measurement uncertainties on the isotope values as weights in their formulation. In this work, the applied minimization of the SSWR uses the experimental uncertainties (laboratory uncertainties with a coverage factor of 2) to derive LMWL coefficients. Determining reliable experimental uncertainties related to the laboratory procedures, the sampling strategies, and spatiotemporal natural isotope variability of precipitation would help correctly identify meteo–climatic processes and validate our descriptive models.

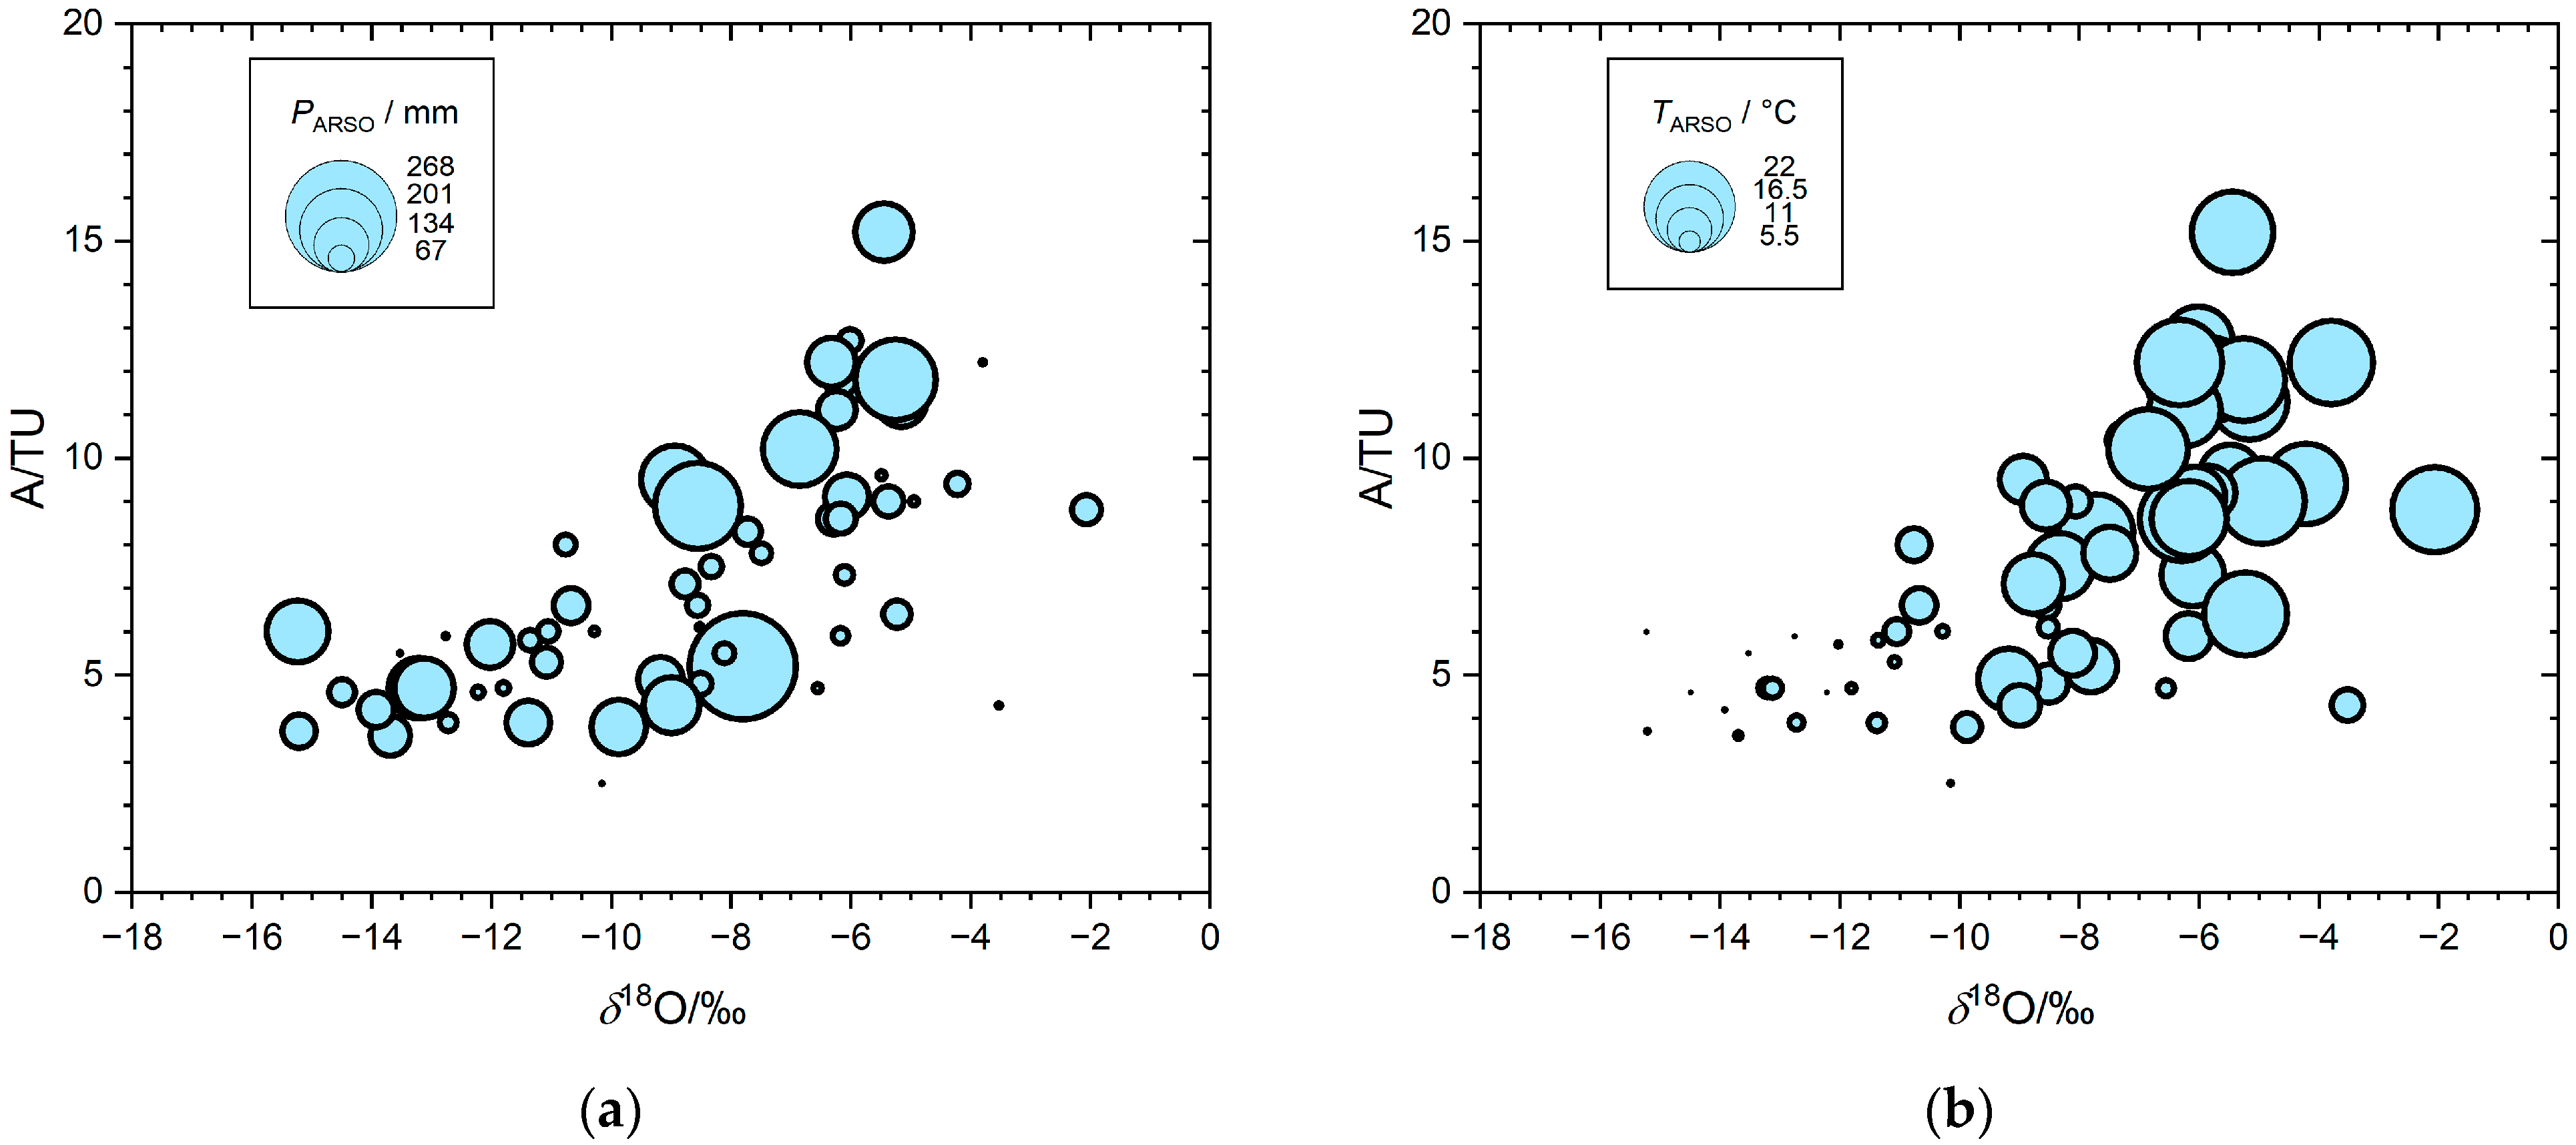
3.4. δ18O vs. Temperature Relationship

The relationship between local air temperature (TARSO) and the oxygen isotope composition (δ18O) of precipitation holds special interest, primarily due to the potential significance of stable isotopes as paleoclimate indicators. This correlation is typical of mid and high latitudes, where seasonally fluctuating temperatures cause variations in the precipitation, due to the progressive degree of rainout from air masses as they cool off [48]. This pattern is notably characteristic also for central Slovenia [67,68,71] and Croatia [54]. As shown in Table 5, the relationship between parameters (the slope and the intercept) changes over time. For the entire period, it appears similar to the observations made in Zagreb [54]. However, interpreting our data requires caution, given that the isotope and temperature data provided correspond to different locations.

3.5. Tritium Activity Concentration (A) Data

The maximum monthly mean precipitation weighted A during the study period was the highest in August (12 TU), whereas the lowest was in November and December (4.4 TU) (Table 1). Generally, A is higher in spring and summer (Table 2, Figure 2), whereas the lowest activities are found in autumn and winter. Such seasonal variations have been observed also elsewhere [54,67,84]. They can be associated with an increased moisture exchange from the stratosphere to the troposphere, the so-called “tropopause leak”, usually causing a spring to early summer maximum of A in precipitation [85,86]. Average winter A are below 5 TU, close to the pre-bomb natural tritium activities [54].
The highest annual mean A was determined in 2018 and 2019, 9.5 TU and 8.1 TU, respectively (Table 3). This finding is consistent with observations that tritium values in precipitation are higher during the solar minimum sunspot numbers and corresponding maximum neutron flux [84]. As tritium is naturally produced in the atmosphere through cosmic ray interactions, the maximum neutron flux produces the maximum tritium production rate. Similar results were also observed in Zagreb in 2018, where the annual mean A amounted to 8.7 TU [54], which is lower than our data. Interestingly, A values in 2020 and 2021 are still higher than in 2017, before the solar minimum in sunspot numbers. The reason could be that cosmic neutron flux decreased after 2022 [87], meaning increased tritium production is still observed in the atmosphere. There also seems to be an interdependence in the A, T, and δ18O values (Figure 5b). Nevertheless, the scatter of data is much larger compared to that from Figure 3b, showing the interdependence of δ18O, δ2H, and T. This is most likely due to tritium activity concentrations in precipitation being more influenced by the natural production of tritium in the atmosphere and tropopause leak, rather than solely depending on air temperature.

4. Conclusions

Six years of precipitation isotope records (δ2H, δ18O, d-excess, and A), obtained between 2016 and 2021 at the Sv. Urban research station in eastern Slovenia, and meteorological data (P, T) from the nearest national meteorological stations (Podčetrek and Podčetrtek–Atomske Toplice) were investigated. The observed monthly and seasonal fluctuations of P, T, δ2H, δ18O, d-excess, and A are typical of continental stations. The discrepancies between unweighted and precipitation-weighted δ2H, δ18O, d-excess, A, and LMWLs were observed and underscored the significance of non-uniformly distributed precipitation. We proved within this study that six years of isotope monitoring in precipitation provide good temporal trends and correlations of the parameters determined. The observations from 2016 to 2021 confirm predictions of changing precipitation patterns in Slovenia. Climate change indicators suggest decreasing precipitation and rising temperatures in the region since 1961, with models projecting further temperature increases by the end of the 21st century, affecting seasons differently. The area faces extreme weather conditions, like summer heatwaves, thunderstorms, and winter/spring floods.
Local Meteoric Water Lines (LMWLs) serve as references for interpreting water isotopes and examining hydrological processes. Analyzing data over six years at stations like Sv. Urban reveals annual fluctuations in these lines, emphasizing the need for longer observation records to capture more consistent trends and mitigate short-term variability. Almost all annual fits exhibit good quality, but merging data for longer periods reduces the goodness of LMWLs’ fits, suggesting distinct isotope differences between individual years.
The data obtained also apply to different water cycle investigations, including water resource research, atmospheric studies, echo-hydrology, and food authentication. Together with neighboring data, they can help derive more reliable regional and global isoscapes. However, meteorological data were obtained from the nearest national meteorological stations, and caution is needed when using such data. Also, an improved monitoring strategy should be implemented in the future.

Supplementary Materials

The following supporting information can be downloaded at: https://www.mdpi.com/article/10.3390/w16030469/s1, Table S1: All results of monthly isotope compositions of precipitation parameters (δ2H, δ18O, d-excess and A) for Sv. Urban, together with monthly precipitation (PARSO) and air temperature (TARSO) data at ARSO meteorological stations from January 2016 to December 2021 (Table S1a: Data attributes, Table S1b: Results–monthly, Table S1c: Precipitation Sv. Urban). Table S2: The temporal variations of monthly PARSO, TARSO, δ18O, d-excess, and A presented as heat maps. Table S3: The results of regression analysis (MA, RMA, PWMA, and PWRMA), i.e., calculated slopes and intercepts with errors for specific years, presented as heat maps (Table S3a: Calculations performed by Python code, Table S3b: heat map SLOPE, Table S3c: heat map INTERCEPT).

Author Contributions

Conceptualization, P.V. and T.K.; methodology, P.V., T.K., M.Š., K.Ž., M.N. and M.B.; formal analysis, P.V., T.K., M.Š., K.Ž., M.N. and M.B.; investigation, P.V. and T.K.; resources, P.V. and T.K.; data curation, P.V. and T.K.; writing—original draft preparation, P.V., T.K. and M.N.; writing—review and editing, P.V., T.K., M.Š., K.Ž., M.N. and M.B.; visualization, P.V. and M.N.; supervision, P.V. and T.K.; project administration, P.V.; funding acquisition, P.V. All authors have read and agreed to the published version of the manuscript.

Funding

This research was funded by the Slovenian Research and Innovation Agency—ARIS [research program grant number P1-0143, 2016–2021 and research project grant number N1-0054, 2016–2018], the International Atomic Energy Agency [CRP F31006 grant number 23485], Cost Action 19120 Watson STSM (E-COST-GRANT-CA19120-019492e2), and Erasmus+.

Data Availability Statement

The data presented in this study are available in the Supplementary Material here.

Acknowledgments

The authors express their gratitude to I. Kanduč for his valuable help in sampling and to the staff of the Slovenian Environment Agency for their help with meteorological data. Special thanks go to M. Nadbath for help in collecting temperature and relative humidity data and to S. Žigon and B. Svetek for their valuable help with analyses.

Conflicts of Interest

The authors declare no conflicts of interest.

References

  1. Bowen, G.J.; Cai, Z.; Fiorella, R.P.; Putman, A.L. Isotopes in the Water Cycle: Regional- to Global-Scale Patterns and Applications. Annu. Rev. Earth Planet. Sci. 2019, 47, 453–479. [Google Scholar] [CrossRef]
  2. Cucchi, F.; Franceschini, G.; Zini, L. Hydrogeochemical Investigations and Groundwater Provinces of the Friuli Venezia Giulia Plain Aquifers, Northeastern Italy. Environ. Geol. 2008, 55, 985–999. [Google Scholar] [CrossRef]
  3. Dansgaard, W. Stable Isotopes in Precipitation. Tellus 1964, 16, 436–468. [Google Scholar] [CrossRef]
  4. Ehleringer, J.R.; Barnette, J.E.; Jameel, Y.; Tipple, B.J.; Bowen, G.J. Urban Water—A New Frontier in Isotope Hydrology. Isot. Environ. Health Stud. 2016, 52, 477–486. [Google Scholar] [CrossRef]
  5. Epstein, S.; Mayeda, T. Variation of O18 Content of Waters from Natural Sources. Geochim. Cosmochim. Acta 1953, 4, 213–224. [Google Scholar] [CrossRef]
  6. Gat, J.R.; Gonfiantini, R. (Eds.) Stable Isotope Hydrology: Deuterium and Oxygen-18 in the Water Cycle; Technical Reports Series; International Atomic Energy Agency: Vienna, Austria, 1981; ISBN 978-92-0-145281-8. [Google Scholar]
  7. Gat, J.R. The Isotopic Composition of Evaporating Waters—Review of the Historical Evolution Leading up to the Craig–Gordon Model. Isot. Environ. Health Stud. 2008, 44, 5–9. [Google Scholar] [CrossRef]
  8. Gat, J.R.; Carmi, I. Evolution of the Isotopic Composition of Atmospheric Waters in the Mediterranean Sea Area. J. Geophys. Res. 1970, 75, 3039–3048. [Google Scholar] [CrossRef]
  9. Gibson, J.J.; Edwards, T.W.D.; Birks, S.J.; St Amour, N.A.; Buhay, W.M.; McEachern, P.; Wolfe, B.B.; Peters, D.L. Progress in Isotope Tracer Hydrology in Canada. Hydrol. Process. 2005, 19, 303–327. [Google Scholar] [CrossRef]
  10. Horita, J.; Rozanski, K.; Cohen, S. Isotope Effects in the Evaporation of Water: A Status Report of the Craig–Gordon Model. Isot. Environ. Health Stud. 2008, 44, 23–49. [Google Scholar] [CrossRef]
  11. Kendall, C.; McDonnell, J. Isotope Tracers in Catchment Hydrology; Elsevier: Amsterdam, The Netherlands, 1998; ISBN 978-0-444-81546-0. [Google Scholar]
  12. Jameel, Y.; Brewer, S.; Good, S.P.; Tipple, B.J.; Ehleringer, J.R.; Bowen, G.J. Tap Water Isotope Ratios Reflect Urban Water System Structure and Dynamics across a Semiarid Metropolitan Area. Water Resour. Res. 2016, 52, 5891–5910. [Google Scholar] [CrossRef]
  13. Koeniger, P.; Gaj, M.; Beyer, M.; Himmelsbach, T. Review on Soil Water Isotope-Based Groundwater Recharge Estimations: Review Soil Water Isotope. Hydrol. Process. 2016, 30, 2817–2834. [Google Scholar] [CrossRef]
  14. Kong, Y.; Wang, K.; Li, J.; Pang, Z. Stable Isotopes of Precipitation in China: A Consideration of Moisture Sources. Water 2019, 11, 1239. [Google Scholar] [CrossRef]
  15. Natali, S.; Doveri, M.; Giannecchini, R.; Baneschi, I.; Zanchetta, G. Is the Deuterium Excess in Precipitation a Reliable Tracer of Moisture Sources and Water Resources Fate in the Western Mediterranean? New Insights from Apuan Alps (Italy). J. Hydrol. 2022, 614, 128497. [Google Scholar] [CrossRef]
  16. Natali, S.; Doveri, M.; Franceschi, L.; Giannecchini, R.; Luppichini, M.; Menichini, M.; Zanchetta, G. Moisture Sources and Climatic Effects Controlling Precipitation Stable Isotope Composition in a Western Mediterranean Island (Pianosa, Italy). Atmos. Res. 2023, 294, 106987. [Google Scholar] [CrossRef]
  17. Porowski, A.; Porowska, D.; Halas, S. Identification of Sulfate Sources and Biogeochemical Processes in an Aquifer Affected by Peatland: Insights from Monitoring the Isotopic Composition of Groundwater Sulfate in Kampinos National Park, Poland. Water 2019, 11, 1388. [Google Scholar] [CrossRef]
  18. Rusjan, S.; Sapač, K.; Petrič, M.; Lojen, S.; Bezak, N. Identifying the Hydrological Behavior of a Complex Karst System Using Stable Isotopes. J. Hydrol. 2019, 577, 123956. [Google Scholar] [CrossRef]
  19. Saccon, P.; Leis, A.; Marca, A.; Kaiser, J.; Campisi, L.; Böttcher, M.E.; Savarino, J.; Escher, P.; Eisenhauer, A.; Erbland, J. Multi-Isotope Approach for the Identification and Characterisation of Nitrate Pollution Sources in the Marano Lagoon (Italy) and Parts of Its Catchment Area. Appl. Geochem. 2013, 34, 75–89. [Google Scholar] [CrossRef]
  20. Singh, A.T.; Rahaman, W.; Sharma, P.; Laluraj, C.M.; Patel, L.K.; Pratap, B.; Gaddam, V.K.; Thamban, M. Moisture Sources for Precipitation and Hydrograph Components of the Sutri Dhaka Glacier Basin, Western Himalayas. Water 2019, 11, 2242. [Google Scholar] [CrossRef]
  21. Terzer, S.; Wassenaar, L.I.; Araguás-Araguás, L.J.; Aggarwal, P.K. Global Isoscapes for δ18O and δ2H in Precipitation: Improved Prediction Using Regionalized Climatic Regression Models. Hydrol. Earth Syst. Sci. 2013, 17, 4713–4728. [Google Scholar] [CrossRef]
  22. Tsuchihara, T.; Shirahata, K.; Ishida, S.; Yoshimoto, S. Application of a Self-Organizing Map of Isotopic and Chemical Data for the Identification of Groundwater Recharge Sources in Nasunogahara Alluvial Fan, Japan. Water 2020, 12, 278. [Google Scholar] [CrossRef]
  23. Vachon, R.W.; Welker, J.M.; White, J.W.C.; Vaughn, B.H. Monthly Precipitation Isoscapes (δ18O) of the United States: Connections with Surface Temperatures, Moisture Source Conditions, and Air Mass Trajectories. J. Geophys. Res. 2010, 115, D21126. [Google Scholar] [CrossRef]
  24. Vodila, G.; Palcsu, L.; Futó, I.; Szántó, Z. A 9-Year Record of Stable Isotope Ratios of Precipitation in Eastern Hungary: Implications on Isotope Hydrology and Regional Palaeoclimatology. J. Hydrol. 2011, 400, 144–153. [Google Scholar] [CrossRef]
  25. Schotterer, U.; Oldfield, F.; Fröhlich, K. GNIP: Global Network for Isotopes in Precipitation; Läderach: Bern, Switzerland, 1996; ISBN 978-3-9521078-0-5. [Google Scholar]
  26. West, J.B.; Bowen, G.J.; Dawson, T.E.; Tu, K.P. (Eds.) Isoscapes: Understanding Movement, Pattern, and Process on Earth through Isotope Mapping; Springer: Dordrecht, The Netherlands, 2010; ISBN 978-90-481-3353-6. [Google Scholar]
  27. Banda, L.C.; Rivett, M.O.; Zavison, A.S.K.; Kamtukule, S.; Kalin, R.M. National Stable Isotope Baseline for Precipitation in Malawi to Underpin Integrated Water Resources Management. Water 2021, 13, 1927. [Google Scholar] [CrossRef]
  28. Boschetti, T.; Cifuentes, J.; Iacumin, P.; Selmo, E. Local Meteoric Water Line of Northern Chile (18° S–30° S): An Application of Error-in-Variables Regression to the Oxygen and Hydrogen Stable Isotope Ratio of Precipitation. Water 2019, 11, 791. [Google Scholar] [CrossRef]
  29. Giustini, F.; Brilli, M.; Patera, A. Mapping Oxygen Stable Isotopes of Precipitation in Italy. J. Hydrol. Reg. Stud. 2016, 8, 162–181. [Google Scholar] [CrossRef]
  30. Hager, B.; Foelsche, U. Stable Isotope Composition of Precipitation in Austria. Austrian J. Earth Sci. 2015, 108, 2–13. [Google Scholar] [CrossRef]
  31. Hatvani, I.G.; Szatmári, G.; Kern, Z.; Erdélyi, D.; Vreča, P.; Kanduč, T.; Czuppon, G.; Lojen, S.; Kohán, B. Geostatistical Evaluation of the Design of the Precipitation Stable Isotope Monitoring Network for Slovenia and Hungary. Environ. Int. 2021, 146, 106263. [Google Scholar] [CrossRef]
  32. Hollins, S.E.; Hughes, C.E.; Crawford, J.; Cendón, D.I.; Meredith, K.T. Rainfall Isotope Variations over the Australian Continent—Implications for Hydrology and Isoscape Applications. Sci. Total Environ. 2018, 645, 630–645. [Google Scholar] [CrossRef]
  33. Kostrova, S.S.; Meyer, H.; Fernandoy, F.; Werner, M.; Tarasov, P.E. Moisture Origin and Stable Isotope Characteristics of Precipitation in Southeast Siberia. Hydrol. Process. 2020, 34, 51–67. [Google Scholar] [CrossRef]
  34. Liu, J.; Song, X.; Yuan, G.; Sun, X.; Yang, L. Stable Isotopic Compositions of Precipitation in China. Tellus B Chem. Phys. Meteorol. 2014, 66, 22567. [Google Scholar] [CrossRef]
  35. Longinelli, A.; Selmo, E. Isotopic Composition of Precipitation in Italy: A First Overall Map. J. Hydrol. 2003, 270, 75–88. [Google Scholar] [CrossRef]
  36. Stumpp, C.; Klaus, J.; Stichler, W. Analysis of Long-Term Stable Isotopic Composition in German Precipitation. J. Hydrol. 2014, 517, 351–361. [Google Scholar] [CrossRef]
  37. Vreča, P.; Pavšek, A.; Kocman, D. SLONIP—A Slovenian Web-Based Interactive Research Platform on Water Isotopes in Precipitation. Water 2022, 14, 2127. [Google Scholar] [CrossRef]
  38. Vreča, P.; Malenšek, N. Slovenian Network of Isotopes in Precipitation (SLONIP)—A Review of Activities in the Period 1981–2015. Geologija 2016, 59, 67–84. [Google Scholar] [CrossRef]
  39. Schürch, M.; Kozel, R.; Schotterer, U.; Tripet, J.-P. Observation of Isotopes in the Water Cycle—The Swiss National Network (NISOT). Environ. Geol. 2003, 45, 1–11. [Google Scholar] [CrossRef]
  40. Welker, J.M. Isotopic (δ18O) Characteristics of Weekly Precipitation Collected across the USA: An Initial Analysis with Application to Water Source Studies. Hydrol. Process. 2000, 14, 1449–1464. [Google Scholar] [CrossRef]
  41. Gospodarič, R.; Habič, P. Underground Water Tracing: Investigations in Slovenia 1972–1975; ZRC SAZU: Postojna, Slovenia, 1976. [Google Scholar]
  42. Jožef Stefan Institute. SLONIP: Slovenian Network of Isotopes in Precipitation. Available online: https://slonip.ijs.si/ (accessed on 13 December 2023).
  43. Pavšek, A.; Vreča, P. Isotopes-in-Precipitation-Statistics. Available online: https://github.com/nyuhanc/Isotopes-in-precipitation-statistics (accessed on 8 July 2022).
  44. Stall, S.; Yarmey, L.; Cutcher-Gershenfeld, J.; Hanson, B.; Lehnert, K.; Nosek, B.; Parsons, M.; Robinson, E.; Wyborn, L. Make Scientific Data FAIR. Nature 2019, 570, 27–29. [Google Scholar] [CrossRef] [PubMed]
  45. Kern, Z.; Hatvani, I.G.; Czuppon, G.; Fórizs, I.; Erdélyi, D.; Kanduč, T.; Palcsu, L.; Vreča, P. Isotopic ‘Altitude’ and ‘Continental’ Effects in Modern Precipitation across the Adriatic–Pannonian Region. Water 2020, 12, 1797. [Google Scholar] [CrossRef]
  46. Kern, Z.; Erdélyi, D.; Vreča, P.; Krajcar Bronić, I.; Fórizs, I.; Kanduč, T.; Štrok, M.; Palcsu, L.; Süveges, M.; Czuppon, G.; et al. Isoscape of Amount-Weighted Annual Mean Precipitation Tritium (3H) Activity from 1976 to 2017 for the Adriatic–Pannonian Region—AP3H_v1 Database. Earth Syst. Sci. Data 2020, 12, 2061–2073. [Google Scholar] [CrossRef]
  47. Hatvani, I.G.; Smati, A.E.; Erdélyi, D.; Szatmári, G.; Vreča, P.; Kern, Z. Modeling the Spatial Distribution of the Meteoric Water Line of Modern Precipitation across the Broader Mediterranean Region. J. Hydrol. 2023, 617, 128925. [Google Scholar] [CrossRef]
  48. Rozanski, K.; Araguás-Araguás, L.; Gonfiantini, R. Isotopic Patterns in Modern Global Precipitation. In Climate Change in Continental Isotopic Records; American Geophysical Union: Washington, DC, USA, 1993; pp. 1–36. [Google Scholar]
  49. Hughes, C.E.; Crawford, J. A New Precipitation Weighted Method for Determining the Meteoric Water Line for Hydrological Applications Demonstrated Using Australian and Global GNIP Data. J. Hydrol. 2012, 464–465, 344–351. [Google Scholar] [CrossRef]
  50. Skrzypek, G.; Wiśniewski, A.; Grierson, P.F. How Cold Was It for Neanderthals Moving to Central Europe during Warm Phases of the Last Glaciation? Quat. Sci. Rev. 2011, 30, 481–487. [Google Scholar] [CrossRef]
  51. Rudzka, D.; Mcdermott, F.; Surić, M. A Late Holocene Climate Record in Stalagmites from Modrič Cave (Croatia). J. Quat. Sci. 2012, 27, 585–596. [Google Scholar] [CrossRef]
  52. Lykoudis, S.P.; Kostopoulou, E.; Argiriou, A.A. Stable Isotopic Signature of Precipitation under Various Synoptic Classifications. Phys. Chem. Earth Parts A/B/C 2010, 35, 530–535. [Google Scholar] [CrossRef]
  53. Aničić, B.; Juriša, M. SFRJ, Osnovna Geološka Karta 1:100,000, Tolmač za List Rogatec; Zvezni Geološki Zavod: Beograd, Serbia, 1985. [Google Scholar]
  54. Krajcar Bronić, I.; Barešić, J.; Borković, D.; Sironić, A.; Mikelić, I.L.; Vreča, P. Long-Term Isotope Records of Precipitation in Zagreb, Croatia. Water 2020, 12, 226. [Google Scholar] [CrossRef]
  55. Kottek, M.; Grieser, J.; Beck, C.; Rudolf, B.; Rubel, F. World Map of the Köppen-Geiger Climate Classification Updated. Meteorol. Z. 2006, 15, 259–263. [Google Scholar] [CrossRef] [PubMed]
  56. Peel, M.C.; Finlayson, B.L.; McMahon, T.A. Updated World Map of the Köppen-Geiger Climate Classification. Hydrol. Earth Syst. Sci. 2007, 11, 1633–1644. [Google Scholar] [CrossRef]
  57. Kozjek, K.; Dolinar, M.; Skok, G. Objective Climate Classification of Slovenia. Int. J. Climatol. 2017, 37, 848–860. [Google Scholar] [CrossRef]
  58. Kanduč, T.; Šlejkovec, Z.; Vreča, P.; Samardžija, Z.; Verbovšek, T.; Božič, D.; Jamnikar, S.; Solomon, D.K.; Fernandez, D.P.; Eastoe, C.; et al. The Effect of Geochemical Processes on Groundwater in the Velenje Coal Basin, Slovenia: Insights from Mineralogy, Trace Elements and Isotopes Signatures. SN Appl. Sci. 2019, 1, 1518. [Google Scholar] [CrossRef]
  59. Coplen, T.B.; Wildman, J.D.; Chen, J. Improvements in the Gaseous Hydrogen-Water Equilibration Technique for Hydrogen Isotope-Ratio Analysis. Anal. Chem. 1991, 63, 910–912. [Google Scholar] [CrossRef]
  60. Avak, H.; Brand, W.A. He Finning MAT HDO-Equilibration—A Fully Automated H2O/Gas Phase Equilibration System for Hydrogen and Oxygen Isotope Analyses. Thermo Electron. Corp. Appl. News 1995, 11, 1–13. [Google Scholar]
  61. Coplen, T.B. Reporting of Stable Hydrogen, Carbon, and Oxygen Isotopic Abundances (Technical Report). Pure Appl. Chem. 1994, 66, 273–276. [Google Scholar] [CrossRef]
  62. Coplen, T.B. Guidelines and Recommended Terms for Expression of Stable-Isotope-Ratio and Gas-Ratio Measurement Results: Guidelines and Recommended Terms for Expressing Stable Isotope Results. Rapid Commun. Mass Spectrom. 2011, 25, 2538–2560. [Google Scholar] [CrossRef] [PubMed]
  63. Skrzypek, G.; Allison, C.E.; Böhlke, J.K.; Bontempo, L.; Brewer, P.; Camin, F.; Carter, J.F.; Chartrand, M.M.G.; Coplen, T.B.; Gröning, M.; et al. Minimum Requirements for Publishing Hydrogen, Carbon, Nitrogen, Oxygen and Sulfur Stable-Isotope Delta Results (IUPAC Technical Report). Pure Appl. Chem. 2022, 94, 1249–1255. [Google Scholar] [CrossRef]
  64. Carter, J.F.; Barwick, V.J. Good Practice Guide for Isotope Ratio Mass Spectrometry, 1st ed.; FIRMS Network: Teddington, UK, 2011; ISBN 978-0-948926-31-0. [Google Scholar]
  65. Slovenian Environmental Agency (ARSO). ARSO METEO. Available online: http://www.meteo.si/ (accessed on 4 September 2023).
  66. Crawford, J.; Hughes, C.E.; Lykoudis, S. Alternative Least Squares Methods for Determining the Meteoric Water Line, Demonstrated Using GNIP Data. J. Hydrol. 2014, 519, 2331–2340. [Google Scholar] [CrossRef]
  67. Vreča, P.; Krajcar Bronić, I.; Leis, A.; Demšar, M. Isotopic Composition of Precipitation at the Station Ljubljana (Reaktor), Slovenia—Period 2007–2010. Geologija 2014, 57, 217–230. [Google Scholar] [CrossRef]
  68. Vreča, P.; Bronić, I.K.; Horvatinčić, N.; Barešić, J. Isotopic Characteristics of Precipitation in Slovenia and Croatia: Comparison of Continental and Maritime Stations. J. Hydrol. 2006, 330, 457–469. [Google Scholar] [CrossRef]
  69. Bertalanič, R.; Dolinar, M.; Honzak, L.; Lokošek, N.; Medved, A.; Vertačnik, G.; Vlahović, Ž. Climate Change Projections for Slovenia over the 21st Century. Temperature and Precipitation Summary; Ministry of the Environment and Spatial Planning, Slovenian Environment Agency: Ljubljana, Slovenia, 2019; ISBN 978-961-6024-81-5. [Google Scholar]
  70. Nadbath, M. Meteorological station Podčetrtek. Naše Okolje 2014, 21, 32–37. [Google Scholar]
  71. Vreča, P.; Krajcar Bronić, I.; Leis, A.; Brenčič, M. Isotopic Composition of Precipitation in Ljubljana (Slovenia). Geologija 2008, 51, 169–180. [Google Scholar] [CrossRef]
  72. Putman, A.L.; Fiorella, R.P.; Bowen, G.J.; Cai, Z. A Global Perspective on Local Meteoric Water Lines: Meta-analytic Insight Into Fundamental Controls and Practical Constraints. Water Resour. Res. 2019, 55, 6896–6910. [Google Scholar] [CrossRef]
  73. Craig, H. Isotopic Variations in Meteoric Waters. Science 1961, 133, 1702–1703. [Google Scholar] [CrossRef]
  74. Harvey, F.E. Stable Hydrogen and Oxygen Isotopic Composition of Precipitation in Northeastern Colorado. J. Am. Water Resour. Assoc. 2005, 41, 447–460. [Google Scholar] [CrossRef]
  75. Merlivat, L.; Jouzel, J. Global Climatic Interpretation of the Deuterium-oxygen 18 Relationship for Precipitation. J. Geophys. Res. 1979, 84, 5029–5033. [Google Scholar] [CrossRef]
  76. Gat, J.R. Oxygen and Hydrogen Isotopes in the Hydrologic Cycle. Annu. Rev. Earth Planet. Sci. 1996, 24, 225–262. [Google Scholar] [CrossRef]
  77. Gat, J.R.; Bowser, C.J.; Kendall, C. The Contribution of Evaporation from the Great Lakes to the Continental Atmosphere: Estimate Based on Stable Isotope Data. Geophys. Res. Lett. 1994, 21, 557–560. [Google Scholar] [CrossRef]
  78. Araguas, L.A.; Froehlich, K.; Rozanski, K. Deuterium and Oxygen-18 Isotope Composition of Precipitation and Atmospheric Moisture. Hydrol. Process. 2000, 14, 1341–1355. [Google Scholar] [CrossRef]
  79. Peng, H.; Mayer, B.; Harris, S.; Krouse, H.R. A 10-Yr Record of Stable Isotope Ratios of Hydrogen and Oxygen in Precipitation at Calgary, Alberta, Canada. Tellus B Chem. Phys. Meteorol. 2004, 56, 147–159. [Google Scholar] [CrossRef]
  80. Dütsch, M.; Pfahl, S.; Sodemann, H. The Impact of Nonequilibrium and Equilibrium Fractionation on Two Different Deuterium Excess Definitions. JGR Atmos. 2017, 122, 12732–12746. [Google Scholar] [CrossRef]
  81. Vreča, P.; Brenčič, M.; Leis, A. Comparison of Monthly and Daily Isotopic Composition of Precipitation in the Coastal Area of Slovenia. Isot. Environ. Health Stud. 2007, 43, 307–321. [Google Scholar] [CrossRef] [PubMed]
  82. Liotta, M.; Favara, R.; Valenza, M. Isotopic Composition of the Precipitations in the Central Mediterranean: Origin Marks and Orographic Precipitation Effects. J. Geophys. Res. 2006, 111, D19302. [Google Scholar] [CrossRef]
  83. Mezga, K.; Urbanc, J.; Cerar, S. The Isotope Altitude Effect Reflected in Groundwater: A Case Study from Slovenia. Isot. Environ. Health Stud. 2014, 50, 33–51. [Google Scholar] [CrossRef] [PubMed]
  84. Palcsu, L.; Morgenstern, U.; Sültenfuss, J.; Koltai, G.; László, E.; Temovski, M.; Major, Z.; Nagy, J.T.; Papp, L.; Varlam, C.; et al. Modulation of Cosmogenic Tritium in Meteoric Precipitation by the 11-Year Cycle of Solar Magnetic Field Activity. Sci. Rep. 2018, 8, 12813. [Google Scholar] [CrossRef]
  85. Martell, E.A. Atmospheric Aspects of Strontium-90 Fallout: Fallout Evidence Indicates Short Stratospheric Holdup Time for Middle-Latitude Atomic Tests. Science 1959, 129, 1197–1206. [Google Scholar] [CrossRef] [PubMed]
  86. Storebø, P.B. The Exchange of Air between Stratosphere and Troposphere. J. Meteor. 1960, 17, 547–554. [Google Scholar] [CrossRef]
  87. University of Olou Cosmic Ray Station. Available online: https://cosmicrays.oulu.fi/ (accessed on 13 December 2023).
Figure 1. Location map of SLONIP station, Sv. Urban (sampling for isotope in precipitation analysis), ARSO meteorological station, Podčetrtek (precipitation data), and ARSO meteorological station, Podčetrtek–Atomske Toplice (air temperature data).
Water 16 00469 g001
Figure 2. Monthly variations of (a) precipitation at Podčetrtek (PARSO) and mean air temperature at Podčetrtek–Atomske Toplice (TARSO), (b) precipitation at Sv. Urban (PSv. Urban) and mean air temperature at Podčetrtek–Atomske Toplice (TARSO), (c) isotope composition of oxygen (δ18O) and hydrogen (δ2H), (d) deuterium excess (d) and tritium activity concentration (A) at Sv. Urban for 2016–2021. The arrows in (c,d) denote the March and April 2020 composite sample.
Water 16 00469 g002
Figure 3. The δ2H versus δ18O of monthly data, with the diameter of the bubbles corresponding to (a) monthly precipitation and (b) air temperature. GMWL–Global meteoric water line defined by Craig [73].
Water 16 00469 g003
Figure 4. The slope (a) and intercept (b) computed for each year, first and second three years, and the whole monitoring period. The error bars are derived from Monte Carlo simulations with 95% confidence intervals.
Water 16 00469 g004
Figure 5. A versus δ18O monthly data. The diameter of the bubbles corresponds to (a) monthly precipitation and (b) air temperature.
Water 16 00469 g005
Table 1. Monthly mean PARSO, TARSO, and precipitation-weighted δ2H, δ18O, d-excess, and A for 2016–2021.
MonthPARSO
mm
TARSO
°C
δ2H
δ18O
d-excess
A
TU
January470.3−90.2−12.6811.24.6
February873.8−95.2−13.028.95.8
March506.6−66.9−9.388.15.5
April5911.2−43.4−6.8711.69.4
May11614.7−56.1−8.088.69.5
June9220.2−36.6−5.547.711.1
July12521.2−37.6−5.839.012.0
August8920.9−35.9−5.558.59.0
September11915.9−48.5−7.7613.66.3
October8210.9−60.1−9.0712.55.4
November1176.4−81.1−11.9514.54.4
December751.8−97.1−13.5811.64.4
Table 2. Seasonal mean PARSO, TARSO, and precipitation-weighted δ2H, δ18O, d-excess, and A for 2016–2021.
YearPARSO
mm
TARSO
°C
δ2H
δ18O
d-excess
A
TU
Winter2092.1−94.9−13.1710.44.9
Spring22510.8−55.1−8.049.28.7
Summer30620.6−36.8−5.668.510.9
Autumn31711.0−63.5−9.6413.65.4
Table 3. Annual PARSO, mean annual TARSO, and precipitation-weighted δ2H, δ18O, d-excess, and A for 2016–2021.
YearPARSO
mm
TARSO
°C
δ2H
δ18O
d-excess
A
TU
2016104710.9−71.9−10.098.8n.d. 1
2017101011.0−57.2−8.4910.86.2
2018101611.7−56.3−8.289.99.5
2019122211.6−55.4−8.2210.38.1
2020100811.1−56.5−8.4911.46.9
2021103910.6−62.3−9.3312.47.6
mean 2016–2021105711.1−59.9−8.8110.67.7
mean 2016–2018102411.2−62.0−8.989.87.8
Note: 1 n.d.—not determined.
Table 4. The statistics of the SSWR minimization regression are reported as follows: number of monthly samples per period (N), intercept (b) and slope (a), intercept and slope 95% confidence intervals derived from Monte Carlo simulations (MC b/a C.I. 95%), sum of squared weighted residuals (SSWRs), degrees of freedom (d.f.), SSWR 95% confidence intervals derived from Monte Carlo simulations (MC SSWR C.I. 95%).
YearNbMC b
CI 95%
aMC a
CI 95%
SSWRd.f.MC SSWR CI 95%
2016112.6[−2, 7.6]7.3[6.8, 7.8]14.99[2.8, 18.9]
2017122.6[−0.09, 5.2]7.2[6.9, 7.5]40.510[3.3, 20.0]
20181110.8[7.5, 13.8]8.1[7.7, 8.4]10.99[2.5, 18.2]
20191212.5[8.4, 16.9]8.2[7.8, 8.7]8.810[3.2, 19.5]
2020102.7[−2.5, 7.6]7[6.5, 7.6]9.78[2.1, 17.1]
2021129.1[5.4, 12.9]7.6[7.2, 8]910[3.4, 20.4]
2016–2018345.4[3.3, 7.2]7.5[7.3, 7.7]8332[19.1, 49.9]
All686.6[5, 8.2]7.6[7.4, 7.7]13866[45, 92]
Table 5. δ18O vs. temperature relation (δ18OSv. Urban = a × TARSO + b), where a is the slope, b is the intercept, and r is the Pearson’s correlation coefficient.
Yeara
‰ °C−1
b
r
20160.45−15.30.94
20170.43−12.60.82
20180.44−13.70.95
20190.43−12.50.91
20200.27−11.80.84
20210.35−12.80.81
2016–20210.37−13.00.84
Disclaimer/Publisher’s Note: The statements, opinions and data contained in all publications are solely those of the individual author(s) and contributor(s) and not of MDPI and/or the editor(s). MDPI and/or the editor(s) disclaim responsibility for any injury to people or property resulting from any ideas, methods, instructions or products referred to in the content.

