Abstract
In the context of sustainable economic development, the current dilemma of water utilization can be resolved by improving water utilization and achieving an excellent decoupling state between economic growth and water utilization. The utilization of water resources is closely related to the economy of China’s capital cities, and the coordinated relationship between the two plays an essential role in the sustainable development of the capital cities. Therefore, to comprehensively evaluate the water resource utilization of China’s cities from 2011 to 2020, this study selects 21 cities in Northwest China, North China, Northeast China, Central China, Southwest China, South China, and East China. It analyzes them using the water footprint method by selecting indicators and combining them with the decoupling model. The study shows that (1) the water footprint of the cities in the seven regions are different, with a total water footprint of 5793.98 × 108 m3, with cities in the Southwest region of China having the most significant water footprint of 1239.69 × 108 m3, accounting for about 21.40%. At the same time, the region with the most minor water footprint is Northwest China, with 343.30 × 10⁸ m3, accounting for only 6%. Industrial and agricultural water use account for a comparable proportion of the water footprint structure, and both use a more considerable amount of water. (2) North China is most dependent on imported water resources at 61.24%. In comparison, Central China has the lowest dependence on imported water resources at 19.19%, and several other regions have a higher degree of reliance on water resources in their regions. The value of economic benefits generated by the water footprints of the seven regions is more extensive, and the net trade value of the water footprints of North China and Northeast China is negative, which belongs to the water resources exporting places. (3) The decoupling status of cities in the seven regions is poor, and the solid negative decoupling with the worst decoupling status occurs more often. The relationship between water resources utilization and economic development is not coordinated, and the efficiency of water resources utilization needs to be improved.
1. Introduction
Global water resources account for about 70% of the earth’s water resources [1]. However, only 2.53% of the freshwater resources can be used directly [2]. In addition, with the continuous development of the world economy, the water shortage problem is becoming increasingly severe [3]. Water resources are gradually becoming an important indicator of economic growth, and the relationship between water resources and the economy has attracted the great attention of domestic and international scholars. Although China’s freshwater resources are the fourth largest in the world, the demand for water resources continues to rise, so China is still a country with a severe water shortage [4]. According to the data released in the 2021 China Water Resources Bulletin, China’s total water consumption is 592.02 billion m3, among the world’s highest [5].
Water resources are indispensable natural resources for human life and development and are also seen as economic resources [6,7,8]. Whether water resources are utilized reasonably and efficiently has gradually become an essential factor in measuring the economic development level of a city [9,10,11,12].
Urban water is one of the capital resources to promote urban development, and its role is irreplaceable [13,14,15]. Still, the need for more water resources in China restricts the rapid growth of the urban economy in China [16,17,18]. At present, there are still many cities in China that have excessive water consumption, leading to insufficient water supply problems, in which the more severe water shortage of the city reaches 110, such as the coastal open cities in Beijing, Tianjin, and Shanghai, are extremely water-scarce cities, urban water shortage problem constraints on China’s rapid development of an urban economy [19,20,21]. Economic growth and water resources are closely related. With the continuous development of the city’s economy and the acceleration of urbanization, water resource consumption is becoming increasingly intense, and our cities need to realize the sustainable use of water resources and reduce the consumption of water resources to achieve economic growth [22,23].
Since the 21st century, China’s urbanization rate has been as high as 60%, with the population and industry continuing to agglomerate to large cities, China’s urban water supply and demand is insufficient, the contradiction of water resources continues to intensify, which is not conducive to the long-term sustainable development of the city, and the rational use of water resources is imminent [24,25,26]. In addition, with the continuous rise of urban water demand, the contradiction between the supply and demand of urban water resources in China urgently needs to be emphasized; therefore, the study of the relationship between water resources and economic development, how to ensure the coordinated relationship between water resources and economic growth has also become a hot spot for scholars at home and abroad to study [27,28].
The concept of water footprint theory was proposed by Dutch scholar Hoekstra in 2002 [29,30] and has been widely applied by many scholars since then. Regarding the research on water footprint, most of the international countries are applied to the differences in the distribution of water footprint in different countries (or regions) [31,32,33], the related calculation and assessment of agricultural water footprint [34,35,36], the evaluation, and analysis of water resources of the country (or region), and the water footprint of consumption of a specific product [37,38,39], etc. In 2003, domestic scholars introduced the water footprint theory and produced many research results. The research field is mainly concentrated in the country [40,41,42,43], watersheds, provinces [44,45,46], and other significant areas, and the research related to the urban water footprint [47,48,49,50] is relatively weak. There is still a lot of space for research.
In the literature related to international water footprint theory, it can be found that there are few types of research combined with the decoupling approach in international countries, and the domestic and international research on water footprint is mainly focused on the analysis of the large-scale scope and the research on small-scale coverage is still in the initial stage [51]. This study divides China into seven regions, and the three cities in each region are selected as research objects. Based on their water footprints from 2011 to 2020, four analytical indicators (water import dependence, water self-sufficiency rate, water footprint economic benefit value, and water footprint net trade volume) are constructed and combined with the decoupling model to analyze the spatial differences in water resource use in China’s cities [52,53]. Further, it will explore the water resource use in China’s cities and provide a scientific basis for the provincial capital cities to solve the problem of water resource scarcity [26]. The study will explore the utilization of water resources in Chinese cities and provide a scientific basis for provincial capital cities to solve the problem of water resource scarcity. This article consists of five parts: Section 1, Introduction; Section 2, Introduction to the material; Section 3, Research Methodology; Section 4, Results and Analysis; Section 5, Discussion and Conclusions.
2. Materials
2.1. Study Area
The seven regions of China include Northwest China, North China, Northeast China, Central China, Southwest China, South China, and East China [54,55]. This study selected three typical cities in each region as representatives (Figure 1). Northwest China (Lanzhou, Xi’an, and Urumqi) is deeply inland, with an arid climate and scarce precipitation [56]. North China (Beijing, Tianjin, Taiyuan) is the most extensive plain in China, with a predominantly warm-temperate semi-moist climate but with insufficient precipitation and prone to droughts and floods [57]. Northeast China (Dalian, Shenyang, Jilin) is in a cold-temperate zone with four seasons and rich forest resources [58]. Central China (Wuhan, Changsha, Zhengzhou) is a transportation hub with a climate environment that includes temperate and subtropical monsoons [59]. Southwest China (Chengdu, Kunming, Chongqing) has a subtropical monsoon climate with rainy summers [60]. South China (Guangzhou, Haikou, Nanning) has a tropical-southern subtropical environment with abundant water resources. East China (Jinan, Nanjing, Fuzhou) has a humid subtropical and temperate monsoon climate [61].
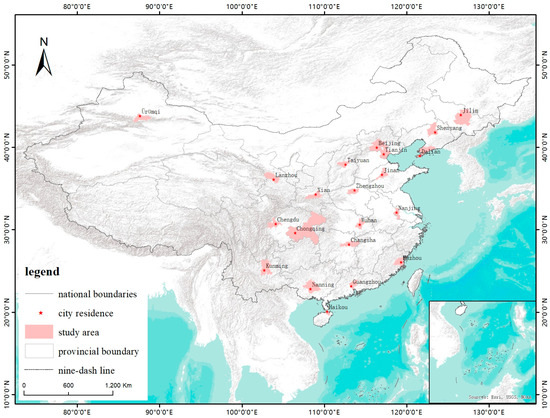
Figure 1.
Overview map of the study area (Revision No.: GS(2023)2752).
In terms of population and economic development, Northwest China has a relatively small population and an economy based on agriculture and energy; North China is densely populated with a well-developed economy, with high-tech, service, and heavy industry as the mainstay [62]; Northeast China, as a traditional industrial base, is facing the challenges of economic transformation and population aging; Central China has a large population and a diversified economy, with industry, agriculture and science and education as the mainstay; Southwest China is densely populated with rapid economic growth, focusing on the development of manufacturing and high-tech industries; South China is economically active, with a concentrated population, and with commerce, tourism and agriculture as its main pillars; East China, as one of the most economically developed regions, has a large population and a diverse economic structure, relying mainly on the manufacturing and service industries [63].
Regarding water resource utilization, Northwest China faces the challenges of drought and water scarcity, and relies on major rivers such as the Yellow River [64]; North China is similarly water-stressed, and relieves the pressure through diversion projects and local water sources, but suffers from over-exploitation of groundwater and water pollution; Northeast China is relatively rich in water resources, but needs to balance water use for industry and agriculture, and pay attention to water quality protection [19]; Central China relies on rivers such as the Yangtze River, and focuses on Central China depends on the Yangtze River and other rivers, focusing on agricultural irrigation and urban water supply, as well as flood control [65]; Southwest China has abundant water resources, with equal emphasis on hydropower plant construction and ecological protection [66]; South China has a humid climate and relies on the Pearl River water resources, and faces the challenges of seawater back-up and typhoons; East China has better water resources but needs to cope with the high demand and pollution caused by increased population density and industrial development [67]. Each region must develop reasonable water resource management strategies according to its conditions.
2.2. Data Sources
The data in this study were obtained from the statistical yearbooks and water resources bulletins of 21 provinces and cities in seven regions (2011–2020), of which the ecological water use of Yinchuan City in 2010–2013 was referred to Wang Bingliang’s research results, and all of them were calculated by the arithmetic average method in this paper due to the missing water resources data of Urumqi City in 2012 and the ecological water use of Yinchuan City in 2014–2016.
3. Methodology
3.1. Water Footprint Theory and Analysis Indicators
Water footprint is an important indicator to measure the status of water resource utilization in a country or region, which can truly reflect the utilization of water resources [29,30,68,69,70]. The method considers the actual amount of water consumed in life and the virtual water use, which provides a straightforward and easy method for the sustainable use of water resources [71,72]. It is mainly composed of two parts, i.e., the sum of internal water footprint and external water footprint, which is given by the formula:
In Equation (1), WFP represents a acountry’s or region’s water footprint, IWFP represents the internal water footprint, and EWFP means the external water footprint (All indicators are measured in billion cubic meters). The exterior water footprint is defined by imported virtual water in this study, and the interior water footprint consists of five main aspects, which are calculated by the formula:
In Equation (2), AWU is the agricultural water use, taken equal to the evaporative water demand of the crops; IWW, DWW, and EWW are the water withdrawals in the industrial, domestic, and ecological sectors, respectively; VWEdom is the virtual water export to other countries insofar related to the export of domestically produced products (All indicators are measured in billion cubic meters).
The four analyzed indicators constructed, i.e., water resources import dependence (WD), water resources self-sufficiency (WSS), water footprint economic benefit value, and water footprint net trade volume, are shown in Table 1.

Table 1.
Water footprint analysis indicators [29].
3.2. Decoupling Model
The decoupling model is mainly applied to analyze the relationship between resource consumption and economic growth, and this study is based on the water footprint, combined with the decoupling elasticity method [73,74] to explore whether the relationship between water resource use and economic development is coordinated in China’s cities. The equation of the decoupling model is:
In Equation (3): e denotes the decoupling coefficient, ∆WF denotes the rate of change of regional water footprint (billion cubic meters), ∆GDP denotes the rate of change of regional gross domestic product (GDP) (Billion RMB), WFn denotes the region’s water footprint in the nth year, WFn−1 indicates the area’s water footprint in the (n − 1)th year, GDPn represents the total value of the regional economy in the n-th year, and GDPn−1 denotes the total value of the regional economy in the n – 1 that year. The GDP values in this study were calculated using the GDP deflator method to calculate the real GDP for analysis, with 2010 as the base period.
According to previous studies on decoupling classification [75], decoupling can be categorized into eight types, as shown in Table 2.
Table 2.
Table of decoupling status system.
4. Results and Analysis
4.1. Water Footprint Analysis of China’s Cities
According to the water resources data of 21 cities in seven regions of China from 2011 to 2020 to derive the water footprint (Figure 2 and Figure 3, Table 3), analyzing Figure 2 shows that the water footprint changes in the decade of 2011–2020 are significant. The water footprint in 2011 was the largest, 617.64 × 10⁸ m3. The water footprint in 2020 shows the lowest of all time, 537.8 × 10⁸ m3, which shows that the water footprint of China’s utilization of urban water resources is improving. The 2011–2010 water footprint indicates a decreasing trend, which is incredibly related to the fact that China vigorously advocates the awareness of water conservation, promotes industrial restructuring, and improves water resource utilization efficiency.
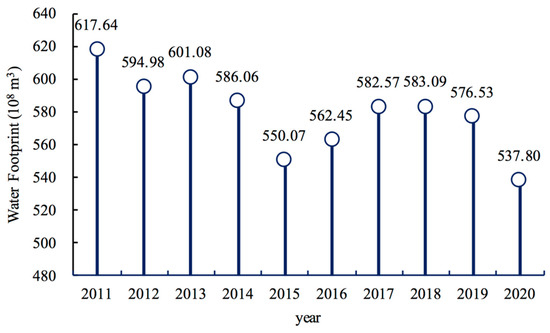
Figure 2.
Trend of water footprint of seven regions in China from 2011 to 2020.
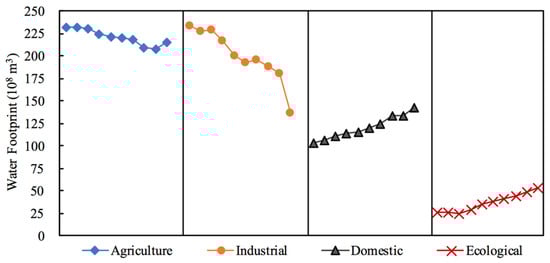
Figure 3.
Four major water use dynamics water footprint in China’s cities from 2011 to 2020.
Table 3.
Composition of the water footprint of the seven regions in China for 2011–2020.
As can be seen from Table 3, the water footprint of the cities in the seven regions is different, with a total water footprint of 5793.98 × 108 m3, with cities in the Southwest region of China having the most significant water footprint of 1239.69 × 108 m3, accounting for about 21.40%. North China is in second place, with 1191.88 × 108 m3, comparable to the Southwest region’s proportion. The region with the smallest water footprint is Northwest China, with 343.30 × 10⁸ m3, accounting for only 6% of the total, because compared to the other six regions, Northwest China has a lower urbanization rate and a smaller population compared to the different areas, and the water footprint consumed is correspondingly the lowest.
From the four categories of water use in the water footprint in Figure 3, it can be seen that China’s urban agriculture uses the most significant amount of water. Industrial water use is only second to agricultural water use, so to ensure the safety of water use in agriculture and industry, it is necessary to establish a systematic industrial and agricultural water conservation system to reduce the waste of water resources and to promote sustainable and high-quality development of China’s industry and agriculture. The rising trend of domestic and ecological water use can be seen in the process of urbanization in China, which requires the development of specific and feasible countermeasures for environmental and household water management.
4.2. Water Footprint Indicator Analysis
The calculation methods of the four water footprint indicators, including water import dependency (WD), water resource self-sufficiency (WSS), water footprint economic benefit value, and net trade-in water footprint, have been reflected in Table 1. Among them, the water import dependence (WD) is calculated as (EWFP/WFP) × 100%; Water resource self-sufficiency (WSS) is calculated as (IWFP/WFP) × 100%; water footprint economic benefit value is calculated as GDP/WFP; the net trade-in water footprint is calculated as VWEdom-EWFP (Table 1).
For the Northwest region, the total water footprint (WFP) is 343.3 × 10⁸ m3, and the external water footprint (EWFP) is 72.51 × 10⁸ m3 (Table 3), resulting in a water import dependence (WD) of 21.12% (Table 4).
Table 4.
Results of water footprint indicators analysis.
For East China, the total water footprint (WFP) is 677.30 × 10⁸ m3, and the internal water footprint (IWFP) is 452.18 × 10⁸ m3 (Table 3), resulting in a water import dependence (WSS) of 66.76% (Table 4).
For South China, the GDP is 124,497.42, and the water footprint (WFP) is 982.76 × 10⁸ m3 (Table 3), resulting in the water footprint economic benefit value of 126.68 × 10⁸ m3 (Table 4).
For Central China, virtual water export (VWEdom) is 227.70 × 10⁸ m3, and the External water footprint (EWFP) is 155.80 × 10⁸ m3 (Table 3), resulting in a net trade-in water footprint of 71.90 × 10⁸ m3 (Table 4). The other regions follow this example.
As seen from Table 4, the results of the four indicators vary among the seven regions of China. Analyzing the dependence on water resources import, North China has the highest degree of reliance on imported water resources, at 61.24%, and Central China has the lowest degree of dependence on imported water resources, at 19.19%. Analyzing the self-sufficiency rate of water resources, except for North China, several other regions of China have a high degree of dependence on water resources in their areas, and Central China has the highest degree of reliance on imported water resources, at 80.81%. Analyzing the economic benefits of water footprint, the value of economic benefits generated by the water footprint is more significant in all seven regions. North China has the highest level of financial help from water consumption. In Table 4, the analysis of the indicator of water footprint benefit, i.e., economic benefit, shows that the value of the financial benefit of the water footprint is high in North China and Northeast China compared to other regions, with North China having the highest financial benefit of 236.12 × 10⁸/m3 indicating that the economic benefit of water footprint in this region is higher than that in the other areas. Analyzing the net trade volume of water footprint, the value of North China and Northeast China is negative, the export virtual water is larger than the import virtual water, and the water resources flow into the outside, while the other regions are on the contrary, and are the importers of water resources.
4.3. Analysis of the Decoupling of Water Resources and Economic Development
China is divided into seven regions: Northwest China, North China, Northeast China, Central China, Southwest China, South China, and East China. The decoupling relationship of the seven areas from 2011 to 2020 is calculated, respectively, and the results are shown in Table 5.
Table 5.
China’s seven regions of decoupling 2011–2020, WND stands for weak-negative decoupling, SND stands for Strong Negative Decoupling, SD stands for Strong decoupling, WD stands for weakly decoupled, END stands for Expansive negative decoupling, WL stands for weak link, DN stands for dilatation connection.
Table 5 indicates that the decoupling status of the seven regions in China has its characteristics.
In Northwest China, weak negative decoupling appeared 13 times, strong decoupling occurred 3 times, strong negative decoupling occurred 9 times from 2011 to 2020, and weak negative decoupling accounted for half of the total. The two best strong decoupling appeared in the years 2017–2018, and the relationship between water resources and economic development has reached the ideal condition of harmonization, and water resources have been rationally utilized.
In the capital cities of the northwestern region of China, the gradual growth of population and the rise of the population base will inevitably lead to an increase in the demand for water resource utilization. In addition, with the continuous development of the economy of the capital cities in Northwest China, the use and consumption of urban water resources have also increased, and the efficient use of water resources is particularly critical. Therefore, the capital cities of Northwest China need to reasonably control the population growth and keep the population within the reasonable environmental population capacity. At the same time, improving the urban water use structure, improving water use efficiency, and better implementing water conservation policies and mechanisms is urgent.
From 2011 to 2020, North China mainly shows three states of strong negative decoupling, weak negative decoupling and weak decoupling alternately. Strong negative decoupling belongs to the worst decoupling situation between water resources and economic development, which occurs 13 times, weak negative decoupling and weak decoupling present 7 and 4 times, respectively, and expansive negative decoupling occurs only 1 time, and the decoupling situation in North China in the last ten years is overall poor. The consumption of water resources brings about poor economic development, and North China still needs to optimize the water use structure further to achieve the desired decoupling status. Taiyuan City had four good occurrences of weak decoupling, which consumed many water resources and brought about economic growth and better water utilization in North China.
The overall water use situation in the Northeast region was not optimistic during 2011–2020, with many strong negative and weak negative decouplings occurring 6 and 17 times, respectively. Two vital decoupling statuses occurred in 2017–2019, indicating that the Northeast region’s water use situation is moving in a better direction.
Between 2011 and 2020, four primary states of weak negative decoupling (18 times), strong negative decoupling (6 times), weak decoupling (1 time), and strong decoupling (1 time) occur in Central China. Decoupling in the last decade has been poor overall. The consumption of water resources has brought about poor economic development, and Central China still needs to optimize the water use structure further to achieve the desired decoupling status. In addition, Central China uses more water for industrial purposes, so Central China needs to improve the speed of transformation of industrial structure, improve industrial equipment, and upgrade industrial technology to enhance industrial water use efficiency in Central China.
The weak negative decoupling appeared 14 times in the Southwest region from 2011 to 2020, together with the six-strong negative decouplings and one recessionary decoupling status presented in other years, indicate that the Southwest region’s water use efficiency is poor, and the development of the economy relies on water consumption to a high degree.
South China has two strong decouplings, nine strong negative decouplings, ten weak negative decouplings, four weak decouplings, one expansionary negative decoupling, and one recessionary decoupling from 2011 to 2020, with a total of six medium states. The relationship between water use and economic development in the three cities in South China is not coordinated. Haikou also has expansionary negative and recessionary decoupling, and Haikou has a recessionary economy.
Strong negative and weak negative decoupling states alternated in East China from 2011 to 2020, occurring 8 and 12 times, respectively, with overall poor water resource utilization. Expansionary decoupling occurred in 2016–2017, where water use exceeded economic growth, indicating poor water resource utilization; two weak decoupling periods occurred in 2011–2012 and 2016–2017, where water use was high, but economic growth showed a growing trend, in short, water resource utilization was relatively reasonable, but economic growth shows an increasing trend; in short, water resource utilization is becoming more affordable. Although Fuzhou city offers weak negative decoupling, compared with Jinan and Nanjing, which have strong negative decoupling, the utilization of water resources is better, and the three towns have poor utilization of water resources.
5. Discussions and Conclusions
In terms of urban water use, Water use should be adjusted in the industrial structure, further improving water conservation efficiency in agriculture and shifting the use of water resources to the secondary and tertiary sectors. In the process of urbanization, a comprehensive analysis and consideration should be given to the embodiment of water resources and energy to further reduce costs and pollutant emissions by improving the efficiency of water use and reducing the amount of water consumption through the reduction of energy consumption. Based on the goal of sustainable water resource utilization, quantify the future water use target of the city, and propose mandatory water use restrictions according to the city’s development goals, especially the use of water footprint indicators to account for the water use related to the production of critical products and services. It is necessary to deal with the problem of various forms of water resources, increase the management of ecological water use in the city, integrate the risk of water supply and demand, strengthen the accounting of environmental water use, and gradually adjust and increase the proportion of ecological water use. Adjust and increase the proportion of environmental water use and fully play the role of ecological compensation in urban water use.
Quantitatively analyzing the relationship between water resources and economic development, previous studies have mainly focused on utilizing physical water. However, virtual water is also an aspect that should not be ignored [76,77]. This study not only considers the actual amount of water to be consumed but also the virtual water that is usually easy to forget and invisible. However, the research object on virtual water in China is relatively single, most of which focuses on agricultural water use, import and export virtual water use, and the quantitative research of virtual water in other aspects such as industry, ecology, etc., is relatively small [78,79,80]. Hence, the paper’s water footprint calculation is imperfect and needs further exploration. In addition, due to the lack of data on available water resources in each city, the selection of indicators based on water footprint in this study is limited to only four, which cannot comprehensively evaluate the utilization of water resources, especially the sustainable use of water resources cannot make a comprehensive analysis and evaluation. The conclusions of the study are as follows:
(1) China’s seven major regions of urban water footprint as a whole showed a downward trend, indicating that China’s water resource utilization is in the direction of good development. The water footprints of the cities in the seven regions vary, with a total water footprint of 5793.98 × 108 m3, of which the towns in the Southwest region have the largest, accounting for about 21.40%, and the North China region is in the second place, with a proportion comparable to that of the Southwest region. The region with the smallest water footprint is Northwest China, accounting for only 6% of the total, which is because, compared with the other six areas, Northwest China has a lower urbanization rate and a smaller population and consumes the smallest water footprint accordingly. In addition, industrial and agricultural water use is more widespread in the water footprint structure. Chinese cities should promote rational allocation of water resources for industry and agriculture to ensure industrial and agricultural development.
(2) The results of the four indicators vary across the seven regions of China. Regarding water resources import dependence, North China has the highest import dependence at 61.24%, and Central China has 19.19%. From the analysis of water resources self-sufficiency rate, except for North China, several other regions have a higher dependence on water resources. For the water footprint benefit indicator, the value of economic benefits of water footprint in North China and Northeast China is higher than that of other regions, with North China having the highest financial benefit of 236.12 × 10⁸/m3, indicating that the economic benefits of water footprint in this region are higher than that of other regions. Analyzing the net trade volume of water footprint, North China and Northeast China have a negative value; the export virtual water volume is larger than the import virtual water volume, and the water resources flow outside. In contrast, other regions have a negative value.
(3) The decoupling status of cities in the seven regions of China is not ideal, and the decoupling quality between water resources and economic development varies. The best decoupling quality is strong decoupling. Strong decoupling in each region of the city appeared a small number of times, and even some cities did not appear; presented the most significant number of times the worst decoupling status of strong negative decoupling, each region of each town appeared, indicating that the relationship between the water resources of the seven areas of the city and the economic development is not very coordinated, the use of water resources in China’s cities is poor, the need to reduce the economy’s dependence on water resources to make the use of water resources to improve. Make water resource utilization improved.
Author Contributions
The research article is the joint work of four authors, Y.A. designed the experiments, and Y.A. and N.L. analyzed China’s urban water utilization based on the water footprint methodology. P.F. and Y.J. helped to review and prepare this paper for publication. All authors have read and agreed to the published version of the manuscript.
Funding
This study was supported by the Science and Technology Innovation Team (Tianshan Innovation Team), Innovation Team for Efficient Utilization of Water Resources in Arid Zones 2022TSYCTD0001, General Projects of Central Asia Research Institute of Xinjiang University (24ZYYB002), State Key Laboratory of Desert and Oasis Ecology, Xinjiang Institute of Ecology and Geography, Chinese Academy of Sciences, Open-ended fund (G2022-02-05), Doctoral Research Startup Foundation of Xinjiang University (BS180245), and 100 Young Doctors Introduction Program of Xinjiang (Tian Chi Doctor Program) Foundation (tcbs201819).
Data Availability Statement
The data for this study were obtained from the statistical yearbooks and water resources bulletins of 21 provinces and municipalities in the seven regions (2011–2020).
Conflicts of Interest
The authors declare no conflicts of interest.
References
- She, Y.; Chen, J.; Zhou, Q.; Wang, L.; Duan, K.; Wang, R.; Qu, S.; Xu, M.; Zhao, Y. Evaluating Losses from Water Scarcity and Benefits of Water Conservation Measures to Intercity Supply Chains in China. Environ. Sci. Technol. 2024, 58, 1119–1130. [Google Scholar] [CrossRef]
- Yang, Q.; Liu, G.; Li, H.; Santagata, R.; Yang, Z. Understanding ecological restoration potential: The role of water resources and slope gradient limits. Sci. Total Environ. 2024, 912, 169001. [Google Scholar] [CrossRef] [PubMed]
- Wang, J.; Azam, W. Natural resource scarcity, fossil fuel energy consumption, and total greenhouse gas emissions in top emitting countries. Geosci. Front. 2024, 15, 101757. [Google Scholar] [CrossRef]
- Wu, F.; Yang, X.; Cui, Z.; Ren, L.; Jiang, S.; Liu, Y.; Yuan, S. The impact of human activities on blue-green water resources and quantification of water resource scarcity in the Yangtze River Basin. Sci. Total Environ. 2024, 909, 168550. [Google Scholar] [CrossRef] [PubMed]
- Cui, J.; Li, P.; Qi, X.; Rahman, S.U.; Zhang, Z. Changes of Microbial Diversity in Rhizosphere of Different Cadmium-Gradients Soil under Irrigation with Reclaimed Water. Sustainability 2022, 14, 8891. [Google Scholar] [CrossRef]
- Kosolapova, N.A.; Matveeva, L.G.; Nikitaeva, A.Y.; Molapisi, L. Modeling resource basis for social and economic development strategies: Water resource case. J. Hydrol. 2017, 553, 438–446. [Google Scholar] [CrossRef]
- Liu, X.; Pan, Y.; Zhang, W.; Ying, L.; Huang, W. Achieve sustainable development of rivers with water resource management-economic model of river chief system in China. Sci. Total Environ. 2020, 708, 134657. [Google Scholar] [CrossRef]
- Medellín-Azuara, J.; Harou, J.J.; Howitt, R.E. Estimating economic value of agricultural water under changing conditions and the effects of spatial aggregation. Sci. Total Environ. 2010, 408, 5639–5648. [Google Scholar] [CrossRef]
- Liu, J.; Dong, S.; Mao, Q. Comprehensive evaluation of the water resource carrying capacity for China. Geogr. Nat. Resour. 2012, 33, 92–99. [Google Scholar] [CrossRef]
- Wang, S.; Li, R. Toward the coordinated sustainable development of urban water resource use and economic growth: An empirical analysis of Tianjin City, China. Sustainability 2018, 10, 1323. [Google Scholar] [CrossRef]
- Bao, C.; Fang, C. Water resources flows related to urbanization in China: Challenges and perspectives for water management and urban development. Water Resour. Manag. 2012, 26, 531–552. [Google Scholar] [CrossRef]
- Wei, F.; Zhang, X.; Xu, J.; Bing, J.; Pan, G. Simulation of water resource allocation for sustainable urban development: An integrated optimization approach. J. Clean. Prod. 2020, 273, 122537. [Google Scholar] [CrossRef]
- Nguyen, T.T.; Ngo, H.H.; Guo, W.; Wang, X.C.; Ren, N.; Li, G.; Ding, J.; Liang, H. Implementation of a specific urban water management-Sponge City. Sci. Total Environ. 2019, 652, 147–162. [Google Scholar] [CrossRef] [PubMed]
- Cosgrove, W.J.; Loucks, D.P. Water management: Current and future challenges and research directions. Water Resour. Res. 2015, 51, 4823–4839. [Google Scholar] [CrossRef]
- Brown, R.R.; Keath, N.; Wong, T.H. Urban water management in cities: Historical, current and future regimes. Water Sci. Technol. 2009, 59, 847–855. [Google Scholar] [CrossRef]
- Ba, W.; Wang, D.; Gong, B.; Dai, Y.; Yang, Z.; Liu, Z. Urban water scarcity in China: A systematic review of research advances and future directions. Appl. Geogr. 2023, 159, 103069. [Google Scholar] [CrossRef]
- Li, Z.; Li, C.; Wang, X.; Peng, C.; Cai, Y.; Huang, W. A hybrid system dynamics and optimization approach for supporting sustainable water resources planning in Zhengzhou City, China. J. Hydrol. 2018, 556, 50–60. [Google Scholar] [CrossRef]
- Liu, Y.; Du, J.; Ding, B.; Liu, Y.; Liu, W.; Xia, A.; Huo, R.; Ran, Q.; Hao, Y.; Cui, X. Water resource conservation promotes synergy between economy and environment in China’s northern drylands. Front. Environ. Sci. Eng. 2022, 16, 28. [Google Scholar] [CrossRef]
- Song, P.; Wang, C.; Zhang, W.; Liu, W.; Sun, J.; Wang, X.; Lei, X.; Wang, H. Urban multi-source water supply in China: Variation tendency, modeling methods and challenges. Water 2020, 12, 1199. [Google Scholar] [CrossRef]
- Hu, Y.; Cheng, H. Water pollution during China’s industrial transition. Environ. Dev. 2013, 8, 57–73. [Google Scholar] [CrossRef]
- Sun, Y.; Liu, N.; Shang, J.; Zhang, J. Sustainable utilization of water resources in China: A system dynamics model. J. Clean. Prod. 2017, 142, 613–625. [Google Scholar] [CrossRef]
- Kong, Y.; He, W.; Yuan, L.; Zhang, Z.; Gao, X.; Degefu, D.M. Decoupling economic growth from water consumption in the Yangtze River Economic Belt, China. Ecol. Indic. 2021, 123, 107344. [Google Scholar] [CrossRef]
- Mu, L.; Liu, Y.; Chen, S. Alleviating water scarcity and poverty through water rights trading pilot policy: A quasi-natural experiment based approach. Sci. Total Environ. 2022, 823, 153318. [Google Scholar] [CrossRef] [PubMed]
- Guo, Y.; Ren, Z.; Wang, C.; Zhang, P.; Ma, Z.; Hong, S.; Hong, W.; He, X. Spatiotemporal patterns of urban forest carbon sequestration capacity: Implications for urban CO2 emission mitigation during China’s rapid urbanization. Sci. Total Environ. 2024, 912, 168781. [Google Scholar] [CrossRef] [PubMed]
- Wu, W.; Zhang, M.; Ding, Y. Exploring the effect of economic and environment factors on PM2.5 concentration: A case study of the Beijing-Tianjin-Hebei region. J. Environ. Manag. 2020, 268, 110703. [Google Scholar] [CrossRef] [PubMed]
- Yang, Y.; Yu, H.; Su, M.; Chen, Q.; Wen, J.; Hu, Y. Urban water resources accounting based on industrial interaction perspective: Data preparation, accounting framework, and case study. J. Environ. Manag. 2024, 349, 119532. [Google Scholar] [CrossRef] [PubMed]
- Valdovinos, J.; Yañez Soria, K. Urban water governance in Mexico during the COVID-19 pandemic. Int. J. Water Resour. Dev. 2024, 40, 84–104. [Google Scholar] [CrossRef]
- Kibaroğlu, A. The Evolution of Water Diplomacy Frameworks: The Euphrates-Tigris Basin as a Case Study. In Theorizing Transboundary Waters in International Relations; Springer: Berlin/Heidelberg, Germany, 2024; pp. 123–138. [Google Scholar]
- Hoekstra, A.; Hung, P. Globalisation of water resources: International virtual water flows in relation to crop trade. Glob. Environ. Chang. 2004, 15, 45–56. [Google Scholar] [CrossRef]
- Hoekstra, A.Y.; Chapagain, A.K. Water footprints of nations: Water use by people as a function of their consumption pattern. Water Resour. Manag. 2007, 21, 35–48. [Google Scholar] [CrossRef]
- Feng, K.; Chapagain, A.; Suh, S.; Pfister, S.; Hubacek, K. Comparison of bottom-up and top-down approaches to calculating the water footprints of nations. Econ. Syst. Res. 2011, 23, 371–385. [Google Scholar] [CrossRef]
- Jeswani, H.K.; Azapagic, A. Water footprint: Methodologies and a case study for assessing the impacts of water use. J. Clean. Prod. 2011, 19, 1288–1299. [Google Scholar] [CrossRef]
- Chapagain, A.; Orr, S. An improved water footprint methodology linking global consumption to local water resources: A case of Spanish tomatoes. J. Environ. Manag. 2009, 90, 1219–1228. [Google Scholar] [CrossRef] [PubMed]
- Novoa, V.; Ahumada-Rudolph, R.; Rojas, O.; Sáez, K.; De La Barrera, F.; Arumí, J.L. Understanding agricultural water footprint variability to improve water management in Chile. Sci. Total Environ. 2019, 670, 188–199. [Google Scholar] [CrossRef] [PubMed]
- Hossain, I.; Imteaz, M.A.; Khastagir, A. Water footprint: Applying the water footprint assessment method to Australian agriculture. J. Sci. Food Agric. 2021, 101, 4090–4098. [Google Scholar] [CrossRef] [PubMed]
- Xinchun, C.; Mengyang, W.; Xiangping, G.; Yalian, Z.; Yan, G.; Nan, W.; Weiguang, W. Assessing water scarcity in agricultural production system based on the generalized water resources and water footprint framework. Sci. Total Environ. 2017, 609, 587–597. [Google Scholar] [CrossRef] [PubMed]
- Xiao, J.; Wei, J.; Wu, M.; Cao, X. Bibliometric and visual analysis of crop water footprint: A widely used agricultural water resources evaluation method. Water 2022, 14, 2866. [Google Scholar] [CrossRef]
- Vanham, D.; Bidoglio, G. A review on the indicator water footprint for the EU28. Ecol. Indic. 2013, 26, 61–75. [Google Scholar] [CrossRef]
- Hoekstra, A.Y.; Mekonnen, M.M. The water footprint of humanity. Proc. Natl. Acad. Sci. USA 2012, 109, 3232–3237. [Google Scholar] [CrossRef]
- Ge, L.; Xie, G.; Zhang, C.; Li, S.; Qi, Y.; Cao, S.; He, T. An evaluation of China’s water footprint. Water Resour. Manag. 2011, 25, 2633–2647. [Google Scholar] [CrossRef]
- Xiong, Y.; Tian, X.; Liu, S.; Tang, Z. New patterns in China’s water footprint: Analysis of spatial and structural transitions from a regional perspective. J. Clean. Prod. 2020, 245, 118942. [Google Scholar] [CrossRef]
- Wang, Q.; Ge, S. Carbon footprint and water footprint in China: Similarities and differences. Sci. Total Environ. 2020, 739, 140070. [Google Scholar] [CrossRef]
- Zhu, Y.; Jiang, S.; Han, X.; Gao, X.; He, G.; Zhao, Y.; Li, H. A bibliometrics review of water footprint research in China: 2003–2018. Sustainability 2019, 11, 5082. [Google Scholar] [CrossRef]
- Chen, W.; Wu, S.; Lei, Y.; Li, S. China’s water footprint by province, and inter-provincial transfer of virtual water. Ecol. Indic. 2017, 74, 321–333. [Google Scholar] [CrossRef]
- Zhang, L.; Dong, H.; Geng, Y.; Francisco, M.-J. China’s provincial grey water footprint characteristic and driving forces. Sci. Total Environ. 2019, 677, 427–435. [Google Scholar] [CrossRef]
- Dong, H.; Geng, Y.; Sarkis, J.; Fujita, T.; Okadera, T.; Xue, B. Regional water footprint evaluation in China: A case of Liaoning. Sci. Total Environ. 2013, 442, 215–224. [Google Scholar] [CrossRef] [PubMed]
- Cai, B.; Liu, B.; Zhang, B. Evolution of Chinese urban household’s water footprint. J. Clean. Prod. 2019, 208, 1–10. [Google Scholar] [CrossRef]
- Lu, N.; Zhu, J.; Tang, Z.; Zhang, J.; Chi, H. Decreasing water dependency for economic growth in water-scarce regions by focusing on water footprint and physical water: A case study of Xi’an, China. Sustain. Cities Soc. 2022, 85, 104092. [Google Scholar] [CrossRef]
- Zhao, D.; Tang, Y.; Liu, J.; Tillotson, M.R. Water footprint of Jing-Jin-Ji urban agglomeration in China. J. Clean. Prod. 2017, 167, 919–928. [Google Scholar] [CrossRef]
- Gong, B.; Liu, Z.; Liu, Y.; Zhou, S. Understanding advances and challenges of urban water security and sustainability in China based on water footprint dynamics. Ecol. Indic. 2023, 150, 110233. [Google Scholar] [CrossRef]
- Tao, A. Study on the relationship between water resources utilization and economic development based on decoupling theory in Beijing. In Proceedings of the IOP Conference Series: Earth and Environmental Science, Zhuhai, China, 15–17 January 2021; p. 012207. [Google Scholar]
- Liu, Y.; Xu, H.; Wang, Y.; Cui, P.; Sun, C.; Zhu, Z.; Wang, Y. Life cycle water footprint and carbon footprint analysis of coal gasification to clean fuel dimethyl ether. Fuel 2024, 357, 129884. [Google Scholar] [CrossRef]
- Shu, J.; Bai, Y.; Chen, Q.; Weng, C.; Zhang, F. Dynamic simulation of the water-land-food nexus for the sustainable agricultural development in the North China Plain. Sci. Total Environ. 2024, 912, 168771. [Google Scholar] [CrossRef]
- Zhao, G.; Liu, J.; Kuang, W.; Ouyang, Z.; Xie, Z. Disturbance impacts of land use change on biodiversity conservation priority areas across China: 1990–2010. J. Geogr. Sci. 2015, 25, 515–529. [Google Scholar] [CrossRef]
- Fan, H.; Zhao, C.; Yang, Y. A comprehensive analysis of the spatio-temporal variation of urban air pollution in China during 2014–2018. Atmos. Environ. 2020, 220, 117066. [Google Scholar] [CrossRef]
- Lu, S.; Hu, Z.; Yu, H.; Fan, W.; Fu, C.; Wu, D. Changes of extreme precipitation and its associated mechanisms in Northwest China. Adv. Atmos. Sci. 2021, 38, 1665–1681. [Google Scholar] [CrossRef]
- Jiang, R.; Yu, X.; Xie, J.; Zhao, Y.; Li, F.; Yang, M. Recent changes in daily climate extremes in a serious water shortage metropolitan region, a case study in Jing-Jin-Ji of China. Theor. Appl. Clim. 2018, 134, 565–584. [Google Scholar] [CrossRef]
- Fan, Y.; Ji, J.; Jia, C.; Lei, M.; Wu, W.; Zheng, Y.; Wang, Z.; Zhang, G.; Song, Y. The valuation of gross ecosystem product in the three provinces in northeast of China. In Natural Resources Forum; Blackwell Publishing Ltd.: Oxford, UK, 2023. [Google Scholar]
- Wang, Y.; Yi, G.; Zhou, X.; Zhang, T.; Bie, X.; Li, J.; Ji, B. Spatial distribution and influencing factors on urban land surface temperature of twelve megacities in China from 2000 to 2017. Ecol. Indic. 2021, 125, 107533. [Google Scholar] [CrossRef]
- Xia, C.C.; Chen, K.; Zhou, J.; Mei, J.; Liu, Y.P.; Liu, G.D. Comparison of precipitation stable isotopes during wet and dry seasons in a subtropical monsoon climate region of China. Appl. Ecol. Environ. Res. 2019, 17, 11979–11993. [Google Scholar] [CrossRef]
- Huang, J.; Bu, L.; Kumar, K.R.; Khan, R.; Devi, N.L. Investigating the relationship between aerosol and cloud optical properties inferred from the MODIS sensor in recent decades over East China. Atmos. Environ. 2020, 239, 117812. [Google Scholar] [CrossRef]
- Li, M.; He, B.; Guo, R.; Li, Y.; Chen, Y.; Fan, Y. Study on population distribution pattern at the county level of China. Sustainability 2018, 10, 3598. [Google Scholar] [CrossRef]
- Chen, Y.; Guo, F.; Wang, J.; Cai, W.; Wang, C.; Wang, K. Provincial and gridded population projection for China under shared socioeconomic pathways from 2010 to 2100. Sci. Data 2020, 7, 83. [Google Scholar] [CrossRef]
- Niu, C.; Chang, J.; Wang, Y.; Shi, X.; Wang, X.; Guo, A.; Jin, W.; Zhou, S. A water resource equilibrium regulation model under water resource utilization conflict: A case study in the Yellow River Basin. Water Resour. Res. 2022, 58, e2021WR030779. [Google Scholar] [CrossRef]
- Dou, P.; Zuo, S.; Ren, Y.; Rodriguez, M.J.; Dai, S. Refined water security assessment for sustainable water management: A case study of 15 key cities in the Yangtze River Delta, China. J. Environ. Manag. 2021, 290, 112588. [Google Scholar] [CrossRef]
- Daming, H.; Wenjuan, Z.; Junhua, G. Study on the Reasonable Utilization of Transboundary Water Resources and Environmental Protection in Southwest China. In Proceedings of the International Symposium on Southeast Asian Water Environment (Biodiversity and Water Environment); 2006. Available online: https://www.zhangqiaokeyan.com/academic-conference-foreign_meeting-292848_thesis/0705018402558.html (accessed on 18 December 2023).
- Li, P.; Qian, H. Water resources research to support a sustainable China. Int. J. Water Resour. Dev. 2018, 34, 327–336. [Google Scholar] [CrossRef]
- Hoff, H.; Doell, P.; Fader, M.; Gerten, D.; Hauser, S.; Siebert, S. Water footprints of cities–indicators for sustainable consumption and production. Hydrol. Earth Syst. Sci. 2014, 18, 213–226. [Google Scholar] [CrossRef]
- Lovarelli, D.; Bacenetti, J.; Fiala, M. Water Footprint of crop productions: A review. Sci. Total Environ. 2016, 548, 236–251. [Google Scholar] [CrossRef]
- Pellicer-Martínez, F.; Martínez-Paz, J.M. The Water Footprint as an indicator of environmental sustainability in water use at the river basin level. Sci. Total Environ. 2016, 571, 561–574. [Google Scholar] [CrossRef]
- Van Oel, P.; Mekonnen, M.; Hoekstra, A.Y. The external water footprint of the Netherlands: Geographically-explicit quantification and impact assessment. Ecol. Econ. 2009, 69, 82–92. [Google Scholar] [CrossRef]
- Fader, M.; Gerten, D.; Thammer, M.; Heinke, J.; Lotze-Campen, H.; Lucht, W.; Cramer, W. Internal and external green-blue agricultural water footprints of nations, and related water and land savings through trade. Hydrol. Earth Syst. Sci. 2011, 15, 1641–1660. [Google Scholar] [CrossRef]
- Li, Y.; Lu, L.; Tan, Y.; Wang, L.; Shen, M. Decoupling water consumption and environmental impact on textile industry by using water footprint method: A case study in China. Water 2017, 9, 124. [Google Scholar] [CrossRef]
- Kong, Y.; He, W.; Yuan, L.; Shen, J.; An, M.; Degefu, D.M.; Gao, X.; Zhang, Z.; Sun, F.; Wan, Z. Decoupling analysis of water footprint and economic growth: A case study of Beijing–Tianjin–Hebei Region from 2004 to 2017. Int. J. Environ. Res. Public Health 2019, 16, 4873. [Google Scholar] [CrossRef]
- Liu, H.; Zhang, Z. Probing the carbon emissions in 30 regions of China based on symbolic regression and Tapio decoupling. Environ. Sci. Pollut. Res. 2022, 29, 2650–2663. [Google Scholar] [CrossRef]
- Faramarzi, M.; Yang, H.; Mousavi, J.; Schulin, R.; Binder, C.R.; Abbaspour, K.C. Analysis of intra-country virtual water trade strategy to alleviate water scarcity in Iran. Hydrol. Earth Syst. Sci. 2010, 14, 1417–1433. [Google Scholar] [CrossRef]
- Zhang, C.; Anadon, L.D. A multi-regional input–output analysis of domestic virtual water trade and provincial water footprint in China. Ecol. Econ. 2014, 100, 159–172. [Google Scholar] [CrossRef]
- Sun, S.; Yin, Y.; Wu, P.; Wang, Y.; Luan, X.; Li, C. Geographical evolution of agricultural production in China and its effects on water stress, economy, and the environment: The virtual water perspective. Water Resour. Res. 2019, 55, 4014–4029. [Google Scholar] [CrossRef]
- Chen, W.; Wu, S.; Lei, Y.; Li, S. Virtual water export and import in China’s foreign trade: A quantification using input-output tables of China from 2000 to 2012. Resour. Conserv. Recycl. 2018, 132, 278–290. [Google Scholar] [CrossRef]
- Zhang, Y.; Zhang, J.; Tian, Q. Virtual water trade in the service sector: China’s inbound tourism as a case study. Int. J. Environ. Res. Public Health 2021, 18, 1769. [Google Scholar] [CrossRef]
Disclaimer/Publisher’s Note: The statements, opinions and data contained in all publications are solely those of the individual author(s) and contributor(s) and not of MDPI and/or the editor(s). MDPI and/or the editor(s) disclaim responsibility for any injury to people or property resulting from any ideas, methods, instructions or products referred to in the content. |
© 2024 by the authors. Licensee MDPI, Basel, Switzerland. This article is an open access article distributed under the terms and conditions of the Creative Commons Attribution (CC BY) license (https://creativecommons.org/licenses/by/4.0/).