Article

Using GIS Techniques to Determine Appropriate Locations for Constructing Concrete Water Canals in the Baranti Plain of Erbil Governorate, Iraq

by
Twana Abdulrahman Hamad
1,*,
Mehmet Ali Çullu
1,
Ali Volkan Bilgili
1,
Erhan Akça
2 and
Soran O. Ahmed
1
1
Department of Soil Science and Plant Nutrition, Faculty of Agriculture, Harran University, Sanliurfa 63000, Türkiye
2
Technical Programs, Adiyaman University, Adıyaman 02040, Türkiye
*
Author to whom correspondence should be addressed.
Water 2024, 16(3), 448; https://doi.org/10.3390/w16030448
Submission received: 24 November 2023 / Revised: 13 January 2024 / Accepted: 16 January 2024 / Published: 30 January 2024

Abstract

:
Water, being the basic resource for life on earth, is of great importance in arid and semi-arid regions, which face the direct impacts of climate change. This study aims to solve water scarcity for Baranti Plain farmers by constructing concrete canals using modern technology. The Baranti Plain is located approximately 25 km north of Erbil in Iraq and spans an area of 445 km2. The Great Zap River flows through its northern region, with an average discharge of about 400 m3 per second. In response to the challenges faced in this area, the Ministry of Agriculture and Water Resources collaborated with the Food and Agriculture Organization (FAO) to gather essential data. This extensive dataset, covering the period from 2000 to 2021, particularly focuses on ground-level monitoring in September. Notably, the region experienced a significant decline in groundwater levels, totaling 23 m on average. Additionally, there was a 7.8% increase of urban expansion, and the number of wells increased from 257 in 2006 to 600 in 2021. To counter the diminishing groundwater levels and facilitate agricultural irrigation, a proposal was introduced to harness the waters of the Great Zap River. This plan involves channeling the river waters to the plain through a network of concrete canals known as the Baranati Project Plain. For precise planning, a digital elevation model (DEM) with a 12.5 m resolution was procured to analyze the area using GIS. This investigation revealed a height difference of 130 m between the Great Zap River and the Baranti Plain. Subsequently, the area was segmented into four zones based on its suitability for the project: highest, medium, low, and unsuitable. Notably, the combined areas of high, medium, and low suitability encompass 68% of the entire study region. The project’s next phase used a flow calculator to determine the channel’s shape, area, slope, and water requirements. The final phase involved analyzing annual rainfall data from three meteorological stations (Bastora, Ankawa, and Khabat), showing an average annual rainfall of 396 mm. The project has the capacity to irrigate more than 30,000 hectares of land, benefiting more than 1200 farmers. It is expected to stop the use of over 600 wells for irrigation and potentially raise groundwater levels by about 2.5 m annually. Our work revealed that addressing groundwater depletion requires implementing canals, rainwater harvesting, farmer education, modern irrigation, drilling restrictions, and supporting water.

1. Introduction

Over the last thirty years, water management in Iraq has faced significant challenges. Large-scale projects along the Tigris and Euphrates rivers in neighboring countries, notably the GAP project in Turkey, have exacerbated the situation [1]. Water issues differ between northern and southern Iraq, with the north experiencing a scarcity of groundwater, particularly in Erbil, while the south grapples with a shortage of surface water [1].
The flow calculator software simplifies channel design for various shapes, eliminating manual calculations and compatibility with computers and smartphones, though it is not available for free [1]. Advancements in information and computer technology have revolutionized the design and optimization of irrigation canals. This process utilizes GIS data processing to optimize canal layout based on physical conditions and economic factors. Digital information on topography, soils, and natural drainage is used to identify the most suitable canal location [1].
Throughout history, rivers have held significant importance within societies, despite their constantly changing water levels and channels. As civilizations progressed, their impact on river management became increasingly influential [1].
Water is an indispensable and precious resource, especially in arid and semiarid regions where water access often sparks conflicts. Water harvesting, a traditional practice in such areas for collecting rainwater to support crop and livestock growth, is now being implemented globally as a sustainable solution to alleviate the strain on existing water sources [2]. River water harvesting, a specific type of water harvesting, involves the collection and storage of rainwater for various purposes, including agriculture, domestic use, commercial activities, institutional needs, flood management, and replenishing groundwater levels [3].
With increasing concerns surrounding global climate change, interest in assessing potential impacts on surface water has increased [4]. Global temperature and precipitation changes are predicted to significantly alter regional climate and hydrological systems. Among the expected consequences are changes in regional water recharge patterns, leading to fluctuations in groundwater levels [5]. Techniques such as canal automation may save water significantly. But, these requires huge capital investment; hence, they are difficult to adopt [6]. The extended size of the channels and minor alterations in their structures result in significant differences in the project’s budget and duration [7]. Several optimization methods can help in determining the most economical open channel design, which is a channel design that minimizes construction expenses per unit length, given a set design discharge, roughness factor, and bed incline. The best design for a channel section can be determined through mathematical approaches [8]. Within the scope of this project, a significant action taken was the addition of concrete linings to irrigation canals. The primary reasons for adding these linings were to minimize water leakage from the natural soil-based canals and to enhance their functionality. Typically, the water levels in these irrigation canals exceed the adjacent groundwater levels [9]. Challenges linked to water loss in canals because of seepage fall into two categories [10] The first category relates to the excessive use of water that is sourced with considerable effort and at a premium from diverse origins [11]. The second issue is tied to drainage complications, heightened salinity, and increased alkalinity due to an ascending water level [12].
In recent years, significant irrigation projects have been undertaken around the world, reshaping agricultural landscapes, and addressing critical water-scarcity issues. These endeavors represent the intersection of innovation, engineering, and sustainability, aiming to transform regions and support growing demands for water in various sectors. Among these impressive initiatives are the Harran Plain Irrigation Project in Turkey, the Mubarak Pumping Station in Egypt, and the Concrete Channel South-to-North Water Transfer Project in China, each playing a vital role in enhancing water accessibility and fostering agricultural development.
The Harran Plain Irrigation Project covers approximately 1.8 million hectares of land and is the largest concrete channel in Turkey. The project is characterized by abundant groundwater resources and a vast irrigated field, and it plays a crucial role in transforming the region’s agricultural landscape [13].
The Mubarak Pumping Station in Egypt is a crucial component of the Toshka Project that facilitates the transfer of around 137,000 cubic meters per hour from Lake Nasser into the Sheikh Zayed Canal [14].
The Concrete Channel South-to-North Water Transfer Project in China aims to address severe water scarcity and the imbalance between water-rich southern regions and water-stressed northern regions of the country [15]. The project covers a large distance and consists of several roads with a total length of approximately 4400 km [16]. The government plans to increase the water supply to meet the growing demand for domestic, industrial, and agricultural water needs in the targeted areas [17].
The primary goal of this study is to solve the problems of the farmers in this area called the Baranti Plain. The problem is the lack of water for agriculture. Agriculture in this region predominantly depends on rainfall and limited irrigation from groundwater sources like wells. To solve or alleviate the issue, a suggestion is made to employ river water directed to agricultural fields via specially constructed concrete canals. To facilitate this, contemporary technology such as GIS is utilized to identify appropriate locations, and flow calculator software is employed to compute the channels’ dimensions, area, slope, and water needs.

2. Materials and Methods

2.1. Study Area

The Baranti Plain is situated 25 km northwest of Erbil City in Iraq. Located between the coordinates 36.329217° and 43.999623° and with altitudes varying from 279 to 513 m above sea level, this plain is surrounded by two rivers: one is seasonal, while the other is the internationally known Great Zap River [18]. Spanning an area of 445 km2, this fertile terrain is predominantly used for wheat and barley cultivation. With a semi-arid climate, the region experiences an average annual rainfall of 300 to 400 mm. Erbil’s summer temperatures can soar to 45 °C, while winter temperatures can dip to roughly 0 °C [19]. Figure 1 accurately depicts the exact study area.

2.2. Data Collection

2.2.1. Digital Elevation Model (DEM)

The digital elevation model (DEM) with a resolution of 12.5 m was obtained from the Earth Data website of the United States Geological Survey (USGS) [20]. The data provided is in raster format and is based on the WGS-84 datum. A digital elevation model (DEM) represents Earth’s surface elevations digitally, with each cell indicating the height of a specific point on the ground. In our study area, elevations range from 513 m above sea level at the highest point to 279 m above sea level at the lowest. Figure 2 illustrates our analysis of the area using contour lines derived from the DEM data.

2.2.2. Land Use and Land Cover Classification

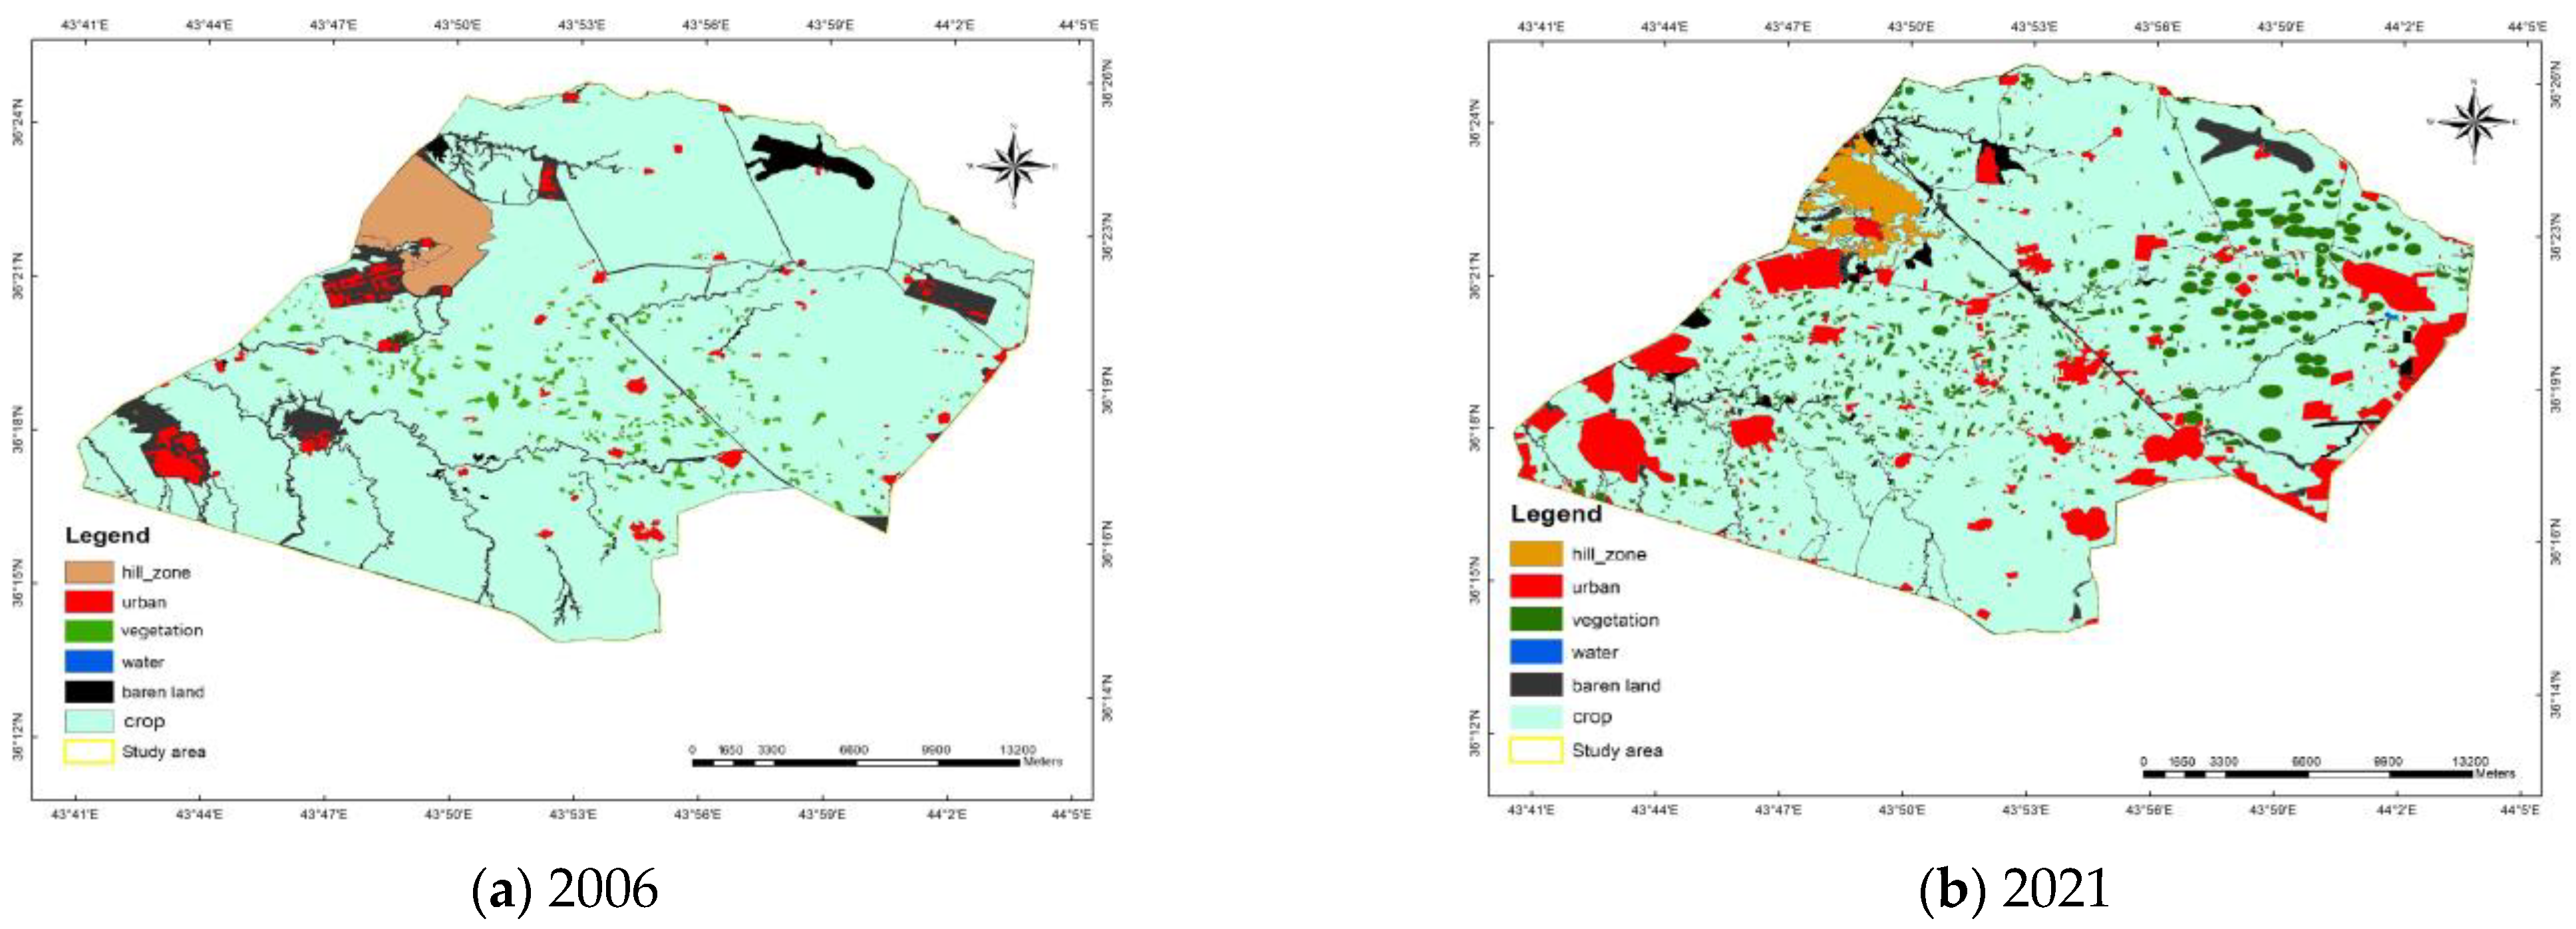
Satellite images play a crucial role in fields such as remote sensing, environmental monitoring, agriculture, disaster management, and urban planning [21]. In our study, we utilized Worldview images from 2021 and Quick Bird images from 2006 to classify the study area. Our main objective was to identify the distribution of green spaces and urban areas; we employed a polygon-based classification approach, eliminating the need for post-processing. Although this approach posed challenges, it enabled us to achieve a high-quality outcome. The study area was categorized into five main classes: Urban, Crop, Vegetation, Water, Barren Land, and Hill Zone. These classes represent the diverse land cover and land use types found within the area.

2.2.3. Soil Texture

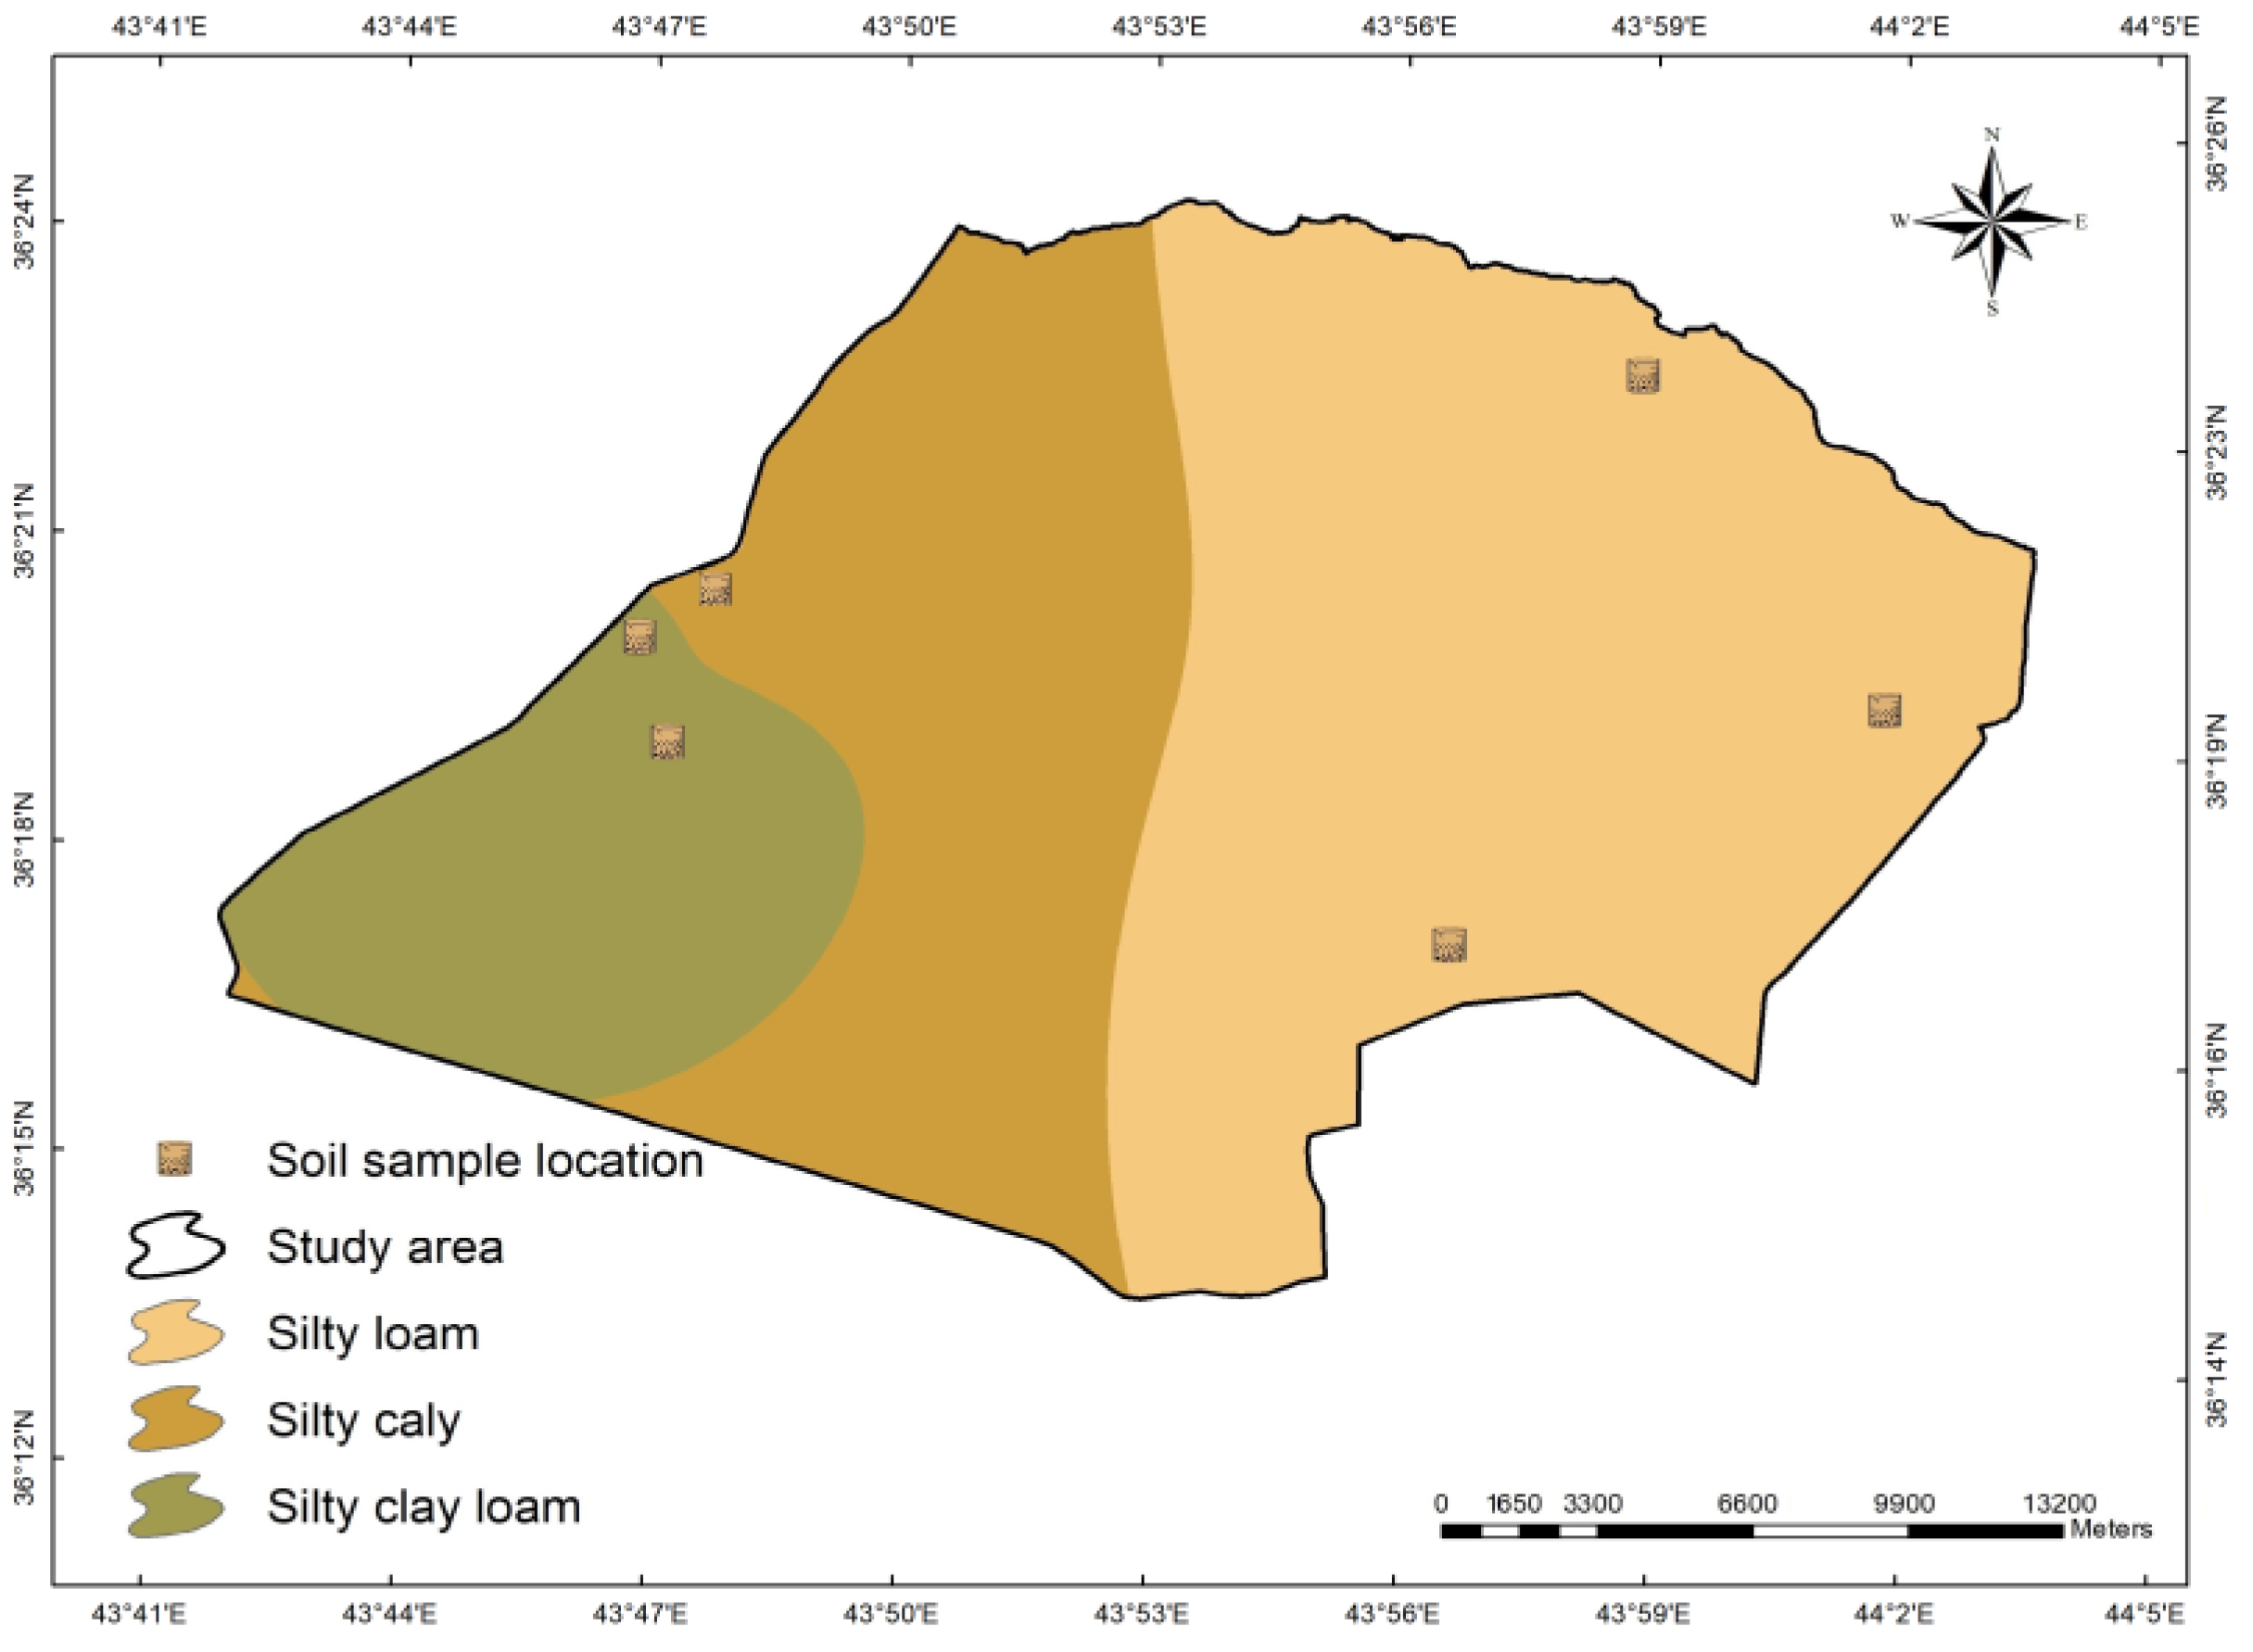
Khabat District falls within the Erbil Governorate, and, like any specific district, its soil texture is shaped by the local topography, climate, and historical geological events. According to the information gathered from Salahaddin University, the predominant soil textures in the region are silty loam and silty clay, as indicated in Table 1.

2.2.4. Rainfall

Access to precipitation data is crucial for conducting a wide array of studies, as it offers valuable insights necessary for making well-informed decisions. In our designated research area, we have obtained data from three meteorological stations: Ainkawa, Bastora, and Khabat. These stations have been consistently recording data since 2001 under the supervision of the Erbil General Directorate of Agriculture. During our on-site visit, we successfully acquired the monthly data from these three stations.

2.2.5. Groundwater-Monitoring Data

Groundwater monitoring is a vital process involving continuous measurement and analysis of groundwater quality and quantity at specific locations. These monitoring projects are instrumental in evaluating the impact of groundwater on both human health and agriculture, especially in semi-arid regions. In such areas, prone to frequent climate changes, groundwater monitoring assumes even greater significance. In our study area, located in the northern region of Erbil and representing the final segment of a semi-arid zone, the government annually oversees 82 wells, assessing both groundwater quality and quantity. Monthly data supplements these monitoring initiatives. Among these wells, seven specific ones in our study area (namely, Gainj Gawra, Grda Chal, Jadida Zab, Jazhnikan Ababakr, Kawer Gosk, Qafar, and Sebirany Gawra) have been monitored since 2001. After conducting our analysis, we chose September as the focal month for further investigation due to its peak loads on the wells.

2.3. Methodology

2.3.1. Topographical Analyses

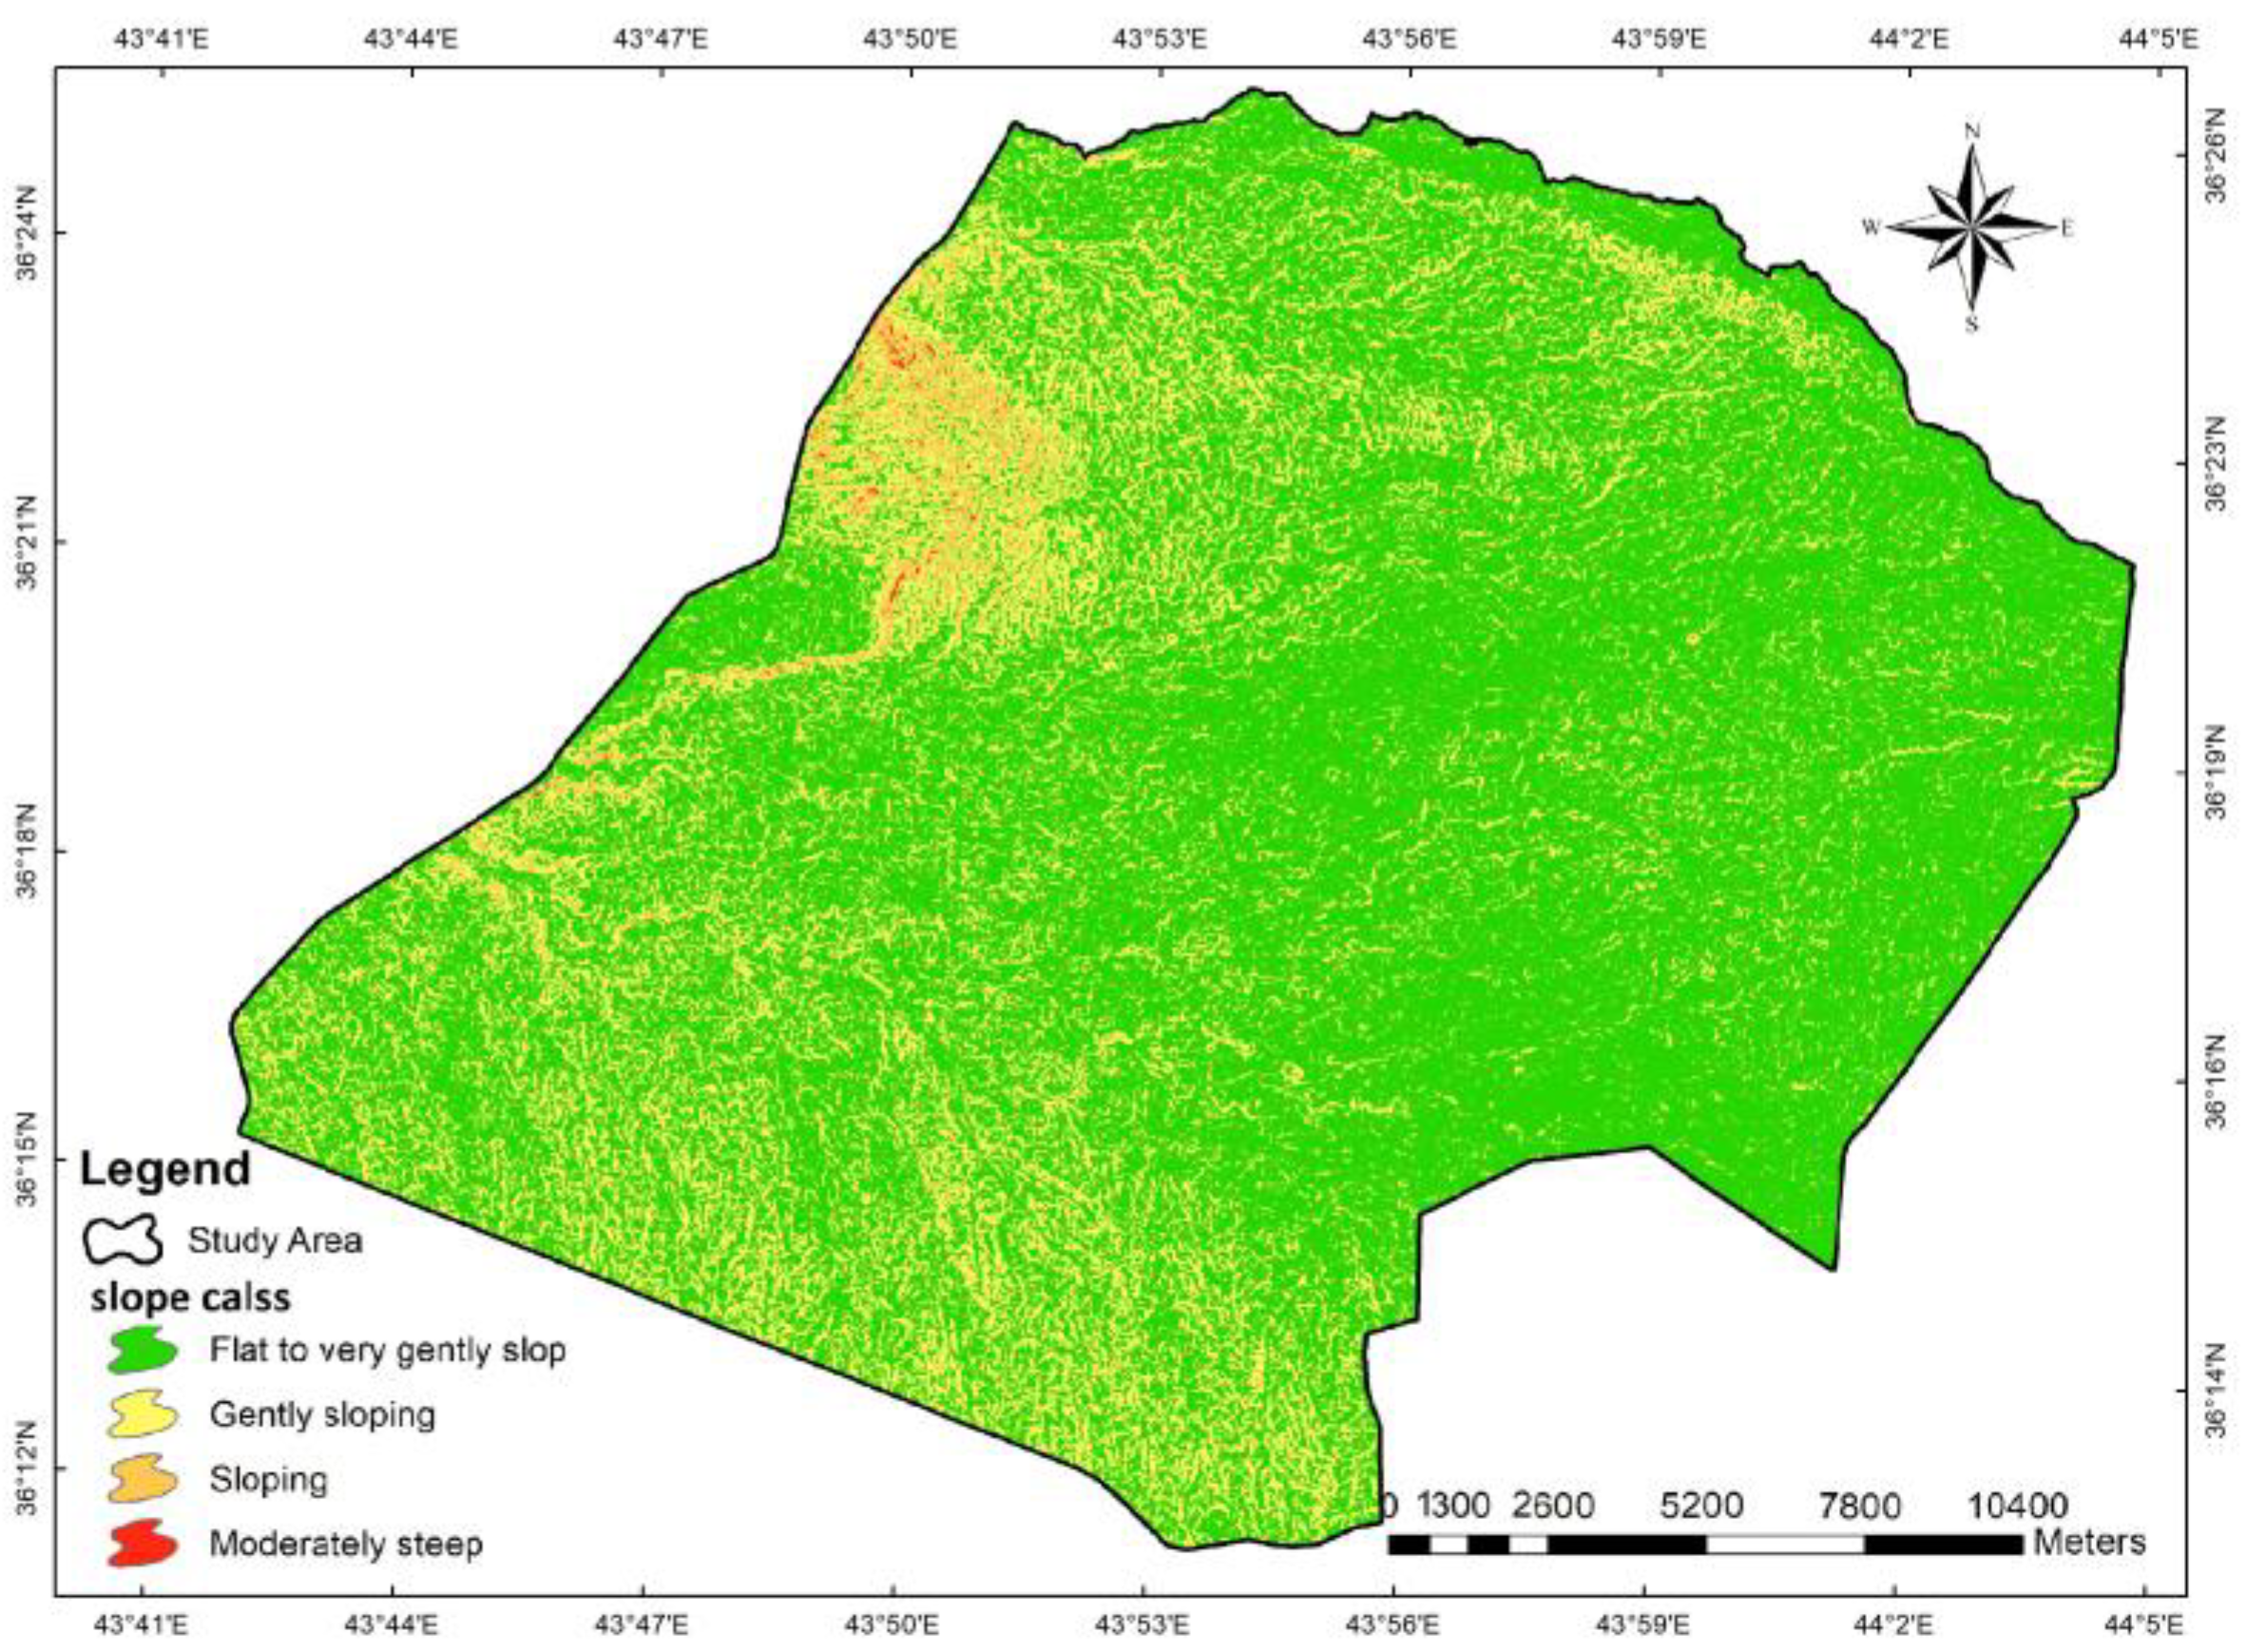
Slope plays a crucial role in ecological and environmental processes, affecting factors like soil erosion, runoff, and plant growth. Steep slopes are prone to erosion and landslides, whereas gentle slopes encourage vegetation growth and biodiversity [23]. Analyzing slopes is essential for various activities such as urban development, agriculture, flooding, and corrosion. Due to its significance, we meticulously classified the region’s slope according to FAO standards into four distinct regions [24].

2.3.2. Suitable Zone for Channel Stream

The GIS software ArcMap version 10.6 and 10.8 was utilized in this research to identify suitable locations for concrete channel construction within the study area, as shown in Figure 3. It mainly relies on the counter line to divide it into several groups.
i. Low Suitability: It generally covers lands with the lowest elevation levels in our study area, with elevation (300–350) m.
ii. Moderate Suitability: It generally includes land with higher elevation levels than their predecessors in our study area, with elevation (350–380) m.
iii. High Suitability: This area is very suitable for locating the mainstream channel because the height is equal to the height requested as the starting point, with elevation (380–400) m.
iv. Unsuitable: This includes land with elevation above the specified elevation of the channels. So, you cannot take advantage of this in this project, with elevation (400<) m.

2.3.3. Delineation of the Main Channel Stream

After designing the main canal, most of it was in a very suitable locale. It starts at an altitude of 400 m above sea level. It is 130 m above the river level, so a pump is needed to transport the water in the first stage. A minimum of 6 m3 per second and a maximum of 9 m3 per second are required. Considering the total land area of approximately 300 km2 and the fact that the channel is trapezoidal, according to the water required for the area, the size of the channel is as follows: a bottom width of 2 m, a height of 2 m, and an upper width of 6 m. The following equations are needed to determine the velocity, discharge, channel slope, and water depth.

2.3.4. Delineation of Sub-Channel Stream

The sub-channel, located in the moderately suitable zone, originates from the highest point at an elevation of 395 m above sea level, with a slope of 0.5 m per kilometer [21]. The base of the channel measures 1 m, and the upper part has a width of 3 m. The channel is trapezoidal, and the same formulas mentioned below can be used for calculations.
Manning’s equation for discharge (Q): Water 16 00448 i001
  Q = 1 n A R 2 2 3 S 2 1 2
Hydraulic radius (R):
R = A P
Cross-sectional area (A):
A = ( b 1 + b 2 ) h 2
Wetted perimeter (P):
P = b 1 + b 2 + 2 h 2 + b 2 b 1 / 2 2
Velocity (V):
V = ( 1 n ) R 2 ( 2 3 ) S 2 ( 1 2 )

2.3.5. Delineation of the Branch Channel Stream
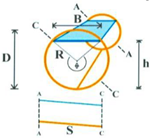
These branches are part of our project after the mainstream and sub-stream. These branches play an important role in transporting water to territories inaccessible via the main streams. These branches are circular channels with a diameter of 1 m and a slope of 0.5 m per kilometer. This type has its own equations and formulas for finding velocity, discharge, area, water depth, and width above the channel bottom. Below are the following formulas for calculating these parameters: Water 16 00448 i002
Velocity (V):
V = ( 1 n ) R 2 ( 2 3 ) S 2 ( 1 2 )
Discharge (Q):
Q = A V
Area (A):
A = ( π D 2 ) / 4
Water depth (H):
H = ( 4 A ) / ( π D )

2.3.6. Pumping Station

The design of a pumping station for water transfer from a river to canal faces was challenging due to the 130 m elevation difference. To make it more manageable, the elevation was divided into 65 m parts. The pump model (300QS-125, flow 461 L/s, head 100 m, power 620 kw) was used to transport water to the desired height. The equation can be used to convert the pump capacity to the desired 65 m head.
Capacity1 × ( Head1 / Head2 ) = Capacity2
where
Capacity1 = 461 L per second (original capacity at a head of 100 m)
Head1 = 100 m (original head)
Head2 = 65 m (desired head)
Capacity2 = adjusted capacity at the desired head
Using this equation, we can calculate the adjusted capacity as follows:
Capacity2 = Capacity1 × (Head1/Head2)
Capacity2 = 461 × (100/65)
Capacity2 ≈ 708.77 L per second
Therefore, to achieve a head of 65 m, we would need a pump with a capacity of approximately 708.77 L per second. This adjusted capacity would allow us to effectively transfer water from the river to the channel, accounting for the height difference and ensuring efficient pump performance.
It requires 620 kw of electrical power for each pump. Convert this power to megawatts (MW) using the following steps:
kW = kilowatts
MW = megawatts
1 kW = 1000 watt
1 MW = 1000 kw
620/1000 = 0.62 MW
Each pump requires 0.62 megawatts of power to operate efficiently.

3. Results

3.1. Result of Land Use and Land Cover Classification

The classification of land use and land cover is essential for detecting changes, recognizing trends, and making informed decisions. In this research, we classified the land use in the designated area from 2006 to 2021 (as shown in Figure 4) utilizing high-resolution satellite images from QuickBird and Worldview-3. These images, with a resolution ranging between 50 and 60 cm, yielded detailed insights, leading to the outcomes presented in Table 2.

3.2. Topographical Result

To gain an understanding of the area’s topography, we analyzed the digital elevation model (DEM) map by considering the slope. Subsequently, we compared the results to the standards outlined by FAO [24]. The analysis led us to categorize the area into five distinct classes, as illustrated in Table 3 and Figure 5, reflecting the specific characteristic tics of our region.

3.3. Rainfall

Precipitation data holds significant importance in research, and in our study region, have been relying on data collected from three meteorological stations since 2001: Ainkawa, Bastora, and Khabat (as outlined in Table 4) under the supervision of the Erbil General Directorate of Agriculture. The monthly data were processed using ArcMap’s IDW program, enabling us to create a map illustrated in Figure 6.

3.4. Soil Texture

Khabat District, located within the Erbil Governorate, experiences soil texture variations influenced by local topography, climate, and historical geological processes. Data sourced from Salahaddin University’s College of Agriculture was utilized to generate a soil textural map of the study area through ArcMap 10.8, as depicted in Figure 7, with corresponding findings detailed in Table 5.

3.5. Groundwater-Monitoring-Result Data

In Erbil province as a whole, the government monitors 82 wells annually to assess their quantity. Since 2001, 7 of these 82 wells have been in our study area. The results show that the water level of wells has decreased by 11.7 m in several areas, such as Qafar Well. The Kawergosk well has decreased by 53 m. These results are summarized in Table 6 and are shown in Figure 8. These findings highlight the importance of groundwater monitoring in addressing agricultural challenges in semi-arid regions.

3.6. Results of the Open Channel Stream

After analyzing the Baranati plain for concrete channel construction, numerous discoveries emerged with the assistance of a GIS program. The specified starting point or intake was established at an elevation of 130 m above the level of the Great Zab River. This revealed that the water demand for the 30,000-hectare area ranged from 2% to 6% of the Great Zab River, depending on the season and when The Great Zab River average is 400 m3 per second.

3.7. Result for Delineation Suitable Zone

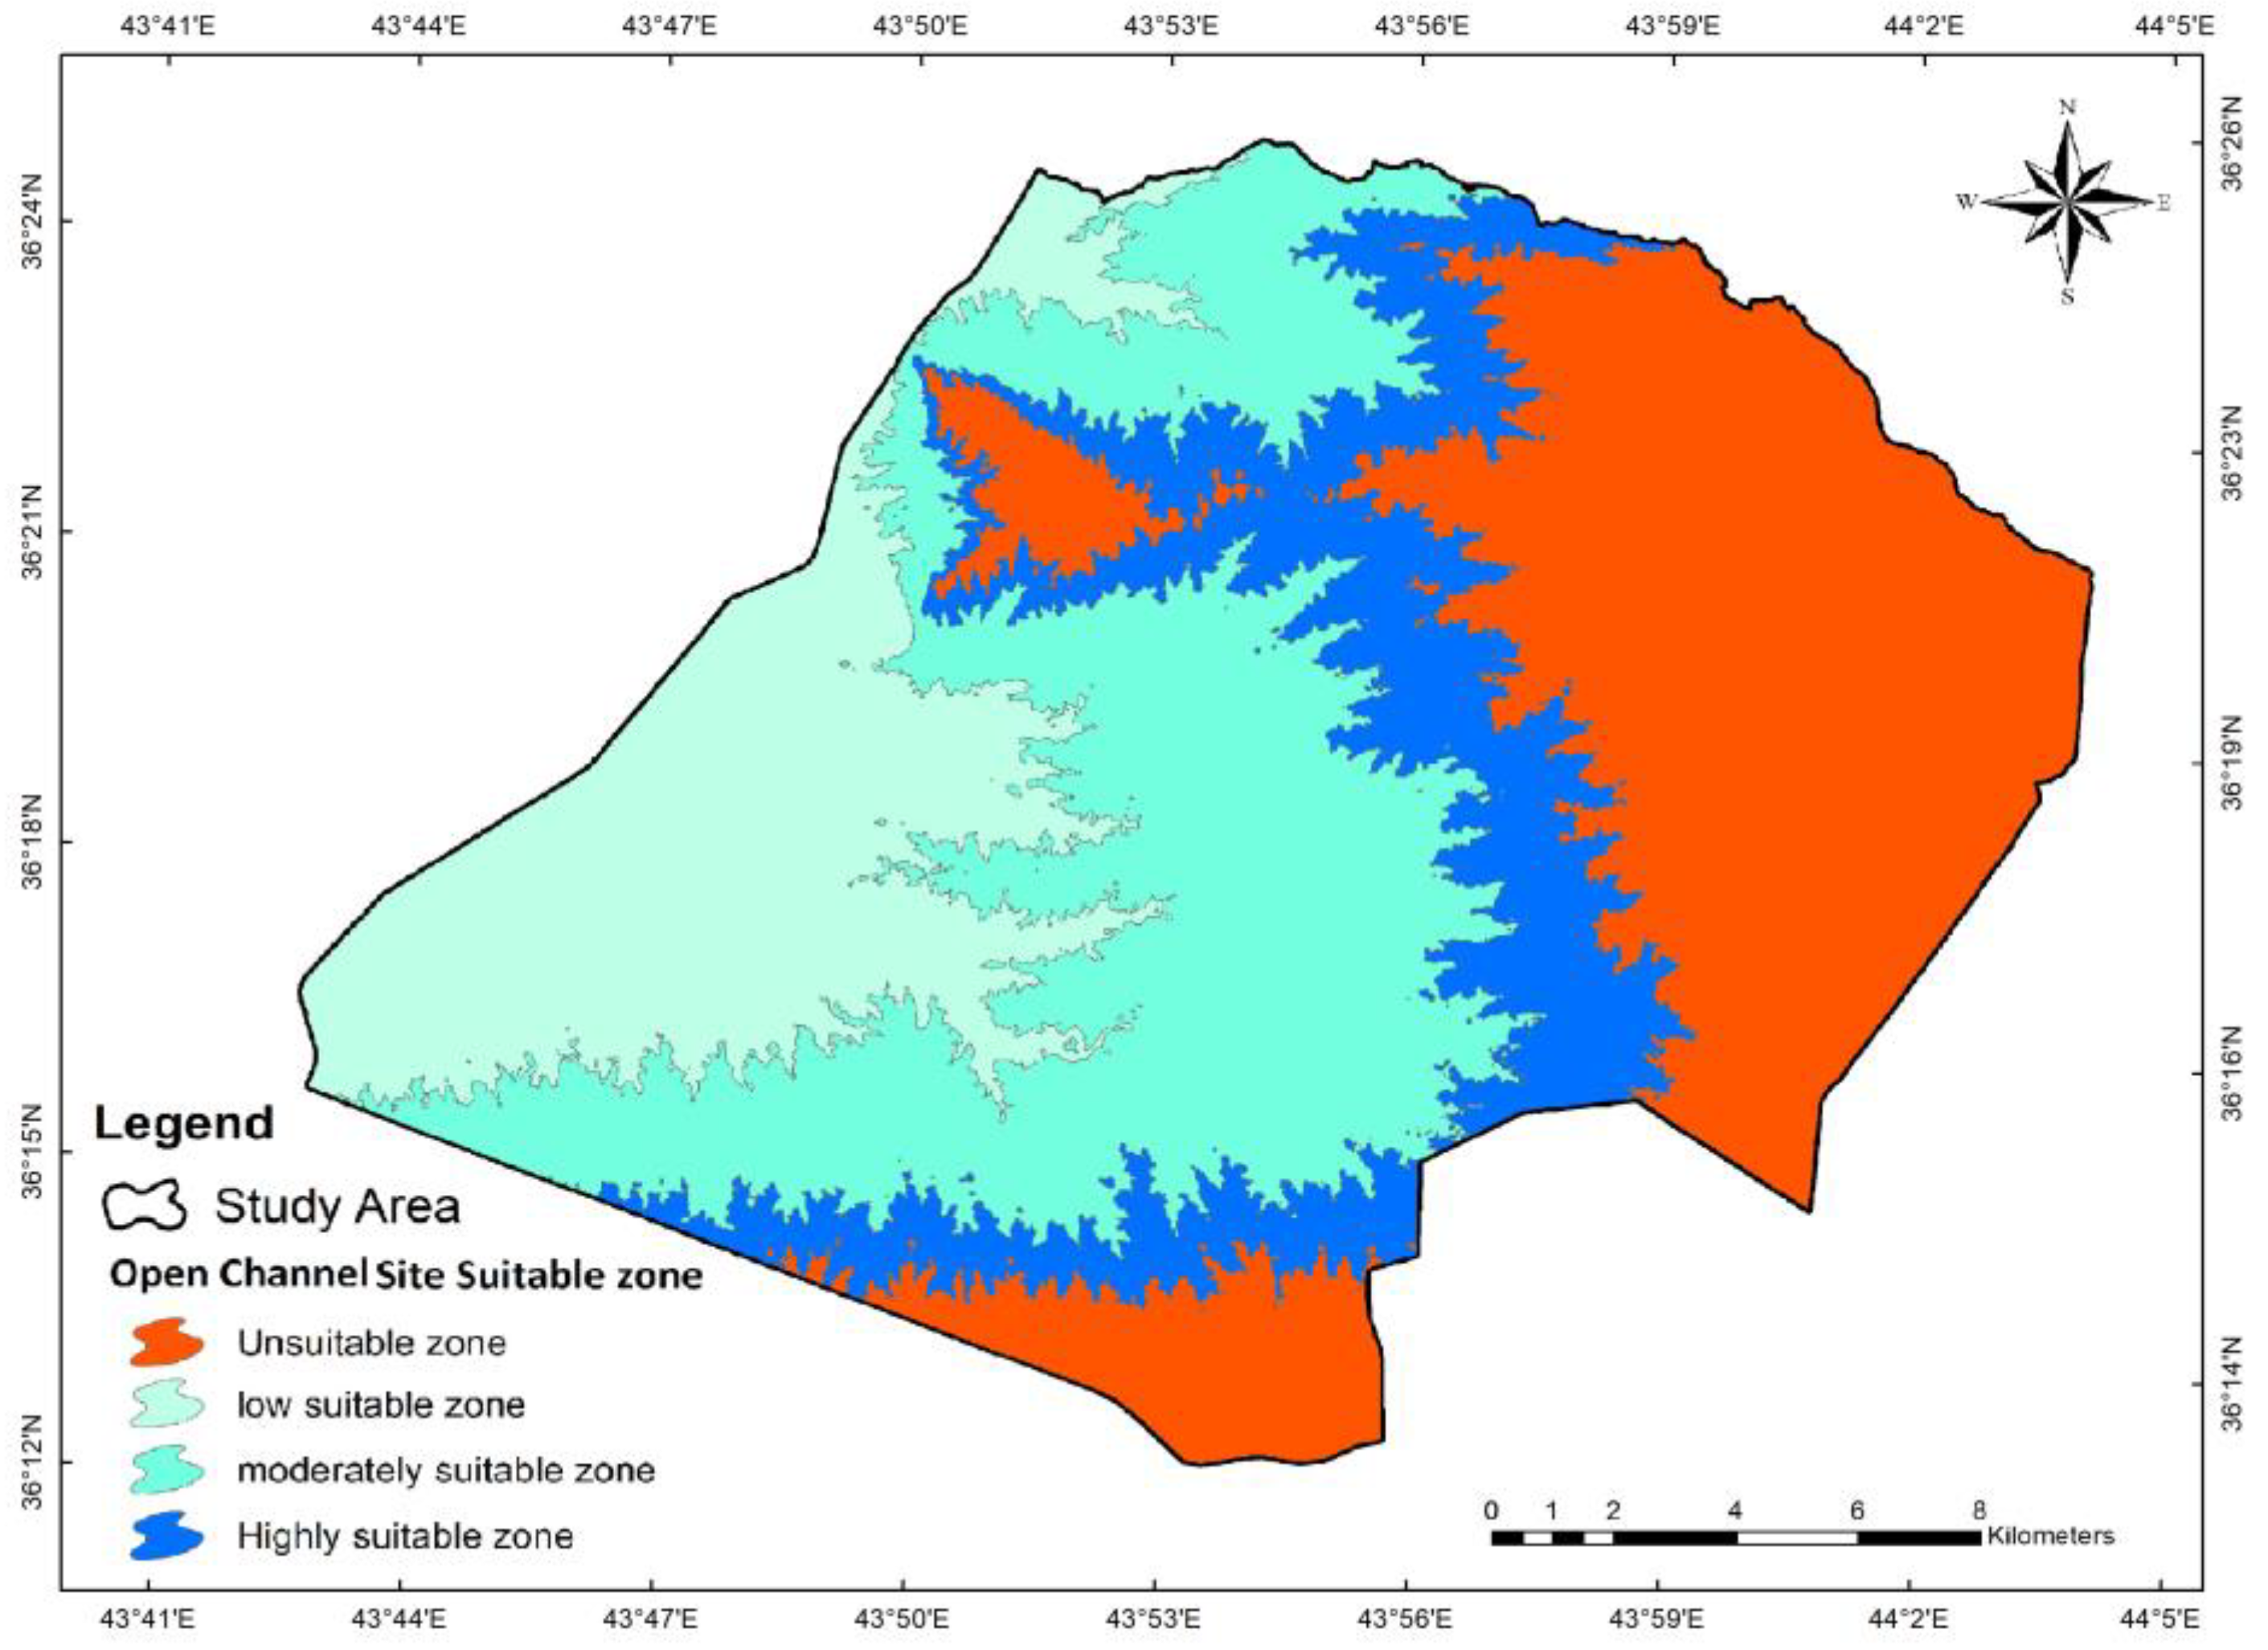
The study focused on assessing the topography, contour line, and slope of a specific area to assess the feasibility of implementing an open channel for irrigation purposes. Utilizing an elevation model (DEM) and geographic information system (GIS) software version 10.8, a digital map was created. After analyzing the area, we found that 68% of the land is used for concrete channels, which is 300 km2 of the study area. Then, we divided it into four areas according to their appropriateness, as shown in Figure 9.
The low-suitable zone covered 88.8 square kilometers.
The moderately suitable zone covered 137.6 square kilometers.
The most suitable zone covered 75.3 square kilometers.
The non-suitable zone covered 146.2 square kilometers.
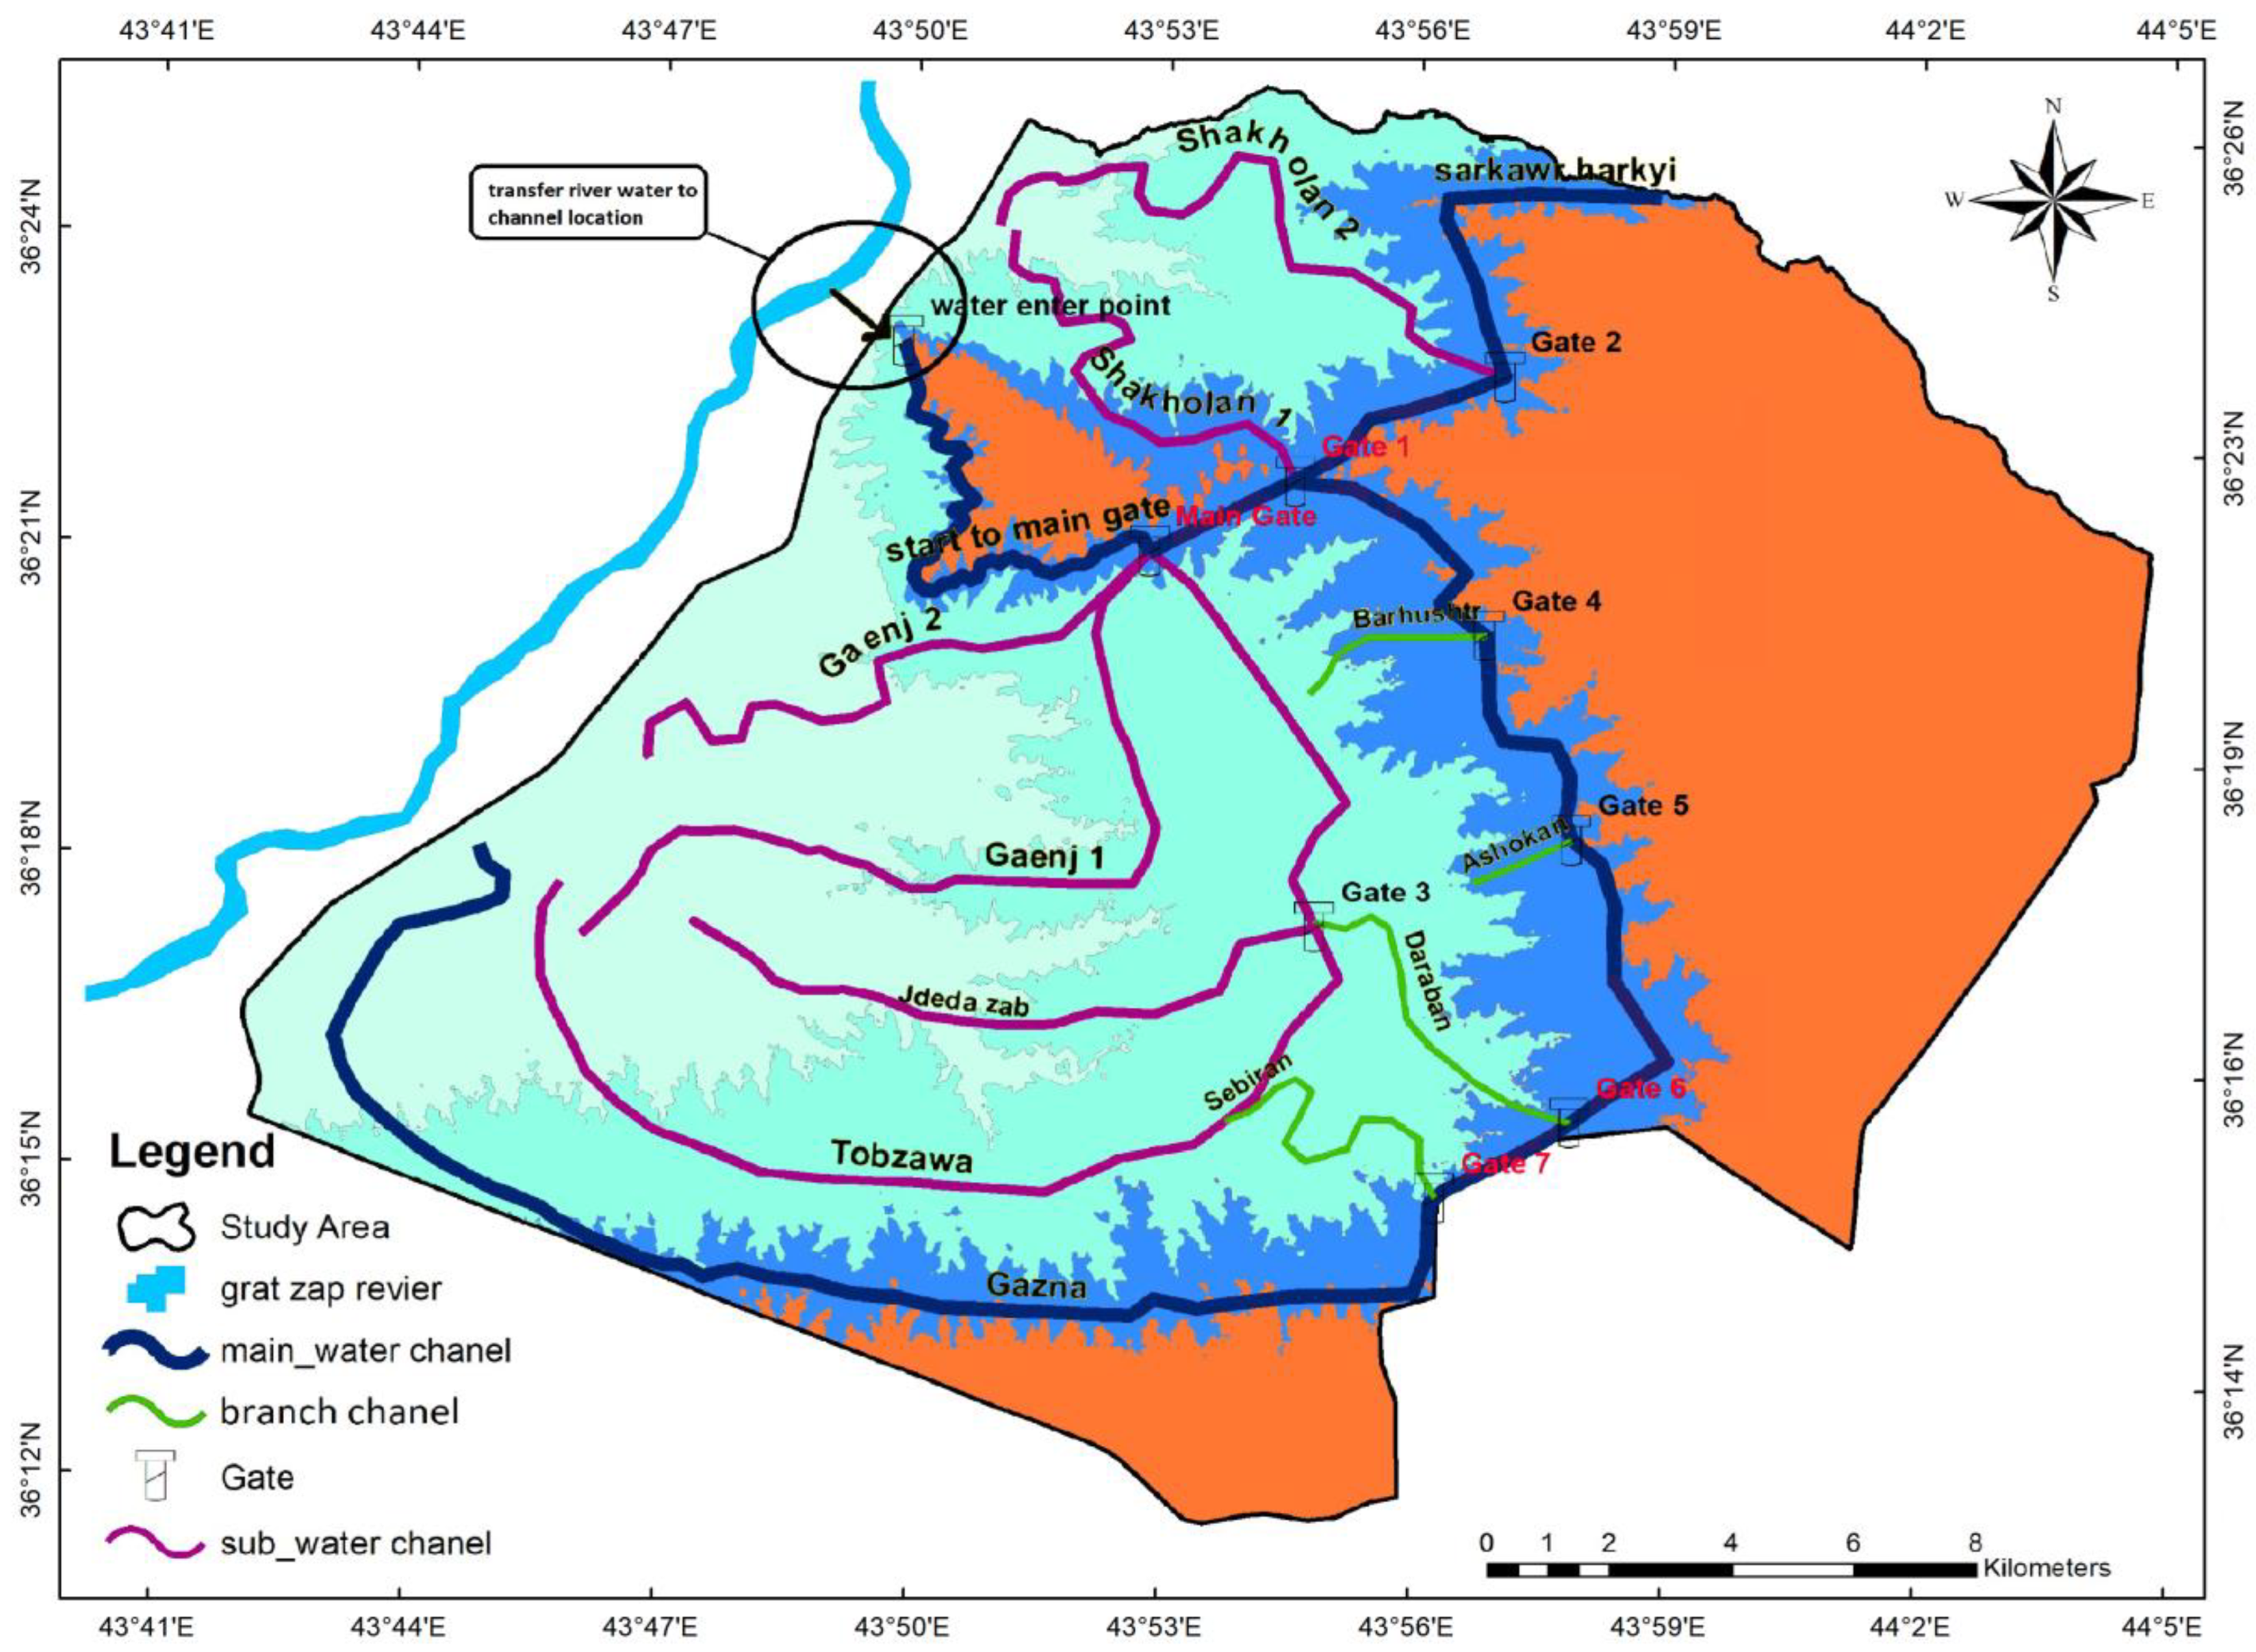
Crucial information for the design and planning of the open channel was obtained by calculating the distance and elevation between the channel’s starting point and the river, which were determined to be 1.5 km and 400 m above sea level, respectively. These details are essential for effective resource allocation and ensuring efficient water flow from the river to the designated areas. The specific results can be observed in Figure 9 and Figure 10.

3.8. Result of the Main Channel Stream

The main channel stream, designed to irrigate an area of 10,600 hectares, consists of three interconnected channels, collectively known as ‘Ifraz’. The first channel, starting from the pumping station, allows for direct water transfer from the river. The second channel, ‘Gazna’, spans 44 km, and the third channel, ‘Sarkawr Harkyi’, measures 10 km. The combined water capacity of these three channels is 9 m3/s. The total length of the main channel, including the interconnected channels, is 68.2 km. The channel has a bottom width of 2 m, a height of 2 m, and an upper width of 6 m. The slope of the channels is maintained at 0.5 m per kilometer for efficient water flow, as shown in Figure 10 and Table 7 and Table 8.

3.9. Result of the Sub-Main Channel Stream

The secondary channel, starting 395 m above sea level, consists of six graded sub-channels: Topzawa, Gang 1, Shakholan 2, Jeddah Zap, Gang 2, and Shakholan 1. These 86 km-long sub-channels facilitate water flow and cover 0.5 m per km. The channel has a water transfer capacity of 1.45 m3 per second, allowing for efficient water movement. The six secondary channels have a collective capacity to irrigate 16,200 hectares of land, supporting agricultural activities in the region. The channel’s widths are 1 m at the base and 1 m at the upper part, as shown in Figure 10 and Table 7 and Table 8.

3.10. Result of the Branch Channel Stream

The canal system consists of four tributaries, each with a length of 18 km. The branches, Siberan, Daraban, Perhostar, and Ashokan, use a concrete pipe with a diameter of 1 m. The flow rate in these tributaries is 0.34 m3 per second, ensuring efficient water transport within the canal system. The tributaries aim to irrigate 1700 hectares of land, ensuring water resources for agricultural purposes in the specified area. The specific slope of the branch allows for 0.5 m per kilometer, as shown in Table 7 and Table 8.

3.11. Result of the Pumping Station

The pump bases are divided into two bases, each 65 m high, with 13 pumps, specifically the 300QS-125 model, assigned to each base. A total of 26 pumps are needed, capable of transporting 9 m3 of water per second. At the lowest level, 17 pumps can transport 6 m3 of water per second. The maximum electricity demand for the pump system is 16.2 MW, while the minimum demand is 10.54 MW, indicating the power needed to operate the entire system at its peak and lowest levels.

4. Discussion

It is widely acknowledged that groundwater levels play a crucial role in shaping the lives of humans and the agricultural sector. The rapid decline in groundwater levels is clear in Figure 8. Clearly, the level of well water decreases significantly every year in this area. At the highest level of 53 m from the Kawargosk well and the lowest level of 11.7 m from the Qafar well, this study was conducted to prevent this decline, while transferring river water to farmers instead of using groundwater. The reasons for the decline in groundwater levels are mainly due to the expansion of towns from 10.53 km2 to 45.5 km2. In addition, vegetation increased from 8.83 km2 to 29.12 km2, as shown in Table 2, and there are several large factories in the area, such as the Coca-Cola manufacturing company and a large oil refinery [21]. Addressing this problem involves opting for the Great Zab River. The Greater Zab River, originating in Turkey near Lake Van and flowing through central and northern Iraq, has a basin covering 40,300 km2, with 62% in Iraq and 38% in Turkey [25]. The river’s discharge experiences significant seasonal variations due to precipitation and snowmelt. In winter, the average discharge is more than 500 m3/s, while, in spring, it ranges from 200 to 300 m3/s. Summer witnesses the river’s discharge reaching its lowest levels, averaging 100 to 200 m3/s, and, in autumn, the average discharge fluctuates between 150 and 250 m3/s [26]. Despite these variations, most water quality parameters indicate that the Greater Zab River is within permissible levels for drinking water consumption and is considered safe for all types of crops [27]. Recognized as the closest water source in our area, efforts are underway to construct a concrete channel canal on it. The Toshka and Haran Plain projects in Egypt and Turkey are two large projects located in arid and semi-arid areas that are similar to the Barantin Plain project in several ways. Toshka sources its water from Lake Nasser on the Nile [28]. Meanwhile, the Harran Plain Project gets its water supply from the Ataturk Dam situated on the Euphrates River [29]. In contrast, the Baranti project draws water from the Great Zab River. In its initial phase, Toshka employs 24 massive pumps capable of transferring 1.2 million cubic meters every hour [30]. On the other hand, Baranti’s first phase utilizes 26 pumps capable of transferring 32,400 cubic meters per hour. The Harran Plain’s early stage is designed to use 26 km-long tunnels capable of transferring 1 million cubic meters of water hourly [31]. Toshka’s primary channel extends 51 km and can irrigate an area of around 500,000 hectares [32]. The Harran Plain’s main canal, measuring 86 km, has the potential to serve approximately 800,000 hectares [30]. The Baranti Project’s primary channel spans 68 km and is built to irrigate 30,000 hectares. In addition to the many benefits of the agricultural sector, such as increasing domestic production and domestic jobs, it contributes to an annual rise in groundwater levels exceeding 2.5 m, as illustrated in Figure 11 [33,34]. Although our area is smaller than the Haran Plain, it hosts over 600 agricultural wells. When these wells are inactive, they contribute significantly to the elevation of groundwater [35,36,37,38,39,40].

5. Conclusions and Recommendations

5.1. Conclusions

The impact of climate change, drought, and excessive water use in agriculture on groundwater depletion is evident in arid and semi-arid areas, including the study region, the Baranti Plain, which is located between Khabat and Ankawa districts in Erbil. Over the years, an analysis of groundwater storage data from 2000 to 2021 has shown a significant decline in groundwater levels in the Baranti plain by an average of 23 m. So, as a result, the construction of a concrete canal in the Baranati plain on the Great Zabi river, which was named the Paranthi Plain Project, was initiated. At the project’s outset, GIS techniques were employed to analyze the land in the area. This analysis revealed the necessity of a pump. This project initially requires a pump to transfer water from the river into the concrete channels because the plain level is 130 m higher than the river and then slopes and distributes it throughout the area. The project has the capacity to irrigate over 30,000 hectares of land in the region, covering 68% of the total area. The transfer capacity of the channel is 32,400 m3/hour. The length of the main channel is 68.2 km, the length of the sub-channel is 86 km, and the length of the branches is 17 km.
Over 1200 farmers will benefit from a project that replaces over 600 irrigation wells, improving groundwater levels and increasing farming and fishing resources. It also protects the land in this area from drought. The project will also support drinking water projects in Erbil’s center during the summer season, when these wells will be stopped.

5.2. Recommendations

In order to address the problem of groundwater depletion, the study proposes several recommendations.
Utilize surface water instead of groundwater.
Constructing concrete channels is the most effective approach. As a result of this discussion, we have made this discovery.
Construct ponds in suitable places to collect rainwater.
Organize awareness courses for farmers to comprehend the risks associated with water scarcity.
Encourage farmers to adopt new irrigation types instead of conventional ones.
Restrict new well drilling.
Government should subsidize crops that do not use extensive water.

Author Contributions

Conceptualization, T.A.H.; Methodology, T.A.H.; Validation, T.A.H.; Investigation, M.A.Ç. and E.A.; Resources, A.V.B. and S.O.A.; Visualization, E.A.; Supervision, M.A.Ç. and A.V.B.. All authors have read and agreed to the published version of the manuscript.

Funding

This research received no external funding.

Data Availability Statement

Research data are available upon request.

Acknowledgments

I would like to thank God for his help and support. Without his help, it would have been impossible to succeed in this project. I want to express my deep gratitude to my supervisor, Ali Çullu, and Ali Volkan Bilgili for their patient guidance, encouragement, and helpful criticism of this research work. Many thanks to Soran O. Ahmed at Harran University, Geography Department, for advice and support throughout the paper preparation.

Conflicts of Interest

The authors declare no conflict of interest.

References

  1. Downs, P.; Gregory, K. River Channel Management: Towards Sustainable Catchment Hydro Systems; Routledge: Abingdon, UK, 2004. [Google Scholar]
  2. Prinz, D. Rainwater Harvesting for Domestic Use. Water 1996, 8, 1–10. [Google Scholar]
  3. Mzirai, O.; Tumbo, S. Macro-catchment rainwater harvesting systems: Challenges and opportunities to access runoff. J. Anim. Plant Sci. 2010, 7, 789–800. [Google Scholar]
  4. Solomon, B.D. Intergovernmental panel on climate change (IPCC). In Dictionary of Ecological Economics; Edward Elgar Publishing: Cheltenham, UK, 2023; p. 302. [Google Scholar]
  5. Apaydin, A. Response of groundwater to climate variation: Fluctuations of groundwater level and well yields in the Halacli aquifer (Cankiri, Turkey). Environ. Monit. Assess. 2009, 165, 653–663. [Google Scholar] [CrossRef]
  6. Bhalage, P.; Jadia, B.; Sangale, S. Case Studies of Innovative Irrigation Management Techniques. Aquat. Procedia 2015, 4, 1197–1202. [Google Scholar] [CrossRef]
  7. Lehner, B.; Grill, G. Global river hydrography and network routing: Baseline data and new approaches to study the world’s large river systems. Hydrol. Process. 2013, 27, 2171–2186. [Google Scholar] [CrossRef]
  8. Ferdowsi, A.; Valikhan-Anaraki, M.; Mousavi, S.-F.; Farzin, S.; Mirjalili, S. Developing a model for multi-objective optimization of open channels and labyrinth weirs: Theory and application in Isfahan Irrigation Networks. Flow Meas. Instrum. 2021, 80, 101971. [Google Scholar] [CrossRef]
  9. Meijer, K.; Boelee, E.; Augustijn, D.; van der Molen, I. Impacts of concrete lining of irrigation canals on availability of water for domestic use in southern Sri Lanka. Agric. Water Manag. 2006, 83, 243–251. [Google Scholar] [CrossRef]
  10. Martin, C.A.; Gates, T.K. Uncertainty of canal seepage losses estimated using flowing water balance with acoustic Doppler devices. J. Hydrol. 2014, 517, 746–761. [Google Scholar] [CrossRef]
  11. Jury, W.A.; Vaux, H.J., Jr. The emerging global water crisis: Managing scarcity and conflict between water users. Adv. Agron. 2007, 95, 1–76. [Google Scholar]
  12. Balaban, A. Sulama Fiebekelerinde Kanal ve Tarla Arkları Sızma Kayıpları Üzerinde Bir Arafltırma; Ankara Üniversitesi, Ziraat Fakültesi Yayınları: Ankara, Turkey, 1970. [Google Scholar]
  13. Özel, N.; Bozdağ, Ş.; Baba, A. Effect of Irrigation System on Groundwater Resources in Harran Plain (Southeastern Turkey). J. Food Sci. Eng. 2019, 9, 45–51. [Google Scholar] [CrossRef]
  14. Abdel-Aziz, T.M. Toshka project: Optimizing scarce water resources for irrigated agriculture. In Proceedings of the International Forum on Water-Resources, Technologies and Management in the Arab World including the 2nd Forum on Water Desalination and Purification Technology Outlook for the Arab World & Non-Governmental Organization Forum, Sharjah, United Arab Emirates, 8–10 May 2005. [Google Scholar]
  15. Berkoff, J. China: The South–North Water Transfer Project—Is It Justified? Water Policy 2003, 5, 1–28. [Google Scholar] [CrossRef]
  16. Nong, X.; Shao, D.; Zhong, H.; Liang, J. Evaluation of water quality in the South-to-North Water Diversion Project of China using the water quality index (WQI) method. Water Res. 2020, 178, 115781. [Google Scholar] [CrossRef]
  17. Kattel, G.R.; Shang, W.; Wang, Z.; Langford, J. China’s south-to-north water diversion project empowers sustainable water resources system in the north. Sustainability 2019, 11, 3735. [Google Scholar] [CrossRef]
  18. Mohammad, M.S.; Elmastas, N.; Abdullah, H. Temporal change of Urban Land Use: The case of Erbil City. Ecol. Environ. Conserv. Pap. 2021, 27, 48–58. [Google Scholar]
  19. Abdullah, H.; Omar, D.K.; Polat, N.; Bilgili, A.V.; Sharef, S.H. A Comparison between Day and Night Land Surface Temperatures Using Acquired Satellite Thermal Infrared Data in a Winter Wheat Field. Remote Sens. Appl. Soc. Environ. 2020, 19, 100368. [Google Scholar] [CrossRef]
  20. University of Alaska System. Available online: http://alaska.edu/ (accessed on 27 October 2022).
  21. Hamad, T.; Çullu, M.A.; Bilgili, A.V.; Akça, E. Temporal and spatial variation of groundwater level in Barnaty plain districts using GIS and RS data-Case Study: In Erbil City, Iraq. Aust. J. Basic Appl. Sci. 2022, 16, 22–34. [Google Scholar]
  22. Abdullah, A.S.; Esmail, A.O.; Ali, O.O. Mineralogical properties of oak forest soils in Iraqi Kurdistan region. Iraqi J. Agric. Sci. 2019, 50, 1501–1511. [Google Scholar]
  23. Hamad, T.A.; Hakan, O. Determining thermal comfort zones for outdoor recreation planning: A case study of Erbil–Iraq. Turk. J. For. Sci. 2020, 4, 133–145. [Google Scholar] [CrossRef]
  24. Nut, N.; Mihara, M.; Jeong, J.; Ngo, B.; Sigua, G.; Prasad, P.V.; Reyes, M.R. Land use and land cover changes and its impact on soil erosion in stung sangkae catchment of cambodia. Sustainability 2021, 13, 9276. [Google Scholar] [CrossRef]
  25. Al-Ansari, N.; Ali, A.A.; Knutsson, S. Present Conditions and Future Challenges of Water Resources Problems in Iraq. J. Water Resour. Prot. 2014, 6, 1066–1098. [Google Scholar] [CrossRef]
  26. Ministry of Water Resources of Iraq. Hydrological Yearbook of Iraq; Ministry of Water Resources of Iraq: Baghdad, Iraq, 2022. [Google Scholar]
  27. Shekha, Y.A. Evaluation of water quality for Greater Zab River by principal component analysis/factor analysis. Iraqi J. Sci. 2016, 15, 2650–2663. [Google Scholar]
  28. Warner, J. The Toshka mirage in the Egyptian desert–River diversion as political diversion. Environ. Sci. Policy 2013, 30, 102–112. [Google Scholar] [CrossRef]
  29. Yesilnacar, M.I.; Gulluoglu, M.S. Hydrochemical characteristics and the effects of irrigation on groundwater quality in Harran Plain, GAP Project, Turkey. Environ. Geol. 2008, 54, 183–196. [Google Scholar] [CrossRef]
  30. Sallam, O.M.; El Shewy, M.A.; Dawoud, M.A. New Reclamation Mega Projects and Increasing the Pressure on Water System in the Nile Valley and Delta in Egypt. In Proceedings of the WSTA 11th Gulf Water Conference, Muscat, Oman, 20–22 October 2014. [Google Scholar]
  31. Food and Agriculture Organization of the United Nations. Available online: https://www.fao.org/home/en (accessed on 2 February 2008).
  32. El Quosy, D.E.D. Mega agricultural projects in Egypt. In Conventional Water Resources and Agriculture in Egypt; Springer: Cham, Switzerland, 2019; pp. 593–604. [Google Scholar]
  33. Smith, J. Irrigation Capacity of the Haran Plain Project. J. Water Manag. 2020, 45, 100–120. [Google Scholar]
  34. Aly, M.M.; Abd Elhamid, A.M.I.; Abu-Bakr, H.A.-A.; Shalby, A.; Fayad, S.A.K. Integrated Management and Environmental Impact Assessment of Sustainable Groundwater-Dependent Development in Toshka District, Egypt. Water 2023, 15, 2183. [Google Scholar] [CrossRef]
  35. Yetis, A.D.; Kahraman, N.; Yesilnacar, M.I.; Kara, H. Groundwater quality assessment using GIS based on some pollution indicators over the past 10 years (2005–2015): A case study from semi-arid Harran plain, Turkey. Water Air Soil Pollut. 2021, 232, 11. [Google Scholar] [CrossRef]
  36. Al-Muqdadi, S.W.; Mohammed, F.O.; Rudy, A.; Naghshineh, A. Dispute over Water Resource Management–Iraq and Turkey. J. Environ. Prot. 2016, 7, 1096–1103. [Google Scholar] [CrossRef]
  37. Yousuf, M.A.; Rapantova, N.; Younis, J.H. Sustainable Water Management in Iraq (Kurdistan) as a Challenge for Governmental Responsibility. Water 2018, 10, 1651. [Google Scholar] [CrossRef]
  38. Yadav, M.; Pandey, G.; Kumar, P. Environmental Flow Assessment (EFA) of Tawi River Discharge at the Jammu Location Using the Global Environmental Flow Calculator (GEFC). Nat. Environ. Pollut. Technol. 2023, 22, 1063–1071. [Google Scholar] [CrossRef]
  39. Depeweg, H.; Urquieta, E.R. GIS Tools and the Design of Irrigation Canals. Irrig. Drain. 2004, 53, 301–314. [Google Scholar] [CrossRef]
  40. Cherhabil, S.; Debabeche, M. Experimental Study of Sequent Depths Ratio of Hydraulic Jump in Sloped Trapezoidal Channel. In Proceedings of the Hydraulic Structures and Water System Management, Proceedings of the 6th IAHR International Symposium on Hydraulic Structures, Portland, OR, USA, 27–30 June 2016; Crookston, B., Tullis, B., Eds.; pp. 353–358. [Google Scholar] [CrossRef]
Figure 1. The study area delineated on the map of Iraq.
Water 16 00448 g001
Figure 2. Topographic representation of the study area: digital elevation model with contour lines.
Water 16 00448 g002
Figure 3. The following diagram determines a suitable zone.
Water 16 00448 g003
Figure 4. Land use and land cover classification (2006 to 2021).
Water 16 00448 g004
Figure 5. Slope Map derived from digital elevation model (DEM).
Water 16 00448 g005
Figure 6. Rainfall zones and locations of the weather stations.
Water 16 00448 g006
Figure 7. Soil map result.
Water 16 00448 g007
Figure 8. The graph displays the results of groundwater-level zones and levels from 2000 to 2021 in the Baranati Plain.
Water 16 00448 g008
Figure 9. Suitable zones for main channel flow determined using GIS version 10.8 analysis.
Water 16 00448 g009
Figure 10. Location of channels according to suitability.
Water 16 00448 g010
Figure 11. Groundwater level rise from 1982 to 2015 in the Haran Plain. Source (DSI).
Water 16 00448 g011
Table 1. Soil texture data in the designated study area [22].
No.Name of VillageLatitudeLongitudeSoil Texture
1Gazna36.27884943.933636silty loam
2Jazhnikan36.39327743.970823silty loam
3Kawrgosk36.35031943.793304silty loam
4Kawrgosk36.34082243.778883silty clay loam
5Bahrka36.32594744.01697silty clay
6Kawrgosk36.31967243.784284silty clay loam
Table 2. The results of LU and LC.
Class Name20062021Change Detection
Area (km2)Area (%)Area (km2)Area (%)Area (%)
urban10.532.445.5310.27.8Increase
crop38085.0342.7776.78.3Decrease
vegetation8.581.929.126.54.6Increase
water0.2550.10.430.10.055Increase
barren land327.220.944.72.5Decrease
hill zone15.693.59.222.11.4Decrease
Table 3. Slope classes and respective coverage areas according to FAO standards.
NO.Slope ClassesSlope % Area (ha)Area %
1Flat to very gently sloping<232,63473.0
2Gently sloping2–811,24125.2
3Sloping8–157911.8
4Moderately steep15–30280.1
5Mountainous>3000
Table 4. Average yearly rainfall (2001–2021): comparison across Ainkawa, Bastora, and Khabat meteorological stations.
No.NameLatitudeLongitudeAverage Rainfall from 2001 to 2021 (mm)
1Bastora36.34030344.167739444.1
2Khabat36.2786543.69658332.9
3Ankawa36.24704143.995148412.9
Table 5. Soil texture analysis and area distribution.
NO.Soil TextureArea (km2)Area (%)
1silty loam 241.254
2silty clay132.429.6
3silty clay loam 74.416.6
Table 6. The government has conducted groundwater monitoring.
NO.Name Village 20012021Reduction in Groundwater Level by Meter
DepthDateDepthDate
1Gainj gawra29.55September 200149.2September 2021−19.65
2Grda chal25September 200135.4September 2021−10.4
3jadida zab39.41September 200174.8September 2021−35.39
4jazhnikan ababakr21.9September 200140.15September 2021−18.25
5kawer gosk31.85September 200185September 2021−53.15
6qafar43.36September 200155.1September 2021−11.74
7sebirany gawra42.13September 200158September 2021−15.87
Table 7. All details about open channels in the study area.
Shape ChannelType of ChannelType of SlopesCoefficients (n)Water Depth (h) mBank Slope or Slide Slope (m)Bottom Width (b) m Channel Slope m/mFlow Discharge (Q) m3/sFlow Velocity (V) m/sFlow Area (A) m2Top Width (B) mLength of Channel km
Trapezoidal channelsmain channel 100 cm/1 km0.022120.001131.628668.2
50 cm/1 km0.022120.000591.186
25 cm/1 km 0.022120.000256.50.886
10 cm/1 km 0.022120.00014.10.586
sub-channel100 cm/1 km0.021110.001212386
50 cm/1 km0.021110.00051.450.723
25 cm/1 km 0.021110.0002510.5123
10 cm/1 km 0.021110.00010.650.3223
channel angle channel radius (R) m
Circular channelsbranch channel100 cm/1 km0.020.82770.50.0010.480.70.670.817
50 cm/1 km0.020.82770.50.00050.340.50.670.8
25 cm/1 km 0.020.82770.50.000250.240.350.670.8
10 cm/1 km 0.020.82770.50.00010.150.220.670.8
Table 8. All details about gate and name of open channel stream.
No.Gate NameLongitudeLatitudeElevation (m)Stream NameChannel Typem3/sLength km
1Intake Water Gate43.817536.389400ifrazmain channel910.5
2Main Gate43.862836.3571395tobzawasub-channel1.4526.7
3Main Gate43.862836.3571395Gaenj 1sub-channel1.4516.3
4Main Gate43.862836.3571395Gaenj 2sub-channel1.4510
5Main Gate43.862836.3571395shakholanmain channel92.6
6Gate 143.889236.3681393.5sarkawr harkyimain channel910
7Gate 143.889236.3681393.5Gaznamain channel944
8Gate 143.889236.3681393.5shakholan 1sub-channel1.459.2
9Gate 243.927236.3844391.5shakholan 2sub-channel1.4512.4
10Gate 343.893736.2994391Jdeda zabsub-channel1.4511.3
11Gate 443.924236.3446391Barhushtrbranch channel0.353.3
12Gate 543.940336.3132388.7Ashokanbranch channel0.352
13Gate 643.940536.2697385.7Darabanbranch channel0.356.2
14Gate 743.917636.2592384.5Sebiranbranch channel0.356.5
Disclaimer/Publisher’s Note: The statements, opinions and data contained in all publications are solely those of the individual author(s) and contributor(s) and not of MDPI and/or the editor(s). MDPI and/or the editor(s) disclaim responsibility for any injury to people or property resulting from any ideas, methods, instructions or products referred to in the content.