Article

Evaluation of Groundwater Vulnerability of Yishu River Basin Based on DRASTIC-GIS Model

1
No. 8 Institute of Geology and Mineral Resources Exploration of Shandong Province, Rizhao 276826, China
2
College of Earth Science and Engineering, Shandong University of Science and Technology, Qingdao 266590, China
*
Author to whom correspondence should be addressed.
Water 2024, 16(3), 429; https://doi.org/10.3390/w16030429
Submission received: 8 December 2023 / Revised: 22 January 2024 / Accepted: 23 January 2024 / Published: 29 January 2024
(This article belongs to the Topic Human Impact on Groundwater Environment)

Abstract

:
The evaluation of vulnerability is a crucial aspect in the sustainable development, utilization, and preservation of groundwater resources. This study utilizes a comprehensive approach, integrating systematic analysis of hydrogeological conditions and the utilization of observed and collected data. The evaluation of groundwater vulnerability in the Yishu River Basin (YRB) was conducted by employing the DRASTIC model, along with the zone overlay function of GIS software. Seven evaluation indicators were considered in this assessment. The findings demonstrate that the groundwater vulnerability in the YRB can be categorized into five divisions: excellent, good, medium, poor, and very poor, accounting for 14.5%, 42.3%, 27.9%, 14.0%, and 1.3% respectively. The areas with low vulnerability are predominantly located in the eastern part of the study area, covering the largest proportion of the total area. Conversely, areas with high vulnerability are found alongside both banks of the Shu River, forming narrow strips. Although these areas have smaller overall coverage, they contain dispersed water sources that require careful attention. These research findings provide valuable scientific insights and serve as a reference for urban planning, land use management, and groundwater resource protection in the YRB. The formulation and adoption of targeted protection measures in accordance with different groundwater vulnerability zoning, the formulation of scientific groundwater resource development and utilization programs, and execution of land resource planning are of great significance from the perspective of groundwater resource protection.

1. Introduction

Groundwater is a precious and widely available resource that serves as a vital water source for various purposes, including industrial production, human consumption, socio-economic development, and ecological preservation [1,2,3]. In arid and semi-arid regions, it often stands as the sole water source. Currently, global concern centers around changes in both the quantity and quality of groundwater [4,5,6]. On one hand, industrial activities contribute to groundwater pollution through the discharge of wastewater, exhaust gases, and solid waste [1,7]. Similarly, agricultural practices, such as excessive fertilizer application and pesticide residue from spraying, further deteriorate groundwater quality [8,9]. On the other hand, the escalating demands for agricultural and irrigation water, burgeoning population, and excessive groundwater extraction due to urban and industrial expansion have resulted in detrimental effects on the geological and ecological landscape [10,11]. Impacts include land subsidence, shrinking lakes and wetlands, and the degradation of vegetation, ultimately posing significant threats to the environment.
Groundwater has many advantages over surface water, yet it possesses characteristics of slow renewable speed and poor regulation ability [12]. Once polluted, treatment and regulation of groundwater pose significant challenges. Heavy metals are cumulative and persistent, and once they enter the groundwater body they will remain for a long time and gradually accumulate, leading to groundwater pollution, and contaminated groundwater poses a serious threat to the ecological environment and human health [13]. Firstly, contaminated groundwater affects the source of drinking water and directly jeopardizes human health. Secondly, heavy metals further diffuse into the water system through the interaction between groundwater and surface water, endangering aquatic organisms and ecosystems. Finally, contaminated groundwater in agricultural irrigation and industrial water use can also lead to the contamination of agricultural and industrial products, affecting food safety and industrial development. The results of single-parameter sensitivity analysis and map-removal sensitivity analysis of groundwater vulnerability indicators in Shanghai city by combining the hydrogeological characteristics of the plains river network illustrate the reasonableness of the application of the DRAHC model in the plains river network area [14]. Tang Xuefang et al. evaluated the antifouling performance of groundwater in Chengdu city, and the results showed that the higher zones were mainly distributed in the northwestern terrace area and its vicinity, the medium antifouling performance zones were mainly distributed in the secondary terraces, and the lower antifouling performance zones were mainly distributed along the rivers and their branch channels of diffuse flats, the primary terraces and other zones in the form of a strip [15]. Due to the complexity of groundwater systems, there are considerable difficulties in managing contaminated groundwater [16,17]. On the one hand, governance projects incur huge costs; on the other hand, their effects are slow to take root. Compounded by various pathways of groundwater supply, runoff, and discharge, it becomes a problematic undertaking in a complex geological environment [18]. Furthermore, each aquifer is hydraulic, making it challenging to delineate and limit the pollution range once groundwater is contaminated. To effectively prevent and control groundwater pollution, it is crucial to strengthen the protection and management of groundwater, as well as to evaluate its vulnerability [18,19,20,21]. Reasonable use of groundwater is imperative.
The groundwater’s ability to withstand external pollution under various hydrogeological conditions, without considering the influence of human activities and pollution sources, and solely focusing on internal hydrogeological factors, plays a crucial role in evaluating its vulnerability [22,23,24]. The DRASTIC model has its limitations in assigning weights and ratios to different thematic layers and their subcategories. Different researchers have used other techniques to address these limitations, such as calculating recharge using the SWAT model and modifying the weights and ratios of the layers and their subclasses using Analytical Hierarchy Process (AHP) and Frequency Ratio (FR) techniques [13]. There are many methods for evaluating the vulnerability of groundwater, such as the iterative index method, fuzzy mathematical comprehensive evaluation method, and numerical simulation method. Currently, the most commonly utilized approach to assess groundwater pollution prevention performance, both nationally and internationally, is the DRASTIC model [22,23,25,26]. The GOD model, AVI model, ISIS model, etc. [27], use the sum of the scores of each parameter. The GOD method is only applicable to areas with large differences in vulnerability and has a large error when used in areas with small changes in vulnerability. The DRASTIC model, Sintacs model, Siga model, Epik model, etc., of the counting system models use the weight-scoring method [28], which is mostly applied to the shallow groundwater vulnerability assessment. The main evaluation models for porous media aquifers are DRASTIC, AVI, Siga, and Epik models. Among the DRASTIC, AVI, Sintacs, ISIS, and Galdit methods [28], the Galdit model considers seawater intrusion in coastal aquifers and has been widely used to assess coastal aquifer vulnerability [29,30]. The DRASTIC model has been extensively applied in groundwater vulnerability assessments in the United States and the European Union. The notable advantage of this model lies in its simplicity, ease of implementation, and ability to quantitatively analyze hydrogeological factors affecting pollutant transport [13]. In view of the fact that there are few studies on the YRB [31], in order to determine the regional groundwater environment situation, in this work, the DRASTIC evaluation model was adopted, the groundwater vulnerability evaluation index system of the YRB was constructed, and a specific study was conducted, which provides a scientific example for other regions to carry out the evaluation of groundwater vulnerability. In addition, Geographic Information System (GIS) technology facilitates a wide range of functions such as data input, storage, management, retrieval, processing, and comprehensive analysis of geospatial data and information. Accordingly, it has been widely applied across various domains. In the context of aquifer vulnerability evaluation, the vector or grid units in GIS graphics can correspond to the evaluation units employed in evaluation methods [26,32]. Furthermore, the classification and overlay analysis process of GIS software aligns precisely with the factor scoring process and weighted sum analysis of diverse factors in evaluating groundwater vulnerability [33,34]. The utilization of GIS technology’s attribute database and spatial overlay analysis for evaluating the vulnerability of aquifers proves to be both straightforward and prevalent.
Groundwater serves as the primary water supply for industrial and agricultural activities, urban development, and domestic consumption in the Yishu River Basin (YRB). Given its crucial role in the region’s sustainable economic development, it is indispensable [3]. To date, many scholars have conducted a large amount of research on the characteristics and quality of groundwater pollution in the YRB, but there is a lack of research on the vulnerability of groundwater in the YRB, and there is no relevant model to simulate the vulnerability of groundwater. Hence, this study employed the DRASTIC model in conjunction with the GIS to assess the groundwater’s vulnerability. The purpose of this study is to determine the vulnerability of groundwater in the area by collecting and organizing hydrogeological data and modeling to assess the groundwater fouling resistance. The findings will furnish essential foundational information for the rational protection of groundwater resources. Furthermore, the results will aid environmental management departments in formulating plans for the safeguarding of groundwater, as well as in industrial and agricultural planning, environmental monitoring, and other related endeavors. Ultimately, this research will serve as a theoretical basis for the prevention and control of groundwater pollution.

2. Materials and Methods
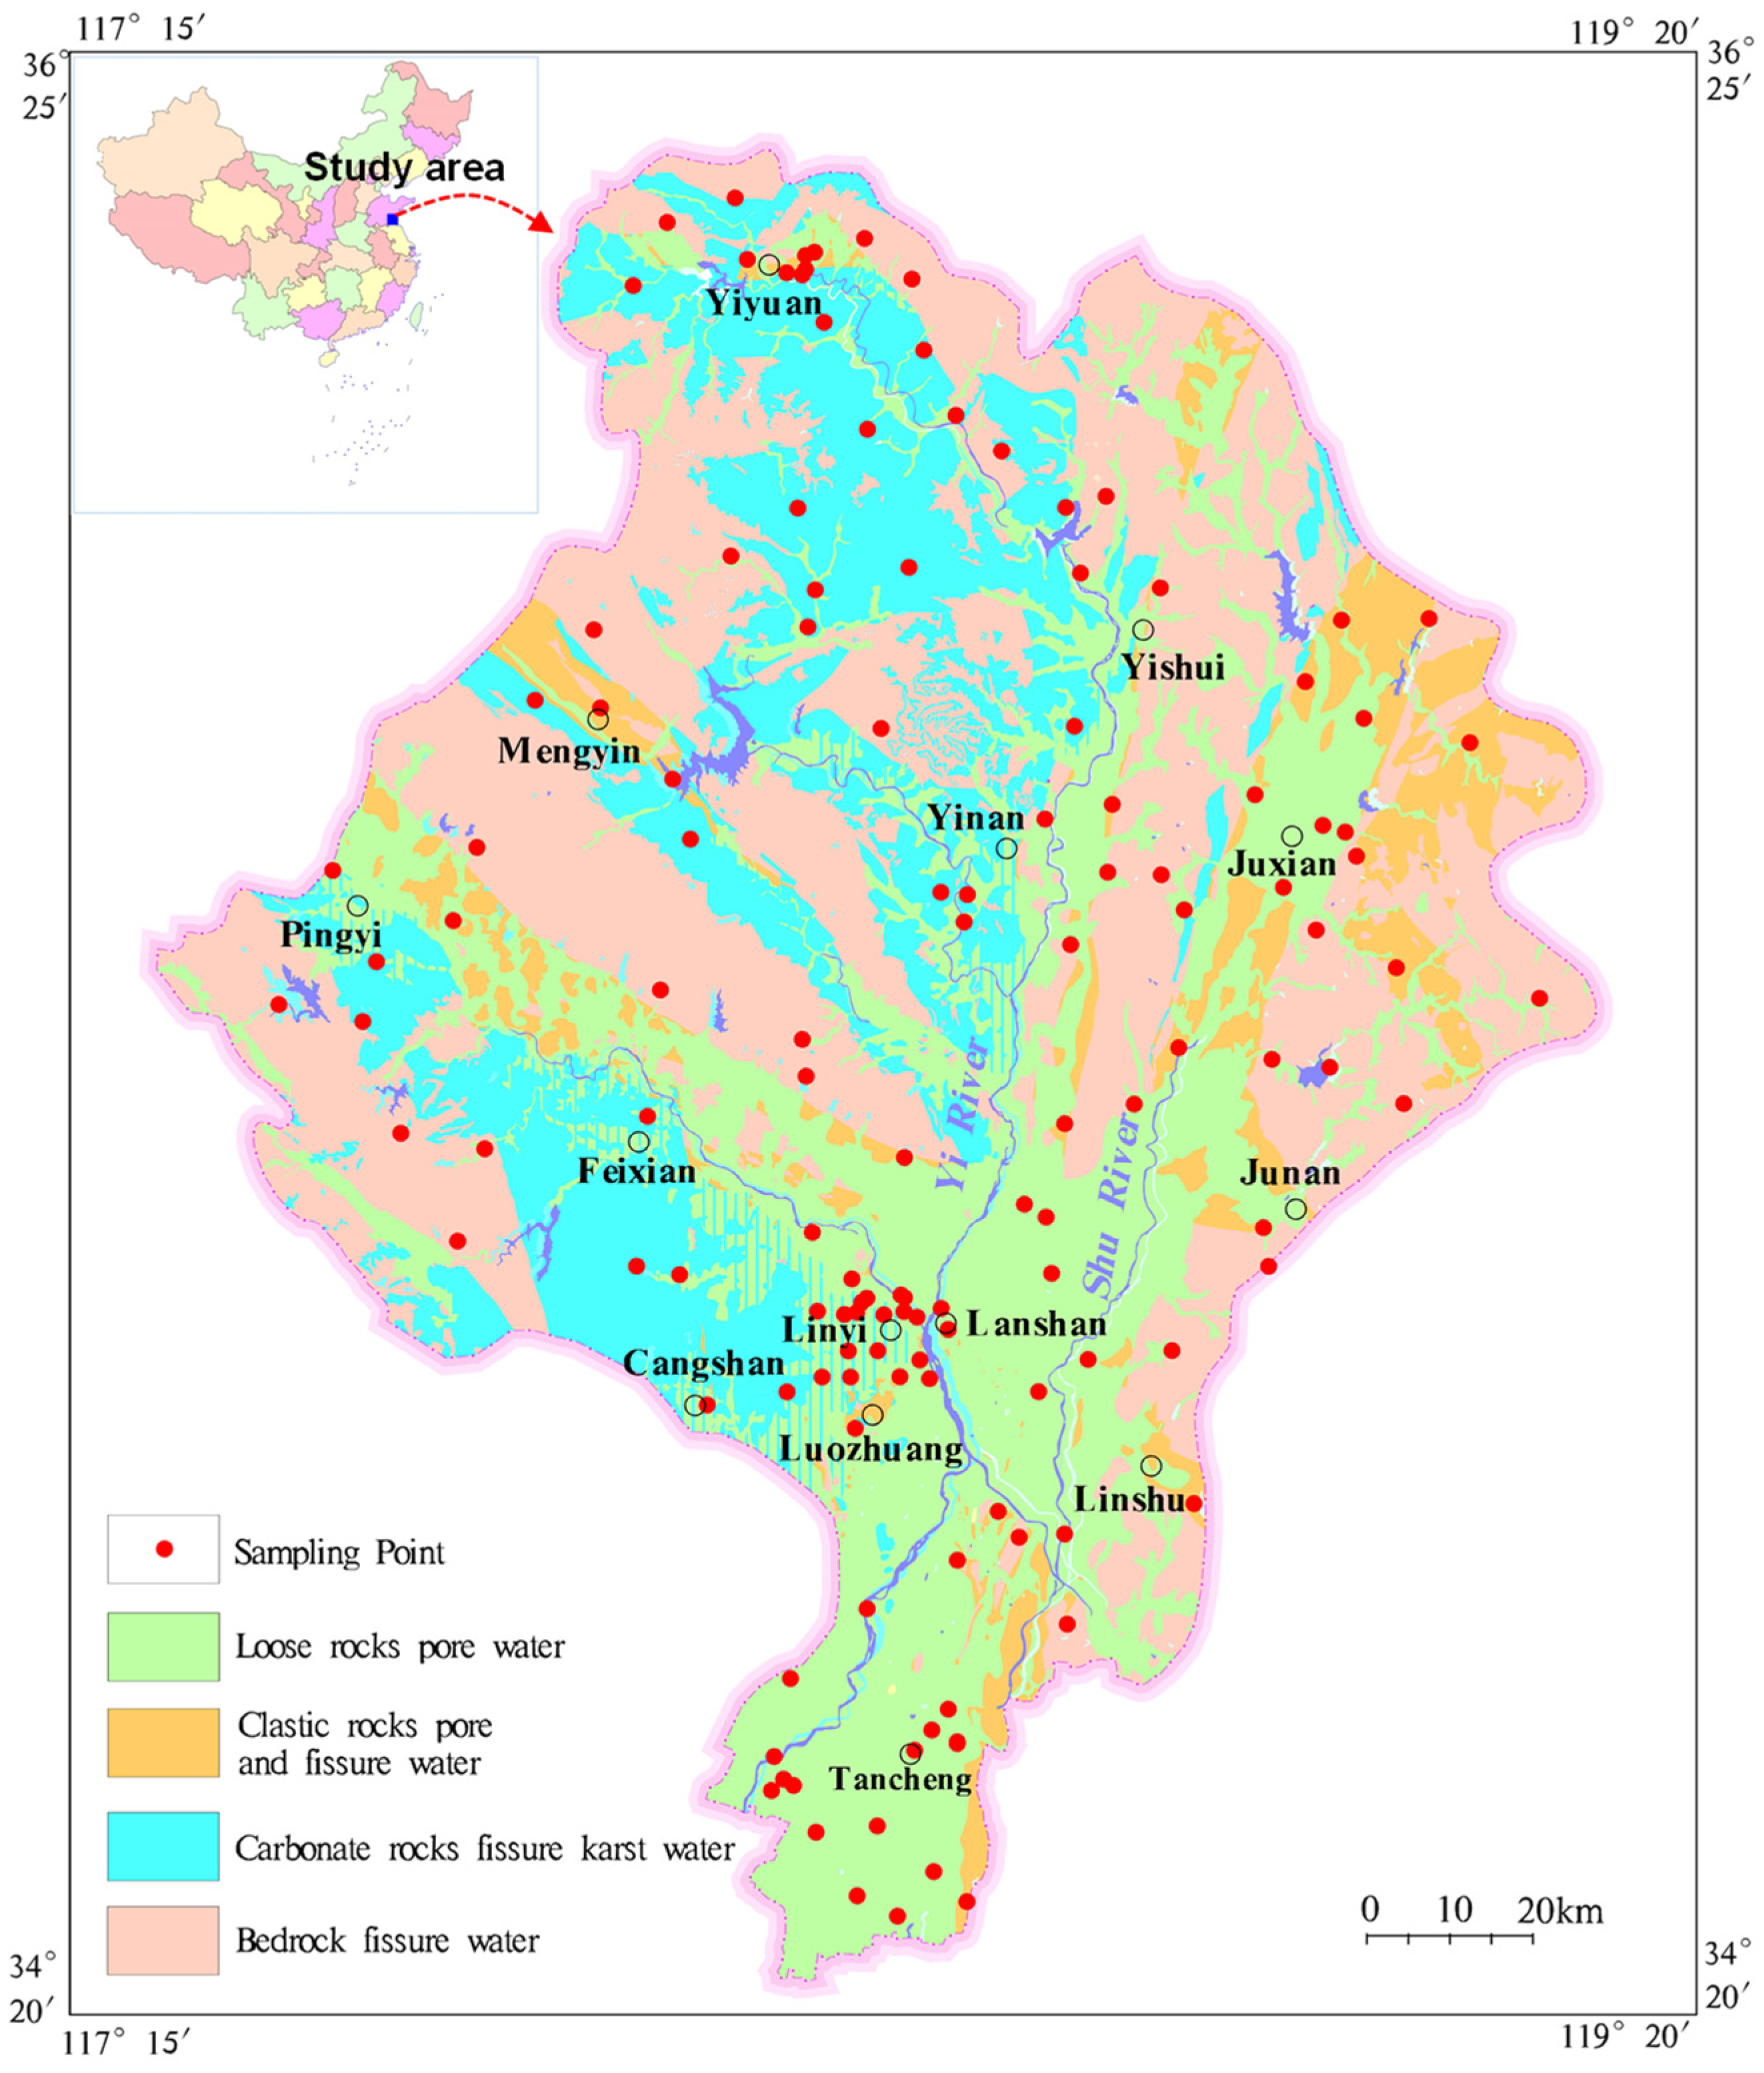
2.1. Study Area

The YRB is situated in the central and southern parts of Shandong Province, covering a vast area of 17,911 km2 (Figure 1). The region experiences a typical northern warm temperate monsoon climate. It exhibits four distinct seasons, ample sunlight, and a mild climate. Precipitation in the study area exhibits significant year-to-year variability, leading to an uneven annual distribution. Approximately 75% of the annual precipitation occurs between June and September. The yearly average precipitation is 824.8 mm. The distribution of the surface water system in the study area and its vicinity is influenced by four primary faults within the Yishu fault zone. The rivers’ courses generally align with the main fault orientation, flowing from north to south. Key rivers in the area include the Yi River, Shu River, Dongwen River, Meng River, and Beng River. The Yi River and Shu River (Figure 1) and their extensive alluvial plain, running from north to south, comprise the crucial runoff formations stemming from alluvial and diluvial accumulations. As such, the region boasts abundant groundwater resources. The study collected data from 132 sampling sites in the YRB during the dry season in May 2017 and during the rich season in September 2017, for a total of 264 datasets in both the dry and wet seasons (Figure 1).
The topography of the YRB is high in the north and low in the south, and the west side belongs to the middle and low hilly area in the south of Shandong. Geomorphology is mainly divided into erosion landforms, erosion denudation landforms, denudation landforms, denudation accumulation landforms, and accumulation landforms, as shown in Figure 2. The erosion landforms, located in the Yishan and Mengshan mountains on the west side of the YRB, have active tectonic movement and strong water erosion. The erosion denudation landforms are distributed in the middle and low mountainous areas, such as Menglianggu uplift and Mamuchi Dome fault in the northwest of the YRB, and in the northern mountainous area of Junan. The accumulation landforms are distributed in the plains on both sides of the Yi River and the Shu River and in the Lintancang plain area.
Based on the stratigraphy, structure, and groundwater occurrence conditions of the YRB, as well as the physical properties of water in rocks, groundwater can be classified into four categories: unconsolidated rock pore water, clastic rock pore and fissure water, carbonate rock fissure karst water, and bedrock fissure water (Figure 1). Unconsolidated rock pore water is primarily found in the first terrace of rivers, southern alluvial plains, residual hills, basin edges, peripheries of alluvial layers, and mountain valley areas. The aquifer is composed of medium to fine sand, coarse sand gravel, sandy clay mixed with ginger stone, and thin layers of fine sand. Clastic rock pore and fissure water is mainly distributed in the central graben of the study area. The aquifer consists of Cretaceous Qingshan Group tuffaceous sandstone, Dasheng Group conglomerate, and sandstone. Carbonate rock fissure karst water exists as both groundwater and confined water in the cracks and karst of Cambrian and Ordovician limestone, as well as limestone interbedded with shale and sandstone. Bedrock fissure water primarily occurs in weathering fissures and structural fracture zones of the Middle Archean Yishui Group, the New Archean Mount Taishan Group metamorphic rocks, magmatic rocks of various stages, and the Cretaceous Qingshan Group extrusive rocks.

2.2. Data Collection

There are 24 groundwater sources in the YRB, mainly located in urban areas, including Yiyuan urban area, Yishui urban area, Ju County urban area, Mengyin urban area, Tancheng urban area, Yinan urban area, and Pingyi urban area. According to the hydrogeological subdivision, there are 4 water sources located in the southeast of the Laiwu fault basin groundwater resources section, 3 water sources located in the Yishui fault valley groundwater resources section, 3 water sources located in the Ju County hilly valley groundwater resources section, 2 water sources located in the Yinan hilly valley groundwater resources section, 4 water sources located in the Mengyin-Tambu fault valley groundwater resources section, 5 water sources located in the Pingyi-Feixian hilly valley groundwater resources section, and 3 water sources located in the middle reaches of the YRB hilly valley groundwater resources section. There are two types of water sources, namely karst fissure water sources and pore water sources, of which there are 17 pore water sources and 7 karst water sources; there are 4 small-sized water sources, 19 medium-sized water sources, and 1 large-sized water source according to the scale of water sources.

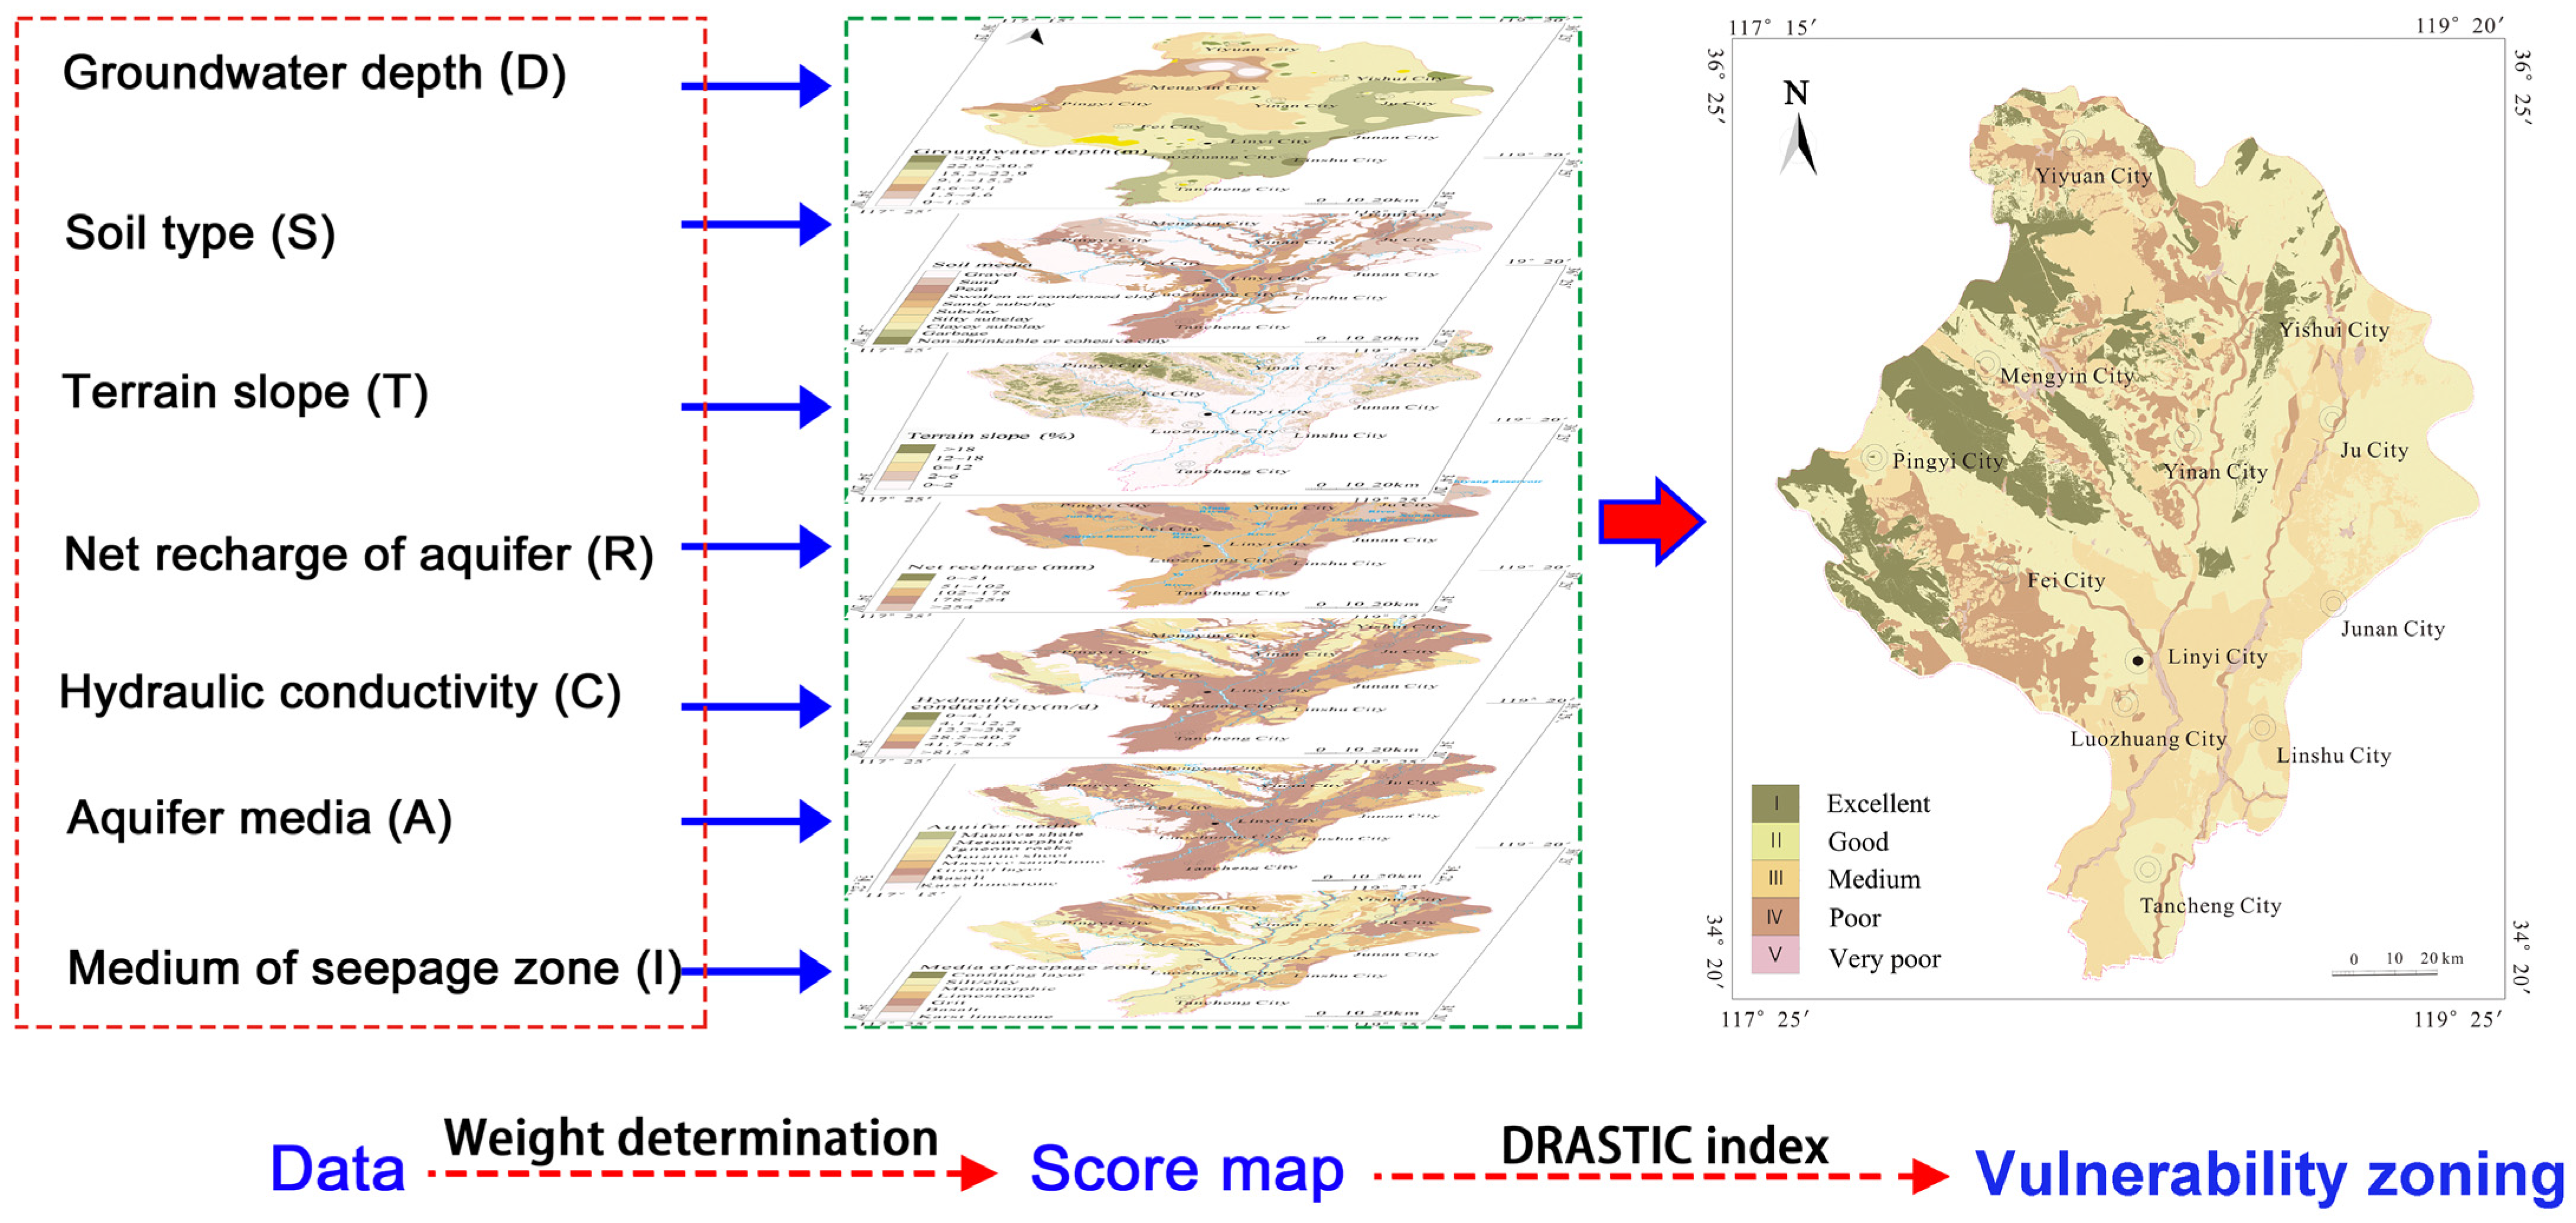
2.3. Thematic Layer Preparation

This study examined the vulnerability of groundwater in the YRB using the DRASTIC assessment method (Figure 3). Firstly, based on the regional hydrogeological data, the indicators were subdivided to evaluate the vulnerability; subsequently, the ArcGIS 10.2 software was utilized to superimpose the regions according to the weighting values of the indicators, the raw data input was carried out using vector data (points, lines, and surfaces), and the input vector data were transformed into raster data and spatially analyzed accordingly through the GIS software so that the relationships between each data layer and the spatial distribution status of each data layer could be quantified and understood. The input vector data were transformed into raster data using GIS software and analyzed accordingly so as to quantitatively grasp the relationship between each data layer and the spatial distribution of each data layer. Taking the GIS as a working platform, the raw data of groundwater vulnerability energy influencing factors were scanned, aligned, edited with vectorization, converted into the appropriate format, and topologically formed into zones through the process of map scanning, and vectorization editing. Finally, the spatial layers of the influencing factors were stored in the format of vector data. After the completion of vector data input, all the vector data formats were converted to raster data format with the vector raster conversion tool, and then the layers were divided into standard grids. The size of the standard grids was decided after considering the spatial distribution of each item, the characteristics of the changes, and the accuracy of the collected data so as to delineate the vulnerability zones in the YRB. The DRASTIC model, a well-established framework for assessing regional groundwater pollution potential, quantifies the impact of each assessment index on groundwater pollution prevention through scoring values [33,34]. Each evaluation index is classified into grades, and its score is determined based on its influence on groundwater pollution. The fundamental concept underlying the DRASTIC model asserts that the pollution prevention performance of an aquifer is primarily governed by its essential hydrogeological characteristics [35,36,37]. Consequently, hydrogeological parameters pertaining to pollution prevention performance were comprehensively evaluated to assess the aquifer’s ability to prevent pollution.
The DRASTIC model comprises seven primary evaluation indexes that influence the vulnerability of groundwater. These indexes are the groundwater depth (D), net recharge of aquifers (R), aquifer media (A), soil type (S), topography (T), medium of seepage zone (I), and hydraulic conductivity of aquifer (C). Each of these indicators represents a specific hydrogeological condition that contributes to the overall vulnerability of groundwater [33,34,36].
The groundwater depth (D) plays a crucial role in determining the vulnerability of pollutants reaching the aquifer. In general, a deeper underground water depth is associated with lower vulnerability. Conversely, a shallower depth indicates high vulnerability. Net recharge of aquifers (R) refers to the amount of water that percolates from the surface to groundwater. A higher net recharge leads to increased transport of polluting substances in the infiltrating water, thereby reducing the groundwater’s vulnerability. The aquifer medium (A) is an intrinsic property of the aquifer and influences its vulnerability. Fine particles in the medium result in more primary cracks and pores, enhancing the barrier, adsorption, and degradation of pollutants. Thus, a smaller particle size indicates lower vulnerability ability, while a larger particle size implies weaker performance. Soil medium (S) refers to the upper part of the vadose zone where biological activities occur. Clay properties and particle size in the soil significantly impact vulnerability. Soils with smaller clay particles and minimal expansion and shrinkage demonstrate stronger groundwater pollution prevention performance, while soils with larger particles and higher variability exhibit weaker performance. Topographic slope (T) refers to a surface slope or its changes. A larger topographic slope results in stronger surface runoff and less groundwater infiltration recharge, indirectly affecting regional net recharge. Regions with steep terrain slopes tend to exhibit stronger groundwater pollution prevention performance, while those with gentler slopes show weaker performance. The medium of the seepage zone (I) is an intrinsic characteristic that primarily reflects the particle thickness and fracture development degree. Coarse particles and well-developed cracks indicate higher vulnerability, while finer particles correspond to stronger performance. When evaluating a confined aquifer, the impact of the vadose zone is expanded to include both the vadose zone and any saturated zones which overlie the aquifer. In the case of a confined aquifer, the significantly restrictive zone above the aquifer which forms the confining layer is used as the type of media which has the most significant impact [38]. According to the range of scores given by the DRASTIC model for each medium, the assigned value for a pressurized aquifer is always 1. Hydraulic conductivity (C) relates to the aquifer medium’s hydraulic transmission capacity. A lower hydraulic conductivity coefficient indicates a lower vulnerability, whereas a higher coefficient suggests weaker performance. The assessment indicators in the DRASTIC pollution susceptibility scoring system were determined as shown in Table 1.

2.4. Evaluation Index Weight Determination

The seven index factors in the DRASTIC model exhibit different degrees of influence on the prevention of groundwater pollution. To determine the relative importance of each factor in evaluating groundwater pollution prevention performance, corresponding weights were assigned to each score within a defined range [39]. These weights range from 1 to 5, with higher weights indicating a greater impact of the index factor on the evaluation of groundwater pollution prevention performance. Table 2 presents the evaluation index weights for groundwater vulnerability.

2.5. Calculation of DRASTIC Index

The assessment of the vulnerability of groundwater in a given area is determined by the linear weighted sum of each index factor’s scores. This approach enables the evaluation of the relative strength of groundwater vulnerability based on its scores [40,41]. The calculation of the DRASTIC Index (DI) is achieved through Equation (1):
DI = Dw × Dr + Rw × Rr + Aw × Ar + Sw × Sr + Tw × Tr + Iw × Ir + Cw × Cr
The formula incorporates two variables: ‘w’ and ‘r’, where ‘w’ represents the weight assigned to each evaluation indicator, while ‘r’ represents the corresponding score value. Seven evaluation indicators (‘D’, ‘R’, ‘A’, ‘S’, ‘T’, ‘I’, and ‘C’) are denoted to assess the groundwater quality. The DRASTIC Index (DI) is determined as the weighted sum of the scores attributed to each evaluation indicator. A lower DI value indicates a lower level of vulnerability in groundwater. Consequently, the likelihood of pollution decreases, while, conversely, higher vulnerability is associated with higher DI values [42,43].

3. Results and Discussion

3.1. Single Evaluation of Vulnerability

3.1.1. Groundwater Depth

A total of 264 datasets were collected from the YRB during the dry and abundant water periods in May and September 2017, respectively. The depth to the water table has a minimum value of 0.5 m and a maximum value of 25 m. Seasonal variations in groundwater levels were explained by calculating average groundwater level values at each point using data from both periods. Using ArcGIS interpolation, a contour map of groundwater depth was generated. Furthermore, a subregion map depicting the groundwater depth in the YRB was created based on the evaluation index’s subregion values (Table 1), as illustrated in Figure 4. Notably, the YRB’s northeast and southwest regions exhibited groundwater depth scores below 3, whereas the midwest had comparatively higher scores. Overall, there was a decreasing trend in the scores from northwest to southeast. This suggests that the vulnerability of groundwater in the YRB improved gradually from northwest to southeast, as indicated by the groundwater depth.

3.1.2. Net Recharge of Aquifers

In this study, the average annual rainfall of the YRB was multiplied by the corresponding infiltration coefficient to derive the index value. Subsequently, the index value was scored based on the rating table presented in Table 1, and a regional scoring map was generated. The results indicate that the aquifer net recharge scores in the study area predominantly range from 3 to 6, with higher scores of 8 observed in the eastern Juxian, southwestern Mengyin, and Yiyuan regions. Figure 5 depicts the score map illustrating the net recharge of aquifers in the YRB.

3.1.3. Types of Aquifer Media

Based on the hydrogeological map (Figure 1) and the topographic and geomorphological map (Figure 2) of the YRB, ArcGIS was utilized for projection and grading purposes. The topography of the basin showcases a gradual decrease in elevation from the north to the south. Various landform types, such as erosion, denudation, and accumulation, can be observed. The gravel layer accounts for about 50% of the entire study area and is mainly distributed along the river, being most widely distributed in Tancheng City and Linyi City. The distribution of karst limestone accounts for about 15% of the total, mainly in Yiyuan City and Fei City, with a small amount of distribution in the upper reaches of the river. Massive shale accounts for about 5% of the total and is mostly found in the cities of Jounan and Linshu. Metamorphic/igneous rocks, Moraine sheet, and other water-bearing media account for about 30% of the total and are interspersed with the gravel layer. The YRB exhibits diverse groundwater sources, encompassing pore water found in unconsolidated rock, fractured water in clastic rock, fractured karst water in carbonate rock, and fractured water in bedrock. The larger the particle size of the aquifer medium or the more fissured river karst pipes, the greater the permeability and the less capable the aquifer medium is of weakening pollutants. Less permeable cohesive soils have a barrier to pollutant infiltration while possibly causing range spreading on the face of the contaminated area due to the development of surface runoff. Figure 6 illustrates the scoring map that portrays the distribution of aquifer media across the YRB.

3.1.4. Soil Type

A geological map and soil type zoning map of the YRB was utilized to analyze and score the soil types within the study area. These maps were projected utilizing ArcGIS 10.2 software, as illustrated in Figure 7. The thin layer or none and gravel account for about 70% of the total and are mainly distributed in the northern part of the cities of Mengyin, Yishui, Yiyuan, and Fei. Peat, swollen or condensed clay, sandy subclay, and other soil media accounted for about 30% of the total, mainly distributed in the southern cities of Linyi, Tancheng, and Linshu.

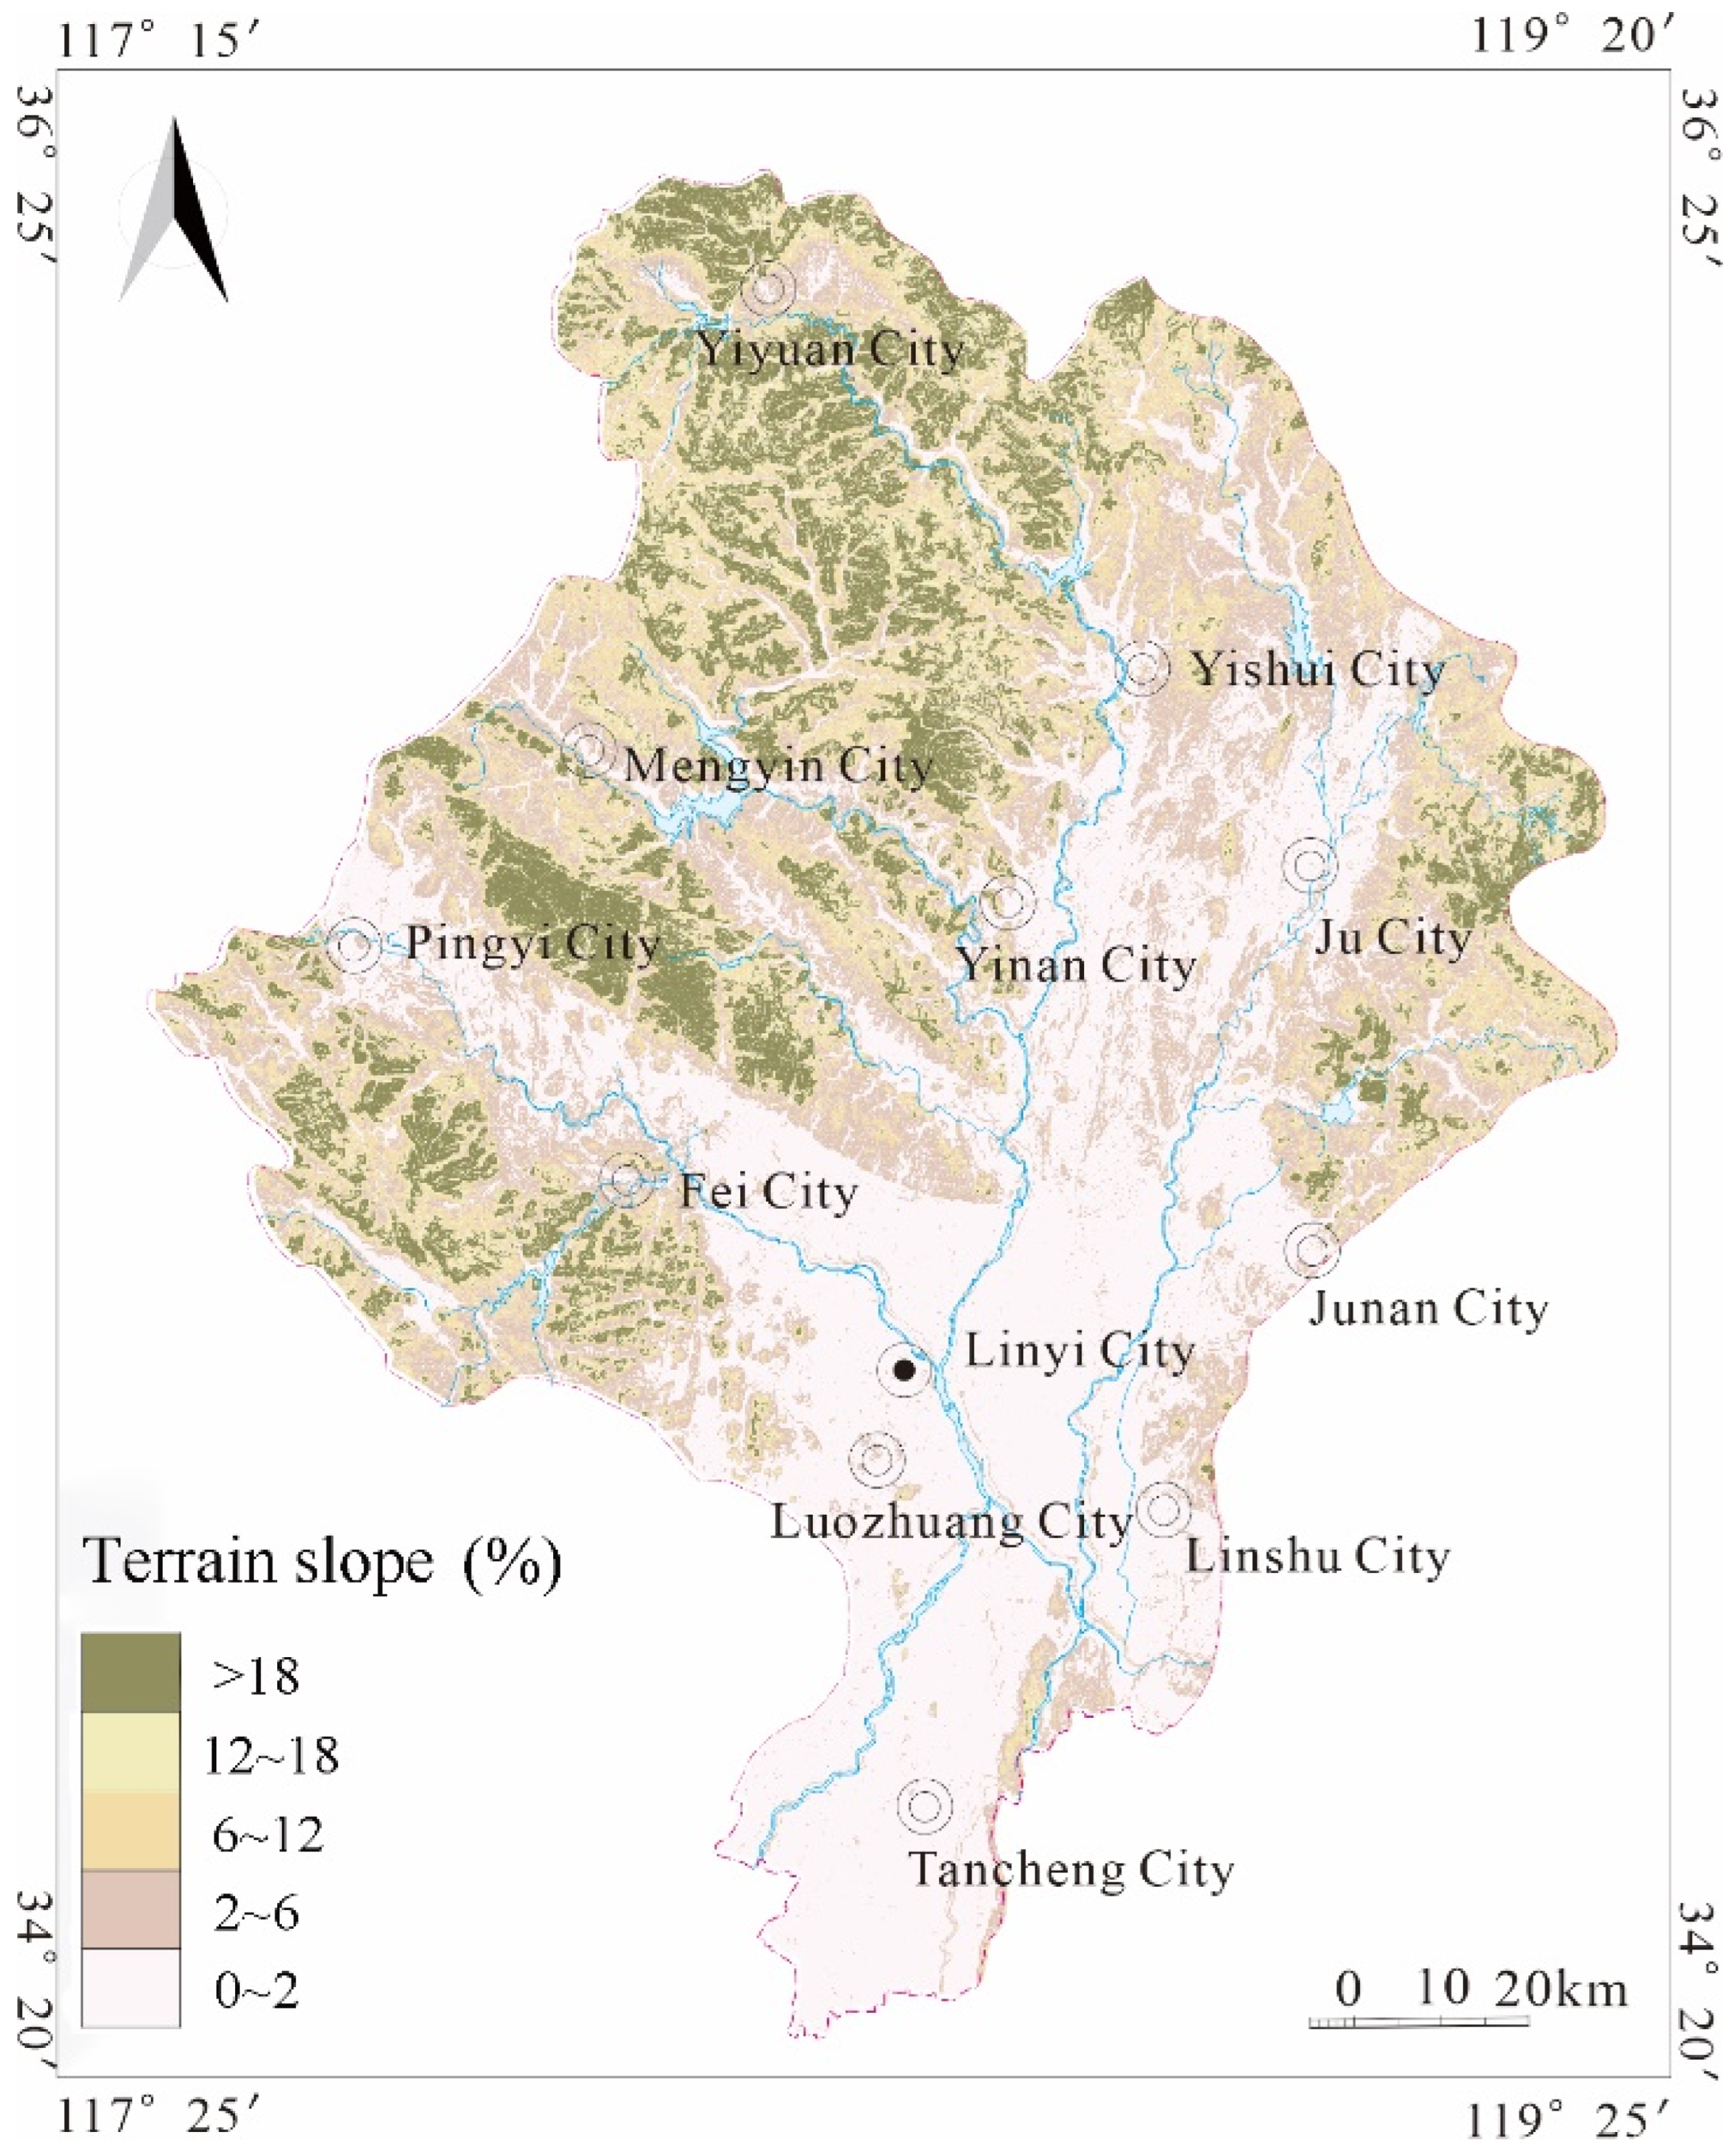
3.1.5. Topographic Slope

Initially, the digital elevation model (DEM) data for the YRB were downloaded, followed by the use of ArcGIS software’s slope extraction function to obtain the topographic slope of the study area. This information was then utilized to divide the region into distinct topographic slope divisions. Consequently, a scoring map for the topography of the YRB was produced, as depicted in Figure 8.

3.1.6. Medium in the Seepage Area

The study area was classified using the geological map and soil type distribution map prepared by the Hydrology Bureau of Shandong Province. ArcGIS software was subsequently employed for projection and scoring, as demonstrated in Figure 9.

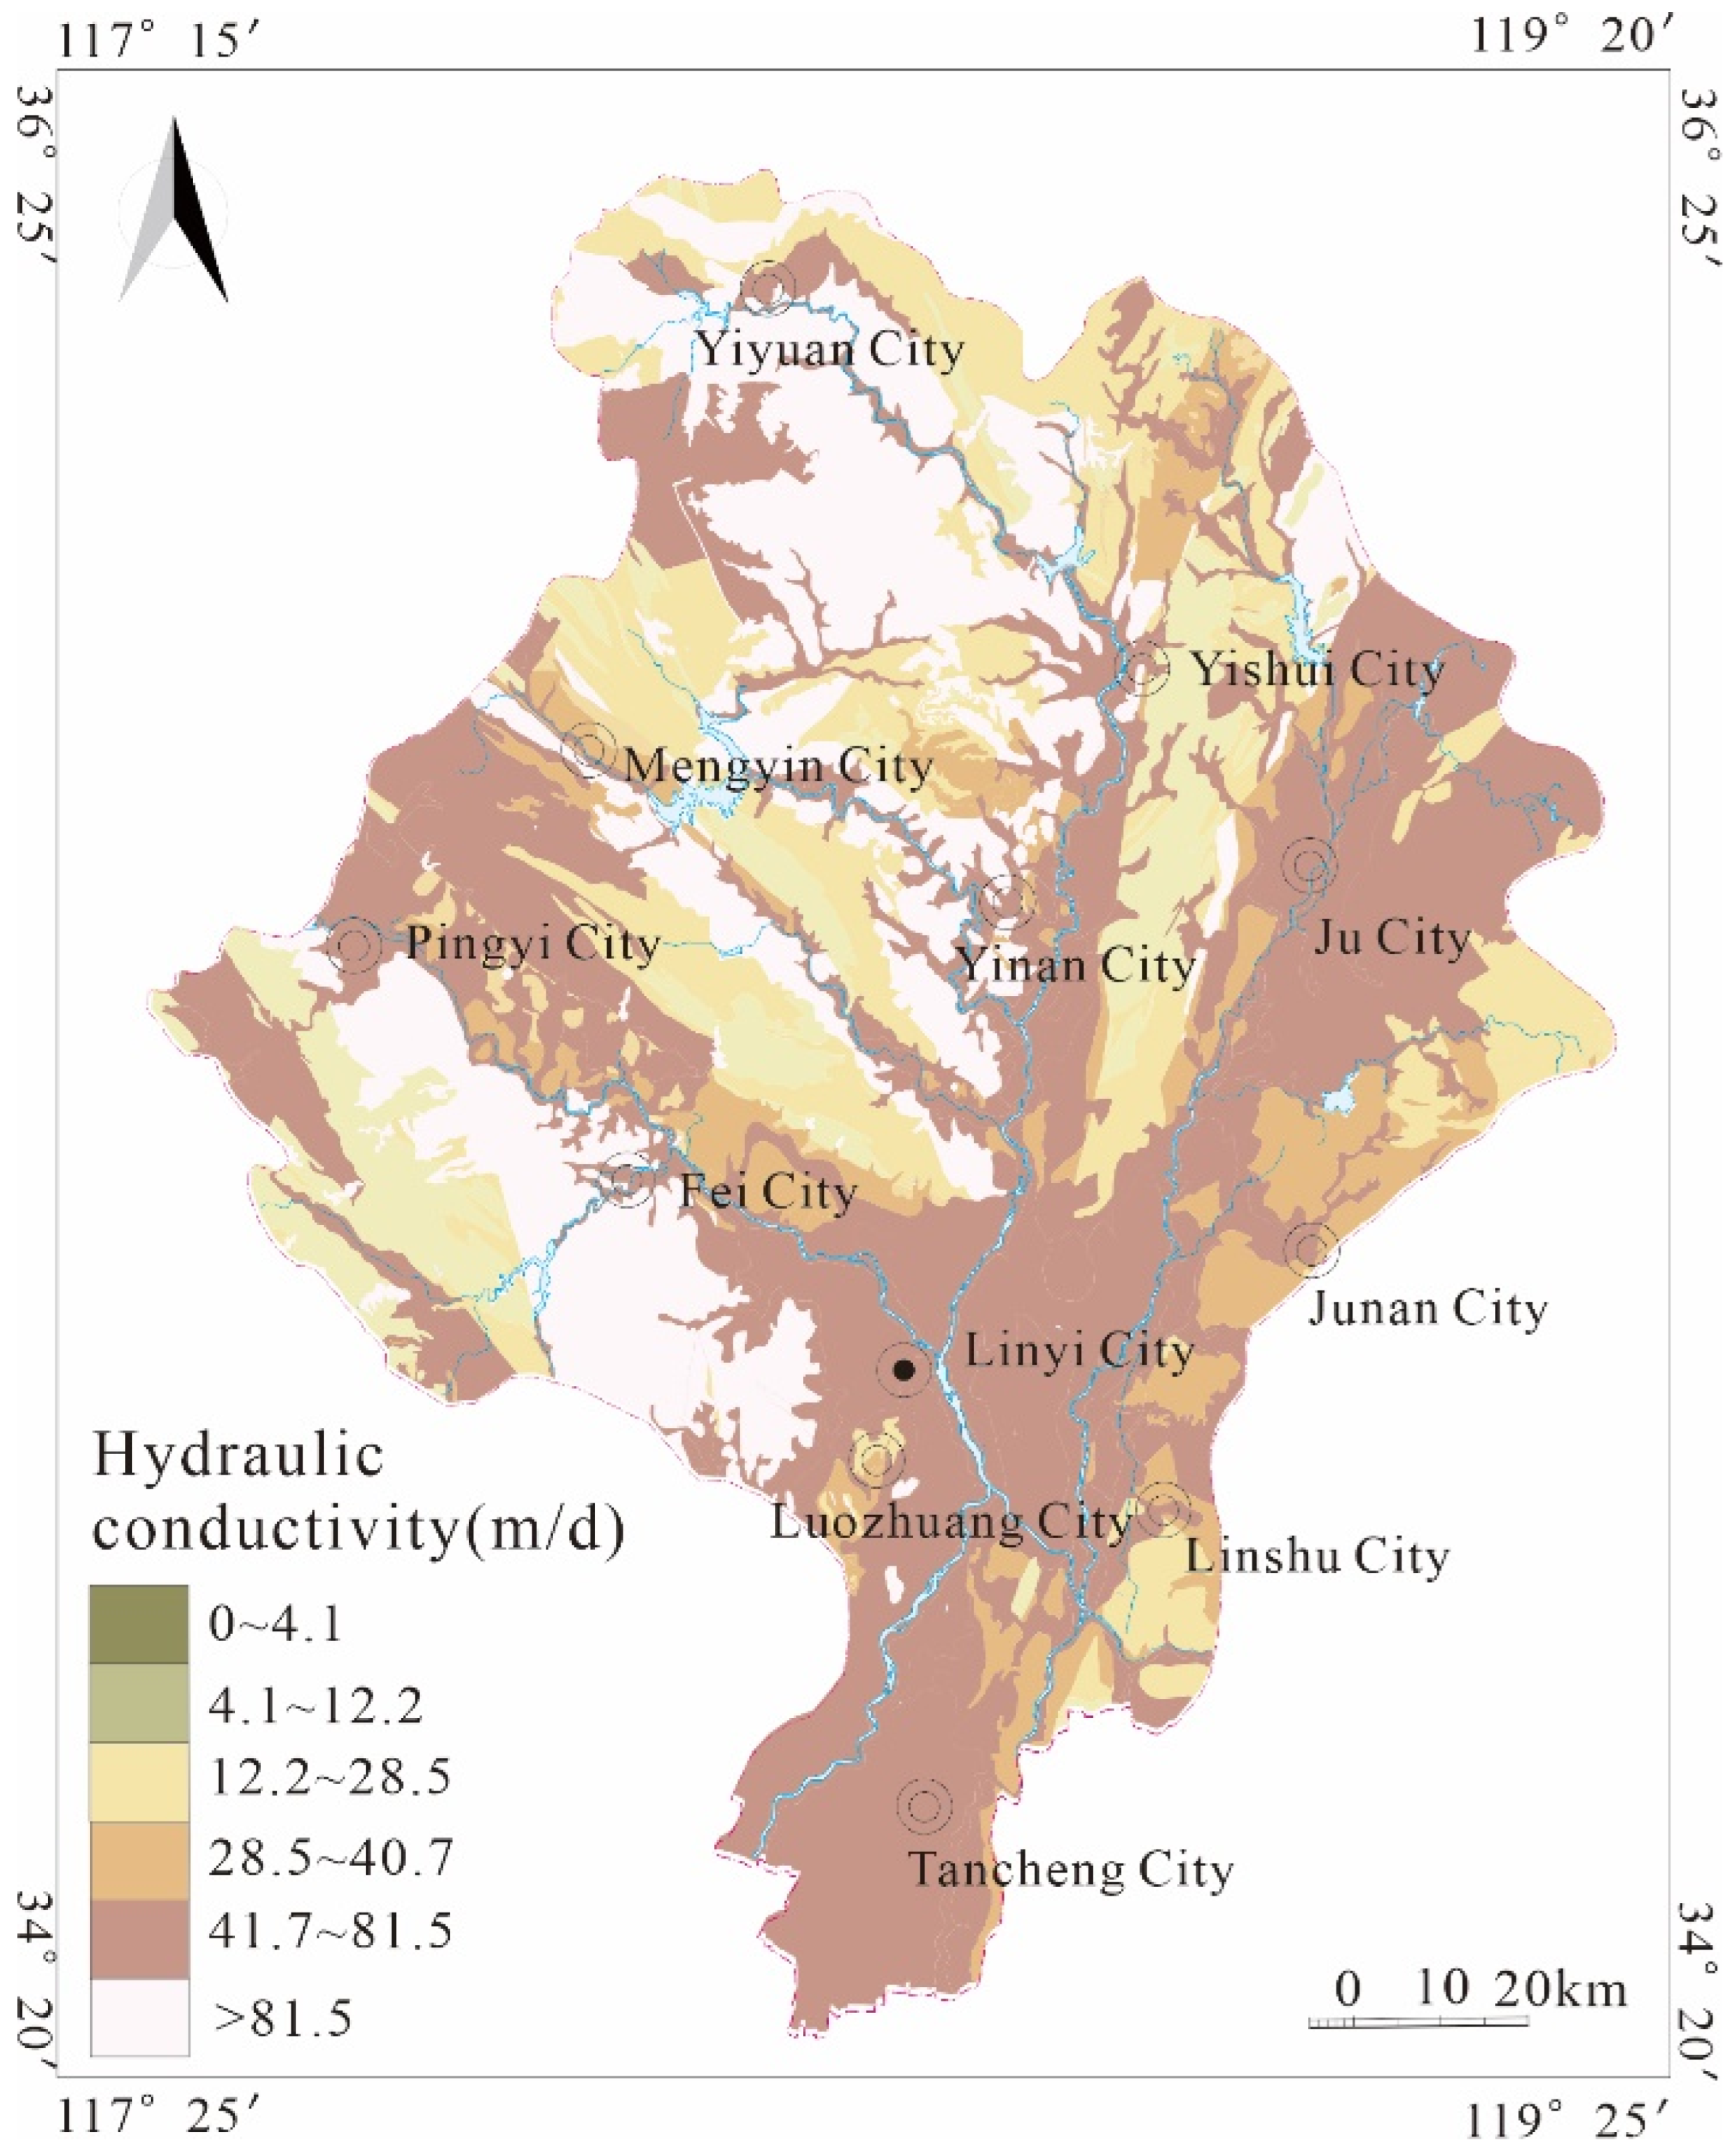
3.1.7. Hydraulic Conductivity of Aquifer

Based on the geological map and hydrogeological map of the YRB, the study area’s aquifer medium lithology map was divided, resulting in the aquifer medium lithology map specific to the YRB. The water conservancy conductivity coefficient was assigned based on the aquifer lithology, leading to the creation of a scoring map pertaining to the hydraulic conductivity of the YRB, as illustrated in Figure 10.

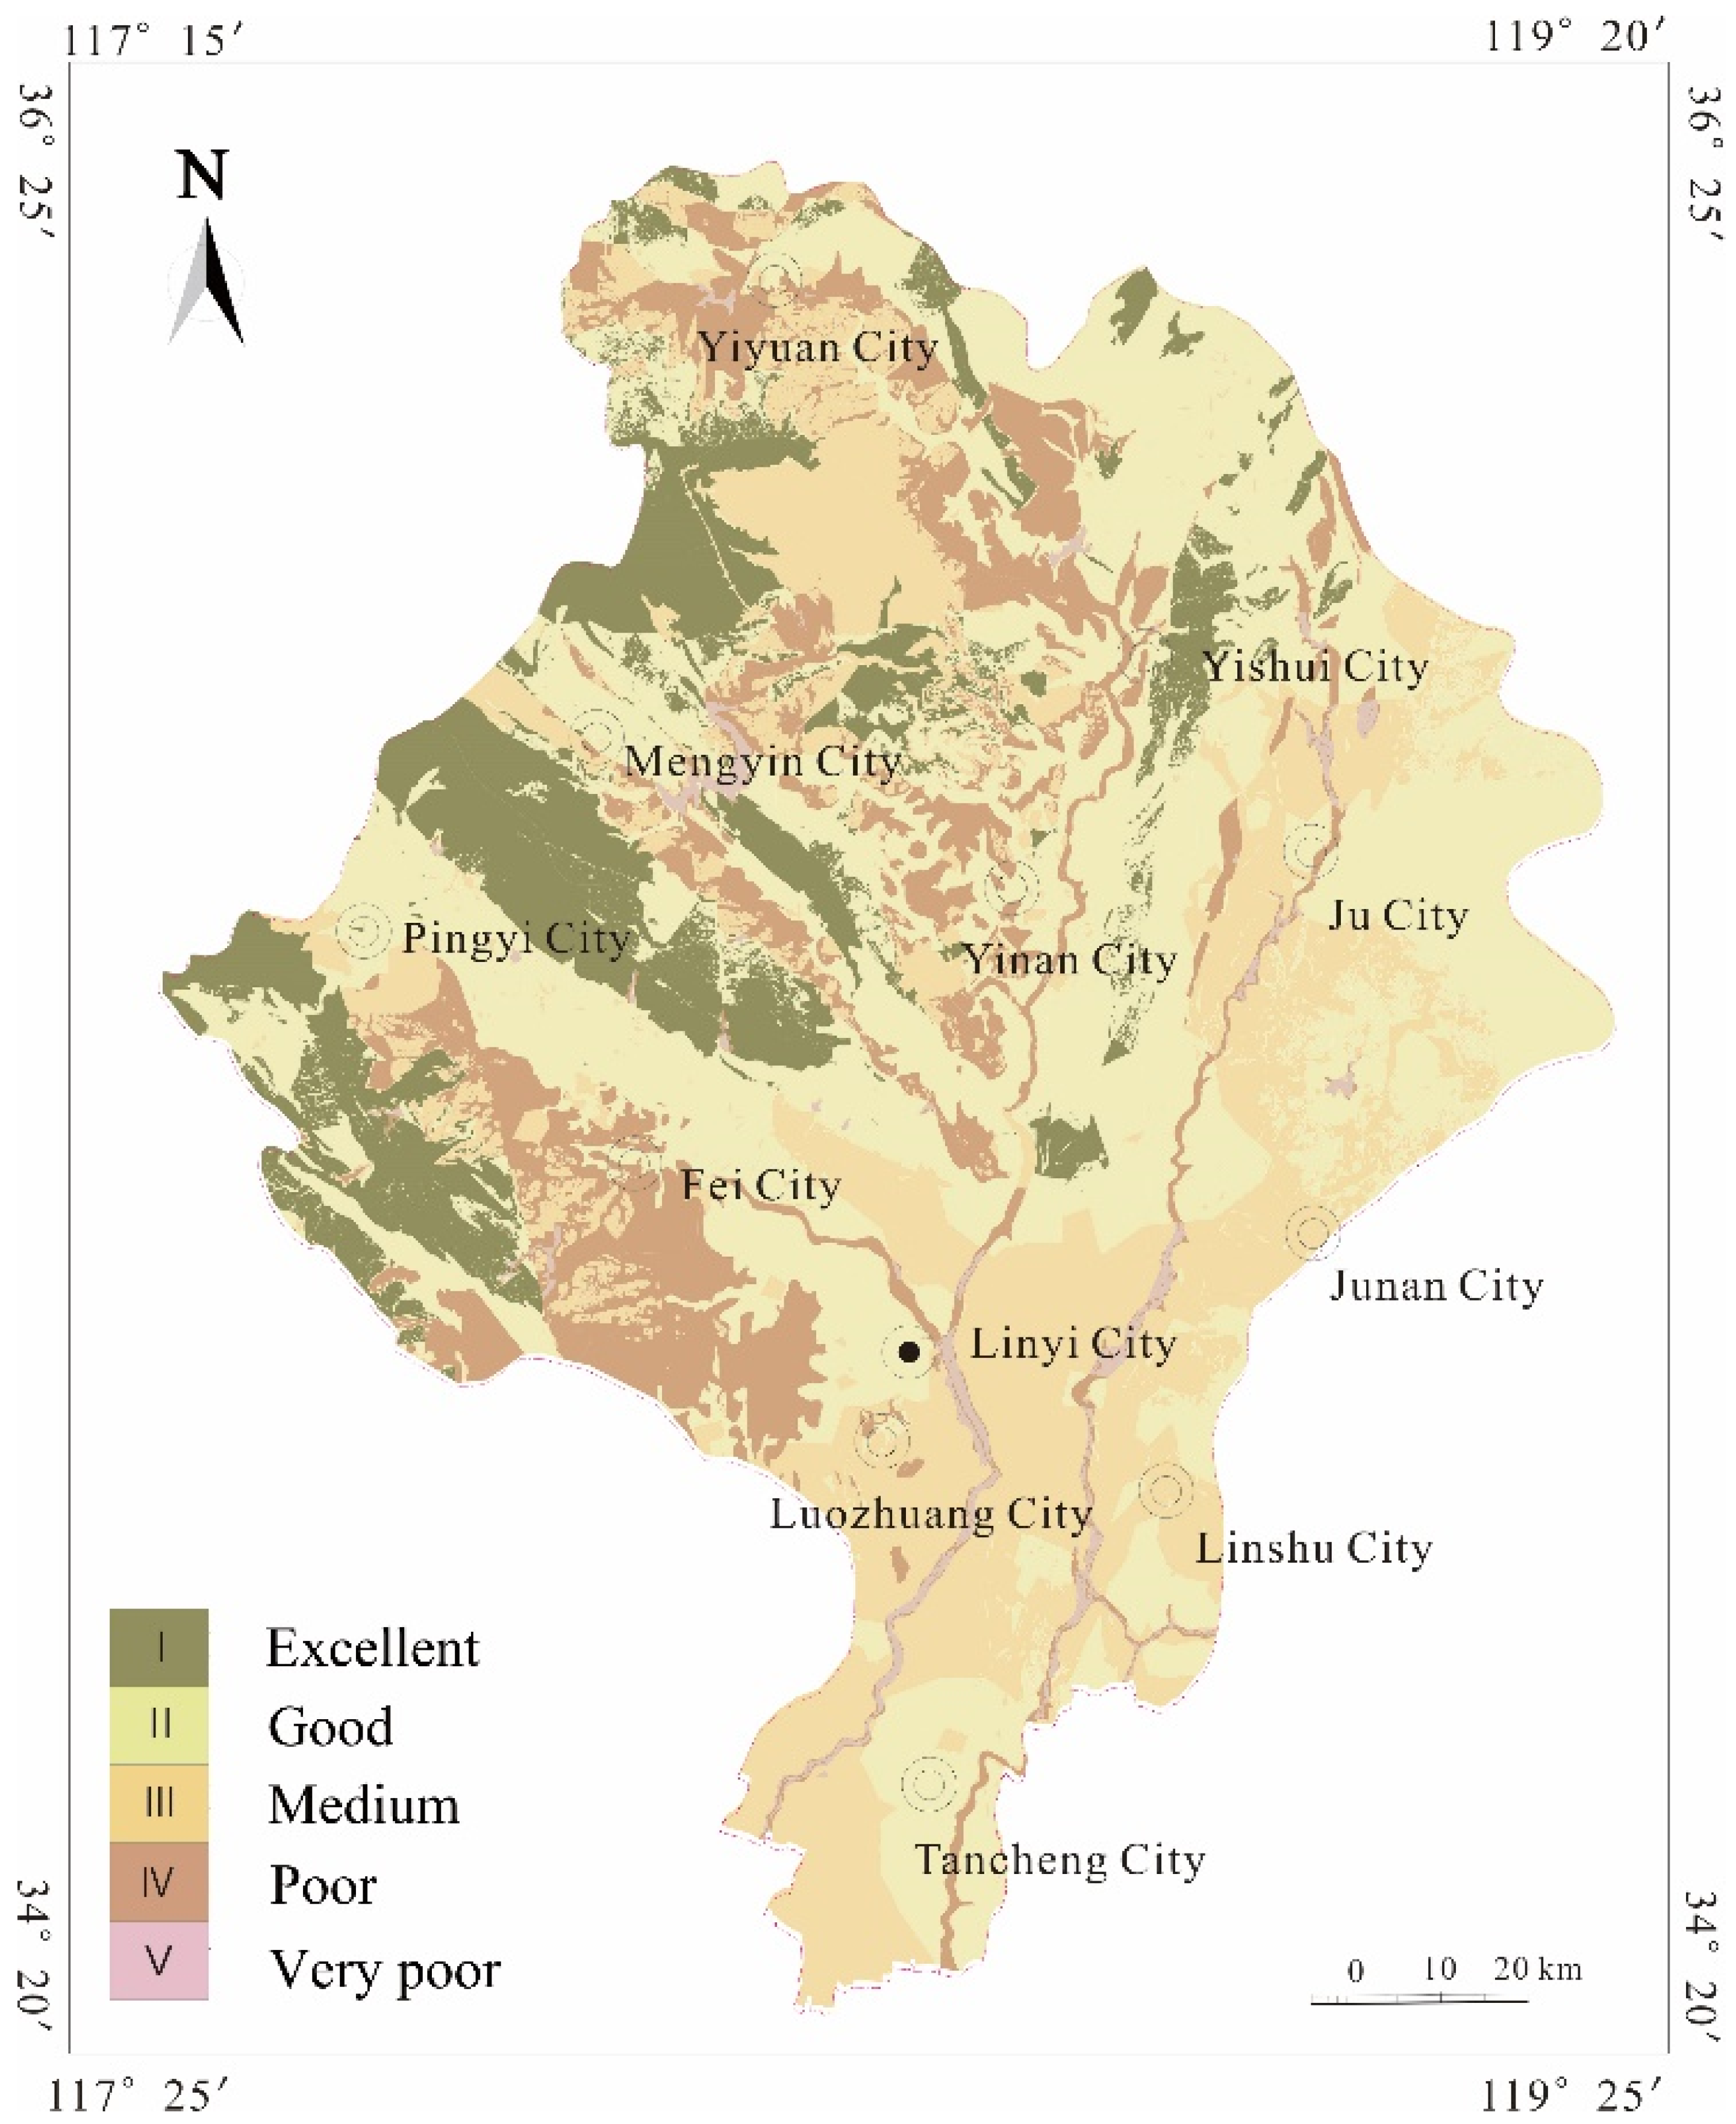
3.2. Comprehensive Evaluation of Vulnerability

The vulnerability of the entire YRB was evaluated based on single evaluation results using a weighted approach. Each evaluation index was multiplied by its corresponding weight and aggregated to obtain the overall evaluation results. The resultant DI value ranged from 80 to 221, with higher values indicating higher groundwater vulnerability and greater vulnerability to pollution. The assessment index analysis and evaluation results, combined with the original DRASTIC vulnerability classification principle, were used to divide the basin into five levels corresponding to different vulnerability zones: excellent, good, medium, poor, and very poor. These zones are outlined in Table 3.
The vulnerability evaluation of the YRB was derived based on the established classification criteria, as depicted in Figure 11.
The classification criteria are described below: (1) Area of low vulnerability: This area exhibits a DI value below 108 and is predominantly situated in the western and southwestern portions of the YRB, covering an area of 2602.28 km2, which represents 14.5% of the total study area. The groundwater in this region is found at significant depths and is primarily composed of water in massive rock fissures, with minimal development of rock cracks and poor permeability. Additionally, the surface is overlaid with a substantial Quaternary system, characterized by predominantly silty clay lithology, which effectively safeguards the groundwater.
(2) Area of low vulnerability performance: This region demonstrates DI values ranging from 108 to 136 and is primarily distributed in the eastern part of the study area, encompassing an area of 7583 km2, accounting for 42.3% of the total area. The groundwater in this area mostly comprises fissure water in massive rock formations and unconsolidated rock pore water, with limited development of rock fissures and low permeability. The Quaternary system in this area consists of a clay layer, providing an effective barrier against the penetration of pollutants into the underground.
(3) Area of moderate vulnerability: This area exhibits DI values ranging from 136 to 164 and is mainly located in the southern and northern regions of the study area, covering an area of 5000.59 km2, which constitutes 27.9% of the total area. It lies within the transitional zone between karst water and Quaternary pore water. Although the surface is covered by the Quaternary system, the system is generally thin, resulting in limited groundwater protection. Consequently, this area is classified as a zone of moderate vulnerability based on various evaluation indicators.
(4) Area of high vulnerability: The DI values in this particular region range from 164 to 192 and are primarily concentrated in the southwest, central, and northern parts of the YRB, covering an extent of 2502.2 km2, which accounts for approximately 14.0% of the total area. The dominant groundwater in this region is characterized as karst fissure water, with limited Quaternary protection on the surface. As a result, pollutants easily permeate through the surface and contaminate the groundwater. Moreover, the aquifer primarily consists of unconsolidated rock pore water, characterized by high permeability, leading to further vulnerability to groundwater pollution. Based on diverse evaluation indicators, this area is classified as having high vulnerability.
(5) Area of very high vulnerability: The DI value in this area exceeds 192 and is primarily observed in surface water bodies such as reservoirs and rivers within the YRB, spanning an area of 22.98 km2, which corresponds to approximately 1.3% of the total area. Given the direct hydraulic connection between this area and the underlying groundwater system, any pollution in the surface water directly impacts and contaminates the groundwater. Consequently, this region is classified as a zone with high vulnerability based on various evaluation indicators.
The groundwater vulnerability in the YRB can be mainly classified into two categories: good and medium (Figure 11). The areas with low vulnerability are the most extensive and are geographically widespread, spanning both the eastern and western regions of the study area. The medium vulnerability areas are primarily concentrated in the central region. Conversely, the areas with high vulnerability are limited in extent and are predominantly located along the banks of the Shu River, forming a narrow strip. Although their spatial coverage is relatively small, these areas coincide with the first-level protected zones of crucial water sources. Consequently, the aquifers in these areas are characterized by high inherent vulnerability and pollution hazard indices. As a result, the safeguarding of groundwater within the protected zones becomes particularly crucial to prevent pollution from infiltrating the water sources.

4. Conclusions and Suggestions

The ability of groundwater to resist external pollution can be evaluated according to its vulnerability. In this study, the hydrogeological conditions in the YRB were analyzed, and seven indicators were selected to evaluate the vulnerability of groundwater using the DRASTIC model combined with GIS technology. This approach improves the reliability of regional vulnerability evaluations and provides guidance for regional groundwater pollution prevention, water source selection, and rational utilization of groundwater resources. The groundwater vulnerability in the YRB was divided into five sub-regions, with 14.5%, 42.3%, 27.9%, 14.0%, and 1.3% of the total area classified as excellent, good, medium, poor, and very poor, respectively. The area with low vulnerability accounted for the largest proportion of the total area and was mainly distributed in the eastern part of the study area. The areas with high vulnerability were mainly distributed along the banks of the Shu River in a strip with a small area but with water source distribution that requires attention. The evaluation results are of some guiding significance for the formulation of groundwater resource protection planning and groundwater pollution prevention planning in the YRB and the rational development and utilization of groundwater resources and land resources. According to different groundwater vulnerability zoning, formulating and adopting targeted protection measures, formulating scientific groundwater resource development and utilization programs, and carrying out land resource planning from the perspective of groundwater resource protection are of great significance for alleviating the shortage of groundwater resources, the continuous decline of groundwater level, and maintaining the sustainable development and utilization of groundwater resources. Based on the evaluation results, the study suggests strict control of groundwater pollution sources, rational planning of industrial layout, optimization of groundwater exploitation mode, and strengthening of groundwater dynamic monitoring. These measures are necessary for the rational development, utilization, and protection of regional groundwater resources.

Author Contributions

Conceptualization, J.H., P.Y., Z.G., Q.L., M.W., Q.L. and J.F.; validation, J.H.; formal analysis, J.H. and P.Y.; writing—original draft preparation, J.H.; writing—review and editing, P.Y., Q.L. and J.L.; super-vision, Z.G., J.H., M.W., J.F. and J.L. All authors have read and agreed to the published version of the manuscript.

Funding

This project was supported by the Rizhao Ecological Geological Environment Monitoring (Lu Di Zi (2023) No. 4).

Data Availability Statement

The data presented in this study are available on request from the corresponding author.

Conflicts of Interest

The authors declare no conflicts of interest.

References

  1. Liu, J.; Peng, Y.; Li, C.; Gao, Z.; Chen, S. Characterization of the hydrochemistry of water resources of the Weibei Plain, Northern China, as well as an assessment of the risk of high groundwater nitrate levels to human health. Environ. Pollut. 2021, 268, 115947. [Google Scholar] [CrossRef]
  2. Ayuba, R.; Tijani, M.N. Hydrochemical characterization of groundwater in Lokoja, North-Central Nigeria. Sustain. Water Resour. Manag. 2021, 7, 61. [Google Scholar] [CrossRef]
  3. Liu, J.; Wang, M.; Gao, Z.; Chen, Q.; Wu, G.; Li, F. Hydrochemical characteristics and water quality assessment of groundwater in the Yishu River basin. Acta Geophys. 2020, 68, 877–889. [Google Scholar] [CrossRef]
  4. Liu, J.; Gao, Z.; Wang, M.; Li, Y.; Ma, Y.; Shi, M.; Zhang, H. Study on the dynamic characteristics of groundwater in the valley plain of Lhasa City. Environ. Earth Sci. 2018, 77, 646. [Google Scholar] [CrossRef]
  5. Mohammadi Arasteh, S.; Shoaei, S.M. Simulation of groundwater resource quantity and quality and assessment of the effects of alluvial material dissolution on the changes of qualitative parameters of the Zanjan Plain, Iran. Arab. J. Geosci. 2023, 16, 60. [Google Scholar] [CrossRef]
  6. Van Rooyen, J.D.; Watson, A.P.; Miller, J.A. Combining quantity and quality controls to determine groundwater vulnerability to depletion and deterioration throughout South Africa. Environ. Earth Sci. 2020, 79, 255. [Google Scholar] [CrossRef]
  7. Abdulsalam, A.; Ramli, M.F.; Jamil, N.R.; Ashaari, Z.H.; Umar, D.U.A. Hydrochemical characteristics and identification of groundwater pollution sources in tropical savanna. Environ. Sci. Pollut. Res. 2022, 29, 37384–37398. [Google Scholar] [CrossRef] [PubMed]
  8. Gugulothu, S.; Subbarao, N.; Das, R.; Dhakate, R. Geochemical evaluation of groundwater and suitability of groundwater quality for irrigation purpose in an agricultural region of South India. Appl. Water Sci. 2022, 12, 142. [Google Scholar] [CrossRef]
  9. Mukonazwothe, M.; Munyai, L.F.; Mutoti, M.I. Groundwater quality evaluation for domestic and irrigation purposes for the Nwanedi Agricultural Community, Limpopo Province, South Africa. Heliyon 2022, 8, e09203. [Google Scholar] [CrossRef] [PubMed]
  10. Akbar, H.; Nilsalab, P.; Silalertruksa, T.; Gheewala, S.H. Comprehensive review of groundwater scarcity, stress and sustainability index-based assessment. Groundw. Sustain. Dev. 2022, 18, 100782. [Google Scholar] [CrossRef]
  11. Dhaouadi, L.; Besser, H.; Karbout, N.; Wassar, F.; Alomrane, A.R. Assessment of natural resources in tunisian Oases: Degradation of irrigation water quality and continued overexploitation of groundwater. Euro-Mediterr. J. Environ. Integr. 2021, 6, 36. [Google Scholar] [CrossRef]
  12. Li, C.; Gao, Z.; Chen, H.; Wang, J.; Liu, J.; Li, C.; Teng, Y.; Liu, C.; Xu, C. Hydrochemical analysis and quality assessment of groundwater in southeast North China Plain using hydrochemical, entropy-weight water quality index, and GIS techniques. Environ. Earth Sci. 2021, 80, 523. [Google Scholar] [CrossRef]
  13. Umar, M.; Khan, S.; Arshad, A.; Aslam, R.; Khan, H.; Rashid, H. A modified approach to quantify aquifer vulnerability to pollution towards sustainable groundwater management in irrigated indus basin. Environ. Sci. Pollut. Res. 2022, 29, 27257–27278. [Google Scholar] [CrossRef]
  14. Zhu, F.; Xiong, L.; Wu, J.; Zhao, Y.; Huang, J.; Wei, J.; Lin, K. Groundwater Vulnerability Assessment in Plain River Network Areas Based on the Improved DRASTIC Model. Environ. Sci. Technol. 2020, 43, 187–193. [Google Scholar]
  15. Tang, X.; Wu, Y.; Chen, J.; Deng, D. DRASTIC-GIS Model for Assessing Groundwater Vulnerability in Typical Area of Chengdu. Environ. Manag. Monit. Technol. 2020, 32, 28–32. [Google Scholar]
  16. Zhu, Z.; Wang, J.; Hu, M.; Jia, L. Geographical detection of groundwater pollution vulnerability and hazard in karst areas of Guangxi Province, China. Environ. Pollut. 2019, 245, 627–633. [Google Scholar] [CrossRef] [PubMed]
  17. Qiu, J. Safeguarding China’s water resources. Natl. Sci. Rev. 2018, 5, 102–107. [Google Scholar] [CrossRef]
  18. Dizaji, A.R.; Hosseini, S.A.; Rezaverdinejad, V.; Sharafati, A. Groundwater contamination vulnerability assessment using DRASTIC method, GSA, and uncertainty analysis. Arab. J. Geosci. 2020, 13, 645. [Google Scholar] [CrossRef]
  19. Shakoor, A.; Khan, Z.M.; Farid, H.U.; Sultan, M.; Ahmad, I.; Ahmad, N.; Mahmood, M.H.; Ali, M.U. Delineation of regional groundwater vulnerability using DRASTIC model for agricultural application in Pakistan. Arab. J. Geosci. 2020, 13, 195. [Google Scholar] [CrossRef]
  20. Rajput, H.; Goyal, R.; Brighu, U. Modification and optimization of DRASTIC model for groundwater vulnerability and contamination risk assessment for Bhiwadi region of Rajasthan, India. Environ. Earth Sci. 2020, 79, 136. [Google Scholar] [CrossRef]
  21. Asfaw, D.; Mengistu, D. Modeling megech watershed aquifer vulnerability to pollution using modified DRASTIC model for sustainable groundwater management, Northwestern Ethiopia. Groundw. Sustain. Dev. 2020, 11, 100375. [Google Scholar] [CrossRef]
  22. Janipella, R.; Quamar, R.; Sanam, R.; Jangam, C.; Pandurang Balwant Jyothi, V.; Padmakar, C.; Pujari, P.R. Evaluation of Groundwater Vulnerability to Pollution using GIS Based DRASTIC Method in Koradi, India—A Case Study. J. Geol. Soc. India 2020, 96, 292–297. [Google Scholar] [CrossRef]
  23. Arya, S.; Subramani, T.; Vennila, G.; Roy, P.D. Groundwater vulnerability to pollution in the semi-arid Vattamalaikarai River Basin of south India thorough DRASTIC index evaluation. Geochemistry 2020, 80, 125635. [Google Scholar] [CrossRef]
  24. Mali, S.C.; Thabaj, K.A.; Purandara, B.K. Evaluation of Geochemical Characteristics of Groundwater in Parts of Ghataprabha Sub-basin Using DRASTIC Indices. J. Geol. Soc. India 2020, 95, 513–519. [Google Scholar] [CrossRef]
  25. Rahman, M.; Haque, M.M.; Tareq, S.M. Appraisal of groundwater vulnerability in south-central part of Bangladesh using DRASTIC model: An approach towards groundwater protection and health safety. Environ. Chall. 2021, 5, 100391. [Google Scholar] [CrossRef]
  26. Shamsuddin, A.S.; Ismail, S.N.S.; Abidin, E.Z.; Bin, H.Y.; Juahir, H.; Bakar, W.A.M.A. Application of GIS-based DRASTIC model approaches in assessing groundwater vulnerability for shallow alluvial aquifer deposited. Arab. J. Geosci. 2021, 14, 2693. [Google Scholar] [CrossRef]
  27. Antonakos, A.K.; Lambrakis, N.J. Development and testing of three hybrid methods for the assessment of aquifer vulnerability to nitrates, based on the drastic model, an example from ne korinthia, greece. J. Hydrol. 2007, 333, 288–304. [Google Scholar] [CrossRef]
  28. Goyal, D.; Haritash, A.K.; Singh, S.K. A comprehensive review of groundwater vulnerability assessment using index-based, modelling and coupling methods. J. Environ. Manag. 2021, 296, 113161. [Google Scholar] [CrossRef] [PubMed]
  29. Moazamnia, M.; Hassanzadeh, Y.; Nadiri, A.A.; Sadeghfam, S. Vulnerability indexing to saltwater intrusion from models at two levels using artificial intelligence multiple model (AIMM). J. Environ. Manag. 2020, 255, 109871.1–109871.11. [Google Scholar] [CrossRef]
  30. Mojgan, B.; Aminreza, N.; Saman, J. A new hybrid framework for optimization and modification of groundwater vulnerability in coastal aquifer. Environ. Sci. Pollut. Res. 2019, 26, 21808–21827. [Google Scholar]
  31. Celia, S.F.; Marina, C.B.; Rubén, L.L.; Fátima, S.G. Multiresponse Performance evaluation and life cycle assessment for the optimal elimination of pb (ii) from industrial wastewater by adsorption using vine shoot activated carbon. Sustainability 2023, 15, 11007. [Google Scholar]
  32. Chakraborty, B.; Roy, S.; Bera, A.; Adhikary, P.P.; Bera, B.; Sengupta, D.; Bhunia, G.S.; Shit, P.K. Groundwater vulnerability assessment using GIS-based DRASTIC model in the upper catchment of Dwarakeshwar river basin, West Bengal, India. Environ. Earth Sci. 2021, 81, 2. [Google Scholar] [CrossRef]
  33. Koon, A.B.; Anornu, G.K.; Dekongmen, B.W.; Sunkari, E.D.; Agyare, A.; Gyamfi, C. Evaluation of groundwater vulnerability using GIS-based DRASTIC model in Greater Monrovia, Montserrado County, Liberia. Urban Clim. 2023, 48, 101427. [Google Scholar] [CrossRef]
  34. Patel, P.; Mehta, D.J.; Sharma, N.D. A GIS-based DRASTIC Model for Assessing Groundwater Quality Vulnerability: Case Study of Surat and its Surroundings. J. Geol. Soc. India 2023, 99, 578–582. [Google Scholar] [CrossRef]
  35. Patel, P.; Mehta, D.; Sharma, N. A review on the application of the DRASTIC method in the assessment of groundwater vulnerability. Water Supply 2022, 22, 5190–5205. [Google Scholar] [CrossRef]
  36. Patle, D.; Nema, S.; Awasthi, M.K.; Sharma, S.K.; Tiwari, Y.K. Groundwater vulnerability assessment using DRASTIC model in Niwari District of Bundelkhand Region, Madhya Pradesh, India. Arab. J. Geosci. 2022, 15, 1590. [Google Scholar] [CrossRef]
  37. Smail, R.Q.S.; Dişli, E. Assessment and validation of groundwater vulnerability to nitrate and TDS using based on a modified DRASTIC model: A case study in the Erbil Central Sub-Basin, Iraq. Environ. Monit. Assess. 2023, 195, 567. [Google Scholar] [CrossRef] [PubMed]
  38. Aller, L.T.; Bennett, T.; Lehr, J.H.; Petty, R.J.; Hackett, G. Drastic: A standardized system for evaluating ground water pollution potential using hidrogeologic settings. J. Geol. Soc. India 1987, 29. [Google Scholar]
  39. Venkatesan, G.; Pitchaikani, S.; Saravanan, S. Assessment of Groundwater Vulnerability Using GIS and DRASTIC for Upper Palar River Basin, Tamil Nadu. J. Geol. Soc. India 2019, 94, 387–394. [Google Scholar] [CrossRef]
  40. Aslam, B.; Ismail, S.; Ali, I. A GIS-based DRASTIC model for assessing aquifer susceptibility of Safdarabad Tehsil, Sheikhupura District, Punjab Province, Pakistan. Model. Earth Syst. Environ. 2020, 6, 995–1005. [Google Scholar] [CrossRef]
  41. Hasan, M.; Islam, M.A.; Aziz Hasan, M.; Alam, M.J.; Peas, M.H. Groundwater vulnerability assessment in Savar upazila of Dhaka district, Bangladesh—A GIS-based DRASTIC modeling. Groundw. Sustain. Dev. 2019, 9, 100220. [Google Scholar] [CrossRef]
  42. Kaliraj, S.; Chandrasekar, N.; Peter, T.S.; Selvakumar, S.; Magesh, N.S. Mapping of coastal aquifer vulnerable zone in the south west coast of Kanyakumari, South India, using GIS-based DRASTIC model. Environ. Monit. Assess. 2014, 187, 4073. [Google Scholar] [CrossRef] [PubMed]
  43. Karimzadeh Motlagh, Z.; Derakhshani, R.; Sayadi, M.H. Groundwater vulnerability assessment in central Iran: Integration of GIS-based DRASTIC model and a machine learning approach. Groundw. Sustain. Dev. 2023, 23, 101037. [Google Scholar] [CrossRef]
Figure 1. Hydrogeological map and distribution map of monitoring points in the YRB.
Water 16 00429 g001
Figure 2. Outline map of landform zoning in the study area.
Water 16 00429 g002
Figure 3. Flowchart of the DRASTIC methodology.
Water 16 00429 g003
Figure 4. Scoring map for groundwater depth (D).
Water 16 00429 g004
Figure 5. Scoring map for net recharge (R).
Water 16 00429 g005
Figure 6. Scoring map for aquifer media (A).
Water 16 00429 g006
Figure 7. Scoring map for soil media (S).
Water 16 00429 g007
Figure 8. Scoring map for topography (T).
Water 16 00429 g008
Figure 9. Scoring map for medium in seepage area (I).
Water 16 00429 g009
Figure 10. Scoring map for hydraulic conductivity (C).
Water 16 00429 g010
Figure 11. Evaluation of vulnerability of YRB.
Water 16 00429 g011
Table 1. Fragility evaluation index scoring system.
Groundwater
depth
(D)
Range (m)MarkHydraulic
conductivity
(C)
Type (m/d)Mark
0~1.5100~4.11
1.5~4.694.1~12.22
4.6~9.1712.2~28.54
9.1~15.2528.5~40.76
15.2~22.9340.7~81.58
22.9~30.52>81.510
>30.51Aquifer media
(A)
TypeMark
Soil type
(S)
TypeMarkMassive shale2
Thin layer or none10Metamorphic/igneous rocks3
Gravel10Weathered metamorphic/igneous rocks4
Sand9Moraine sheet5
Peat8Stratified sandstone, limestone, and shale sequences6
Swollen or condensed clay7Massive sandstone6
Sandy subclay6Massive limestone6
Subclay5Gravel layer8
Silty subclay4Basalt9
Clayey subclay3Karst limestone10
Garbage2Medium of seepage zone
(I)
TypeMark
Non-shrinkable or cohesive clay1Confined layer1
Terrain slope
(T)
Range (%)MarkSilt/clay3
0~210Shale3
2~69Limestone6
6~125Sandstone6
12~183Stratified limestone, sandstone, shale6
>181Gravel containing more silt and clay6
Net recharge of aquifer
(R)
Type (mm)MarkMetamorphic/igneous rocks4
0~511Grit8
51~1023Basalt9
102~1786Karst limestone10
178~2548
>2549
Table 2. Weights of evaluation indicators for groundwater vulnerability.
Evaluation IndexDRASTIC
Weight5432153
Table 3. Vulnerability assessment degree division.
DIVulnerabilityRank
<108ExcellentI
108~136GoodII
136~164MediumIII
164~192PoorIV
>192Very poorV
Disclaimer/Publisher’s Note: The statements, opinions and data contained in all publications are solely those of the individual author(s) and contributor(s) and not of MDPI and/or the editor(s). MDPI and/or the editor(s) disclaim responsibility for any injury to people or property resulting from any ideas, methods, instructions or products referred to in the content.

