1. Introduction
Urban flooding poses a significant global challenge, impacting infrastructure, economies, and communities worldwide [
1]. Riyadh, the capital of Saudi Arabia, with its arid climate, experiences severe flooding during flash flood events [
2]. This issue has become more pronounced with the rapid urbanization of the city, necessitating effective flood risk management strategies [
3,
4].
The unique topography and urban morphology on the Najd plateau make Riyadh prone to flooding [
5]. Steep slopes, wadi systems, and urban sprawl create complex flood risk scenarios that go beyond traditional management strategies [
6]. Consequently, there is an increasing need for innovative approaches to identify and mitigate potential flood hazards.
Managing urban floods in arid environments is a global challenge, evident in regions such as Arizona and New Mexico in the United States, where the “monsoon season” brings heavy rainstorms, resulting in flash floods due to the unique topography of deep canyons and valleys [
7]. Similarly, in Australia, arid and semi-arid areas such as the Outback, especially in regions such as Alice Springs, are susceptible to sudden and intense rainfall, leading to flash floods [
8]. Even in the Atacama Desert, one of the driest regions globally, heavy rainfall events occasionally result in significant flooding [
9].
Flash floods are a common occurrence in various parts of the world, including Iran’s eastern and central arid landscapes. Cities such as Kerman face challenges of flooding during the spring, primarily due to rainstorms [
10,
11]. The Thar Desert in India and the Namib Desert in Africa also experience unexpected flash floods due to monsoonal rains and rare rain events [
12,
13]. Flash floods are not limited to arid and semi-arid climates. Catastrophic flash floods have also been reported in humid and maritime climates, such as in Boscastle, Cornwall, United Kingdom, and in countries such as Germany and Hungary, among many other regions worldwide [
14,
15,
16,
17].
The imperative for global assessment and management of flood risk has prompted the evolution of various methodologies, including hydrological modeling and advanced geospatial analysis techniques. Geographic information systems (GIS) have emerged as a popular tool in flood risk analyses, leveraging their effectiveness in processing and analyzing spatial data [
18,
19,
20,
21]. GIS, a technology that collects, stores, analyzes, and visualizes geographic data related to Earth’s surface positions [
22], plays a pivotal role in urban planning and environmental management by providing a spatial dimension to data analysis, facilitating more accurate and comprehensive insights. This methodology has proven instrumental in understanding flood risks more comprehensively by considering various contributing factors.
In Riyadh, flood risk analyses require further development, with current studies focusing on specific areas and using limited data, often neglecting crucial factors such as topography, lithology, slope, drainage density, and precipitation [
23,
24,
25,
26]. Given the city’s rapid urbanization and diverse climate, addressing this gap is crucial. Advanced geospatial techniques such as weighted overlay analysis (WOA) have the potential to provide valuable insights but have not been fully utilized in the study area [
27,
28,
29]. WOA, a powerful GIS technique, combines multiple information layers to generate a composite outcome. It assigns specific weights to each data layer based on the relative importance and overlays these weighted layers to produce a single, integrated analysis [
30]. This technique proves particularly effective in environmental and urban studies, such as flood risk assessment, where multiple factors interact to influence the outcomes. Consequently, it aids decision-making by offering a comprehensive understanding of the interrelated data layers. This research aimed to comprehensively analyze potential flood zones in Riyadh using a weighted overlay approach. The methodology integrated different datasets, including digital elevation models (DEM), lithology, precipitation patterns, slope, and drainage density. Through this approach, the study sought to provide a detailed and nuanced understanding of flood risks in Riyadh.
2. Description of the Study Area
Riyadh, situated in the heart of the Arabian Peninsula, holds a pivotal role as the political and economic center of Saudi Arabia (
Figure 1). Its central location establishes it as a crucial connectivity area of strategic importance within the country. The city is characterized by an arid climate typical of desert environments, experiencing extreme temperatures that range from hot summers to cold winters [
31]. Precipitation is scarce, with an annual average rainfall of only 97 mm, rendering flood events in the region unpredictable due to the erratic nature of rainfall.
Riyadh has a variety of elevations, featuring gentle slopes in the central study area and steeper terrains in the western and eastern areas. These topographical variations play a crucial role in influencing the flow and accumulation of surface water, thereby impacting the flood risk. The city’s natural drainage system primarily relies on wadi systems such as Wadi Hanifah in the west and As Sulai in the east [
32]. These dry riverbeds can transform into torrents during heavy rainfall. While Riyadh also has an artificial drainage network, rapid urbanization and construction have posed challenges to its efficiency. The interplay of these factors determines the patterns of surface water flow during precipitation events.
In recent decades, Riyadh has experienced significant urbanization, leading to the expansion of impervious surfaces due to urban development [
33]. This transformation has notably affected natural drainage, rendering the city more susceptible to urban flooding [
34]. The current land use pattern in Riyadh comprises a mix of residential, commercial, and industrial areas, each contributing to varying degrees of flood risk. Riyadh’s geological features are diverse, featuring sandy soil and compact, less permeable substrates such as limestone [
35]. These distinct materials significantly influence the city’s water absorption and runoff characteristics [
36].
3. Materials and Methods
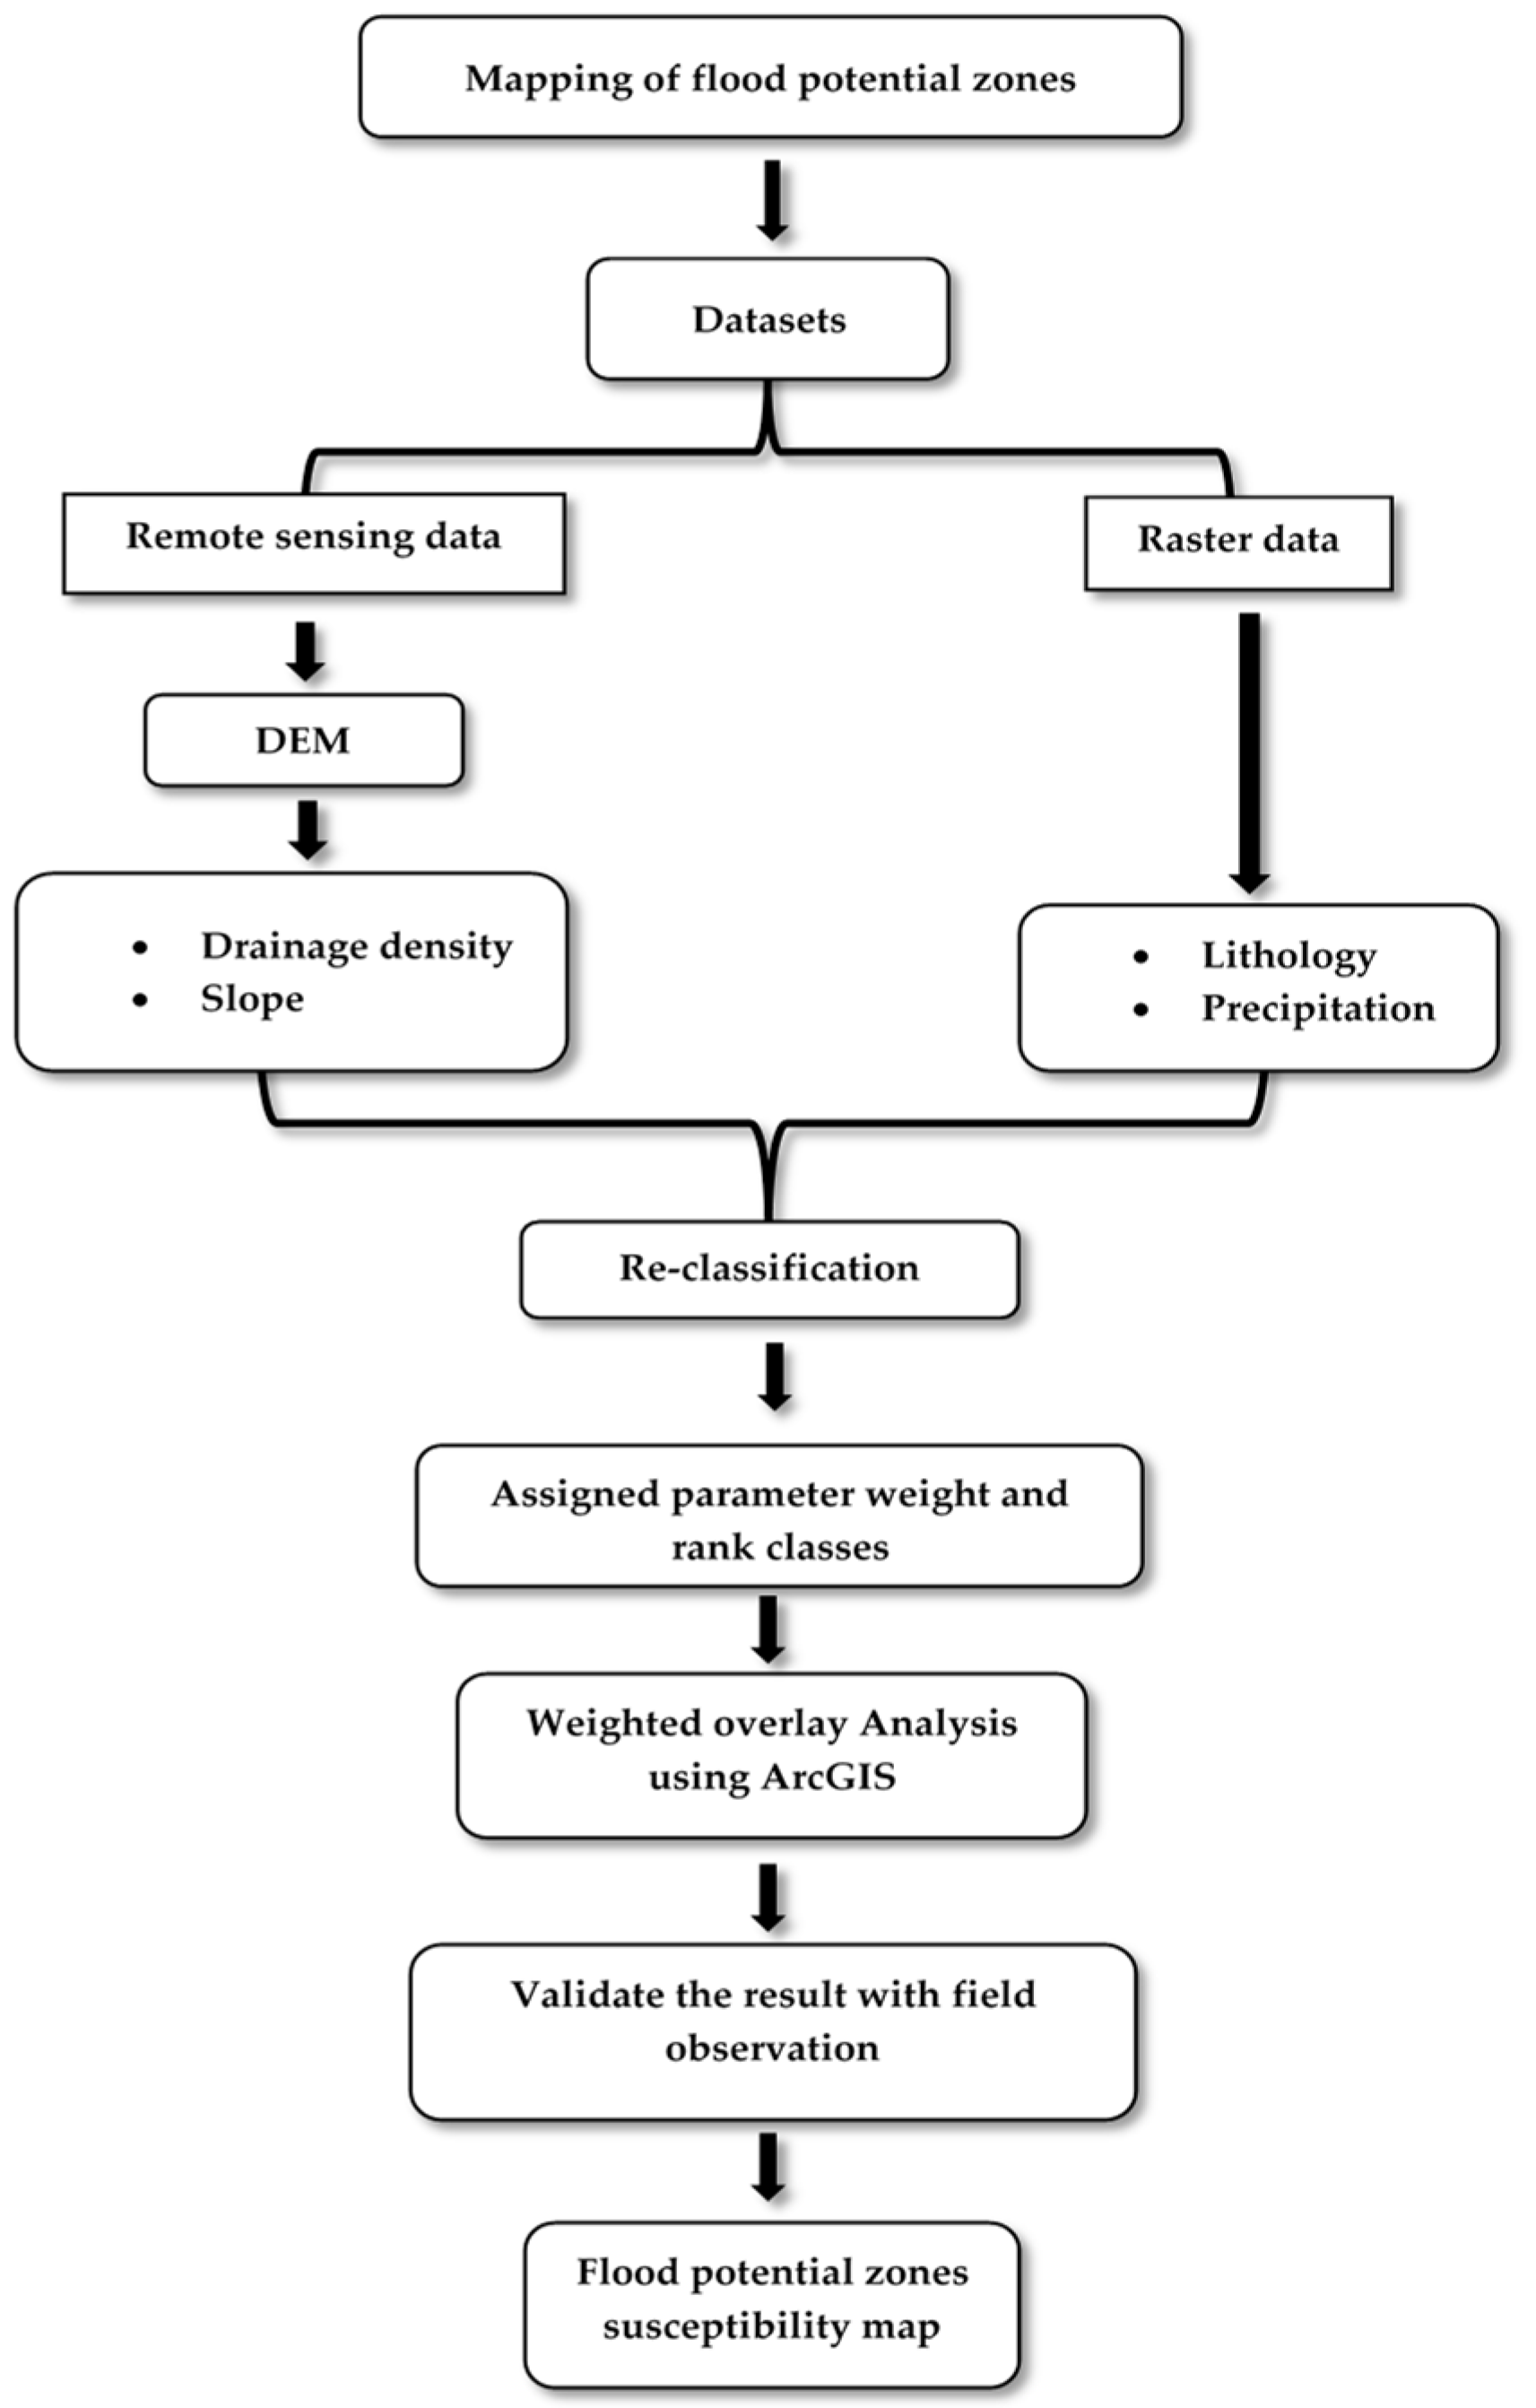
The study’s methodology was divided into three phases (
Figure 2). Initially, datasets were collected from extensive fieldwork, freely available remote sensing data provided by NASA, and geological data from the Saudi Geological Survey. The second phase applied weighted overlay analysis to map potential flood risk zones in Riyadh. This began by assigning weights to each data layer on the basis of the fieldwork and was refined by adjusting these weights according to evidence of previous floods. If the initial results did not align with historical flood locations, a calibration process was used to fine-tune the weights. This ensured the risk map accurately represented all previously flooded areas. The final phase involved rigorous validation of these findings to confirm their accuracy and reliability. This was achieved through field surveys after a significant rainfall event to observe the current flooding patterns and refine the map’s accuracy using real-world data.
3.1. Collecting Data
To conduct a comprehensive analysis of the flood risk, a methodological approach was used, encompassing the collection and integration of various datasets. These datasets included a 30-m-resolution digital elevation model (DEM) obtained from NASA’s Earth Science data [
37]. The DEM data were utilized for the analysis of Riyadh’s topography, providing information on the elevation and slope characteristics. Geological data from the Saudi geological survey were also incorporated to gain insights into the rocks’ composition and permeability, factors influencing water runoff and absorption. Precipitation records from the Ministry of Environment, Water, and Agriculture were analyzed to comprehend Riyadh’s average amount of rainfall from 2010 to 2022. Additionally, the city’s drainage network, including wadi systems, was assessed to understand the natural drainage patterns of the study area. These drainage patterns were constructed from the DEM.
3.2. Weighted Overlay Analysis
All datasets underwent preprocessing, which involved geo-referencing, resampling, and normalization to a standard scale to ensure compatibility and accuracy. Subsequently, each dataset was assigned a weight based on its relative importance in contributing to flood risk, which was determined through a combination of fieldwork and a literature review. The weighted datasets were then integrated using ArcGIS (version 10.8, Redlands, CA, USA), generating a composite flood risk map that delineated the flooding zones in Riyadh with low, medium, high, and very high susceptibility to flooding. Finally, the accuracy of the flood risk map was rigorously validated through field verification.
This methodology used advanced geospatial techniques and a multicriteria approach to comprehensively assess the flood risks in arid urban environments. The outcomes of this study are expected to provide valuable insights for policymakers, urban planners, and disaster management authorities in Riyadh and other arid urban areas globally.
3.3. Validation
In this research, a thorough approach was used to verify the accuracy of the flood risk map, involving two stages: an initial field survey for evidence of floods and a subsequent field validation after a flood event. The comparison between the predicted flood-prone areas and the actual documented occurrences of floods spanned multiple years. This meticulous process considered the locations and extent of past events to identify potential high-risk zones. On-site surveys were then conducted in areas identified as high-risk by the map, especially following significant rain events. The on-site surveys aimed to observe the accumulation of water and flow patterns, seeking physical evidence of flooding such as watermarks, sediment deposits, and damage to infrastructure. Residents’ experiences and observations were also gathered to enrich the validation process. This comprehensive method ensured a robust verification of the flood risk map, enhancing its reliability as a tool for future urban planning and flood mitigation strategies in Riyadh.
A set of maps was generated to depict the areas in the city most susceptible to flooding. These maps encompassed various crucial factors, including the digital elevation model, precipitation patterns, lithology, slope characteristics, and drainage density.
3.4. Digital Elevation Model
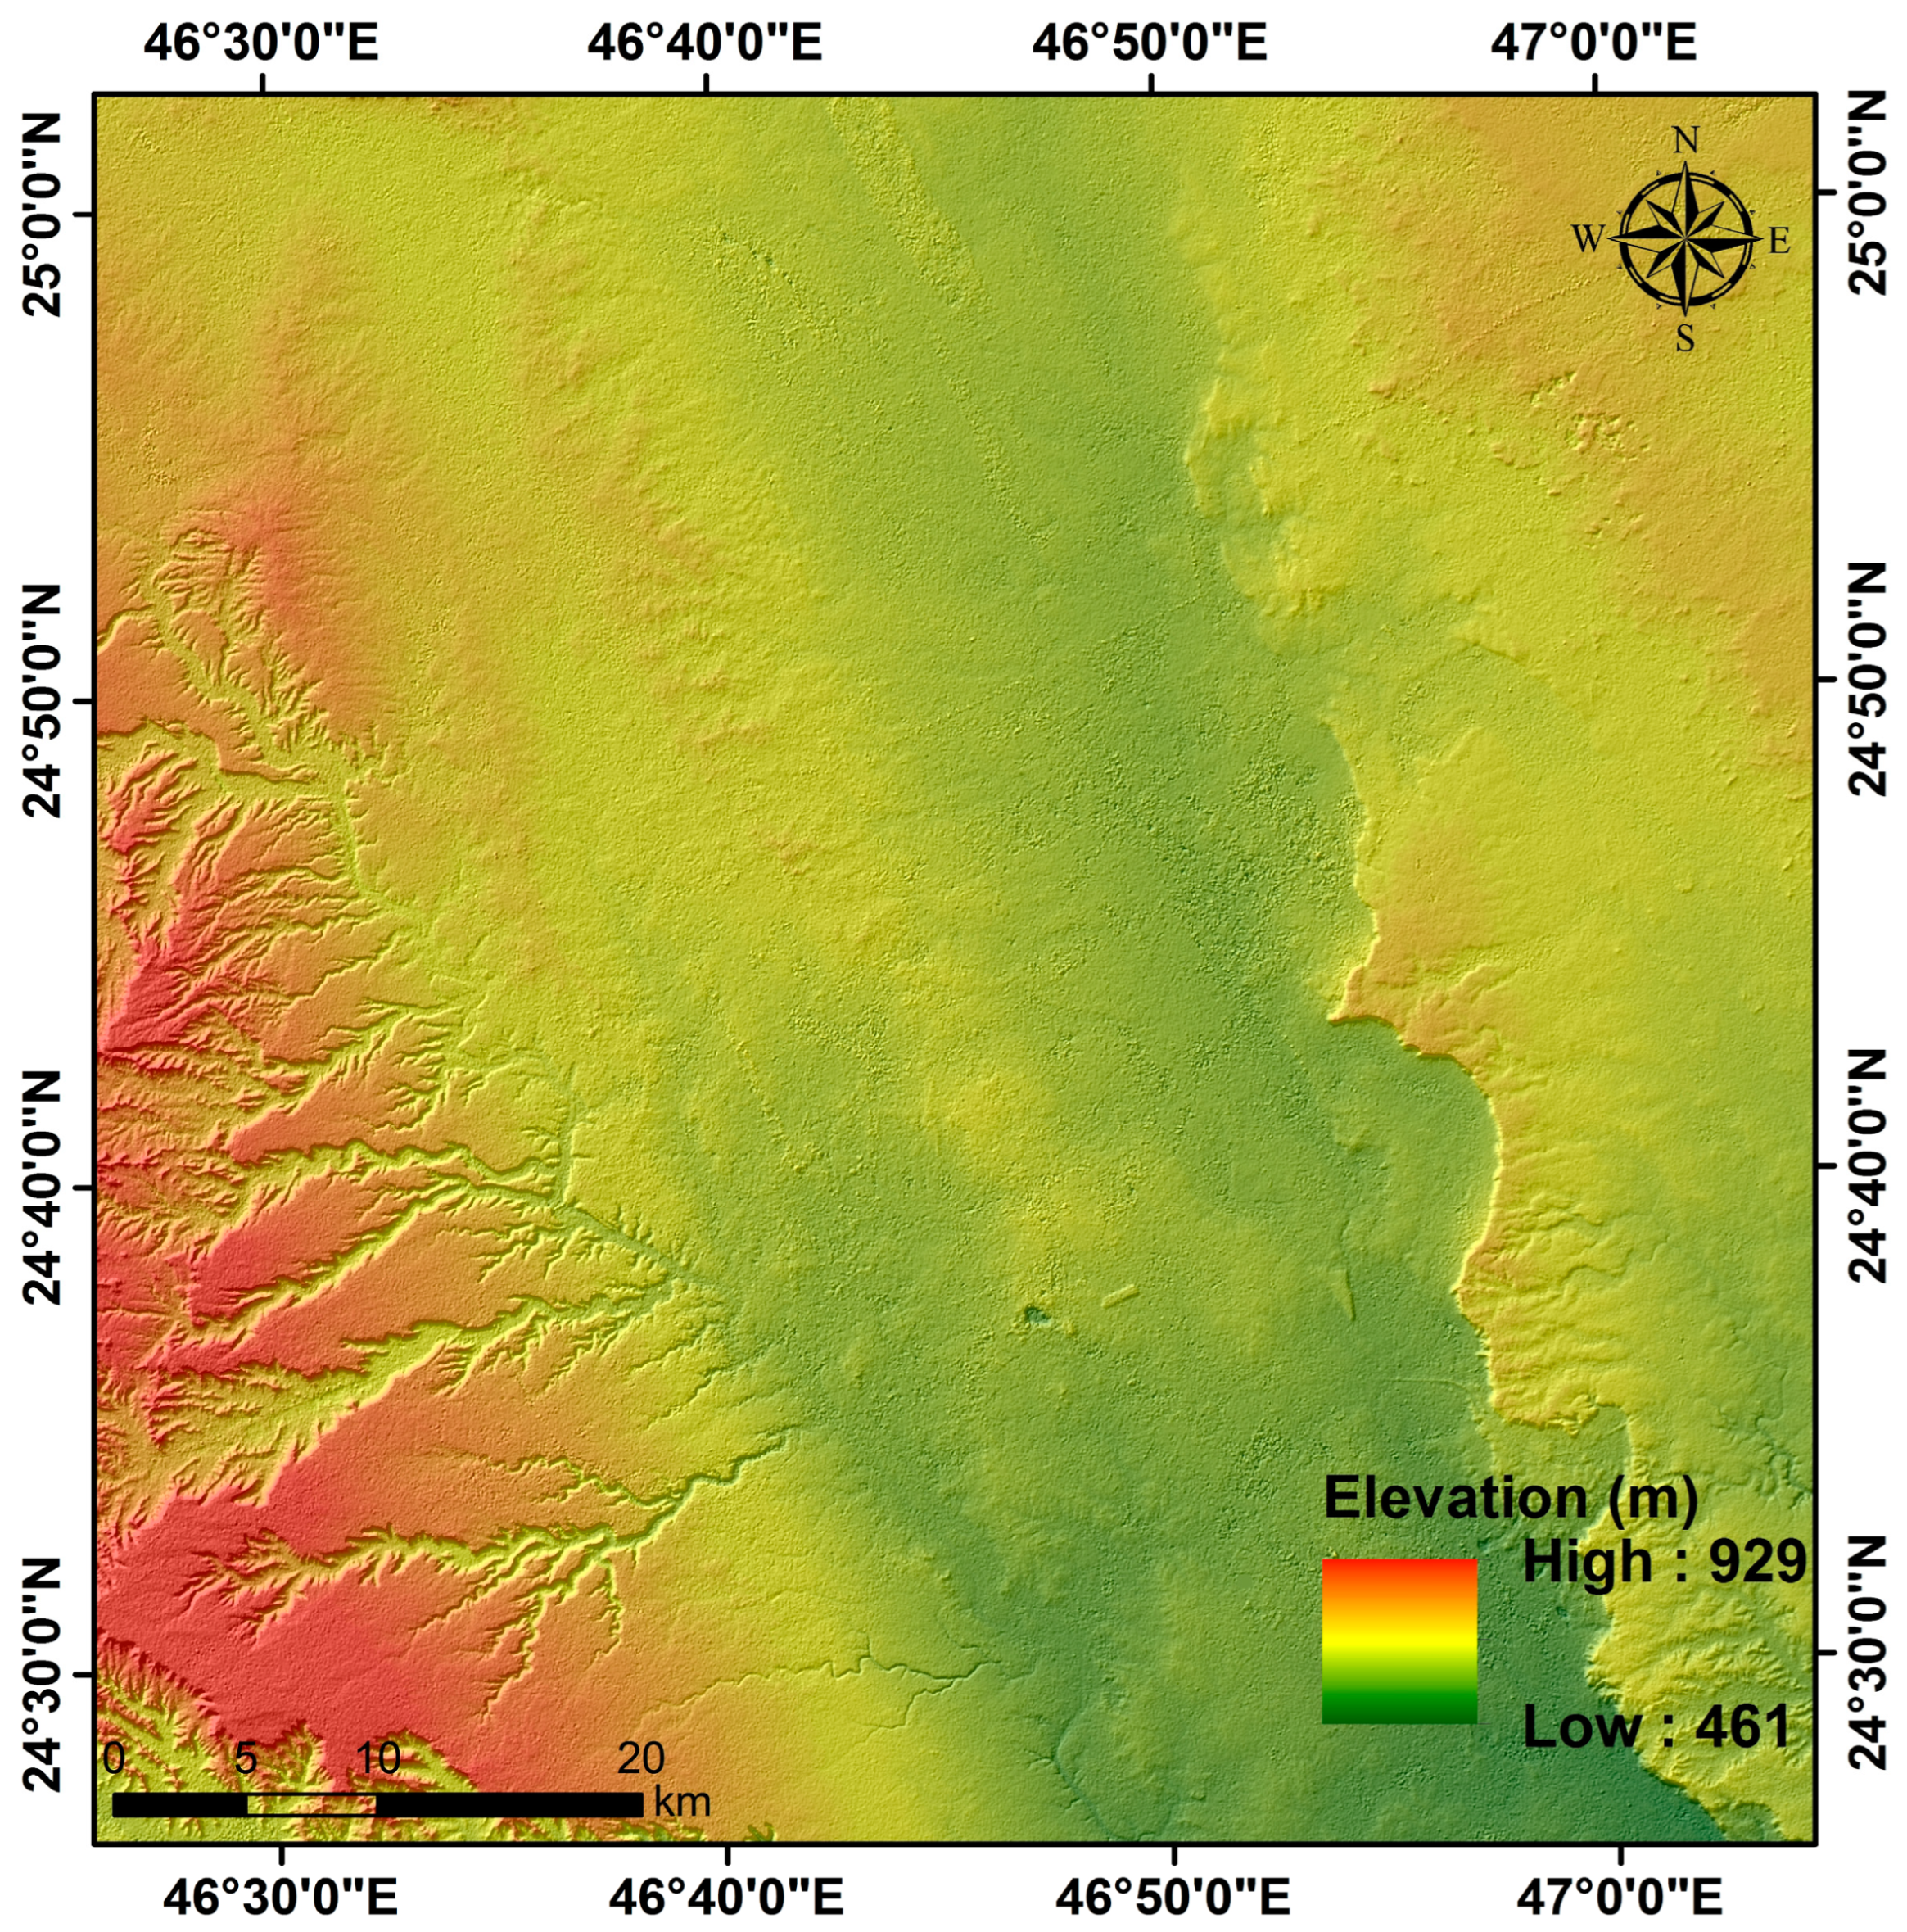
The digital elevation map (DEM) provided a grayscale shaded relief model of Riyadh, Saudi Arabia, revealing distinct elevation variations (
Figure 3). Lighter areas signify higher elevations, while darker areas indicate lower elevations. The map illustrates a topography with high relief, with the highest point reaching 929 m above sea level and the lowest at 461 m. The western region has rugged, mountainous, or hilly terrain, suggesting steep slopes and significant disparities in elevation.
The eastern and central areas of the map are relatively flat, indicating the urban expansion of Riyadh. Notably, visible linear features resembling wadis or valleys are discernible, particularly in the western mountainous region, where natural drainage occurs. These features play a pivotal role in understanding the potential flood paths and accumulation zones.
The DEM is as a critical tool in assessments of flood risk, aiding in the identification of low-lying areas prone to flooding. Moreover, it has proven instrumental in hydrological modeling, facilitating the simulation of water flow and accumulation. This information is integral to designing effective flood prevention and mitigation measures in Riyadh.
3.5. Precipitation
The precipitation map of Riyadh revealed a narrow range of rainfall distribution across the city, with the values showing a very homogeneous spatial distribution from 95.5 to 98.7 mm. This suggests that precipitation may not be the primary driver of flooding in the area.
Despite the general trend indicating minimal differences in rainfall, local variations and the intensity of rainstorms remain crucial considerations. Intense, localized rainstorms have the potential to result in flash flooding, particularly in areas where the urban drainage system is overwhelmed. The annual average precipitation data may not capture these variations, but they are important in assessing the flood risk in the city.
3.6. Lithology
The lithology map provides insights into the distribution of various rock types across the study area in Riyadh (
Figure 4). According to the map, eolian sand is predominantly concentrated in the wadis of the area. This unconsolidated, fine-grained sediment exhibits high porosity and permeability, facilitating the rapid infiltration of water and reducing surface runoff. Gravel areas are scattered throughout the region but are notably concentrated in the central area. These areas consist of coarser material that enables significant water drainage. The study area is primarily composed of limestone, which is characterized by low permeability, causing rainwater to flow as surface runoff. Limestone acts as an impermeable barrier due to its compacted layers and cementation. Sandstone is predominantly found on the eastern edges of the study area. This rock type is generally permeable, well-sorted, and loosely cemented, allowing for effective water infiltration.
3.7. Slope
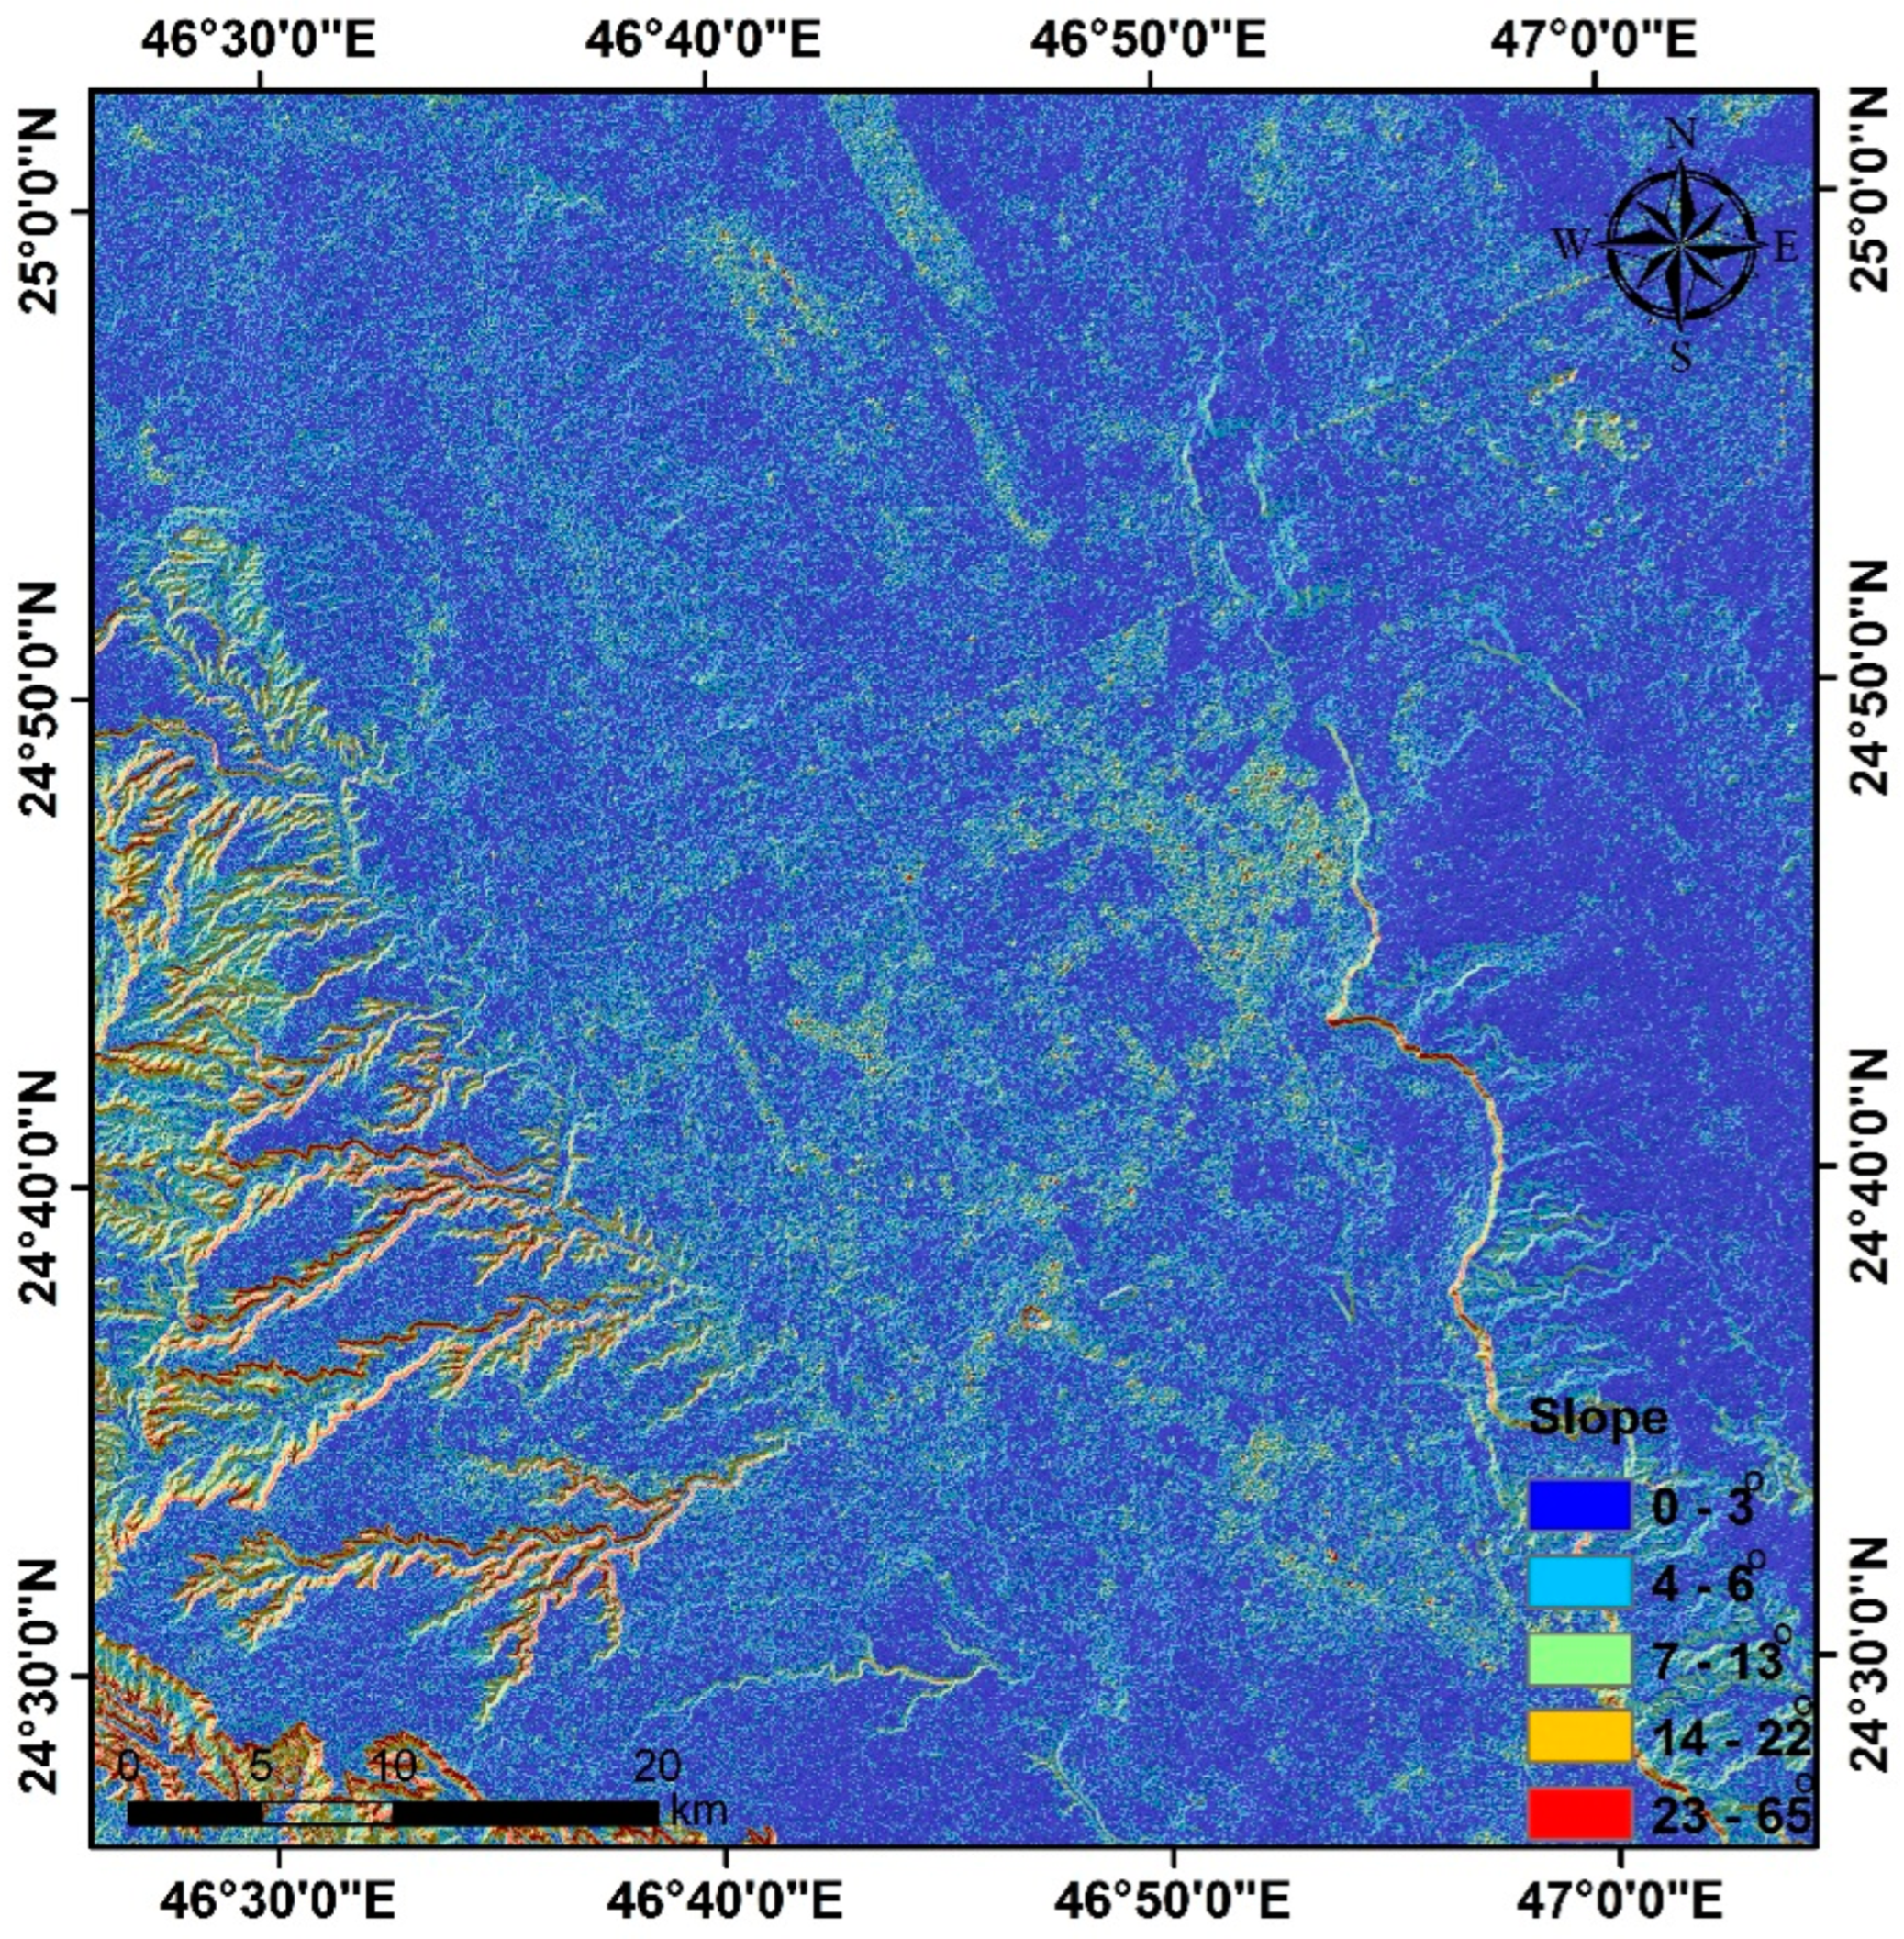
The slope map of Riyadh is crucial for comprehending the region’s topography (
Figure 5). The map delineates various levels of inclination in the terrain, providing insights into the landscape’s characteristics. Areas with flat to very gentle slopes (0–3°) are predominantly flat, increasing the likelihood of water pooling and slower drainage, potentially leading to flooding during heavy rainfall. Regions with gentle slopes (4–6°) facilitate better water runoff compared with flatter areas but still pose a moderate risk of water accumulation. Areas with moderate slopes (7–13°) exhibit a moderate steepness, promoting more rapid surface runoff, reducing water retention, and heightening the risk of soil erosion. Steep slopes (14–22°) are susceptible to swift runoff and increased erosion, potentially causing the displacement of sediment and accelerated downstream water flow. Very steep slopes (23–65%) represent the steepest gradients in the area, where the velocity of runoff is at its maximum, escalating the risk of erosion and potentially triggering landslides under extreme weather conditions.
The western part of the map displays rough terrain with mountains, making it less prone to standing water but capable of causing rapid runoff that could impact the floodplains downstream. Conversely, the central and eastern parts of Riyadh, being relatively flat, require careful analysis of the flood risks. These areas have a high probability of accumulating surface water, particularly if the drainage infrastructure is inadequate or overwhelmed during heavy rainfall.
3.8. Drainage Density
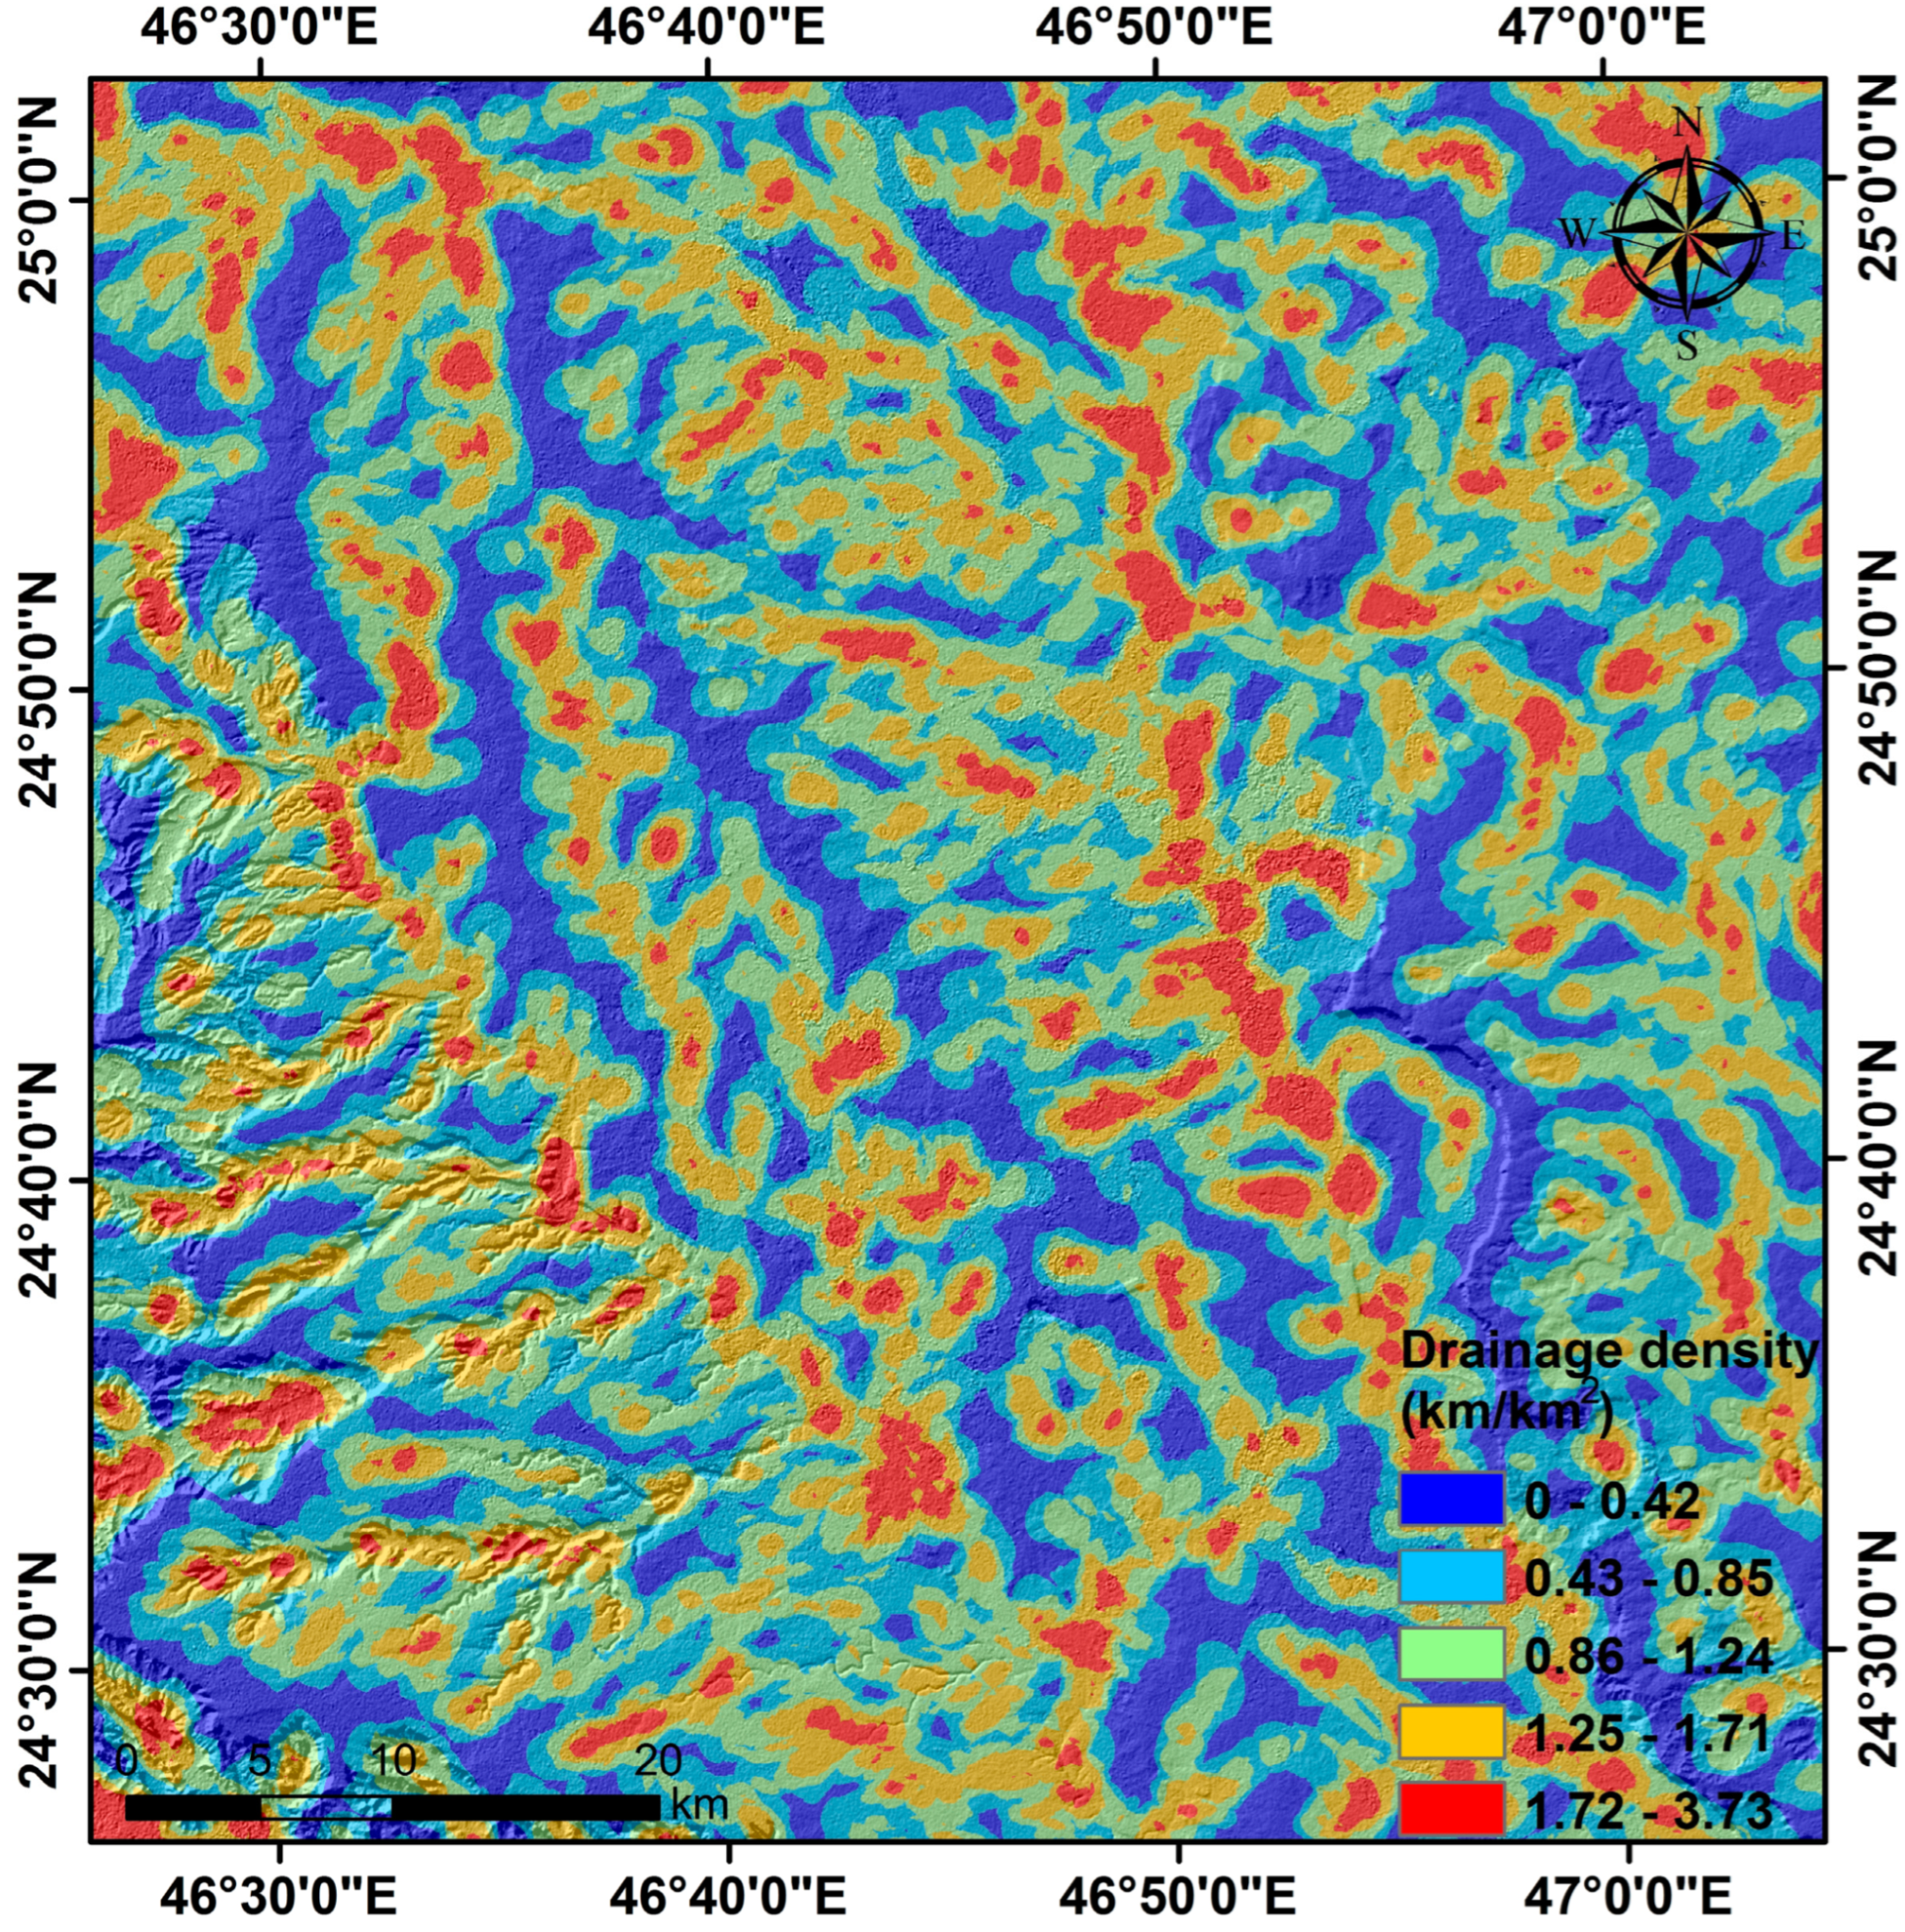
The analysis of the drainage density map for the specified study area in Riyadh offered crucial insights into the region’s hydrological characteristics (
Figure 6). Drainage density, defined as the ratio of the total length of the valley network to the area it drains [
38], serves as an indicator of an area’s capacity to manage surface runoff. Areas with low drainage density (0–0.42) feature sparse stream networks, which could limit the runoff capacity and potentially increase the risk of flooding. Moderate drainage density (0.43–0.85) suggests a somewhat enhanced drainage capability, enabling a more balanced hydrological response during precipitation events. Areas with substantial drainage density (0.86–1.24) are characterized by a relatively dense network of channels, which are conducive to efficient conveyance of water and could potentially reduce the risk of flooding. High drainage density (1.25–1.71) implies terrain that is capable of handling surface water, thereby reducing the likelihood of flooding. Very high drainage density (1.72–3.73) represents the most extensively drained areas where water is rapidly removed. While this could potentially mitigate flood risk, it also raises concerns about soil erosion and sediment transport. The map revealed a diverse drainage pattern across the study area, with areas of high-density drainage interspersed among zones of lower density. This variation may significantly influence the local flood dynamics, particularly during intense or prolonged rainfall events.
4. Result and Discussion
The study used a weighted overlay analysis to assess the potential flood risk across Riyadh, presenting results through data showcasing diverse susceptibility levels in different areas of the city. The composite flood risk map resulted from overlaying datasets, including the DEM, lithology, precipitation patterns, slope, and drainage density. Prior to the overlay analysis, the layers underwent categorization, weighting, and scoring on a 1–5 scale. Drainage density received the highest weight, followed by elevation, lithology, and slope, with precipitation assigned the least weight (
Table 1).
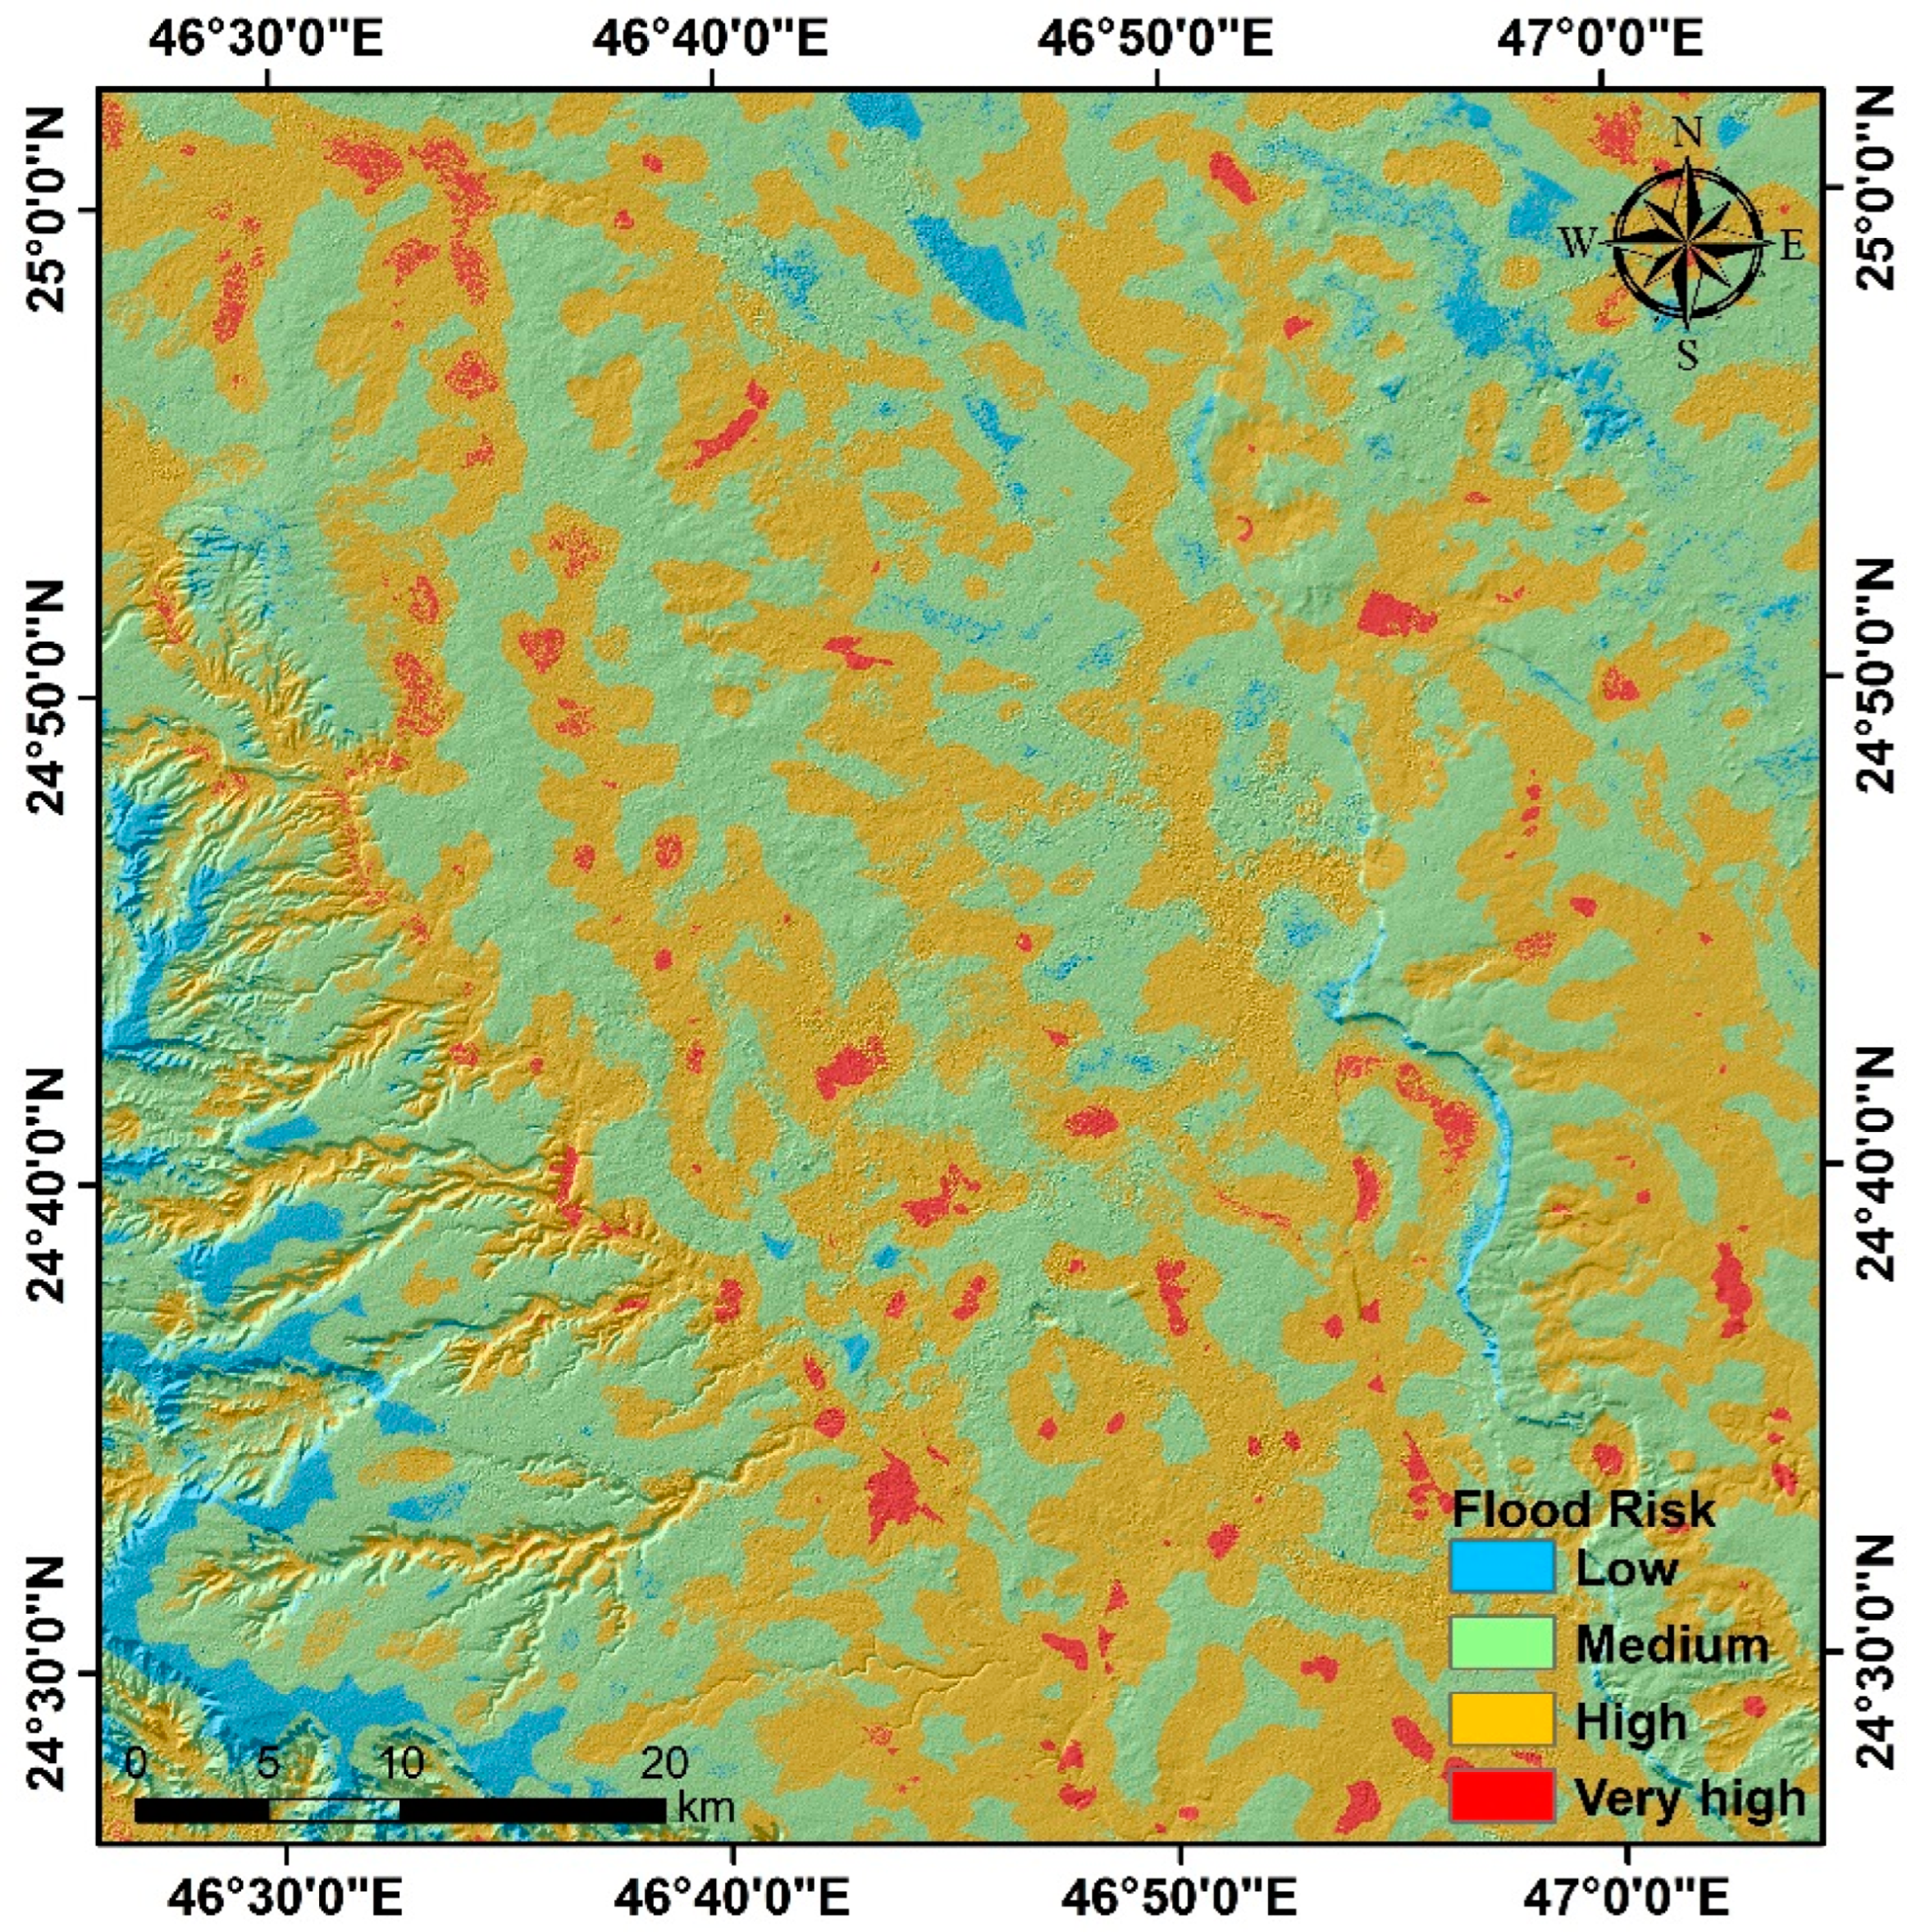
The flood risk map delineates various potential flood zones within Riyadh, classified into four risk levels: low, moderate, high, and very high (
Figure 7). The total study area spans 905 km
2, with 287, 283, 226, and 109 km
2 categorized as low, moderate, high, and very high flood risks areas, respectively.
Areas with low flood risk areas are primarily located in high-elevation regions, which, due to their favorable topography, efficient drainage systems, and relatively low urban density, are less likely to experience flooding.
Moderate flood risk zones typically encompass areas with urban development and open spaces with diverse topographical features. While these areas are not as susceptible to severe flooding as the high-risk areas, they still hold the potential for moderate flooding, particularly during heavy rainfall events.
High and very high flood risk zones are predominantly concentrated in areas with lower elevation. These areas face a greater risk of flooding due to rapid urbanization and insufficient drainage infrastructure, necessitating immediate attention for effective mitigation of the flood risk.
The study’s analysis of the drainage system revealed that regions with a high concentration of wadis experienced fewer instances of flooding. In contrast, densely populated areas with inadequate drainage were more prone to the accumulation of water and flooding. The construction of buildings and roads increases the impervious surfaces, reducing the ground’s natural ability to absorb rainwater, leading to more frequent flooding. The recent urban expansion in Riyadh could exacerbate the risk of flooding, particularly in newly developed urban areas lacking proper flood management considerations. This underscores the importance of integrating flood risk management strategies into urban planning and development processes. Furthermore, the lithological data indicated that regions with less permeable rock types, such as the prevalent limestone in Riyadh, were more susceptible to runoff, leading to flooding during heavy rainfall events. This highlights the need for strategic flood management strategies in regions with such geological characteristics.
Validation
The accuracy of flood risk maps is crucial for assessing potential flood risks, necessitating the validation of the predictive model against real events. This research used a two-step validation process for the flood risk map. The first step involved comparing the map with evidence of past floods observed during initial field trips. The second step consisted of conducting field surveys following a rainfall event, ensuring the practical accuracy of the resulting risk map.
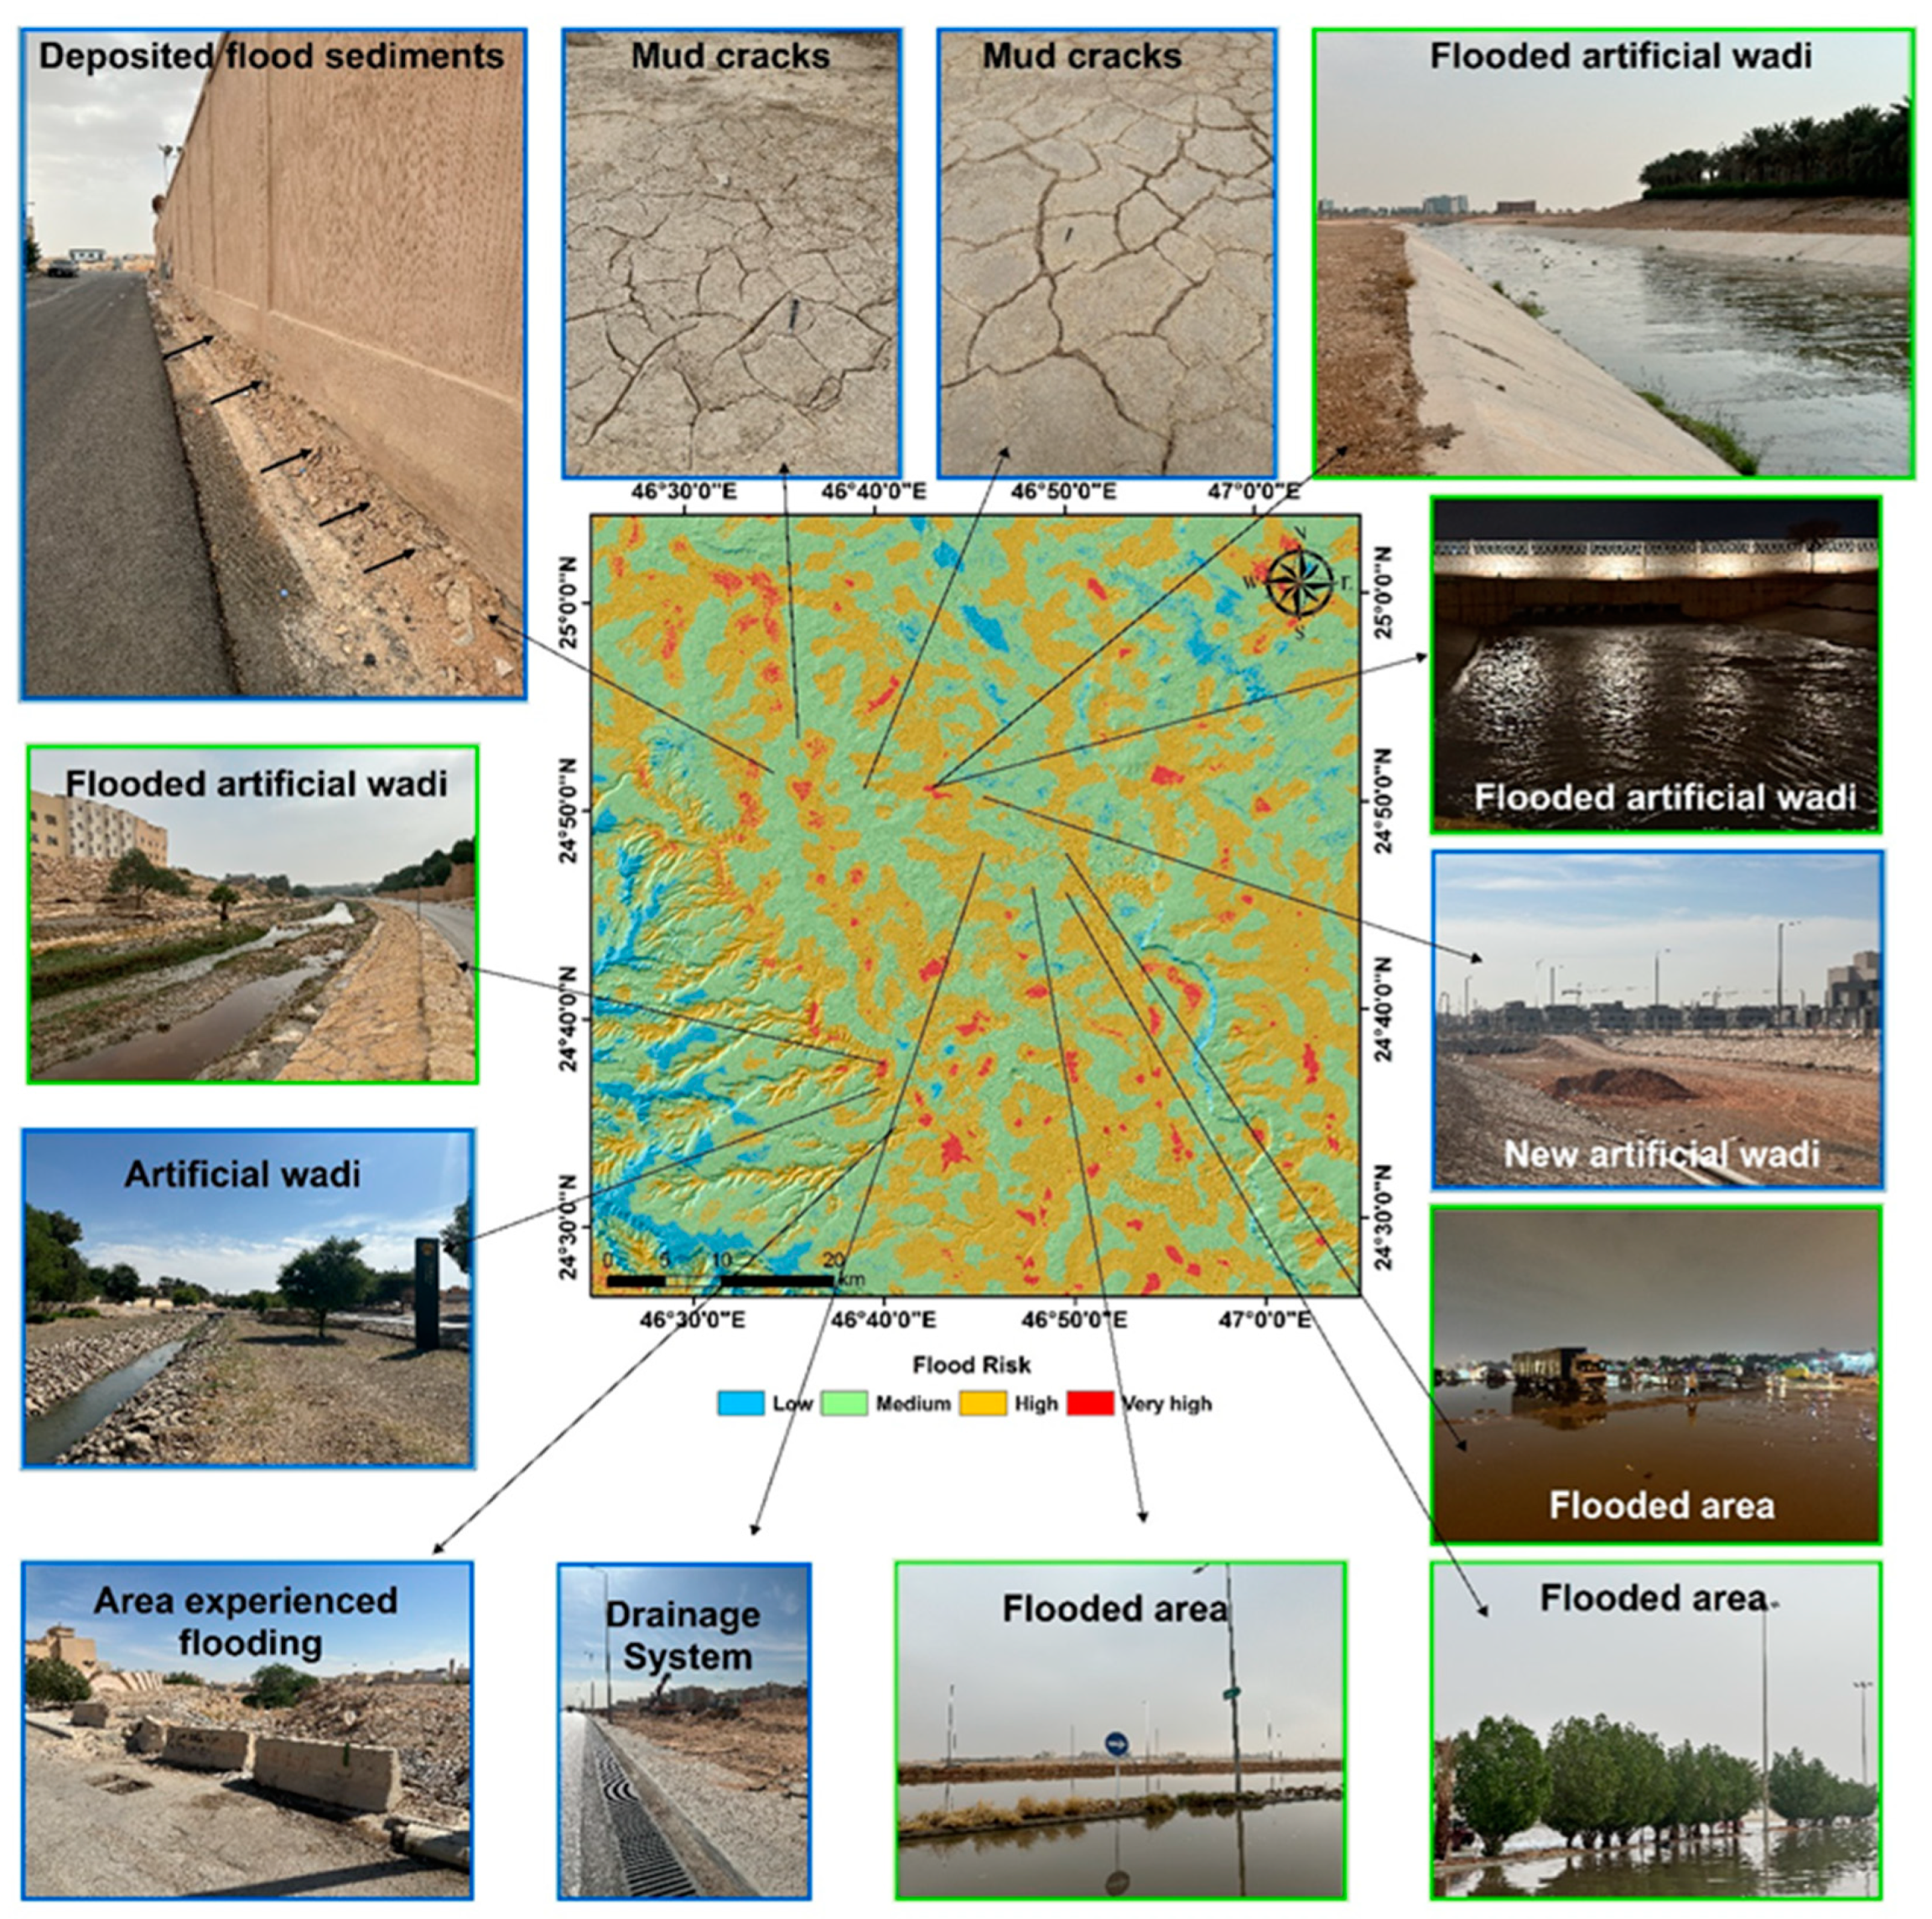
Floods often leave various marks, such as mud cracks, watermarks on buildings, sediment deposits, debris lines, and damage to infrastructure. These marks were analyzed in this study as records of past flood events. Additionally, artificial drainage channels, known as artificial wadis, were identified as measures implemented to protect areas from previous flooding. This evidence of flooding serves to corroborate the map’s predictions with real-world observations.
A second field survey was conducted following a significant rain event. The timing of this survey was critical, as it facilitated the observation of the city’s flooding patterns. This assessment is vital, as areas of water accumulation can be identified immediately after a rain event. During this survey, street flooding was documented, and the observations were analyzed to update the flood risk map. Areas marked as high-risk on the map were closely scrutinized to confirm if they experienced the predicted water accumulation or flooding. Furthermore, the surveys conducted after rain events provided an opportunity for residents to share their accounts and experiences of flooding. All these pieces of evidence and the physical signs of flooding contributed to refining the model and enhancing its precision.
The results from both field surveys were analyzed and compared with the final version of the potential flooding risk map. A correlation was found between the predicted flood-prone regions and the data collected during the surveys. It was observed that there was a strong correlation between the areas marked as being at high and very high risk on the map and the locations where flood incidents had been recorded. This correlation is visually presented in
Figure 8, where the overlay of past and recent flood events on the risk map clearly showed an overlap. This finding validated the effectiveness of this study’s weighted overlay method in identifying flood-prone areas in Riyadh City.
5. Solution for Flood Mitigation
Indeed, the measures taken by policymakers in Riyadh, such as the construction of artificial wadis inspired by natural wadi systems, have significantly mitigated the flood risk in some parts of the city. These strategic constructions effectively protect key urban areas from high flood risks. The integration of these artificial wadis not only reduces the risk of flooding but also enhances the city’s greenery, contributing positively to its esthetic and ecological balance.
Despite the significant progress made in mitigating flood risks, certain parts of Riyadh remain vulnerable to flooding. This study has identified these high-risk areas, providing critical data that can enhance flood management efforts. The insights from this analysis present an opportunity for the city to extend its network of artificial wadis into these newly identified zones, ensuring a more comprehensive and resilient approach to flood management.
The expansion of artificial wadis has been accompanied by efforts to upgrade the existing drainage systems to handle larger volumes of water. The incorporation of innovative technology within these systems facilitates real-time early warning systems for monitoring flood events, which is essential.
The findings of this study are indeed valuable for Riyadh’s efforts to tackle flood risks. The city’s proactive and adaptable approach in certain areas serves as a benchmark for urban planning and disaster mitigation, especially in arid regions prone to such environmental challenges. By implementing the new measures recommended by the study, Riyadh is well positioned to strengthen its defense against flooding and ensure the safety and wellbeing of its communities.
6. Limitations of the Study
While this study provided a comprehensive assessment of flood risk in Riyadh, Saudi Arabia, it had certain limitations. For instance, the study operated under the assumption that current land use and urban development patterns would remain unchanged. However, given Riyadh’s rapid growth and development, this may not be the case. Moreover, the model does not take projections of climate change into account, which could potentially impact the accuracy of predictions of the future flood risk. Changes in the infrastructure, such as the construction of new drainage systems or the implementation of green infrastructure, were also not considered in the study. These factors could significantly affect the flood risk outcomes. These limitations underscore the need for regular updates to the flood risk map and continual refinement of the methodologies used.
7. Conclusions
The study successfully identified potential flood zones in Riyadh City using a weighted overlay analysis. This analysis incorporated various datasets, including digital elevation models, lithology, precipitation patterns, slope, and drainage density. The results of the analysis categorized the risk zones into low, medium, high, and very high risks. The study area encompasses 905 km2. Of this total area, 32% are at a low risk of flooding, while 31%, 24%, and 12% of the area are at a moderate, high, and very high risk of flooding, respectively. The findings were validated through initial field surveys to calibrate the risk map of the area and subsequent field surveys to confirm the reliability of the final risk map. This comprehensive approach to validating the flood risk map ensured that urban planners and disaster management professionals have a reliable, evidence-based resource to mitigate the impact of flooding in Riyadh. Future research should evaluate the risk of flooding in newly developed urban areas in Riyadh City.

