


Understanding Hydrologic, Human, and Climate System Feedback Loops: Results of a Participatory Modeling Workshop
 , ,
, ,
Abstract
1. Introduction
2. Methods
2.1. Participatory Modeling
2.2. Existing Research
2.3. Data Collection and Analysis
3. Results
3.1. Hydrologic Feedback Loops
3.2. Hydrologic–Human Feedback Loops
3.3. Hydrologic–Human–Climate Feedback Loops
3.4. Areas of Convergence, Divergence, and Uncertainties
4. Discussion
4.1. Conceptualizing Complex Problems
4.2. Bridging and Aligning Perspectives
4.3. Informing Future Research
5. Concluding Remarks
Author Contributions
Funding
Institutional Review Board Statement
Data Availability Statement
Acknowledgments
Conflicts of Interest
References
- Siebert, S.; Burke, J.; Faures, J.M.; Frenken, K.; Hoogeveen, J.; Döll, P.; Portmann, F.T. Groundwater Use for Irrigation—A Global Inventory. Hydrol. Earth Syst. Sci. 2010, 14, 1863–1880. [Google Scholar] [CrossRef]
- Jasechko, S.; Perrone, D.; Befus, K.M.; Bayani Cardenas, M.; Ferguson, G.; Gleeson, T.; Luijendijk, E.; McDonnell, J.J.; Taylor, R.G.; Wada, Y.; et al. Global Aquifers Dominated by Fossil Groundwaters but Wells Vulnerable to Modern Contamination. Nat. Geosci. 2017, 10, 425–429. [Google Scholar] [CrossRef]
- Wada, Y.; van Beek, L.P.H.; van Kempen, C.M.; Reckman, J.W.T.M.; Vasak, S.; Bierkens, M.F.P. Global Depletion of Groundwater Resources. Geophys. Res. Lett. 2010, 37, L20402. [Google Scholar] [CrossRef]
- Bierkens, M.F.P.; Wada, Y. Non-Renewable Groundwater Use and Groundwater Depletion: A Review. Environ. Res. Lett. 2019, 14, 063002. [Google Scholar] [CrossRef]
- Jia, X.; Hou, D.; Wang, L.; O’Connor, D.; Luo, J. The Development of Groundwater Research in the Past 40 Years: A Burgeoning Trend in Groundwater Depletion and Sustainable Management. J. Hydrol. 2020, 587, 125006. [Google Scholar] [CrossRef]
- Konikow, L.F.; Kendy, E. Groundwater Depletion: A Global Problem. Hydrogeol. J. 2005, 13, 317–320. [Google Scholar] [CrossRef]
- Lall, U.; Josset, L.; Russo, T. A Snapshot of the World’s Groundwater Challenges. Annu. Rev. Environ. Resour. 2020, 45, 171–194. [Google Scholar] [CrossRef]
- Megdal, S.B. Invisible Water: The Importance of Good Groundwater Governance and Management. Npj Clean Water 2018, 1, 15. [Google Scholar] [CrossRef]
- IGRAC (International Groundwater Resources Assessment Centre); UNESCO-IHP (UNESCO International Hydrological Programme). Transboundary Aquifers of the World, 2015 ed.; Scale 1:50,000; IGRAC: Delft, The Netherlands, 2015. [Google Scholar]
- Tapia-Villaseñor, E.M.; Megdal, S.B. The U.S.-Mexico Transboundary Aquifer Assessment Program as a Model for Transborder Groundwater Collaboration. Water 2021, 13, 530. [Google Scholar] [CrossRef]
- Ganoulis, J.; Fried, J. Transboundary Hydro-Governance: From Conflict to Shared Management; Springer: Cham, Switzerland, 2018; ISBN 978-3-319-78625-4. [Google Scholar]
- Atkins, A.E.P.; Langarudi, S.P.; Fernald, A.G. Modeling as a Tool for Transboundary Aquifer Assessment Prioritization. Water 2021, 13, 2685. [Google Scholar] [CrossRef]
- Sowby, R.B.; Hotchkiss, R.H. Minimizing Unintended Consequences of Water Resources Decisions. J. Water Resour. Plan. Manag. 2022, 148, 02522007. [Google Scholar] [CrossRef]
- Groves, D.G.; Molina-Perez, E.; Bloom, E.; Fischbach, J.R. Robust Decision Making (RDM): Application to Water Planning and Climate Policy. In Decision Making under Deep Uncertainty: From Theory to Practice; Marchau, V.A.W.J., Walker, W.E., Bloemen, P.J.T.M., Popper, S.W., Eds.; Springer International Publishing: Cham, Switzerland, 2019; pp. 135–163. ISBN 978-3-030-05252-2. [Google Scholar]
- Owen, G.; Ferguson, D.B.; McMahan, B. Contextualizing Climate Science: Applying Social Learning Systems Theory to Knowledge Production, Climate Services, and Use-Inspired Research. Clim. Chang. 2019, 157, 151–170. [Google Scholar] [CrossRef]
- Atkins, A.E.P.; Fernaldm, A. Advancing Transboundary Groundwater Resiliency Research through Systems Science. In Hydrological Resources in Transboundary Basins between Mexico and the United States: El Paso del Norte and the Binational Water Governance; Granados Olivas, A., Ed.; Universidad Autónoma de Chihuahua/Universidad Autónoma de Ciudad Juárez Press: Chihuahua, Mexico, 2022; pp. 97–104. ISBN 978-607-536. [Google Scholar]
- Vörösmarty, C.J.; Pahl-Wostl, C.; Bunn, S.E.; Lawford, R. Global Water, the Anthropocene and the Transformation of a Science. Curr. Opin. Environ. Sustain. 2013, 5, 539–550. [Google Scholar] [CrossRef]
- Roque, A.; Wutich, A.; Quimby, B.; Porter, S.; Zheng, M.; Hossain, M.J.; Brewis, A. Participatory Approaches in Water Research: A Review. WIREs Water 2022, 9, e1577. [Google Scholar] [CrossRef]
- National Research Council. Research and Networks for Decision Support in the NOAA Sectoral Applications Research Program; Ingram, H.M., Stern, P.C., Eds.; Committee on the Human Dimensions of Global Change, Division of Behavioral and Social Sciences and Education; National Academies Press: Washington, DC, USA, 2008; p. 27. ISBN 978-0-309-11202-4. [Google Scholar]
- Page, S.E. The Model Thinker: What You Need to Know to Make Data Work for You, 1st ed.; Basic Books: New York, NY, USA, 2018; ISBN 978-0-465-09462-2. [Google Scholar]
- Langarudi, S.P.; Maxwell, C.M.; Bai, Y.; Hanson, A.; Fernald, A. Does Socioeconomic Feedback Matter for Water Models? Ecol. Econ. 2019, 159, 35–45. [Google Scholar] [CrossRef]
- Page, A.; Langarudi, S.P.; Forster-Cox, S.; Fernald, A. A Dynamic Hydro-Socio-Technical Policy Analysis of Transboundary Desalination Development. J. Environ. Account. Manag. 2019, 7, 87–115. [Google Scholar] [CrossRef]
- Voinov, A.; Jenni, K.; Gray, S.; Kolagani, N.; Glynn, P.D.; Bommel, P.; Prell, C.; Zellner, M.; Paolisso, M.; Jordan, R.; et al. Tools and Methods in Participatory Modeling: Selecting the Right Tool for the Job. Environ. Model. Softw. 2018, 109, 232–255. [Google Scholar] [CrossRef]
- Moallemi, E.A.; de Haan, F.J.; Hadjikakou, M.; Khatami, S.; Malekpour, S.; Smajgl, A.; Smith, M.S.; Voinov, A.; Bandari, R.; Lamichhane, P.; et al. Evaluating Participatory Modeling Methods for Co-creating Pathways to Sustainability. Earth’s Future 2021, 9, e2020EF001843. [Google Scholar] [CrossRef]
- Voinov, A.; Kolagani, N.; McCall, M.K.; Glynn, P.D.; Kragt, M.E.; Ostermann, F.O.; Pierce, S.A.; Ramu, P. Modelling with Stakeholders—Next Generation. Environ. Model. Softw. 2016, 77, 196–220. [Google Scholar] [CrossRef]
- Andersen, D.F.; Richardson, G.P.; Vennix, J.A.M. Group Model Building: Adding More Science to the Craft. Syst. Dyn. Rev. 1997, 13, 187–201. [Google Scholar] [CrossRef]
- Vennix, J.A.M. Group Model Building: Facilitating Team Learning Using System Dynamics; J. Wiley: Chichester, UK; New York, NY, USA, 1996; ISBN 978-0-471-95355-5. [Google Scholar]
- Lane, D.C. The Emergence and Use of Diagramming in System Dynamics: A Critical Account. Syst. Res. 2008, 25, 3–23. [Google Scholar] [CrossRef]
- Gkini, C.; Rajah, J.K.; Rodriguez, A.A.; Kopainsky, B. Integrating Diverse Perspectives: Meaning-Making Process in Participatory System Dynamics. In Proceedings of the International Conference of the System Dynamics Society 2022, Frankfurt, Germany, 18–22 July 2022. [Google Scholar]
- Andersen, D.F.; Richardson, G.P. Scripts for Group Model Building. Syst. Dyn. Rev. 1997, 13, 107–129. [Google Scholar] [CrossRef]
- Hovmand, P.S.; Andersen, D.F.; Rouwette, E.; Richardson, G.P.; Rux, K.; Calhoun, A. Group Model-Building ‘Scripts’ as a Collaborative Planning Tool: Scripts as a Collaborative Planning Tool. Syst. Res. 2012, 29, 179–193. [Google Scholar] [CrossRef]
- Zagonel, A.A. Model Conceptualization in Group Model Building: A Review of the Literature Exploring the Tension Between Representing Reality and Negotiating a Social Order. In Proceedings of the International Conference of the System Dynamics Society 2002, Palermo, Italy, 28 July–1 August 2002. [Google Scholar]
- Király, G.; Miskolczi, P. Dynamics of Participation: System Dynamics and Participation-An Empirical Review. Syst. Res. Behav. Sci. 2019, 36, 199–210. [Google Scholar] [CrossRef]
- Khan, H.F.; Yang, Y.C.E.; Xie, H.; Ringler, C. A Coupled Modeling Framework for Sustainable Watershed Management in Transboundary River Basins. Hydrol. Earth Syst. Sci. 2017, 21, 6275–6288. [Google Scholar] [CrossRef]
- Hargrove, W.L.; Heyman, J.M. A Comprehensive Process for Stakeholder Identification and Engagement in Addressing Wicked Water Resources Problems. Land 2020, 9, 119. [Google Scholar] [CrossRef]
- Smajgl, A.; Ward, J.R.; Foran, T.; Dore, J.; Larson, S. Visions, Beliefs, and Transformation: Exploring Cross-Sector and Transboundary Dynamics in the Wider Mekong Region. Ecol. Soc. 2015, 20, 15. [Google Scholar] [CrossRef]
- Basco-Carrera, L.; van Beek, E.; Jonoski, A.; Benítez-Ávila, C.; Guntoro, F.P.J. Collaborative Modelling for Informed Decision Making and Inclusive Water Development. Water Resour. Manag. 2017, 31, 2611–2625. [Google Scholar] [CrossRef]
- Metcalf, S.S.; Wheeler, E.; BenDor, T.K.; Lubinski, K.S.; Hannon, B.M. Sharing the Floodplain: Mediated Modeling for Environmental Management. Environ. Model. Softw. 2010, 25, 1282–1290. [Google Scholar] [CrossRef]
- Tidwell, V.C.; Passell, H.D.; Conrad, S.H.; Thomas, R.P. System Dynamics Modeling for Community-Based Water Planning: Application to the Middle Rio Grande. Aquat. Sci. 2004, 66, 357–372. [Google Scholar] [CrossRef]
- Beall, A.; Fiedler, F.; Boll, J.; Cosens, B. Sustainable Water Resource Management and Participatory System Dynamics. Case Study: Developing the Palouse Basin Participatory Model. Sustainability 2011, 3, 720–742. [Google Scholar] [CrossRef]
- Grigg, N.S. Systemic Analysis of Urban Water Supply and Growth Management. J. Urban Plan. Dev. 1997, 123, 23–33. [Google Scholar] [CrossRef]
- Videira, N.; Antunes, P.; Santos, R. Scoping River Basin Management Issues with Participatory Modelling: The Baixo Guadiana Experience. Ecol. Econ. 2009, 68, 965–978. [Google Scholar] [CrossRef]
- Black, L.J. When Visuals Are Boundary Objects in System Dynamics Work. Syst. Dyn. Rev. 2013, 29, 70–86. [Google Scholar] [CrossRef]
- Black, L.J.; Andersen, D.F. Using Visual Representations as Boundary Objects to Resolve Conflict in Collaborative Model-Building Approaches: Using Visual Representations as Boundary Objects. Syst. Res 2012, 29, 194–208. [Google Scholar] [CrossRef]
- Martin-Ortega, J. We Cannot Address Global Water Challenges without Social Sciences. Nat. Water 2023, 1, 2–3. [Google Scholar] [CrossRef]
- Connelly, S.; Anderson, C. Studying Water: Reflections on the Problems and Possibilities of Interdisciplinary Working. Interdiscip. Sci. Rev. 2007, 32, 213–220. [Google Scholar] [CrossRef]
- Lach, D. Challenges of Interdisciplinary Research: Reconciling Qualitative and Quantitative Methods for Understanding Human–Landscape Systems. Environ. Manag. 2014, 53, 88–93. [Google Scholar] [CrossRef]


| Item | Mean | Std. Dev. |
|---|---|---|
| The introduction to systems thinking and to systems mapping was well explained at the beginning of the workshop. | 4.5 | 0.97 |
| The participants in the workshop are the right group of actors to work on this issue. | 3.7 | 1.06 |
| I would be willing to participate in a similar systems mapping activity in the future. | 4.4 | 0.84 |
| The opportunity for open and extensive discussion was useful. | 4.6 | 0.52 |
| The focus on causal relationships was useful. | 4.1 | 0.99 |
| My understanding of groundwater resilience and the underlying feedback processes has increased due to the mapping process. | 4.0 | 0.94 |
| The mapping process aided me in understanding of the opinions of the other participants. | 4.2 | 1.03 |
| I support the conclusions/findings that were drawn during the mapping process, in general terms. | 3.8 | 1.23 |
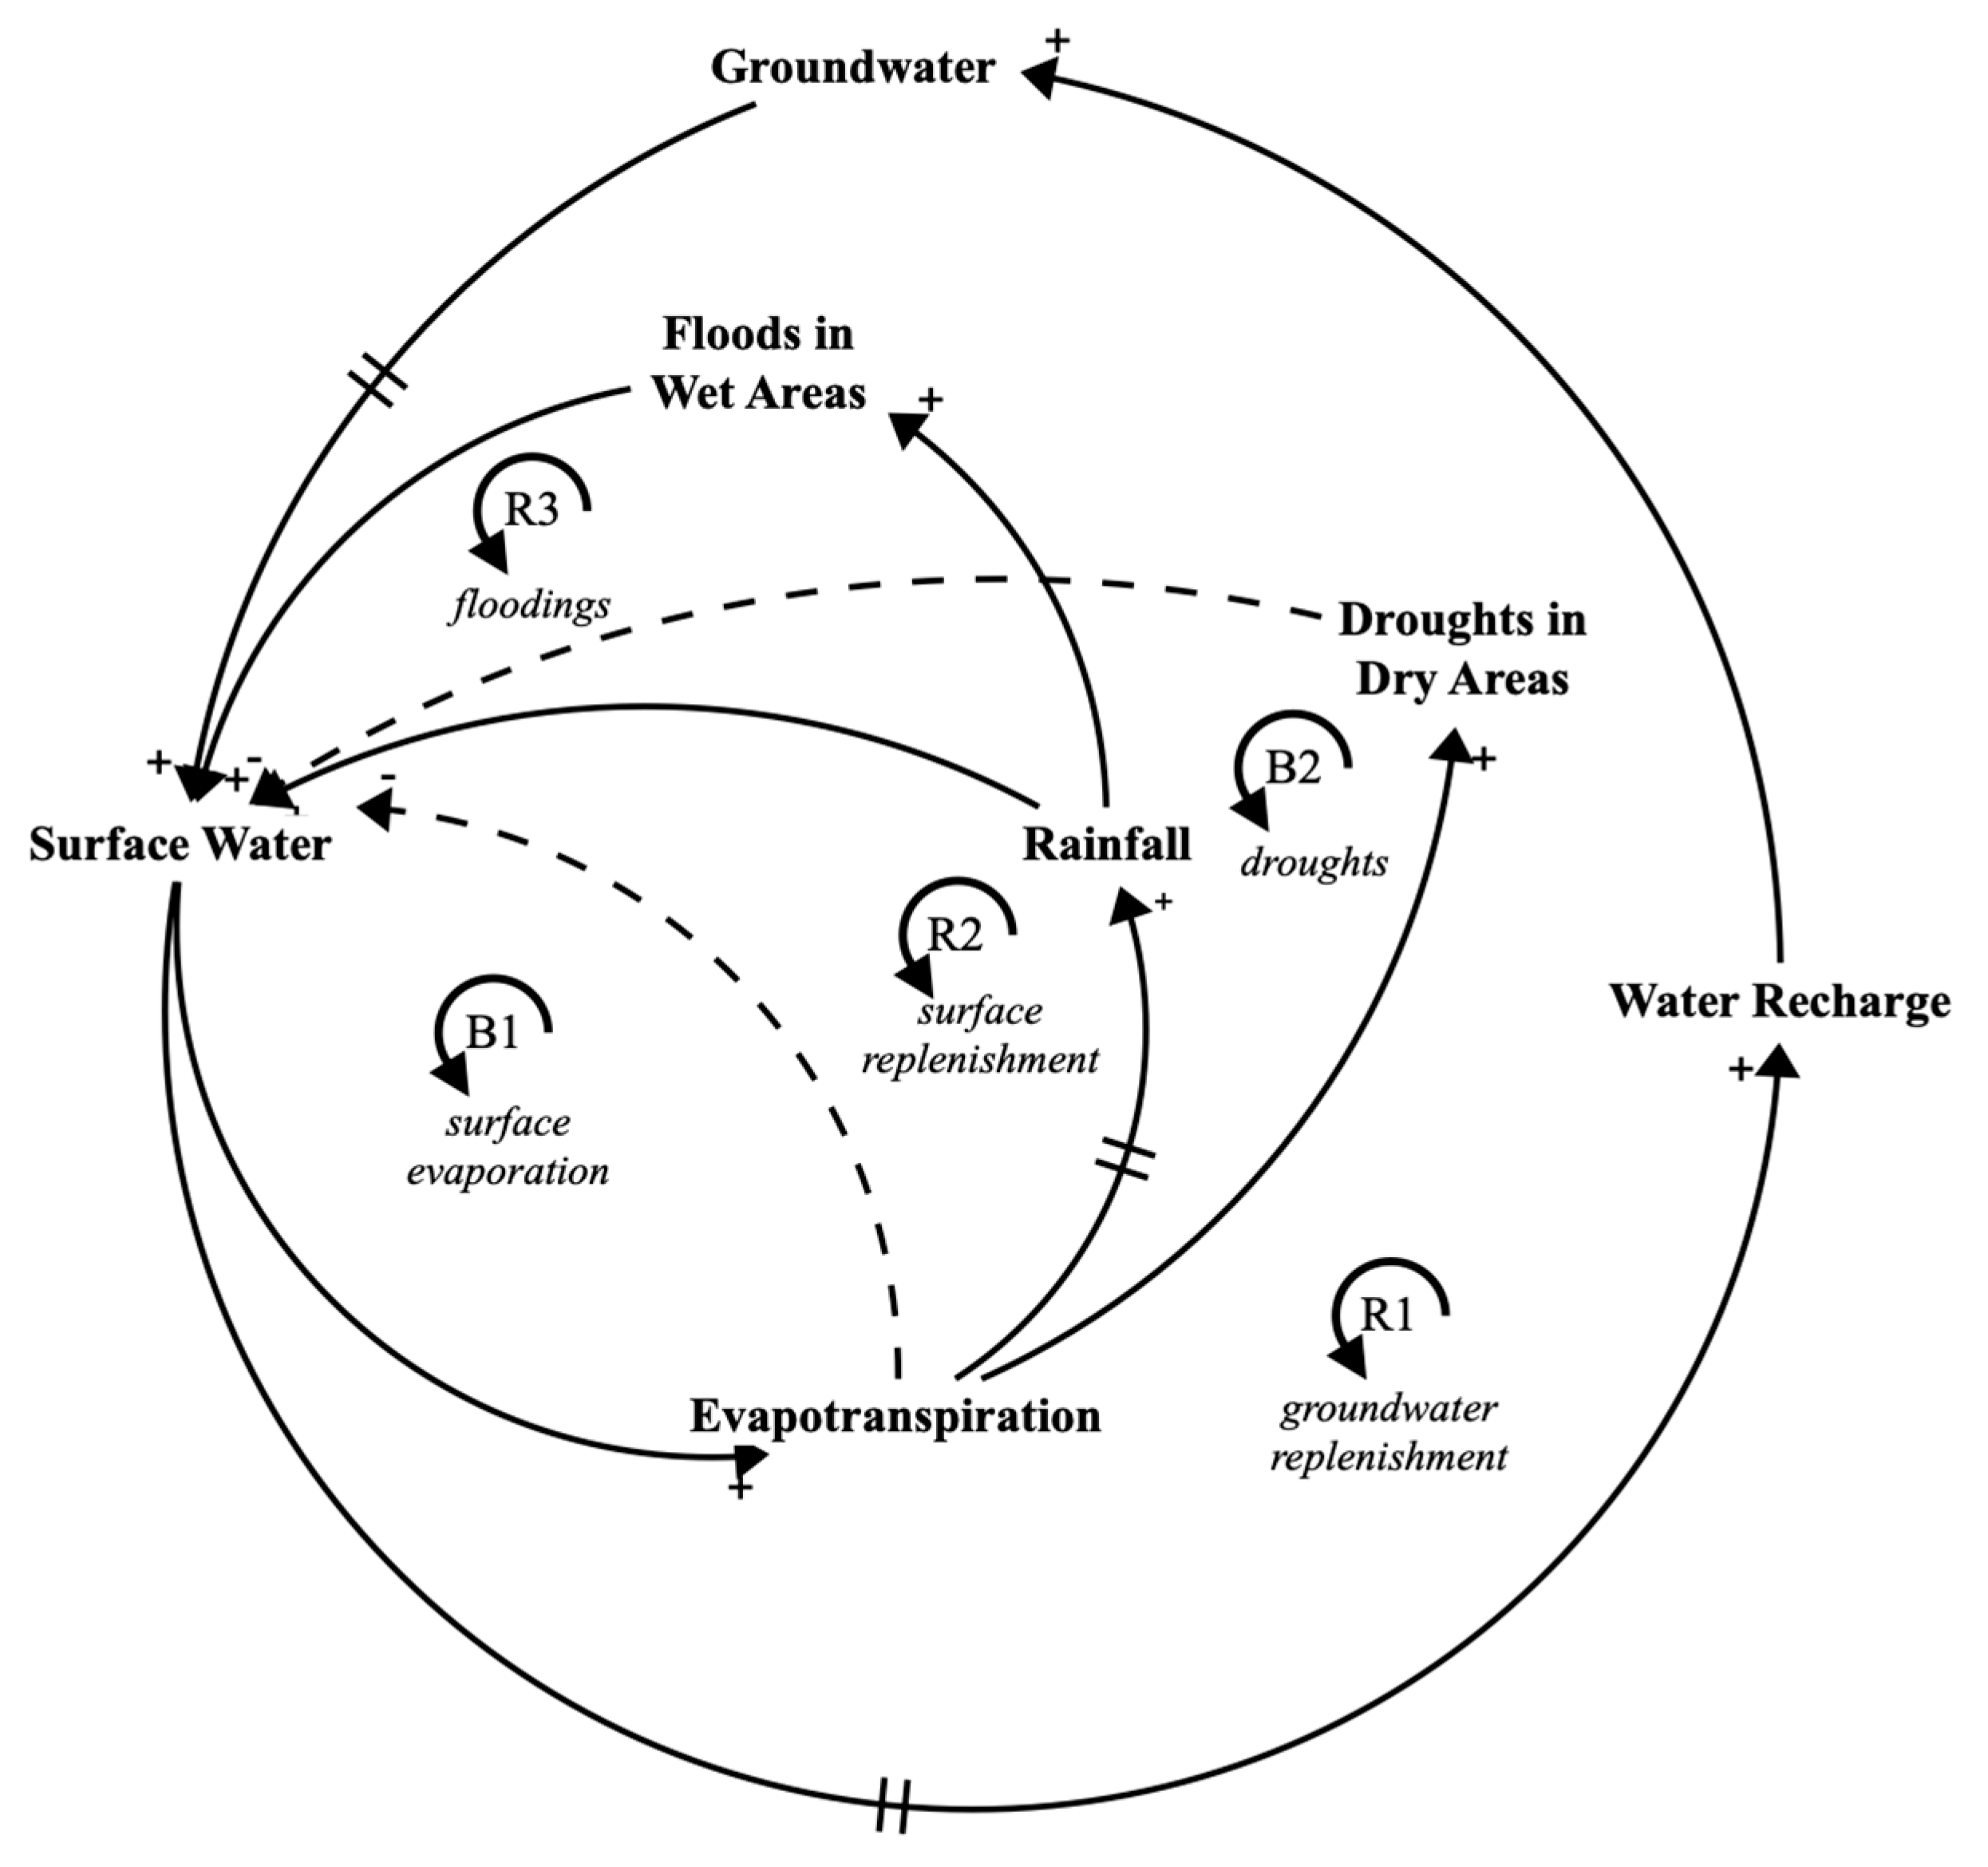
| Description | Label | Causal Pathway |
|---|---|---|
| Groundwater replenishment | R1 | Groundwater → (+) Surface Water → (+) Water Recharge → (+) Groundwater |
| Surface evaporation | B1 | Surface Water → (+) Evapotranspiration → (−) Surface Water |
| Surface replenishment | R2 | Surface Water → (+) Evapotranspiration → (+) Rainfall → (+) Surface Water |
| Flooding | R3 | Surface Water → (+) Evapotranspiration → (+) Rainfall → (+) Floods in Wet Areas → (+) Surface Water |
| Drought | B2 | Surface Water → (+) Evapotranspiration → (+) Drought in Dry Areas → (−) Surface Water |
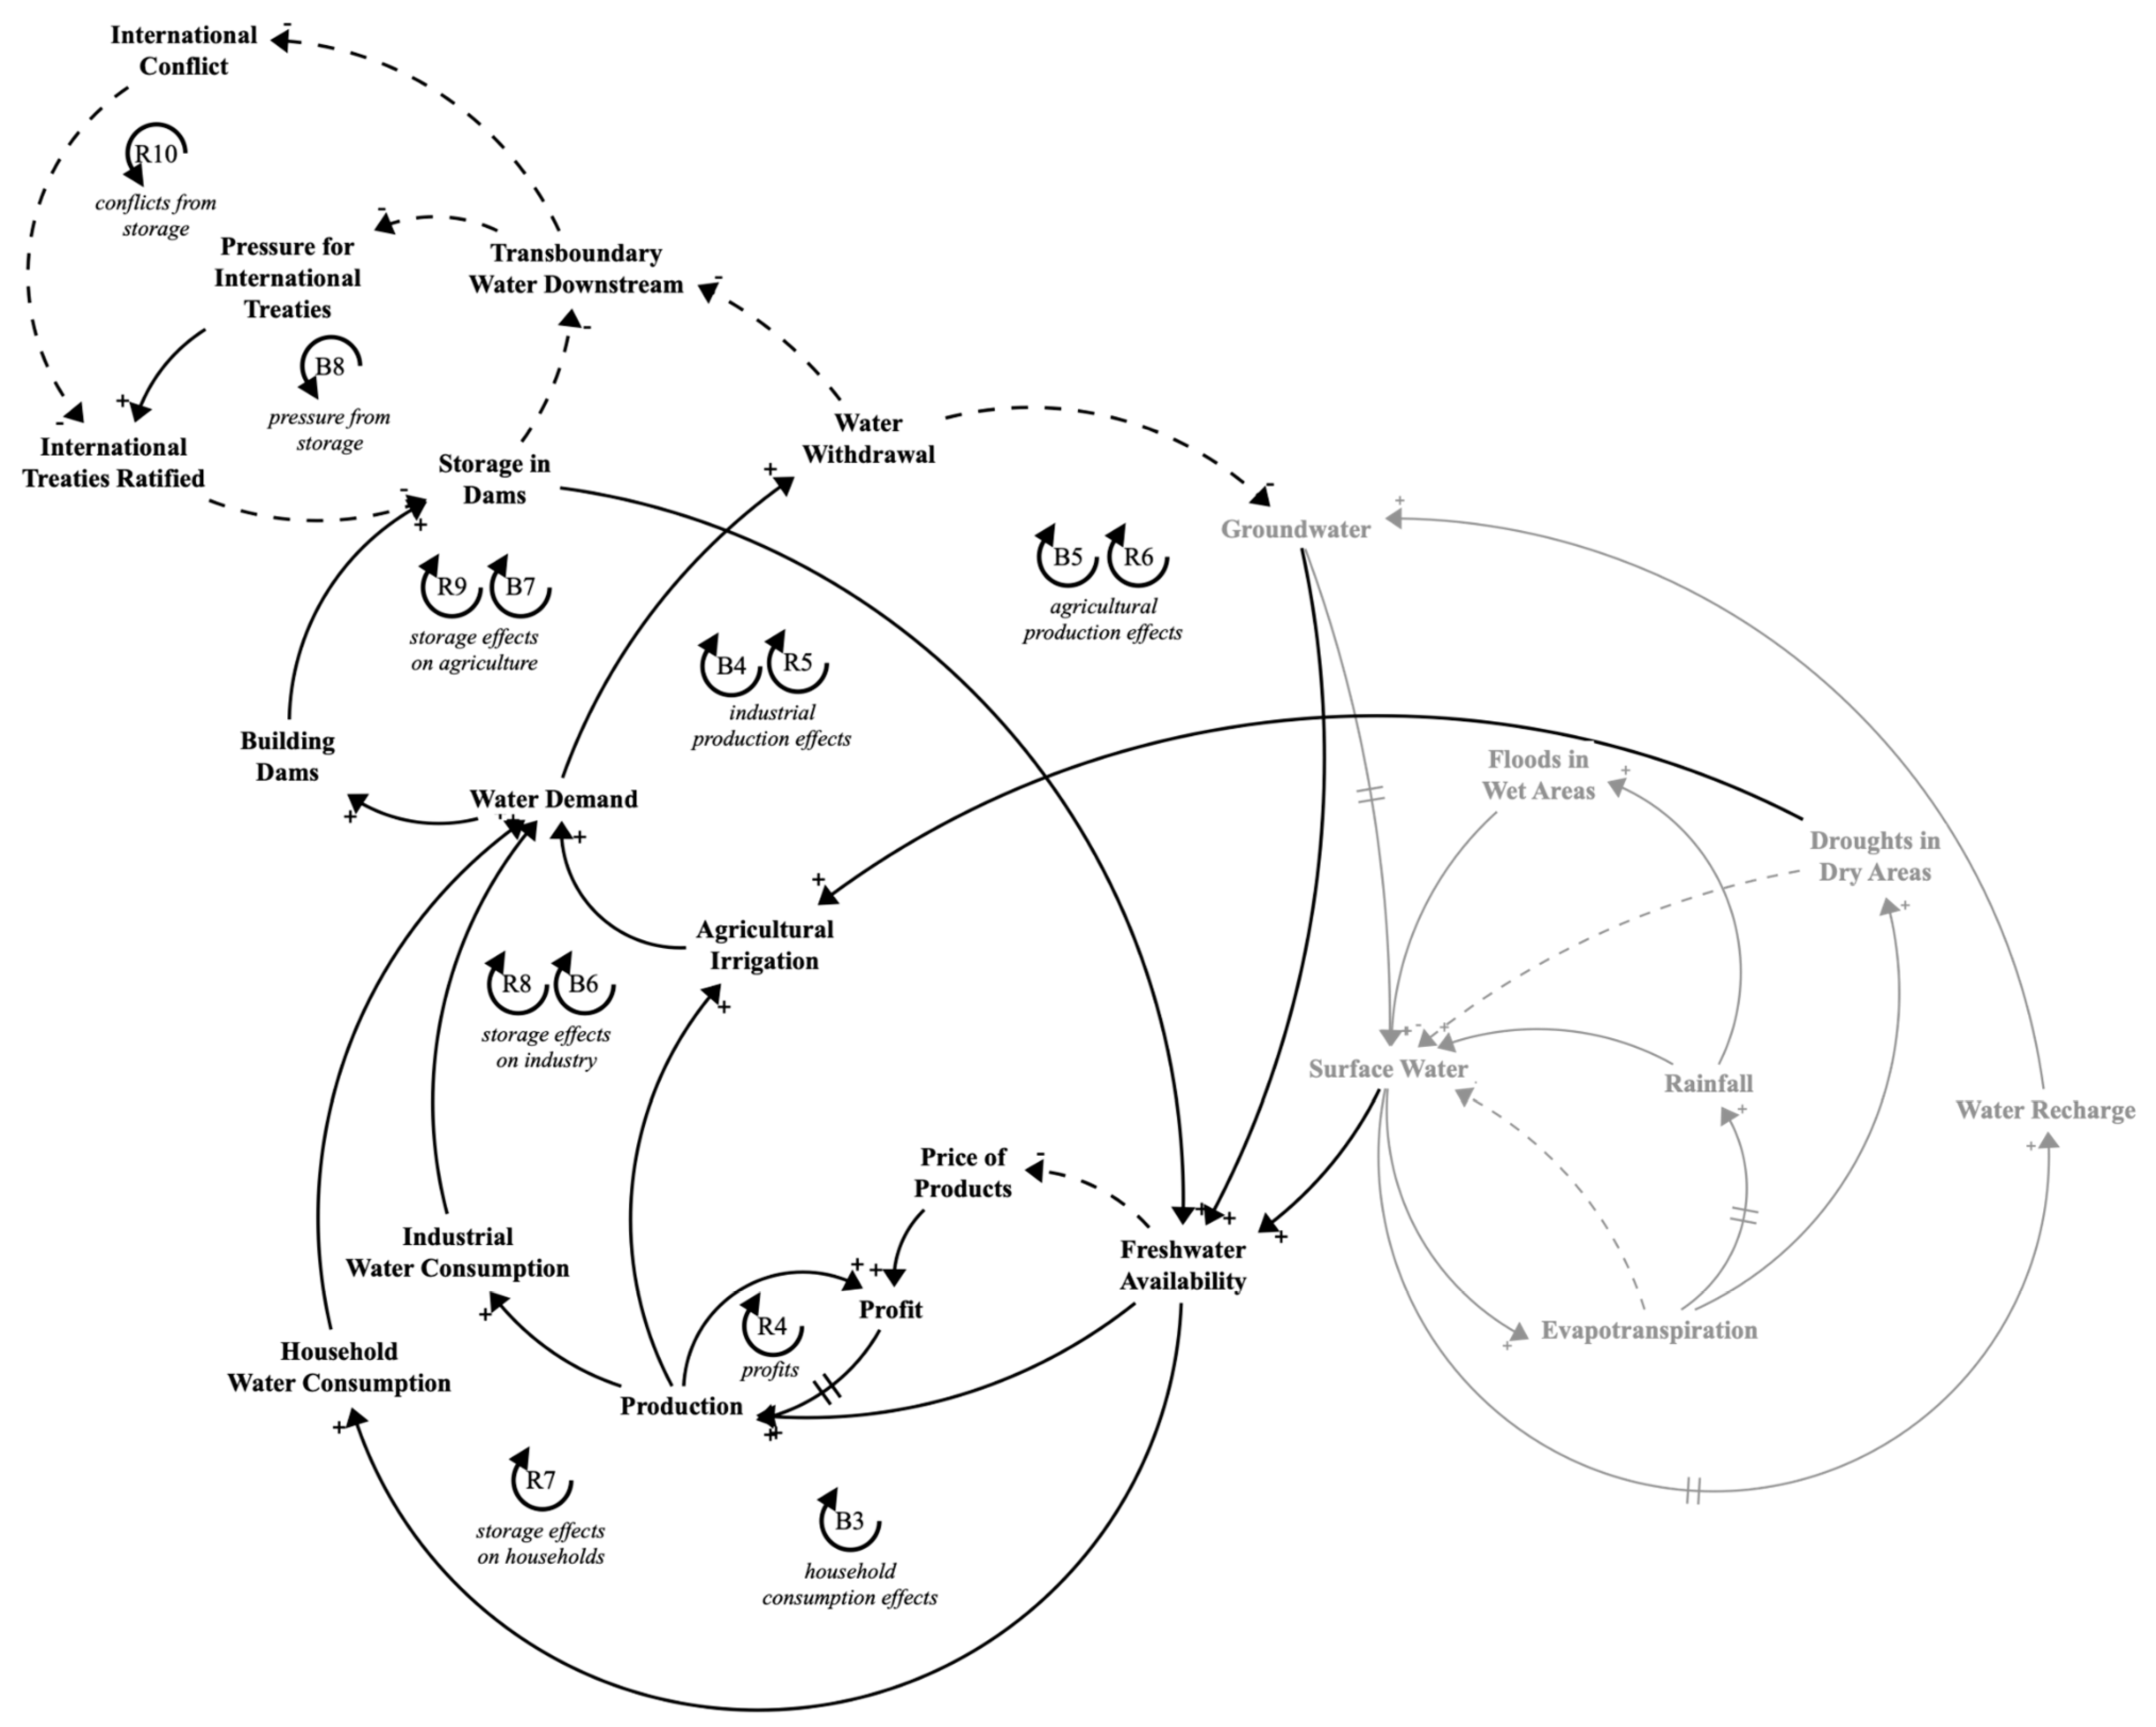
| Description | Label | Causal Pathway |
|---|---|---|
| Household consumption effects | B3 | Freshwater Availability → (+) Household Water Consumption → (+) Water Demand → (+) Water Withdrawal → (−) Groundwater → (+) Freshwater Availability |
| Profits | R4 | Production → (+) Profits → (+) Production |
| Industrial production effects | B4 | Freshwater Availability → (+) Production → (+) Industrial Water Consumption → (+) Water Demand → (+) Water Withdrawal → (−) Groundwater → (+) Freshwater Availability |
| R5 | Freshwater Availability → (−) Price of Products → (+) Profit → (+) Production → (+) Industrial Water Consumption → (+) Water Demand → (+) Water Withdrawal → (−) Groundwater → (+) Freshwater Availability | |
| Agricultural production effects | B5 | Freshwater Availability → (+) Production → (+) Agricultural Irrigation → (+) Water Demand → (+) Water Withdrawal → (−) Groundwater → (+) Freshwater Availability |
| R6 | Freshwater Availability → (−) Price of Products → (+) Profit → (+) Production → (+) Agricultural Irrigation → (+) Water Demand → (+) Water Withdrawal → (−) Groundwater → (+) Freshwater Availability | |
| Storage effects on households | R7 | Water demand → (+) Building Dams → (+) Storage in Dams → (+) Freshwater Availability → (+) Household Water Consumption → (+) Water Demand |
| Storage effects on industry | R8 | Water demand → (+) Building Dams → (+) Storage in Dams → (+) Freshwater Availability → (+) Production → (+) Industrial Water Consumption → (+) Water Demand |
| B6 | Water demand → (+) Building Dams → (+) Storage in Dams → (+) Freshwater Availability → (−) Price of Products → (+) Profit → (+) Production → (+) Industrial Water Consumption → (+) Water Demand | |
| Storage effects on agriculture | R9 | Water demand → (+) Building Dams → (+) Storage in Dams → (+) Freshwater Availability → (+) Production → (+) Agricultural Irrigation → (+) Water Demand |
| B7 | Water demand → (+) Building Dams → (+) Storage in Dams → (+) Freshwater Availability → (−) Price of Products → (+) Profit → (+) Production → (+) Agricultural Irrigation → (+) Water Demand | |
| Pressure from storage | B8 | Storage in Dams → (−) Transboundary Water Downstream → (−) Pressure for International Treaties → (+) International Treaties Ratified → (−) Storage in Dams |
| Conflicts from storage | R10 | Storage in Dams → (−) Transboundary Water Downstream → (−) International Conflict → (−) International Treaties Ratified → (−) Storage in Dams |
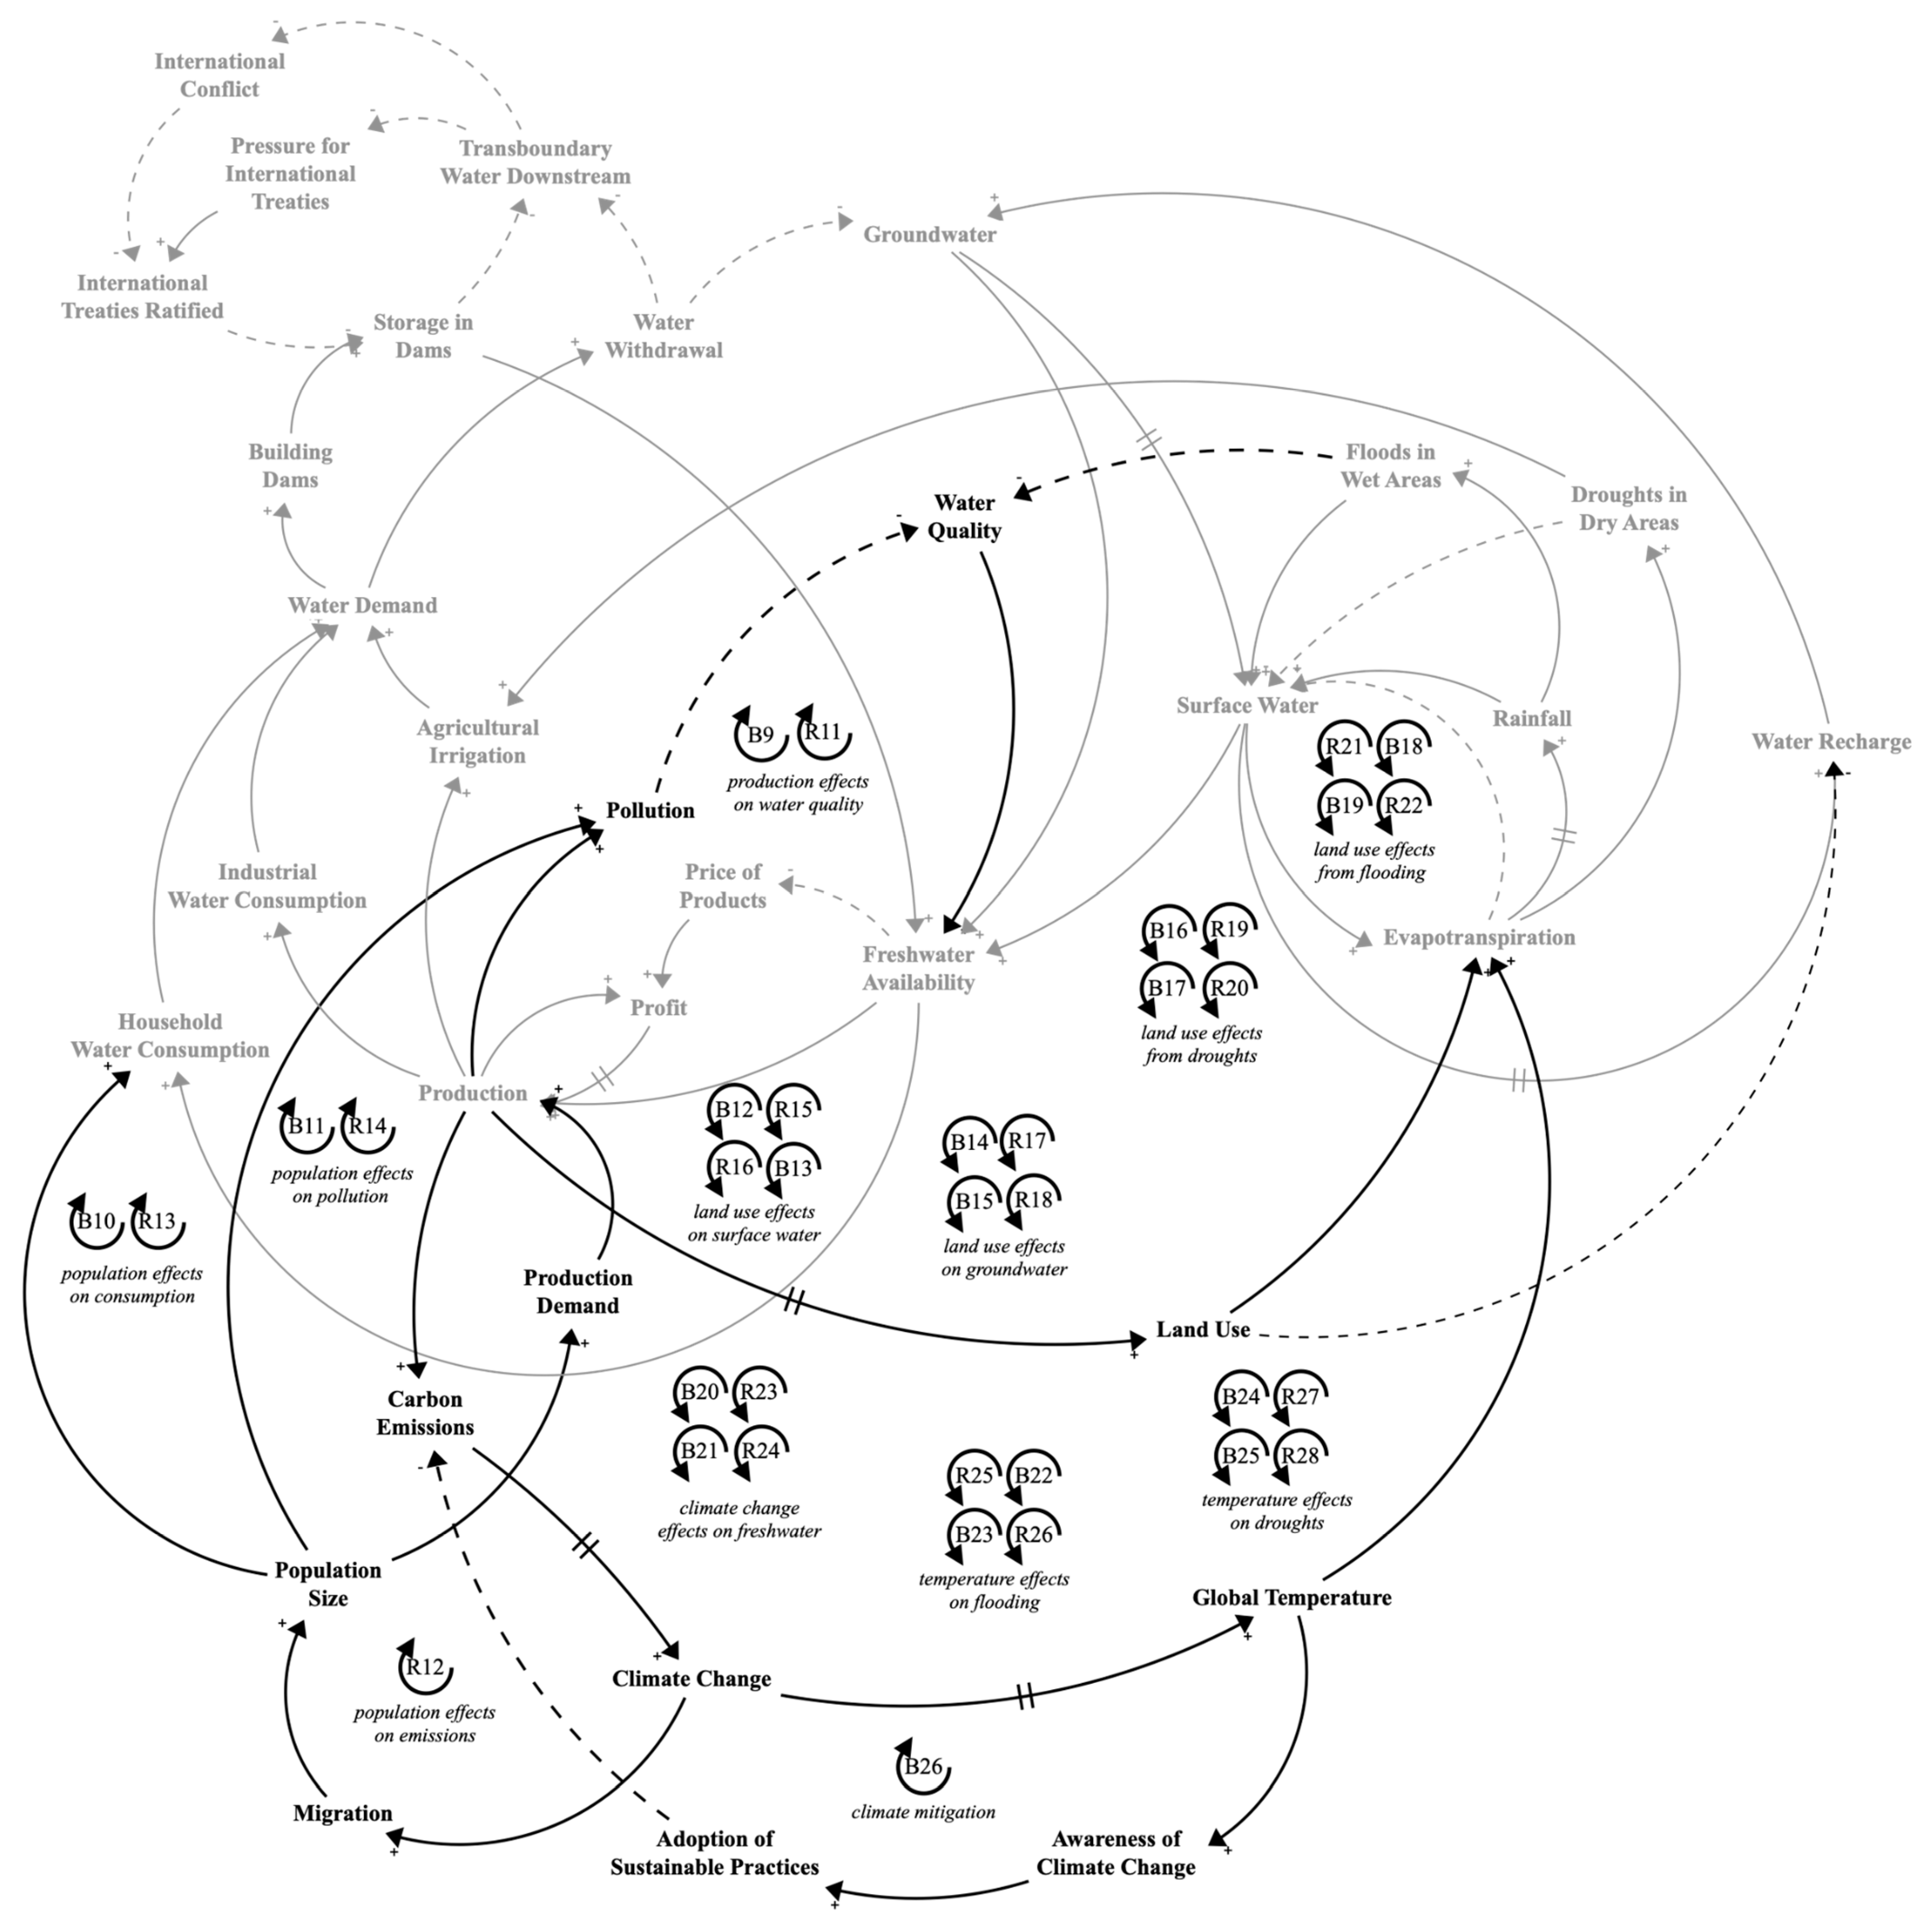
| Description | Label | Causal Pathway |
|---|---|---|
| Production effects on water quality | B9 | Freshwater Availability → (+) Production → (+) Pollution → (−) Water Quality → (+) Freshwater Availability |
| R11 | Freshwater Availability → (−) Price of Products → (+) Profit → (+) Production → (+) Pollution → (−) Water Quality → (+) Freshwater Availability | |
| Population effects on emissions | R12 | Carbon Emissions → (+) Climate Change → (+) Migration → (+) Population Size → (+) Production Demand → (+) Production → (+) Carbon Emissions |
| Population effects on consumption | B10 | Climate Change → (+) Migration → (+) Population Size → (+) Household Water Consumption → (+) Water Demand → (+) Water Withdrawal → (−) Groundwater → (+) Freshwater Availability → (+) Production → (+) Carbon Emissions → (+) Climate Change |
| R13 | Climate Change → (+) Migration → (+) Population Size → (+) Household Water Consumption → (+) Water Demand → (+) Water Withdrawal → (−) Groundwater → (+) Freshwater Availability → (−) Price of Products → (+) Profit → (+) Production → (+) Carbon Emissions → (+) Climate Change | |
| Population effects on pollution | B11 | Climate Change → (+) Migration → (+) Population Size → (+) Pollution → (−) Water Quality → (+) Freshwater Availability → (+) Production → (+) Carbon Emissions → (+) Climate Change |
| R14 | Climate Change → (+) Migration → (+) Population Size → (+) Pollution → (−) Water Quality → (+) Freshwater Availability → (−) Price of Products → (+) Profit → (+) Production → (+) Carbon Emissions → (+) Climate Change | |
| Land use effects on surface water | B12 | Land Use → (+) Evapotranspiration → (−) Surface Water → (+) Freshwater Availability → (+) Production → (+) Land Use |
| R15 | Land Use → (+) Evapotranspiration → (−) Surface Water → (+) Freshwater Availability → (−) Price of Products → (+) Profit → (+) Production → (+) Land Use | |
| R16 | Land Use → (+) Evapotranspiration → (+) Rainfall → (+) Surface Water → (+) Freshwater Availability → (+) Production → (+) Land Use | |
| B13 | Land Use → (+) Evapotranspiration → (+) Rainfall → (+) Surface Water → (+) Freshwater Availability → (−) Price of Products → (+) Profit → (+) Production → (+) Land Use | |
| Land use effects on groundwater | B14 | Land Use → (+) Evapotranspiration → (−) Surface Water → (+) Water Recharge → (+) Groundwater → (+) Freshwater Availability → (+) Production → (+) Land Use |
| R17 | Land Use → (+) Evapotranspiration → (−) Surface Water → (+) Water Recharge → (+) Groundwater → (+) Freshwater Availability → (−) Price of Products → (+) Profit → (+) Production → (+) Land Use | |
| B15 | Land Use → (−) Water Recharge → (+) Groundwater → (+) Freshwater Availability → (+) Production → (+) Land Use | |
| R18 | Land Use → (−) Water Recharge → (+) Groundwater → (+) Freshwater Availability → (−) Price of Products → (+) Profit → (+) Production → (+) Land Use | |
| Land use effects from droughts | B16 | Land Use → (+) Evapotranspiration → (+) Droughts in Dry Areas → (−) Surface Water → (+) Freshwater Availability → (+) Production → (+) Land Use |
| R19 | Land Use → (+) Evapotranspiration → (+) Droughts in Dry Areas → (−) Surface Water → (+) Freshwater Availability → (−) Price of Products → (+) Profit → (+) Production → (+) Land Use | |
| B17 | Land Use → (+) Evapotranspiration → (+) Droughts in Dry Areas → (+) Agricultural Irrigation → (+) Water Demand → (+) Water Withdrawal → (−) Groundwater → (+) Freshwater Availability → (+) Production → (+) Land Use | |
| R20 | Land Use → (+) Evapotranspiration → (+) Droughts in Dry Areas → (+) Agricultural Irrigation → (+) Water Demand → (+) Water Withdrawal → (−) Groundwater → (+) Freshwater Availability Price of Products → (+) Profit → (+) Production → (+) Land Use | |
| Land use effects from flooding | R21 | Land Use → (+) Evapotranspiration → (+) Rainfall → (+) Floods in Wet Areas → (+) Surface Water → (+) Freshwater Availability → (+) Production → (+) Land Use |
| B18 | Land Use → (+) Evapotranspiration → (+) Rainfall → (+) Floods in Wet Areas → (+) Surface Water → (+) Freshwater Availability → (−) Price of Products → (+) Profit → (+) Production → (+) Land Use | |
| B19 | Land Use → (+) Evapotranspiration → (+) Rainfall → (+) Floods in Wet Areas → (−) Water Quality → (+) Freshwater Availability → (+) Production → (+) Land Use | |
| R22 | Land Use → (+) Evapotranspiration → (+) Rainfall → (+) Floods in Wet Areas → (−) Water Quality → (+) Freshwater Availability → (−) Price of Products → (+) Profit → (+) Production → (+) Land Use | |
| Climate change effects on freshwater | B20 | Climate Change → (+) Global Temperature → (+) Evapotranspiration → (−) Surface Water → (+) Freshwater Availability → (+) Production → (+) Carbon Emissions → (+) Climate Change |
| R23 | Climate Change → (+) Global Temperature → (+) Evapotranspiration → (−) Surface Water → (+) Freshwater Availability → (−) Price of Products → (+) Profit → (+) Production → (+) Carbon Emissions → (+) Climate Change | |
| B21 | Climate Change → (+) Global Temperature → (+) Evapotranspiration → (−) Surface Water → (+) Water Recharge → (+) Groundwater → (+) Freshwater Availability → (+) Production → (+) Carbon Emissions → (+) Climate Change | |
| R24 | Climate Change → (+) Global Temperature → (+) Evapotranspiration → (−) Surface Water → (+) Water Recharge → (+) Groundwater → (+) Freshwater Availability → (−) Price of Products → (+) Profit → (+) Production → (+) Carbon Emissions → (+) Climate Change | |
| Temperature effects on flooding | R25 | Climate Change → (+) Global Temperature → (+) Evapotranspiration → (+) Rainfall → (+) Floods in Wet Areas → (+) Surface Water → (+) Freshwater Availability → (+) Production → (+) Carbon Emissions → (+) Climate Change |
| B22 | Climate Change → (+) Global Temperature → (+) Evapotranspiration → (+) Rainfall → (+) Floods in Wet Areas → (+) Surface Water → (+) Freshwater Availability → (−) Price of Products → (+) Profit → (+) Production → (+) Carbon Emissions → (+) Climate Change | |
| B23 | Climate Change → (+) Global Temperature → (+) Evapotranspiration → (+) Rainfall → (+) Floods in Wet Areas → (−) Water Quality → (+) Freshwater Availability → (+) Production → (+) Carbon Emissions → (+) Climate Change | |
| R26 | Climate Change → (+) Global Temperature → (+) Evapotranspiration → (+) Rainfall → (+) Floods in Wet Areas → (−) Water Quality → (+) Freshwater Availability → (−) Price of Products → (+) Profit → (+) Production → (+) Carbon Emissions → (+) Climate Change | |
| Temperature effects on droughts | B24 | Climate Change → (+) Global Temperature → (+) Evapotranspiration → (+) Droughts in Dry Areas → (−) Surface Water → (+) Freshwater Availability → (+) Production → (+) Carbon Emissions → (+) Climate Change |
| R27 | Climate Change → (+) Global Temperature → (+) Evapotranspiration → (+) Droughts in Dry Areas → (−) Surface Water → (+) Freshwater Availability → (−) Price of Products → (+) Profit → (+) Production → (+) Carbon Emissions → (+) Climate Change | |
| B25 | Climate Change → (+) Global Temperature → (+) Evapotranspiration → (+) Droughts in Dry Areas → (+) Agricultural Irrigation → (+) Water Demand → (+) Water Withdrawal → (−) Groundwater → (+) Freshwater Availability → (+) Production → (+) Carbon Emissions → (+) Climate Change | |
| R28 | Climate Change → (+) Global Temperature → (+) Evapotranspiration → (+) Droughts in Dry Areas → (+) Agricultural Irrigation → (+) Water Demand → (+) Water Withdrawal → (−) Groundwater → (+) Freshwater Availability Price of Products → (+) Profit → (+) Production → (+) Carbon Emissions → (+) Climate Change | |
| Climate mitigation | B26 | Climate Change → (+) Global Temperature → (+) Awareness of Climate Change → (+) Adoption of Sustainable Practices → (−) Carbon Emissions → (+) Climate Change |
Disclaimer/Publisher’s Note: The statements, opinions and data contained in all publications are solely those of the individual author(s) and contributor(s) and not of MDPI and/or the editor(s). MDPI and/or the editor(s) disclaim responsibility for any injury to people or property resulting from any ideas, methods, instructions or products referred to in the content. |
© 2024 by the authors. Licensee MDPI, Basel, Switzerland. This article is an open access article distributed under the terms and conditions of the Creative Commons Attribution (CC BY) license (https://creativecommons.org/licenses/by/4.0/).
Share and Cite
Rajah, J.K.; Atkins, A.E.P.; Tang, C.; Bax, K.; Wilkerson, B.; Fernald, A.G.; Langarudi, S.P. Understanding Hydrologic, Human, and Climate System Feedback Loops: Results of a Participatory Modeling Workshop. Water 2024, 16, 396. https://doi.org/10.3390/w16030396
Rajah JK, Atkins AEP, Tang C, Bax K, Wilkerson B, Fernald AG, Langarudi SP. Understanding Hydrologic, Human, and Climate System Feedback Loops: Results of a Participatory Modeling Workshop. Water. 2024; 16(3):396. https://doi.org/10.3390/w16030396
Chicago/Turabian StyleRajah, Jefferson K., Ashley E. P. Atkins, Christine Tang, Kathelijne Bax, Brooke Wilkerson, Alexander G. Fernald, and Saeed P. Langarudi. 2024. "Understanding Hydrologic, Human, and Climate System Feedback Loops: Results of a Participatory Modeling Workshop" Water 16, no. 3: 396. https://doi.org/10.3390/w16030396
APA StyleRajah, J. K., Atkins, A. E. P., Tang, C., Bax, K., Wilkerson, B., Fernald, A. G., & Langarudi, S. P. (2024). Understanding Hydrologic, Human, and Climate System Feedback Loops: Results of a Participatory Modeling Workshop. Water, 16(3), 396. https://doi.org/10.3390/w16030396