Article

Where Is the Path to Sustainable Marine Development? Evaluation and Empirical Analysis of the Synergy between Marine Carrying Capacity and Marine Economy High-Quality Development

1
School of Geography Science, Liaoning Normal University, Dalian 116029, China
2
Center for Studies of Marine Economy and Sustainable Development, Liaoning Normal University, Dalian 116029, China
3
Institute of Marine Sustainable Development, Liaoning Normal University, Dalian 116029, China
*
Authors to whom correspondence should be addressed.
Water 2024, 16(3), 394; https://doi.org/10.3390/w16030394
Submission received: 26 December 2023 / Revised: 20 January 2024 / Accepted: 23 January 2024 / Published: 24 January 2024
(This article belongs to the Special Issue Marine Bearing Capacity and Economic Growth)

Abstract

:
Enhancing the marine carrying capacity (MCC) is of important value in hastening the transformation of the marine economy and realising the marine economy high-quality development (MEHD). We explore the synergistic mechanism between the MCC and MEHD and its comprehensive indicator system, measure the synergistic relationship between China’s MCC and MEHD from 2006 to 2020 using the improved TOPSIS model and the composite system synergism model, and explore the influencing factors and their interactions using geographic probes. The research findings are (1) that China’s MCC and MEHD show a growing trend during the study period, in which marine green development is at a higher level and the cultivation of marine knowledge improves most significantly, but the general value of the MEHD is relatively low. (2) In terms of the synergistic relationship, the degree of ordering of the two shows a sustained rising trend, and the degree of ordering of the marine economy development as a whole is higher than the MCC; the degree of synergy is increasing, but the general value of synergistic development is low. (3) The main factors driving the MCC and MEHD are the marine consumption capacity, the marine opening, and the marine industrial structure; the explanatory power of most factor interactions tends to decrease, and the explanatory power of the interactions among the development of land-based economy, the marine industry structure, and the marine economy increase, and the impacts of the different factor interactions on the synergistic development are all greater than the factors. The influence of different factors on synergistic development is greater than the influence of each factor alone.

1. Introduction

Since the reform and opening up, China’s rapid development of its marine economy, in order to achieve the goal of building a strong marine power, has laid a strong economic foundation [1]. However, it should also be seen that the advantages of resource endowment, changes in the demand structure, and the development of scientific and technological progress and other situations have been formed. The rapid expansion of the marine economy and the increase in the intensity of marine exploitation and utilisation have occurred [2]. The marine economy results in the over-exploitation of the coastal beaches and mudflats, and the scale of the reclamation, the reduction of the shallow marine biological resources, environmental pollution, and ecological damage are too large. The deterioration of the quality of nearshore seawater has led to other negative effects, which has aroused the attention of scholars and decision-makers, who are highly concerned about the overloading of marine resources and the environment [3]. As a quantitative indicator reflecting the ability of sustainable development of the marine human–land relationship, the MCC is an important basis for the judgement of marine cyclic development [4]. The MCC and the high quality of the marine economy have a mutually reinforcing role [5], and the study of the synergy between the MCC and the high-quality marine economy is of great practical significance for promoting the high-quality development of China’s marine economy and building a strong marine country [6].
Currently, academics have studied the issue of the MCC from different perspectives. At the level of theoretical analysis, the concept of the MCC was first proposed and defined by Di [7], and it “refers to the ability or limit of the ocean to support the coordinated development of population, environment and economy within a certain period of time with the principle of sustainable use of marine resources and non-destruction of marine ecosystems, and through self-sustainability and self-regulation under the material standard of living in conformity with the social and cultural norms of the current stage”. Later, many scholars have supplemented and improved its connotation [8,9] and explored its relationship, including the layout of marine industries and marine ecological compensation from a theoretical perspective [10,11,12]. At the level of empirical research, with the continuous improvement of the theoretical basis of the MCC, research has begun to transition from theory to empirical evidence, and academics have begun to try to borrow the more mature models and mathematical methods of analysis in the study of ecological carrying capacity and strive to construct the corresponding indicator system to quantitatively evaluate the MCC using the state space method [13,14], entropy [15], the fuzzy comprehensive judgement method [16], the projection tracing model [17], and so on. Some scholars combine the MCC with marine economic development and try to borrow quantitative mathematical models to explore the intrinsic connection between the two. Yu et al. [18], from the perspective of the MCC, used factor analysis to study the rationality of the spatial layout of the marine fishery, optimisation criteria, adaptive optimisation, and other issues. Shan et al. [19] studied the strategic choice of coastal tourism in China from the perspective of the MCC using hierarchical analysis and factor analysis.
For the research on marine economy, foreign countries focus on measuring the contribution of the marine economy to the national economy [20,21], the efficiency of the marine economy [22], and the marine economy development quality [23]. Domestic research mainly focuses on connotation definitions, evaluation systems, and countermeasure suggestions. There are more results on empirical cases to study the whole coastal area of China [24,25]; the evaluation indexes are the comprehensive index system method [26,27,28,29], and the evaluation methods mainly use the entropy-modified G2 assignment method, the improved CRITIC assignment method, etc., to confirm the weights and the value of development.
The fruitful results achieved around the issue of marine economics and the MCC have provided useful references for further findings on the issue of the MCC and the marine economy, but the relevant study is mostly limited to the marine economy or the MCC, and there are not many theoretical and empirical studies on the synergistic relationship between the MCC and the marine economy. Based on this, this paper studies the synergistic relationship between the MCC and MEHD according to the inherent requirements of the development of the MCC and MEHD. We construct an evaluation indicator for the MCC and MEHD and analyse the index from 2006 to 2020 with the help of the improved TOPSIS model and the synergistic model of the composite system. We analyse the evolution trend of the index, orderliness, and synergy between China’s MCC and MEHD from 2006 to 2020. We use a geodetic detector model to approach the spatial driving factors and their interactions, with a view to enrich the research on the relationship between the MCC and the related theory of the marine economy. We also provide certain references for the formulation of the policies and planning for the enhancement of the MCC and the improvement of the efficiency of the economy in various regions.

2. Research Design and Methodology

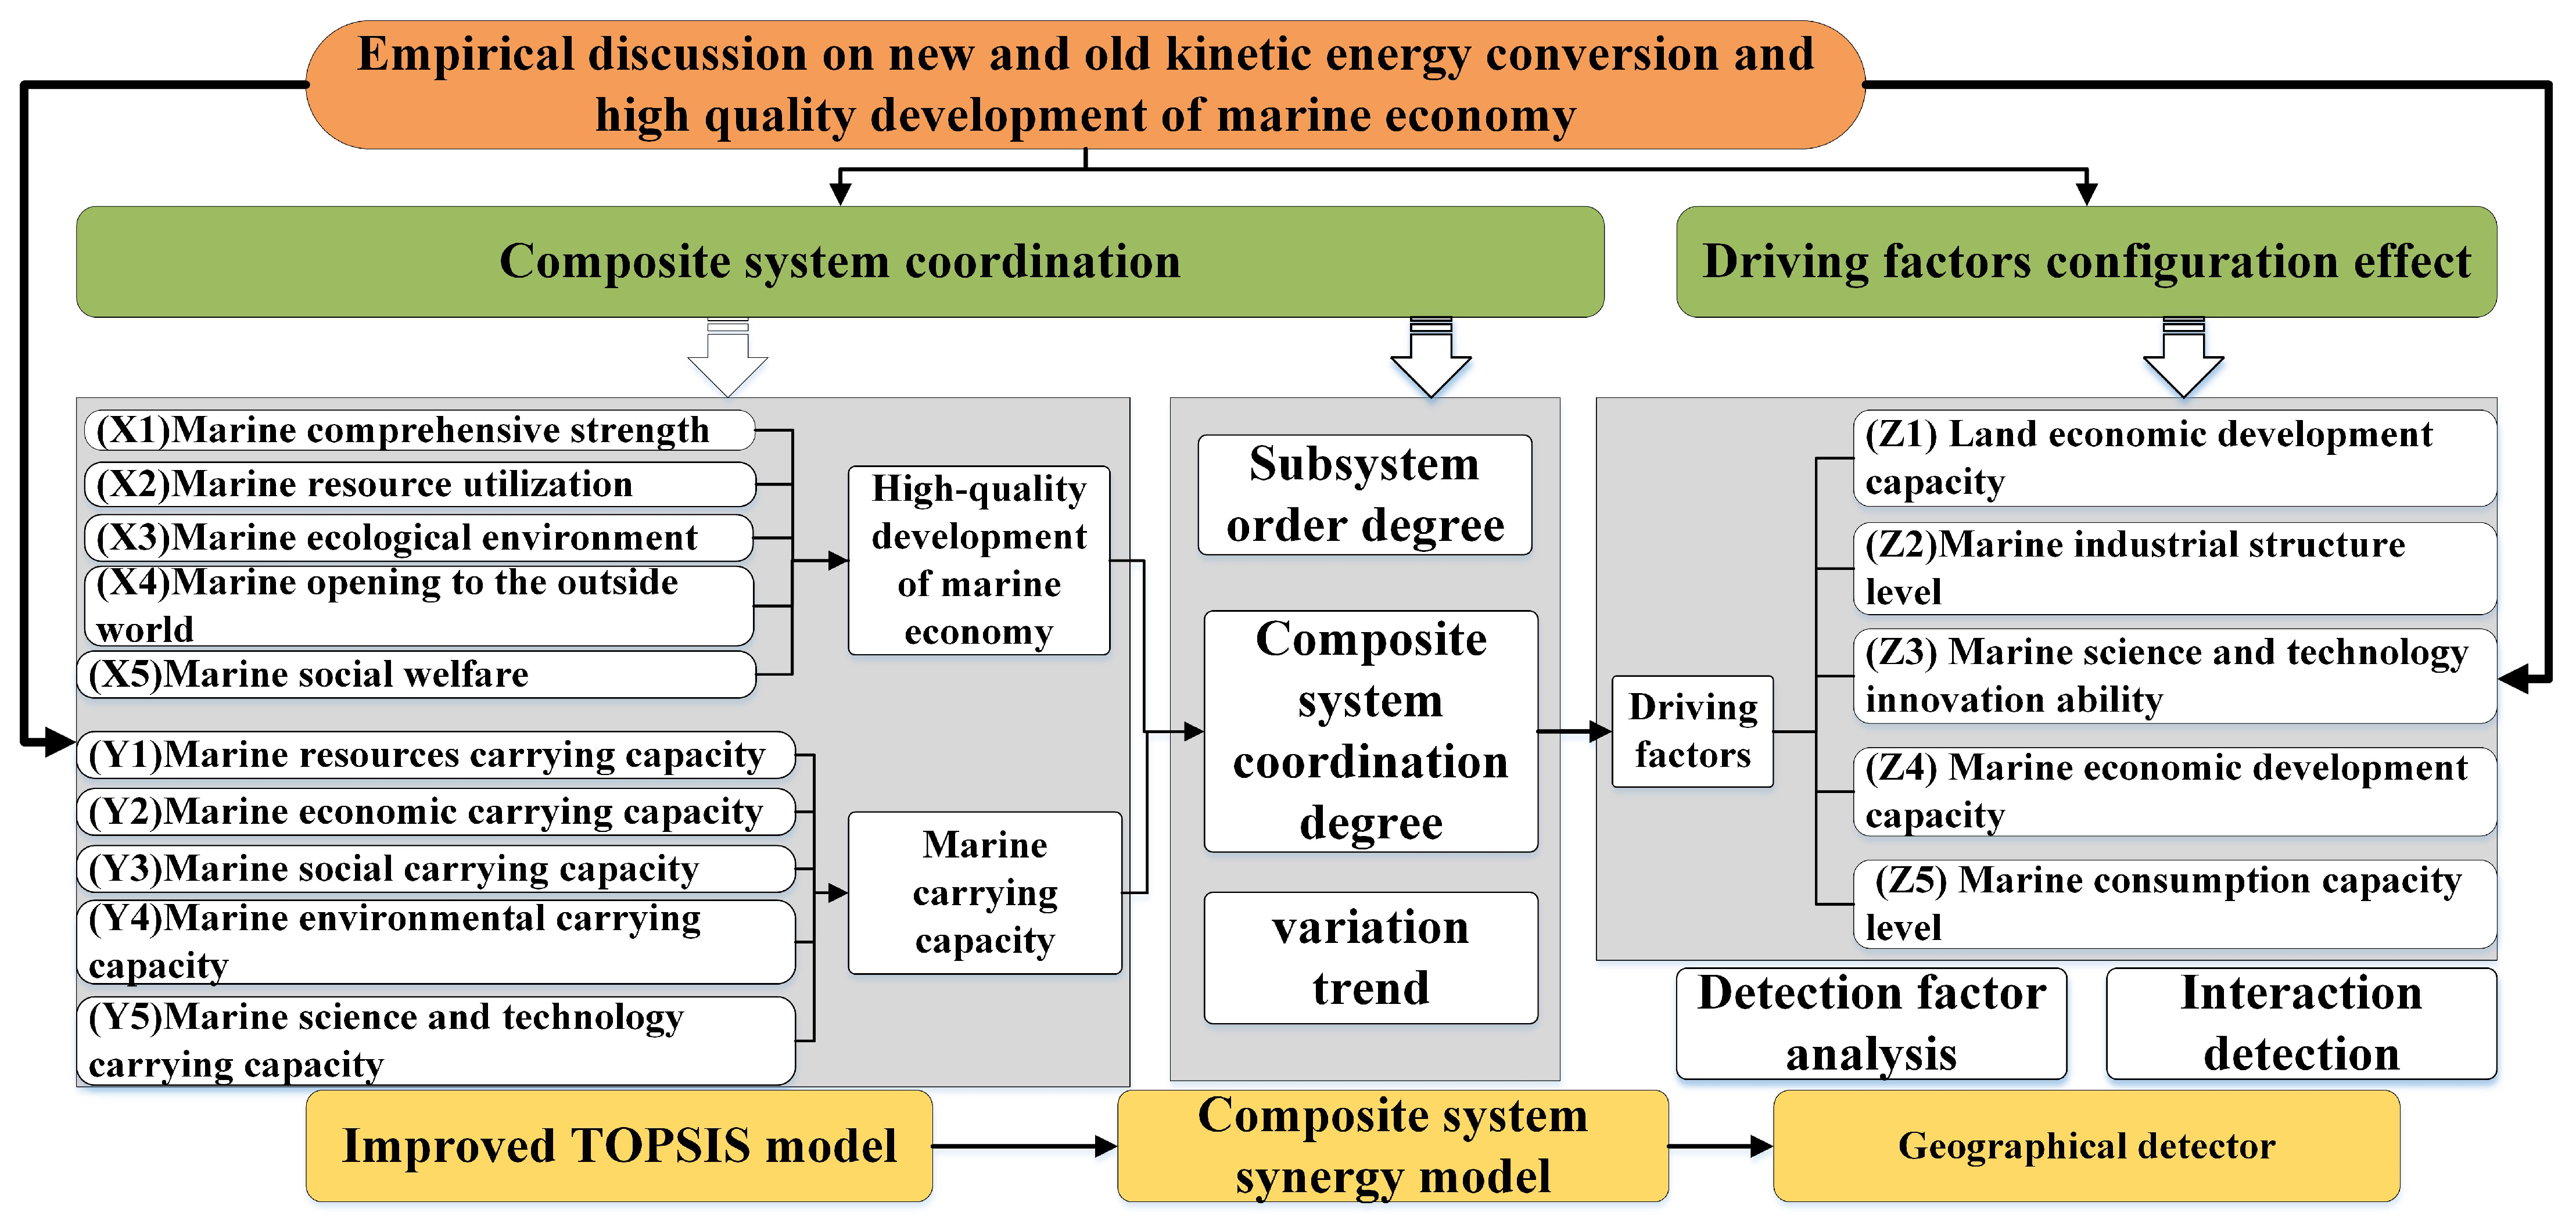
2.1. Research Design

The research design and methodology adopted in this study are shown in Figure 1: (1) evaluation and analysis of the MCC and MEHD. First, in the literature research, appropriate evaluation indicators were selected for the MCC and marine economy. Second, the index was calculated using the improved TOPSIS model. Finally, we used the composite system synergy model to analyse the subsystem orderliness, composite system synergy, and change trends between China’s MCC and the marine economy. (2) Analysis of synergy driving factors. First, we selected the possible influencing factors of composite system synergy on the basis of the previous literature and then measured the synergy driving force of six influencing factors on the synergy between China’s MCC and the MEHD using a geodetector. Finally, we used the interaction detector in the Geodetector software (http://www.geodetector.cn/, accessed on 15 July 2023) to explore the degree of synergistic influence.

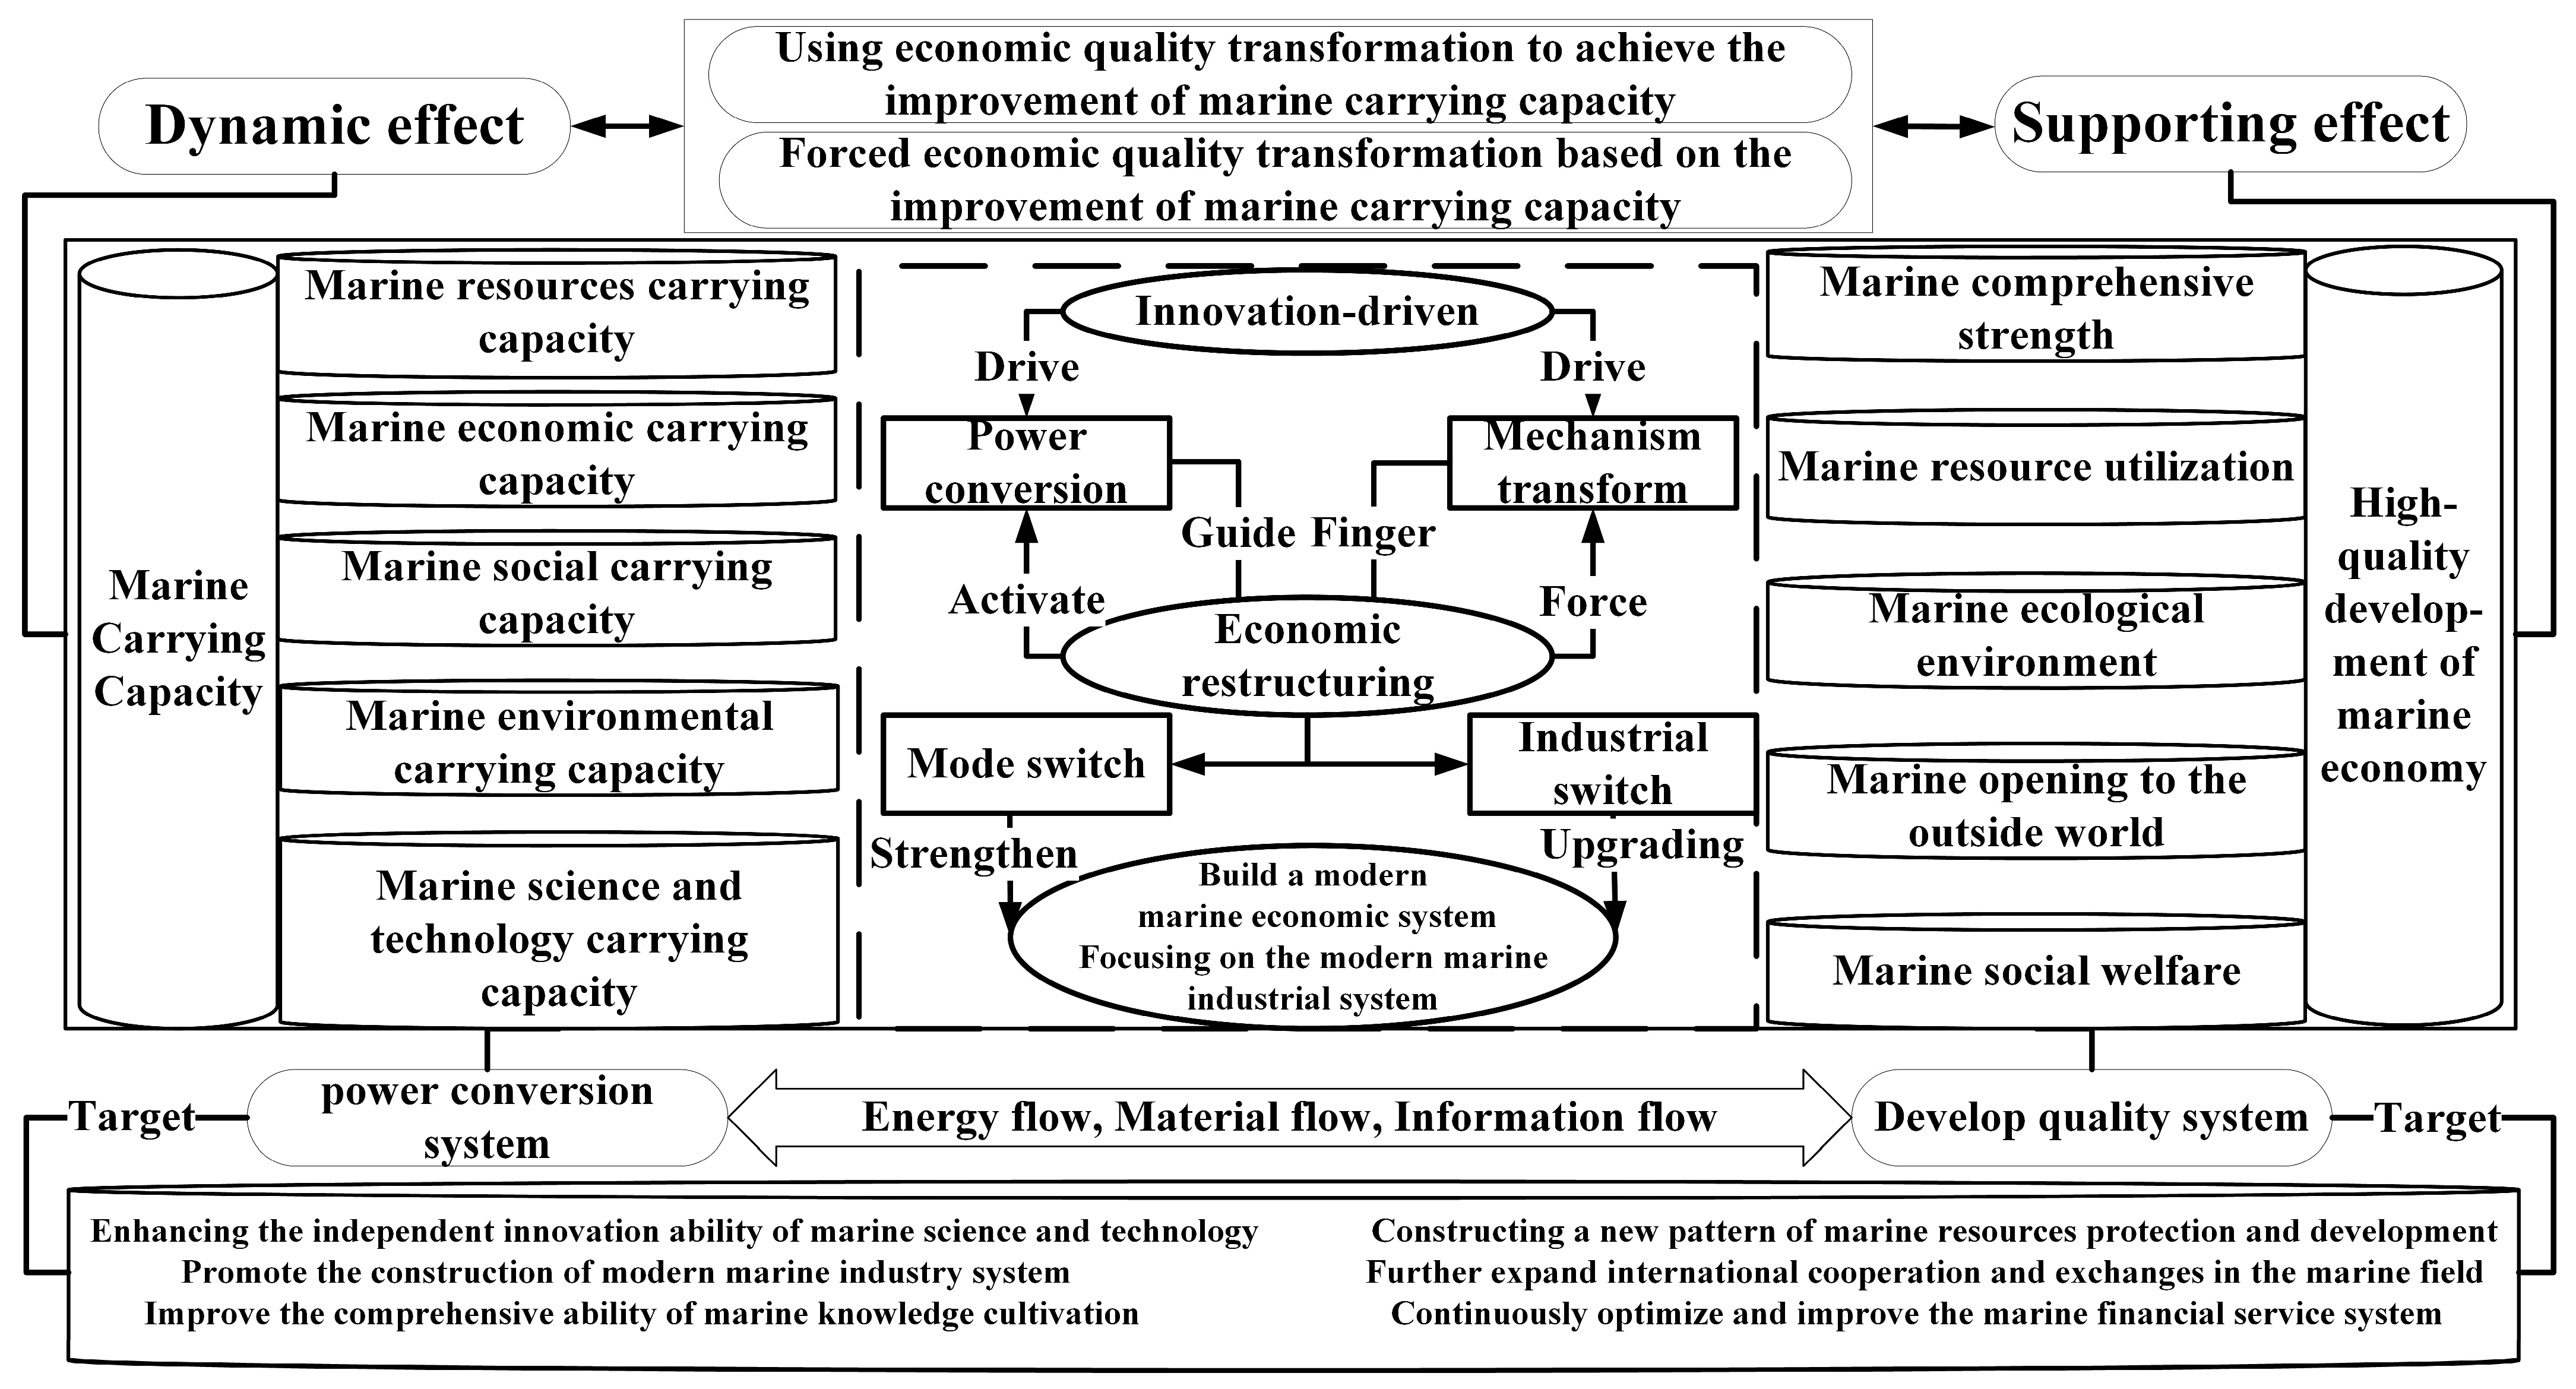
2.2. Synergistic Relationship between Marine Carrying Capacity and Marine Economy High-Quality Development

Academics generally believe that the carrying marine capacity is a significant basis for the judgement of marine development. The MCC emphasises the sustainable use of marine resources and the ability to support economic and social development, and this carrying capacity makes the marine environment able to support the coordinated development of society, economy, resources, and environment [30,31]. Indicators that characterise the carrying capacity include the marine ecological capacity, the ability to supply inventory, and the degree of industrial development, through which the coastal socio-economic situation can be further analysed, thus enriching and deepening the cognition and understanding of the carrier (marine resources and environment), the carrying object (socio-economics), and the external environment (science, technology, innovation, and management) of the carrying capacity of the marine environment and resources, which will help to achieve the healthy development of marine ecosystems [32]. “The ocean is a strategic place for high-quality development”, and refers to the process of production and life in the marine field; the human demand for a preferable life is met, the allocation of resource factors and output is efficient, the value of scientific development and technological upgrading is constantly improving, and the quality of products and services continues to grow, focusing on the coordinated development under the new concepts of development, such as innovation, coordination, greenness, openness, and sharing. Therefore, the MCC and MEHD are complementary but also have synergistic interaction, coordination, and symbiosis, and this paper uses the two interactive relationships as the main line to build the MCC and MEHD interaction mechanism analysis framework (Figure 2).
The marine economic carrying capacity is the core content of the MCC, mainly emphasising the increased momentum of the marine economy by the original labour force, resources, capital, and other traditional elements of the expansion of the scale of conversion to innovation, efficiency, quality, and other structural optimisation and upgrading. The marine social carrying capacity is a fundamental guarantee of the development of the MCC, embodied in the optimisation of the government’s management services, and actively adjusts the constraints on marine economic constraints to provide institutional and policy protection [33]. The government’s guarantee can promote the marine economy development with a high degree of efficiency and benefit; the marine economic structure transformation is a force for the development of the high-quality marine economy, which changes the structure of the marine economy and the system and can promote the allocation of marine economic resources and the transformation of the mode of economic development [34], and can then promote the optimisation and upgrading of the structure of the marine industry and promote the MEHD. The efficient use of marine resources is an important result of the enhancement of the MCC. The transformation of development mode has promoted a change in the marine economy from the traditional rough development to the high-quality, high-efficiency, and low energy consumption development mode. A change in the dominant industry is a manifestation of the MCC enhancement, which mainly embodies a change in the dominant marine industry from the traditional industry to the strategic emerging industry and a change in the high-level service industries. This results in the construction of a modernised ecoonmy. The emphasis of a modernised marine economy focusing on the modern marine industrial system is a significant target task for the marine economy [1].

2.3. Evaluation Indicator System

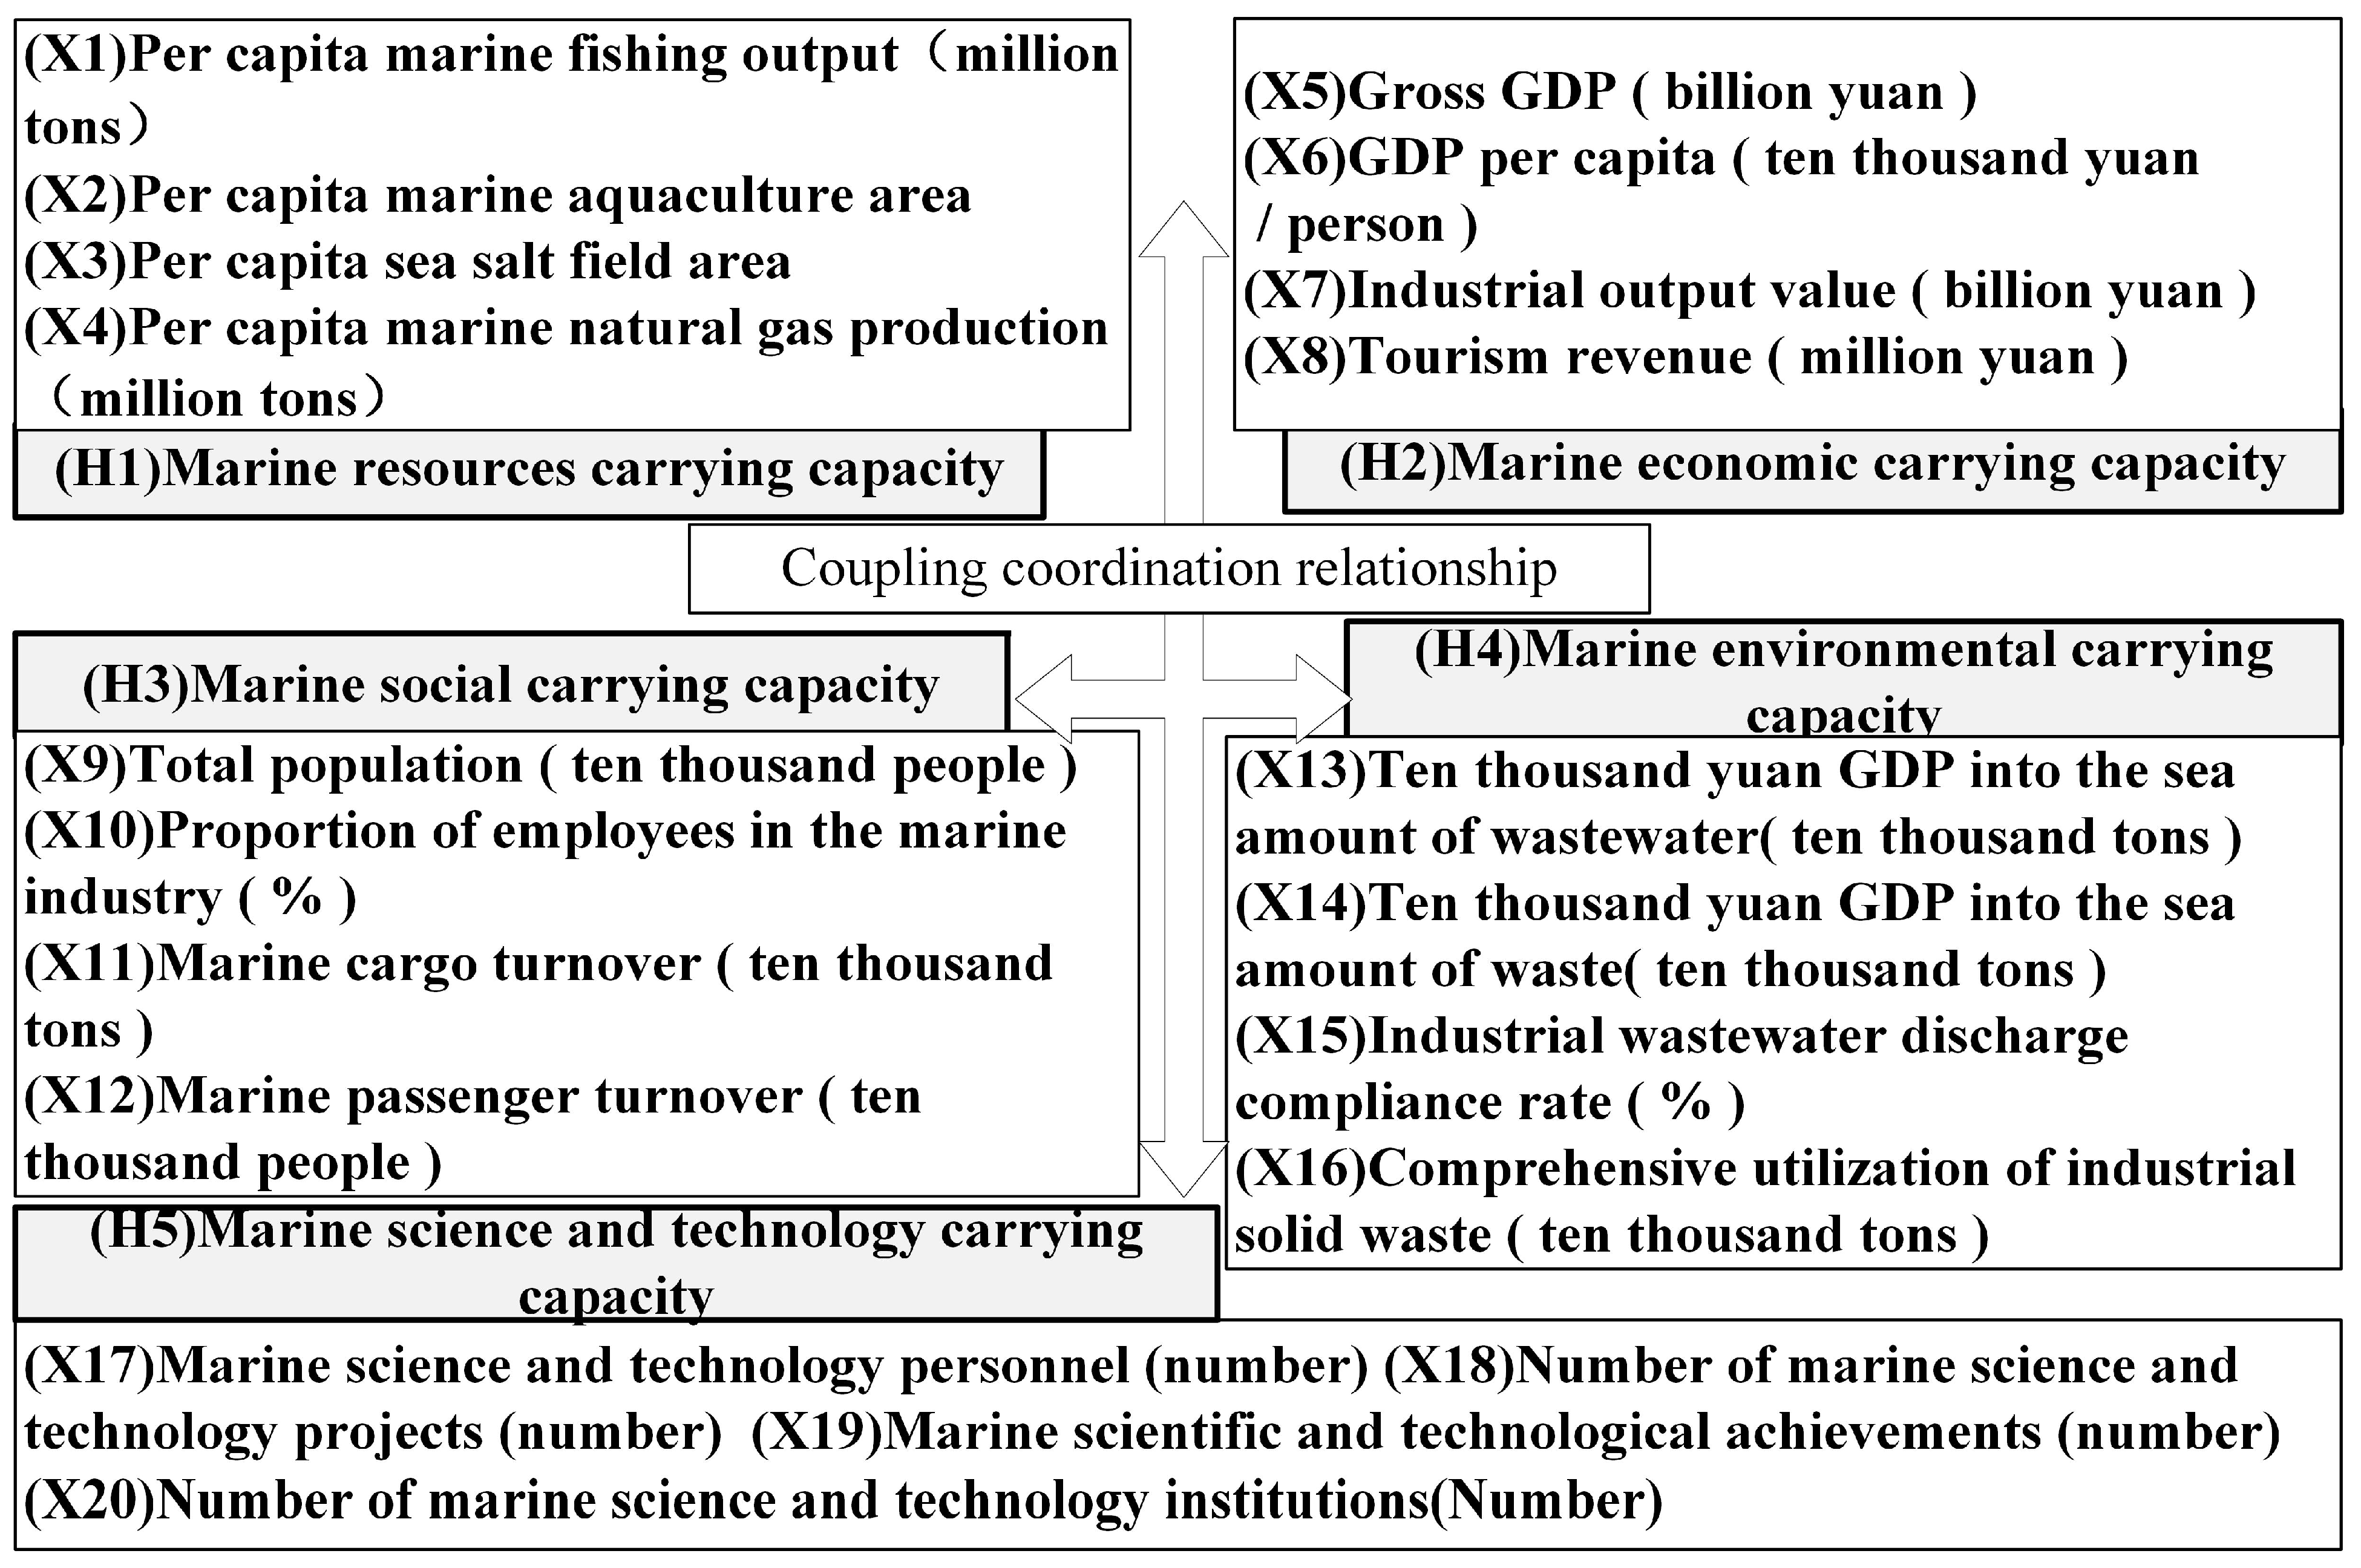
2.3.1. Selection Indicators of the Marine Carrying Capacity

We refer to the connotation and mechanism analysis of the MCC, with reference to the Guidelines on the Indicator System and Technical Methods for Monitoring and Early Warning of the Carrying Capacity of Marine Resources and Environment issued by the State Oceanic Administration in 2015 [35], and the Technical Procedures for Assessing the Carrying Capacity of Marine Resources in Nearshore Areas [32], a local standard issued by the Shandong Provincial Bureau of Quality and Technical Supervision, in 2017. Considering the current situation and characteristics of marine natural resources and integrating supply and marine resource demand factors, the MCC system is divided into five subsystems: marine resource carrying capacity, marine economic carrying capacity, marine social carrying capacity, marine environmental carrying capacity, and marine scientific and technological carrying capacity [36], and the indicator system is shown in Figure 3.

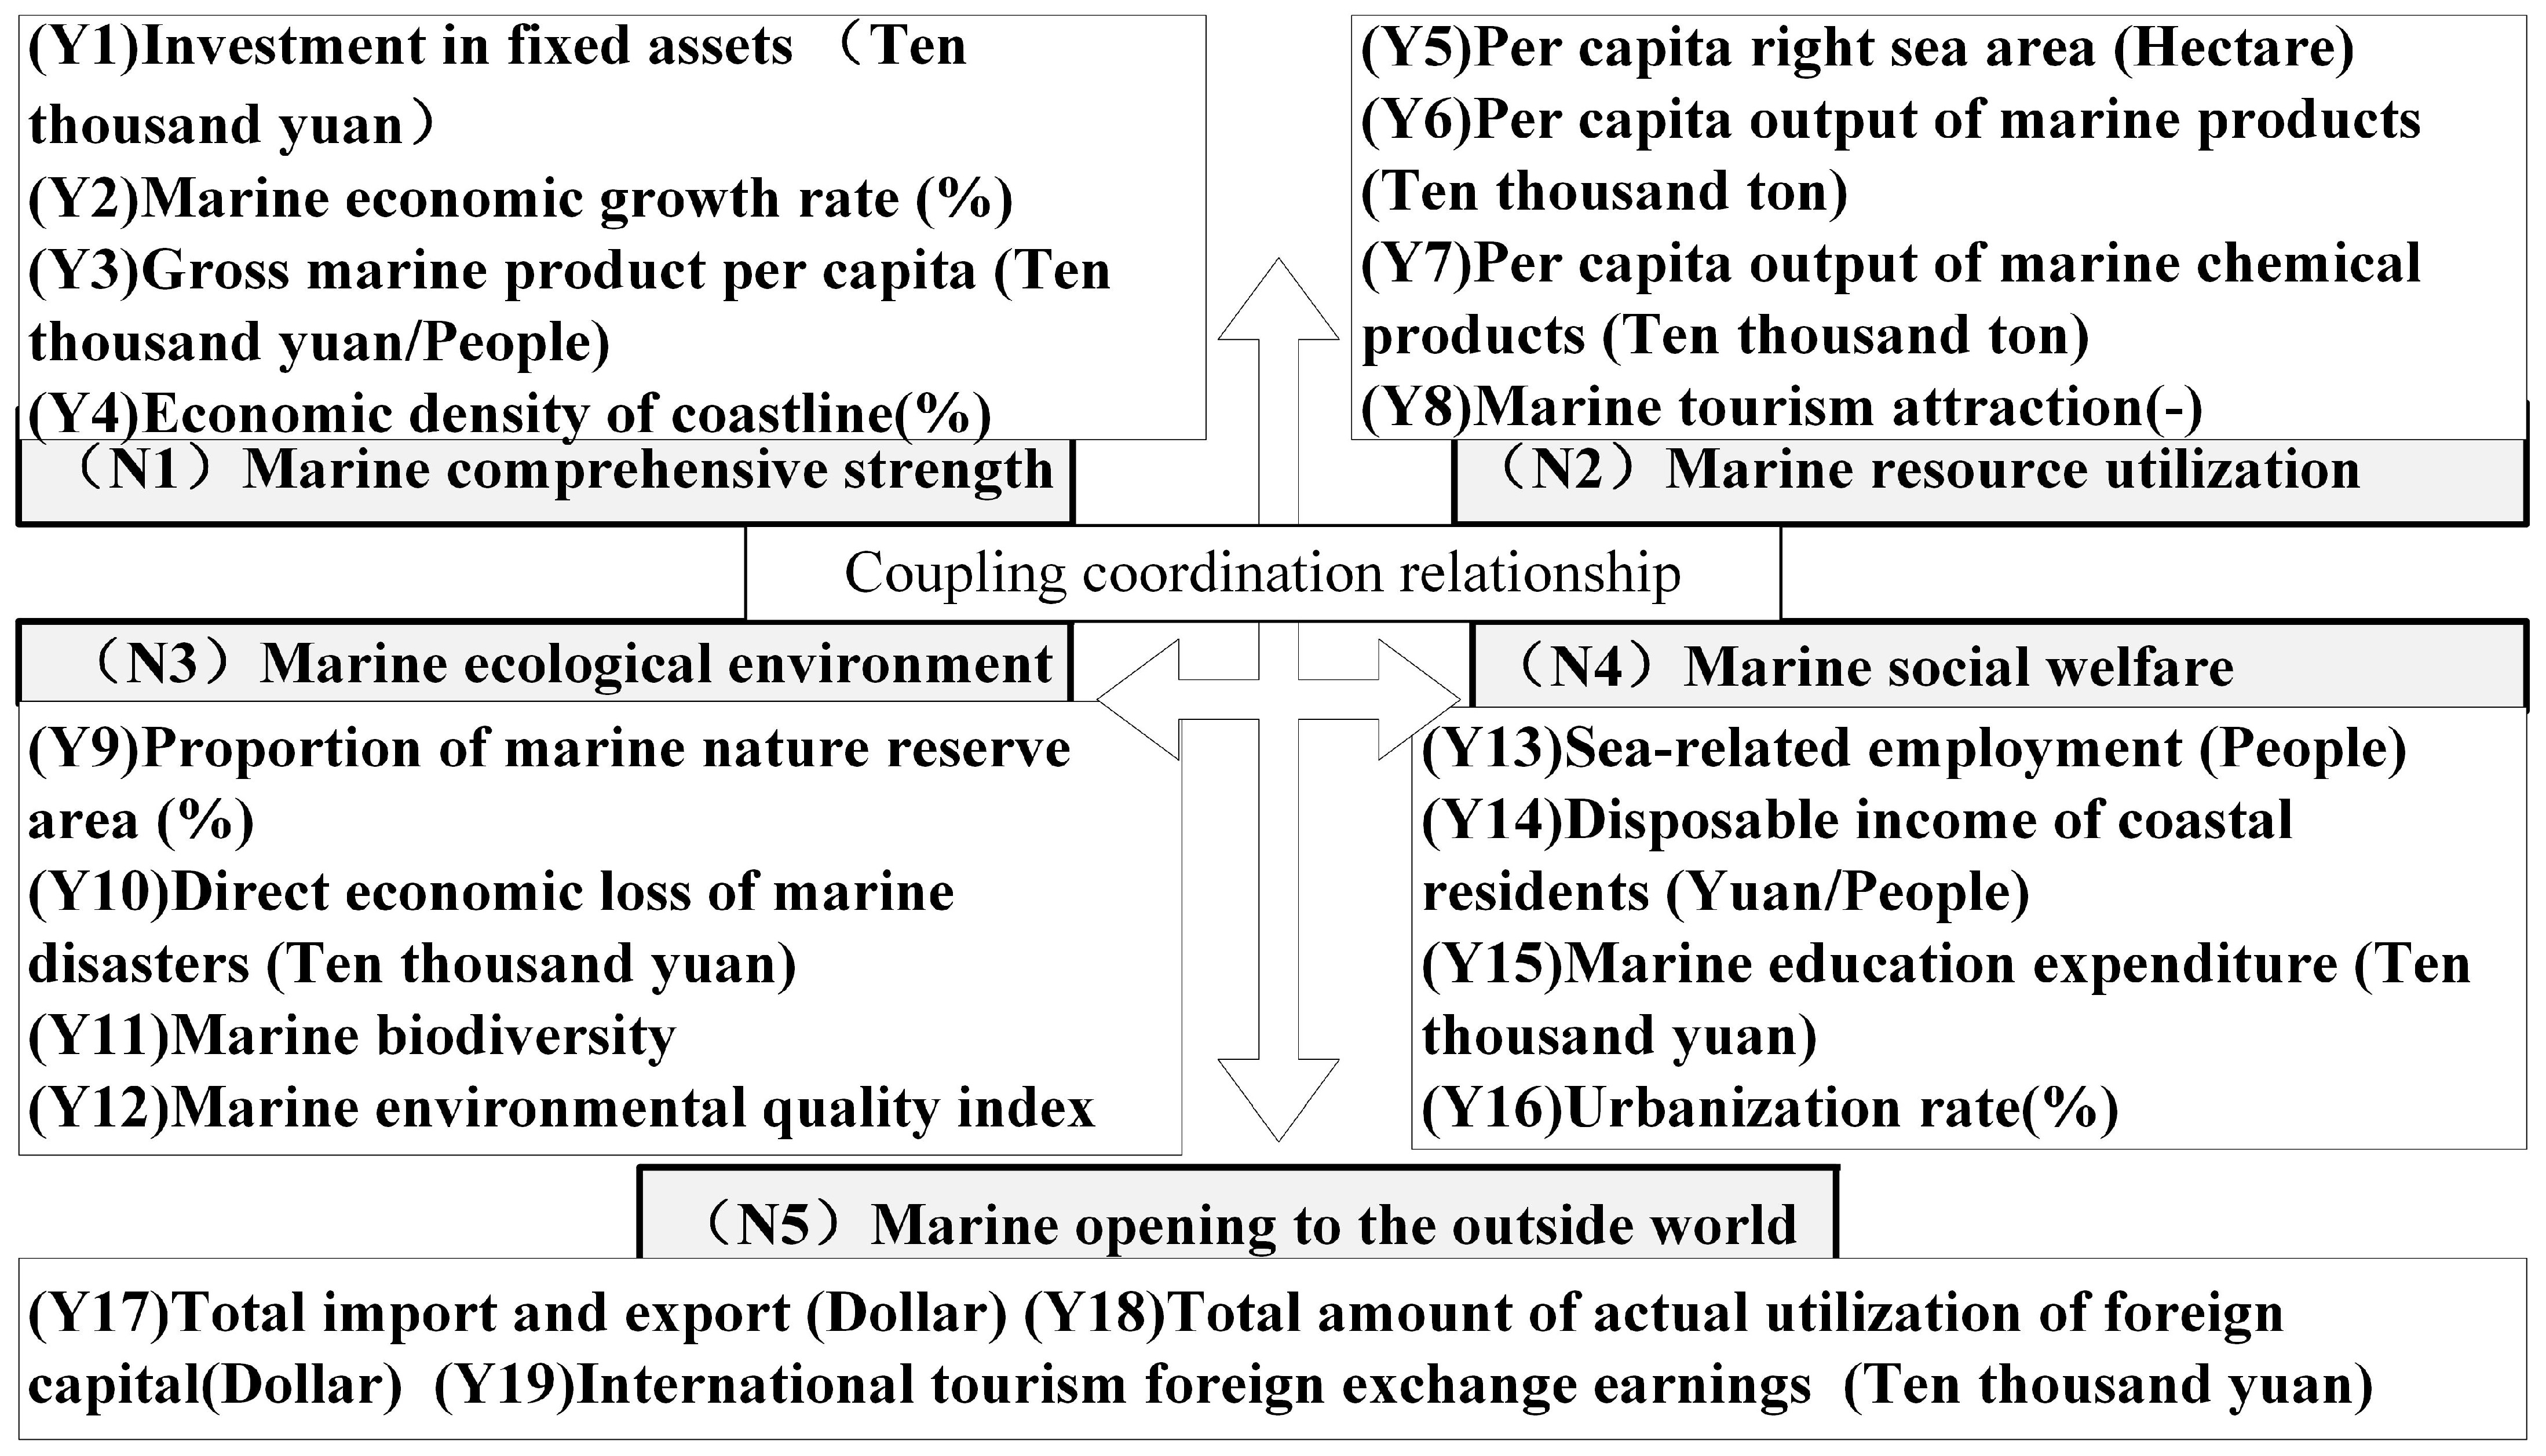
2.3.2. Selection Indicators of Marine Economy High-Quality Development

The MEHD is a complex and comprehensive system, taking into account economic development, resource use, ecological environment, social welfare, and other aspects of integrated and coordinated development [37]. Based on the connotation and characteristics of high-quality development, following the concept and the law of marine economic development, the development objectives are marine economic growth, optimising and upgrading its structure, improving the output of ocean resource use and allocation, giving attention to the level of marine ecological environmental protection, ameliorating the level of openness of the marine economy, and improving the performance of social welfare [38]. To evaluate marine resource utilisation, marine ecological environment, marine openness to the outside world, and marine social welfare, an evaluation index system was constructed (Figure 4).

2.4. Methods

2.4.1. Entropy-Weighted TOPSIS Method

The main principle is to use the objective evaluation method and entropy weighting method to determine the index weights and use the TOPSIS model to analyse the MCC and MEHD index [39,40]. The detailed modelling steps are as follows:
The data standardisation evaluation matrix:
a i j = x i j m i n ( x i j ) m a x ( x i j ) m i n ( x i j )
b i j = m a x ( x i j ) x i j m a x ( x i j ) m i n ( x i j )
where x i j denotes the original data for indicator j in year i; i = 1, 2,…, n; j = 1, 2,…, m; m a x ( x i j ) and m i n ( x i j ) are the maximum and minimum values for all samples; and a i j is the data after x i j normalisation.
The weighted decision matrix:
v i j = w i a i j
where v i j represents the combined weight of each evaluation indicator.
Determine the positive and negative ideal solutions:
a j + = m a x a 1 j , a 2 j , a n j a j = m i n a 1 j , a 2 j , a n j
v j + = m a x v 1 j , v 2 j , v n j v j = m i n v 1 j , v 2 j , v n j
Positive and negative weighted distances:
c i + = j = 1 n w j ( p i j p j + ) 2 ,    c i = j = 1 n w j ( p i j p j ) 2
Virtual negative ideal solutions and distances:
v j * = 2 v j v j + ,   d i + = j = 1 n ( v i j v p j + ) 2 ,   d i = j = 1 n ( v i j v j ) 2
Determine the synthetic distance:
L i + = α c i + + β d i + L i = α c i + β d i   ( α = β = 0.5 )
( T i ) is calculated by applying the following formula:
T i = L i L i + + L i   ( T i [ 0,1 ] )
Evaluate the MCC and MEHD process index. The above research methods are mainly completed by the “MATLABR2023b” operation.

2.4.2. Composite System Synergy Model

This paper constructs a composite system synergy model for the MCC and MEHD [41]. T refers to the total system of the MCC and MEHD in China. T i refers to each subsystem.
Subsystem orderliness examines U i ( T i k ) as the order parameter of the MCC and marine economy, and orderliness is calculated by:
U i ( T i k ) T i k b i k a i k b i k a i k T i k a i k a i k
where T i k a i k , b i k , a i k , b i k are the min and max values of the kth element of i of the subsystem. Next, determine the linear weighted summation method of summation with the following formula:
U i ( T i ) = j = 1 n U i ( T i k ) × w i k
To obtain the composite system synergy degree, set the initial moment t 0 development to moment t 1 , and the subsystem order degree is U i 0 ( T i ) , U i 1 ( T i ) , k = 1,2 , n . Then, the t 0 to t 1 moments of the MCC and marine economy of the overall synergy degree are:
F = θ i = 1 n γ i | U i 1 ( T i ) U i 0 ( T i ) | ,   θ = m i n i U i 1 ( T i ) U i 0 ( T i ) | m i n i U i 1 ( T i ) U i 0 ( T i ) |
where F is the synergy, θ is the stability of the system synergy, and γ i represents the weighting factor. The greater the value of the composite system synergy is given by F ∈ [−1, 1]. In general, if the orderliness of one subsystem rises more, while the orderliness of another subsystem rises less or falls back, the whole system is in an unstable or uncoordinated state [42]. The above research methods are mainly completed by the “MATLABR2023b” operation.
With reference to the evaluation criteria between the degree of synergy and the degree of synergy of the system [43,44], the evaluation criteria for the synergy between the MCC and MEHD are given in this paper (Table 1).

2.4.3. Geodetectors

The MCC and high-quality synergistic development are influenced by a variety of factors, and traditional methods need to meet more conditions for the analysis of such problems. The geographic probe is a method of identifying the relationship between multiple factors by combining the “factor force” metric proposed by Wang [45]. The correlation between factor variables and outcome variables is analysed, and different categories of variables are normalised under the same spatial scale through the classification analysis of each factor [46]. This paper introduces a geographic probe analysis to quantitatively detect the drivers of the MCC and high quality. The calculation formula is:
q = 1 1 n σ 2 i = 1 m n i σ i 2
where q is an indicator of the determinants of change in the MCC and high quality; n is the number; m is the type of each influencing factor; and n i and σ i 2 are the total number and variance of each study unit respectively. The above research methods are mainly completed by “ArcGIS 10.2” software.

3. Study Area and Data

3.1. Study Area

The study area includes 11 provinces along the Chinese coast. China’s marine economy has developed steadily, with the gross marine product increasing from 696.93 billion CNY in 2006 to 903.85 billion CNY in 2021, with an increasing average growth rate between 2006 and 2021 (Figure 5). The marine economy has been strengthening, with the national marine GDP rising after 2010, reaching a peak of 17.10% in 2019. The share of China’s marine GDP in the country’s GDP was 9.55% in 2006 and declined after 2007, basically stabilising at 9.3% during 2007–2019. China’s marine economy suffered a setback in 2020, with the national gross marine product falling by 10.52% compared to 2019, but a series of policies, such as “MEHQD”, “developing the marine economy and building a strong marine nation”, and “building a marine community”, were adopted. “In 2021, the total output value reached a new level, exceeding 9 trillion for the first time, indicating a strong recovery of China’s marine economy and the gradual release of economic vitality” [23].

3.2. Index Weights

The main principle is to first determine the indicator weights using the objective evaluation entropy weighting method and then use the TOPSIS model to measure and evaluate the MCC and the high-quality development index. Firstly, the indicator data are standardised in the formula; then, the information entropy of each indicator is calculated in the formula, and objective weights are obtained in the equation, as shown in Figure 6.
In Figure 6a, the weights of the indicators of the MCC are relatively different. Among them, per capita marine natural gas production (X4), industrial output value (X7), marine passenger turnover (X12), and number of marine X20 are the most important indicators. Industrial output value (X7), marine passenger turnover (X12), and number of marine X20 are the most important indicators, indicating that these indicators are important factors affecting the MCC. The number of marine science and technology personnel (X17), marine science and technology innovation capacity, and green development capacity have smaller overall weights. This further indicates that marine technology and the upgrading of marine industries are important driving forces for the MCC.
In Figure 6b, the overall difference in the weighting of the indicators of quality marine economic development is relatively small. Among them, the highest index is for the area of the confirmed sea area per capita (Y5), indicating the area of the sea area. On the whole, marine social welfare and marine openness to the outside world have higher weight values than marine ecological environment and marine resource utilisation on the whole. This indicates that high-quality development needs to focus not only on efficiency but also on equity; realising the fruits of economic development to be shared fairly by all people is a necessary condition for its promotion. The continuously expanding openness to the outside world is the impetus for promoting marine economic and social development and is a fundamental way to achieve sustainable marine development.

3.3. Data Source

The data for the relevant indicators used were obtained from the China Marine Statistical Yearbook 2007–2021 and the China Marine Environmental Quality Bulletin of each coastal province for each year, and some data were obtained from the National Marine Innovation Index Report 2021 and the China Marine Economic Development Index 2021. Indicator data that were not available were filled in and processed with multiple interpolations according to the actual situation. With regard to the quantification of directional indicators, based on a large number of references and access to publicly available statistics and information, such as the China Statistical Yearbook and the Marine Environmental Quality Bulletin of each coastal province and municipality [47], relevant quantitative indicators were selected, and the quantitative indicators were weighted and summed up using the weighted comprehensive evaluation method.

4. Empirical Results

4.1. Characteristics of the Evolution of the Marine Carrying Capacity and Marine Economy High-Quality Development

4.1.1. Analysis of the Marine Carrying Capacity

Based on the five dimensions of marine resource carrying capacity (H1), marine economy carrying capacity (H2), marine society carrying capacity (H3), marine environment carrying capacity (H4), and marine science and technology carrying capacity (H5) in the MCC evaluation index system (H), a folding map of the MCC index from 2006 to 2020 was drawn (Figure 7).
Figure 7 shows that during the period 2006–2020, China’s MCC index fluctuated and increased from 0.142 in 2006 to 0.654 in 2020, indicating that high-quality development contributes more to the carrying capacity of the marine area, and the index of the carrying capacity of the marine area has achieved a certain degree of improvement. Among the classified indicators of the MCC index system, the marine environment has been at a high level, and to achieve further improvement of the MCC index, it is necessary to increase the protection of the marine ecological environment and accelerate the restoration of the marine ecological environment [48]. The fluctuation trend of the carrying capacity of marine resources, marine economy, marine society, and marine science and technology is basically the same, accounting for a relatively high proportion in the MCC system, reflecting that technology, industry, knowledge, and finance are important factors. The MCC is enhanced and achieves a higher quality mainly through marine technological innovation, upgrading of the industrial structure, strengthening the cultivation of knowledge, and the ability of the marine society to develop. The higher percentage reflects that technology, industry, knowledge, and finance are important factors affecting the MCC.
This study analysed the the MCC index using the modified TOPSIS model and found that the impacts of the different dimensional indicators on the development of the MCC varied in different areas along China’s coast. Figure 8a further shows the impact coefficients of five dimensions, namely marine resource, marine economic, marine social, marine environmental, and marine science and technology carrying capacity. From the view of the sub-dimension indicators, the marine environmental carrying capacity is most significantly improved, followed by the marine science and technology carrying capacity. This indicates the changes in the marine technology capacity, while an accelerated enhancement of the marine environment must increase the cultivation of new types of talent to talent to help the sustainability of the marine economy in the future. We should continue improve marine economic growth if the pulling role is not obvious, enhance the positioning of the marine innovation chain in each functional area, and optimise the spatial pattern of marine development. In the process of improving the MCC, there are still some obstacles in terms of ideological understanding, institutional mechanisms, laws, regulations, and policies, and there is pressure on the transformation of marine innovation, resulting in the application of marine science and the use efficiency is at a lower level, and the structural transformation is not in line with the situation. Therefore, the current important task is to make up for the short board of structural transformation and enhance the momentum of industrial and product structure change and upgrades.

4.1.2. Analysis of the Marine Economy Quality Development Index

Based on the index and the constructed evaluation index system, an evaluation chart of China’s MEHD index by dimension from 2006 to 2020 was drawn (Figure 9).
Figure 9 shows that the overall level is relatively low, indicating that the MEHD is facing significant pressure in the conversion of fundamental benefits. Further conversion of momentum and development momentum still needs to improve. In the classification indicators of the MEHD, the marine resources and marine social welfare are relatively low, indicating that there is still room for further development in terms of opening up to the outside world, and marine welfare still needs to be further increased. The overall level of the marine ecological environment is not high and shows a strong wave dynamic trend, indicating that China’s coastal areas still need to be strengthened in terms of marine ecological protection, marine resource utilisation, and pollution control. It is necessary to continuously enhance the protection of the marine ecological environment, reduce the discharge of wastewater and solid waste, improve governance efficiency, take the path of sustainable development, and achieve coexistence between humans and nature.
A box plot used to display a set of data dispersion is further used to analyse the MEHD index (Figure 8b). It can be found in Figure 8b that the distribution of H4 and H1 is relatively concentrated, while the distribution of H2 is relatively dispersed. Among the sub-dimensional indicators of the MEHD, the H4 distribution is the most uniform, and the H3 distribution is the most uneven. This information can be obtained by comparing the distance from the median to the upper quartile and the lower quartile. It shows that high-quality opening up is an important driving force for the MEHD. The MEHD requires the coordinated use of domestic and international markets, resources, and technologies to improve the quality of opening up and the development linkage. H3 is the best, and the overall situation of H2, H3, and H5 is not ideal. This information can be obtained from the median position, and the analysis data can be found. Innovation is the key to promoting the MEHD. The purpose is to produce greater social welfare, and the sharing of results is an essential requirement for the benefit of the people.

4.2. Synergistic Analysis of the Marine Carrying Capacity and Marine Economy High-Quality Development

With the help of the composite system synergy model, the comprehensive development index, and orderliness, the synergy of the MCC and the MEHD system of the marine economy were obtained (Table 2).
From the comprehensive development index of the system, the MCC and the high-quality development subsystems show a gradual upward trend, and the comprehensive index of the system also shows an upward trend. The degree of order of the MCC subsystem is between 0.098 and 0.553, with an overall upward trend in the degree of order; the degree of order of the high-quality development subsystem in the marine economy fluctuates and rises between 0.160 and 0.524; this indicates that the positive ordinal coefficients within the two subsystems play an increasingly important role in the development of the subsystems, and at the same time prompt the level of the carrying capacity in China’s coastal provinces to continue to improve. The level of the MEHD is constantly improving. According to the evaluation criteria of composite system synergy in Table 2, the coordination degree of the subsystems has been at the level of mild synergy for a long time and only achieved moderate coordination in 2019, indicating that there is still a difference in the level of development of the subsystems. Among them, the synergy degree rose in 2007–2010. With the level of the MCC rising, the MEHD continues to improve; at this time, the rate of improvement of the MCC lags behind the MEHD, but the gap between the two is gradually narrowing. In 2011–2014, the synergy degree gradually rose. The orderly degree of the MEHD lags behind the MCC. In 2015, the orderly degree of the MEHD rose and widened the gap with the MCC; in 2016–2019, the orderly degree of the MCC was higher than the MEHD, but the gap between the two is gradually narrowing, and the degree of synergy is constantly rising. In 2020, due to the impact of the epidemic, key indicators, such as foreign exchange earnings from international tourism, affected the MEHD, and the degree of orderliness lagged behind the MCC, making the degree of synergy lower.
According to the composite system synergy model, the MCC index and high-quality development index can be obtained, and the specific measurement results are shown in Figure 10a. Generally speaking, the larger the MCC index, the smaller the gap between the level of the MEHD required by the actual marine development transition in the region and the ideal level of the MEHD required by the level of marine transition in each region during the same period, indicating that the MCC is leading to better marine quality synergy.
In Figure 10b, it can be seen that the 2006–2020 China coastal MCC (U1) driven MEHD (U2) synergy index is at a high level overall, indicating that the MCC has driven the MEHD more effectively. In 2006–2009, the MCC and MEHD index increased significantly, representing that synergy improved. In 2009–2014, the MCC and MEHD synergy index resulted in some areas of the integration index rising, but the overall trend fluctuated downward. In 2016–2020, the MCC led to significantly MEHD. The overall picture shows that China is still in the stage where the MCC leads to high quality, which is the main path of synergistic development. China has not yet entered the stage where the synergy is mainly driven by high quality in the ocean and still needs to further accelerate the process of the MCC and high-quality synergy.

4.3. Analysis of Driving Factors

4.3.1. Selection of Driver Indicators

In order to further explore the synergistic drivers, an empirical test was conducted using Chinese coastal data with the help of a geographical detector model. The geographical characteristics of China’s coastal regions vary greatly, the distribution of marine resources varies greatly, and marine science development is disparate. There are significant differences in the development strategies of the marine economy, the layout of industrial structures, and the construction of marine culture in different regions, which have different impacts on the MCC and MEHD. According to the existing research results [31,32], six factors, land-based economic development, marine industry structure, marine science and technology innovation, marine economic development, marine consumption capacity, and marine openness, were finally selected to detect and then analyse the spatial divergence of their influencing factors, and the indicators were selected as detailed in Table 3.

4.3.2. Analysis Based on Detection Factors

With the help of ArcGIS10.2 software, the six influencing factors were converted into type variables, and the size of the q-values of the six influencing factors on the synergistic driving force was measured by geographic probes (Table 3). The larger q-values indicate a greater synergistic influence.
(1)
The level of marine consumption capacity (Z5), marine openness capacity (Z6), and marine industry structure level (Z2) belong to the same level, and the influence index is high. This indicates that the level of marine consumption capacity, the ability to open up to the outside world, and the level of marine industry structure have a high influence on the synergistic MCC and MEHD. China’s marine economy has a lot of room for external development, which can promote cooperation in knowledge, technology, experience, and talents, which, in turn, has an impact on the conversion of the MCC; the development of new marine industries driven by scientific and technological innovation enhances the conversion of the MCC and promotes industrial upgrading to realise the conversion of kinetic energy. In 2006–2020, for all three factors, the q-values are above 0.7, and the difference in each region result in differences in the influence of the q-value of each detection factor on synergy in different periods, while the influence the q-value fluctuates and changes the trend [49].
(2)
The impact of marine science and technology innovation capability (Z3) on synergy is at a medium level. The q-values of the number of invention patents owned by marine research institutions during the study period are 0.574, 0.654, 0.825, and 0.734, respectively. The increase in the number of invention patents owned by marine research institutions means that the level of marine science and technological innovation has been improved to a certain extent. The MEHD enhances the level of marine economic kinetic energy conversion. Under the strategy of innovation-driven development and science and technology for the sea, the coverage of marine science and technology innovation has gradually expanded, the fields involved have gradually become more extensive, and the momentum of the conversion of the kinetic energy of the marine economy is sufficient.
(3)
The impact of land-based economic development capacity (Z1) and marine economic development capacity (Z4) on synergy is at a relatively low level. Land-based economic development is an important factor influencing the MEHD, and to a large extent guides the development direction of the marine economy, which relies on the land-based economy for its development, so the future development of the marine economy should pay more attention to the synergistic development of the sea and land. With the deepening of the opening up and regional policies, regional development is gradually taking shape, and the link between land-based economic development supporting marine economic development is further strengthened.

4.3.3. Influence Factor Interaction Detection

The interaction detector in the Geodetector software (http://www.geodetector.cn/ (accessed on 15 July 2023)) was further used to explore the extent to which any two factors, when acting together, have a synergistic impact on the MCC and marine economy quality development, and the results are shown in Table 4.
Based on the results of the factor interaction detection, the interaction of each factor has a multiple two-factor strengthening relationship, indicating that the spatial differentiation of synergistic development is the result of the joint influence of multiple forms of agglomeration. The explanatory kinetic energy of most of the factor interactions tends to decrease, while the explanatory kinetic energy of the interactions of land-based economic development capacity (Z1), marine industry structure level (Z2), and marine economic development capacity (Z4) increases. In terms of the time period, there are six types of interaction scenarios in 2006–2007 that have a non-linear enhancement effect, i.e., the influence of the interaction of different influencing factors is greater than the sum of the influence of two factors acting individually. The marine industry structure level (Z2), the marine consumption capacity level (Z5), and the other interaction factors have an explanatory kinetic energy greater than 0.900, and the combination of these groups of driving factors strongly explains the role of marine ecosystems. The degree of synergy influences the MCC and MEHD. In 2010, the synergy of fifteen pairs of two interaction factors in the driving factor interaction effect were stronger explanatory kinetic energies, and this stage needs to focus on the marine industry structure level’s (X2) impact effect to strengthen the innovation environment, support measure construction, and focus on regional science and technology innovation capacity cultivation. In 2015–2020, the factor interactions produce a two-factor enhancement effect that is not as significant as the non-linear enhancement type. The interaction factor effects of land-based economic development capacity (Z1), marine industry structure level (Z2), and marine economic development capacity (Z4) have stronger explanatory kinetic energies and explain the synergistic spatial differences between the MCC and MEHD, indicating that the land-based economic development capacity, marine economic development capacity, and marine level of the industrial structure play a driving role in increasing the synergy between the MCC and MEHD, and the important influence of the land-based economy on high-quality development should be emphasised.

5. Discussion

The MCC and MEHD are systematic, dynamic, and regional projects and are based on the construction of a multi-dimensional evaluation index system with good operability. Combined with the geodetector model, they are used to explore the various influencing factors, provide a development direction for China’s marine economy and coastal areas to enhance the MCC, and provide a scientific basis for the proposal of policy recommendations for the various regions of the marine economy and the MCC.
(1)
Academics pay more attention to theoretical research on the connotation and mechanism of the MCC and are limited to quantitative analysis and measurement in specific areas, and the research on the synergistic relationship between the MCC and MEHD is still relatively weak and lacks theoretical discussion and empirical analysis. This paper is based on the connotation and mechanism of China’s MCC. It explores the synergistic relationship, constructs a comprehensive evaluation index system, and analyses the main influence mechanisms of China’s marine economic development and the MCC in China and coastal areas by clarifying the evolution trends of the indexes, orderliness, and synergism of China’s MEHD and MCC, which will be useful for promoting the development of the marine economy and the MCC in accordance with local conditions. It can provide some ideas for promoting the development of the marine economy and the enhancement of the MCC according to local conditions.
(2)
The Fourteenth Five-Year Plan period is a critical period for the reshaping of the international economic order and the MEHD. Enhancing the MCC is of great significance in promoting the sustained and stable growth of the marine economy and realising the MEHD. At present, there is an urgent need to deepen the understanding of the connotation of the MCC and the research mechanism, accurately grasp the key difficulties and focuses of the development of the marine economy and the MCC, build a number of marine strategic emerging industries that are the leaders in enhancing the MCC, transform the old kinetic energies on the basis of sorting out the deficiencies in the development of the marine economy, and achieve the goal of optimising the layout of the industry through scientific and technological marine innovations, fostering new industries, transforming the development mode, and optimising the layout of the industry.
(3)
Due to the difficulty of obtaining marine data, the indicator system of the MCC index in this study still needs to be further improved, such as the institutional mechanism and the development mode, which can be further deepened in subsequent studies; this study only involves the national scale, and it is not yet possible to spatially analyse the various regions of China’s coasts, so future studies can explore the characteristics of the spatial evolution of the MCC at a more microscopic level. In addition, in terms of influencing factors, factors such as human capital level and government policy support have not yet been included. More in-depth research is needed on these aspects of China’s MCC and MEHD.

6. Conclusions

(1)
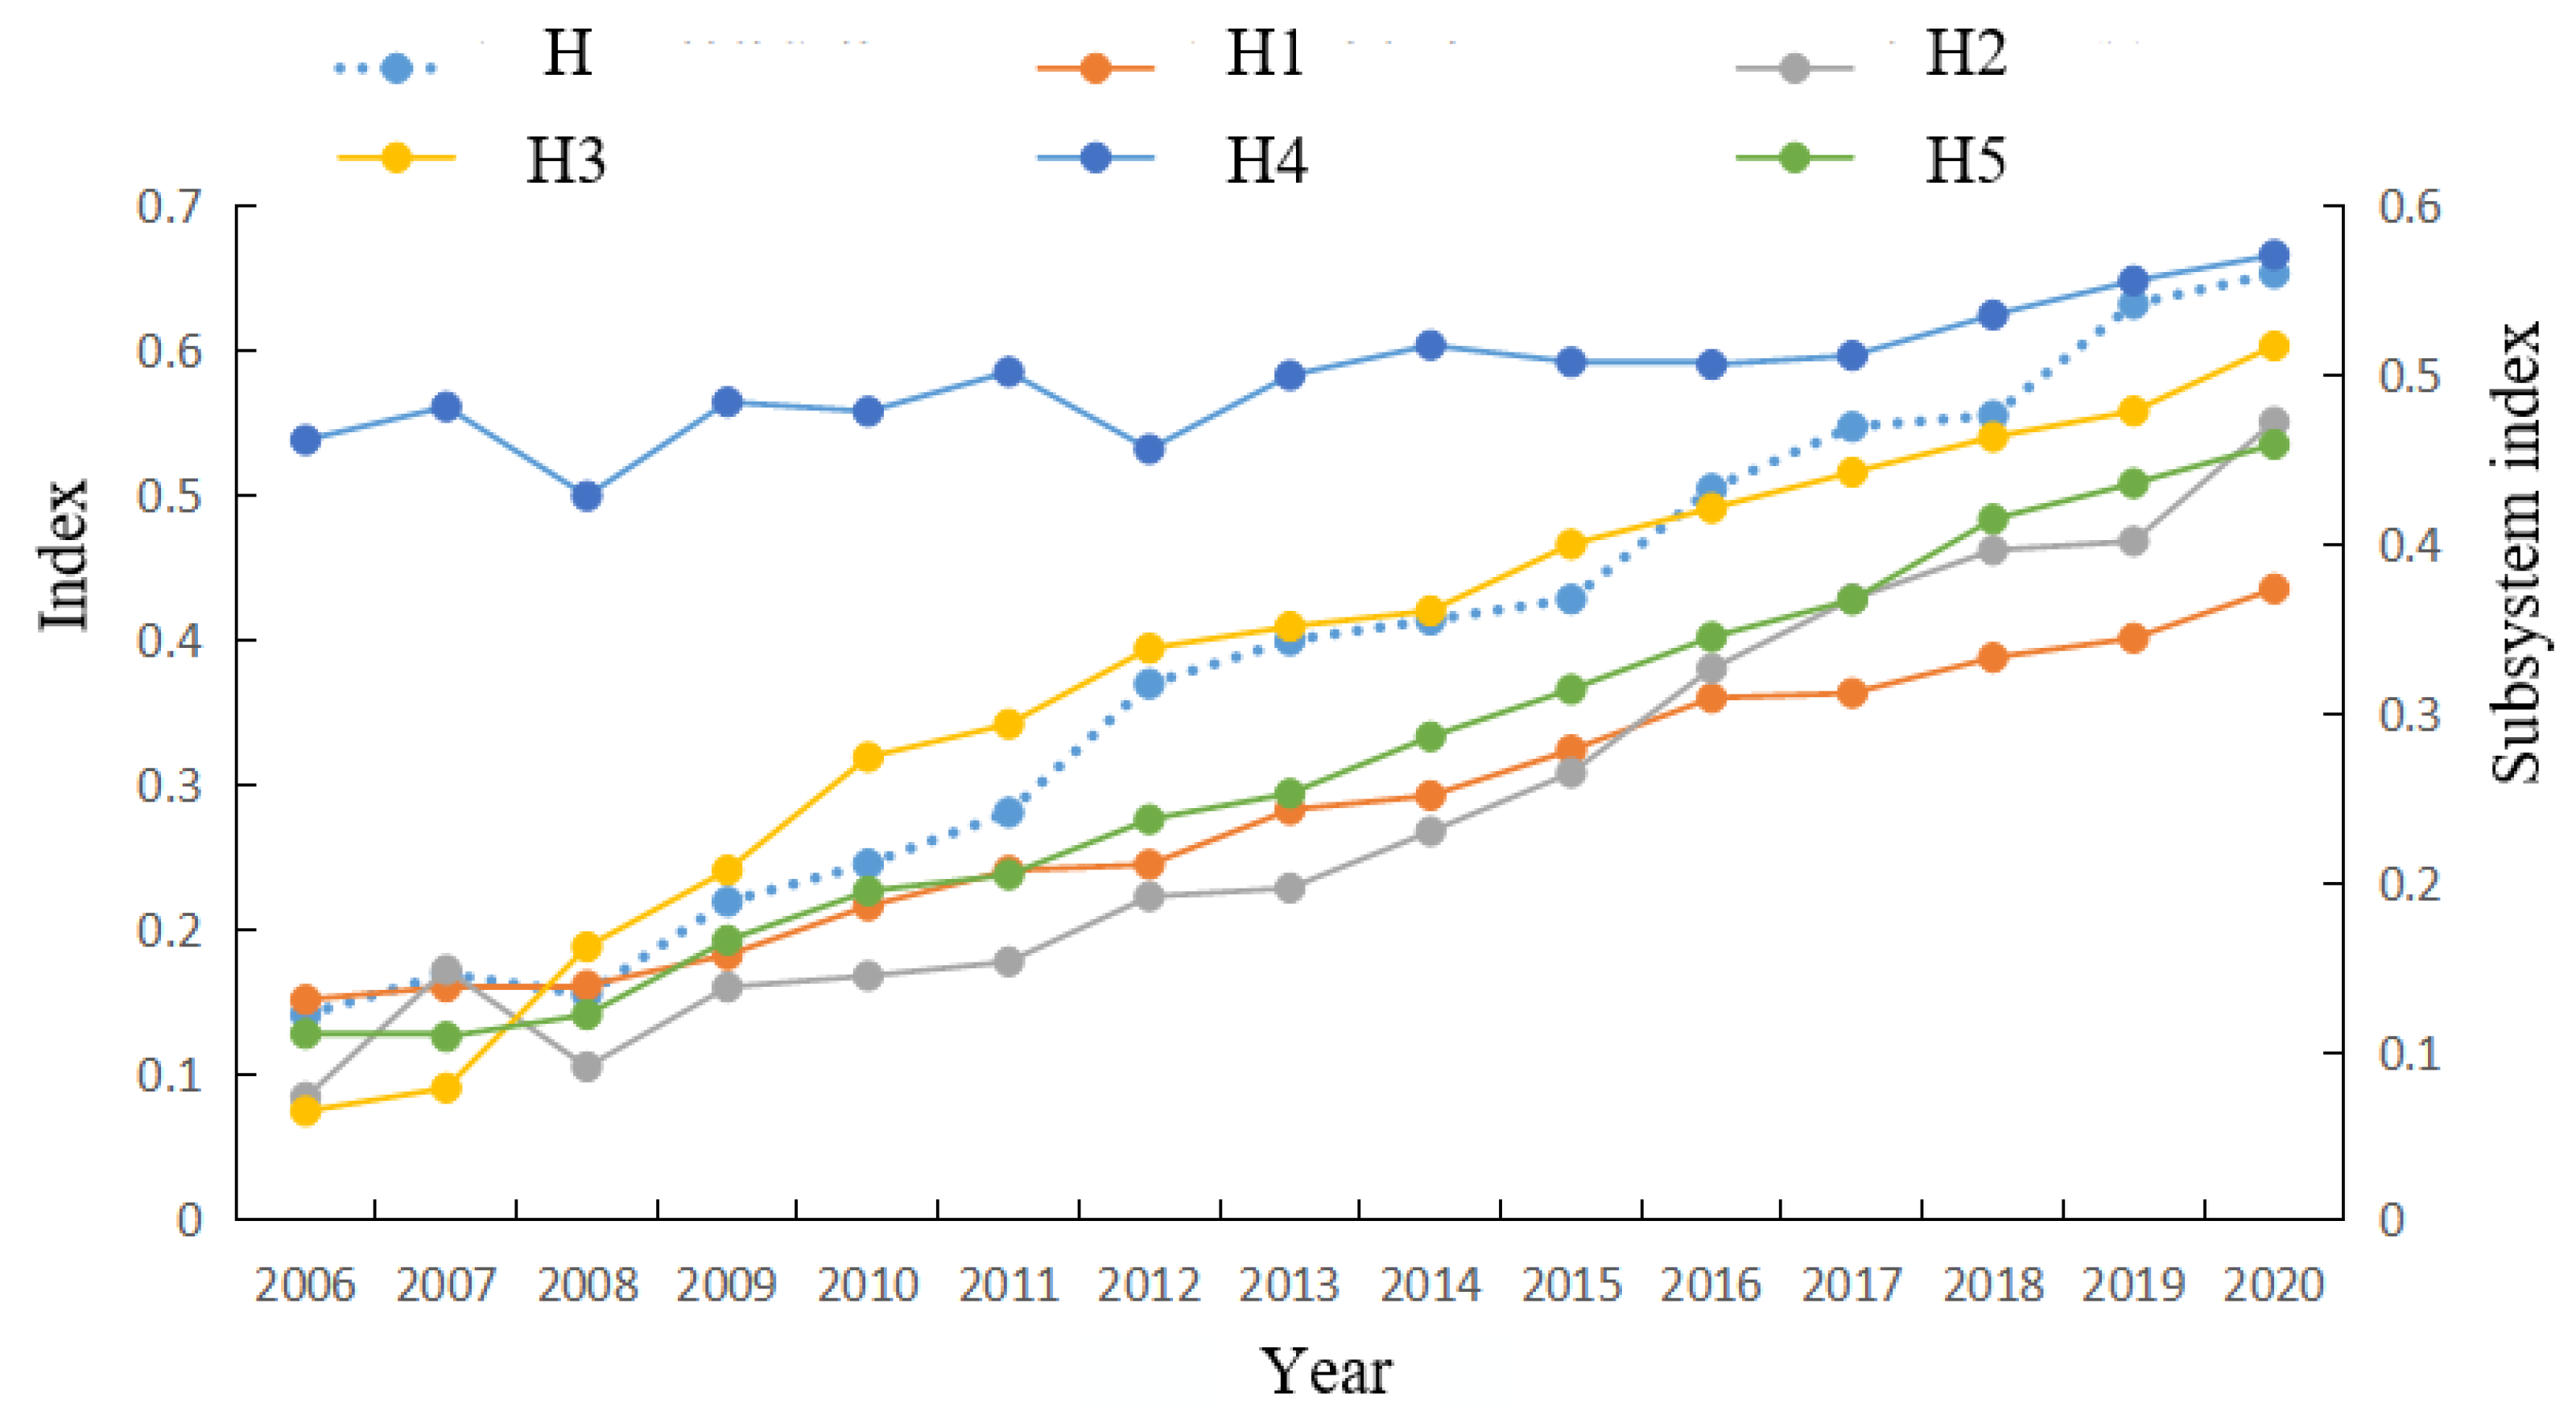
During the study period, China’s MCC index and the MEHD index both showed a growing trend, in which the marine environment carrying capacity was at a high level. There were fluctuating trends in the marine resource carrying capacity, the marine economy carrying capacity, the marine society carrying capacity, and the marine science and technology carrying capacity, which were basically the same and reflected, to a certain extent, that technology, industry, knowledge, and finance were the important factors influencing the enhancement of the MCC. The protection of marine ecology, the use of marine resources, and the management of pollution have yet to be strengthened, and it is necessary to continuously enhance the protection of marine ecology and the environment, reduce the discharge of industrial and domestic wastewater and solid waste, and improve the efficiency of the management of marine ecology and the environment.
(2)
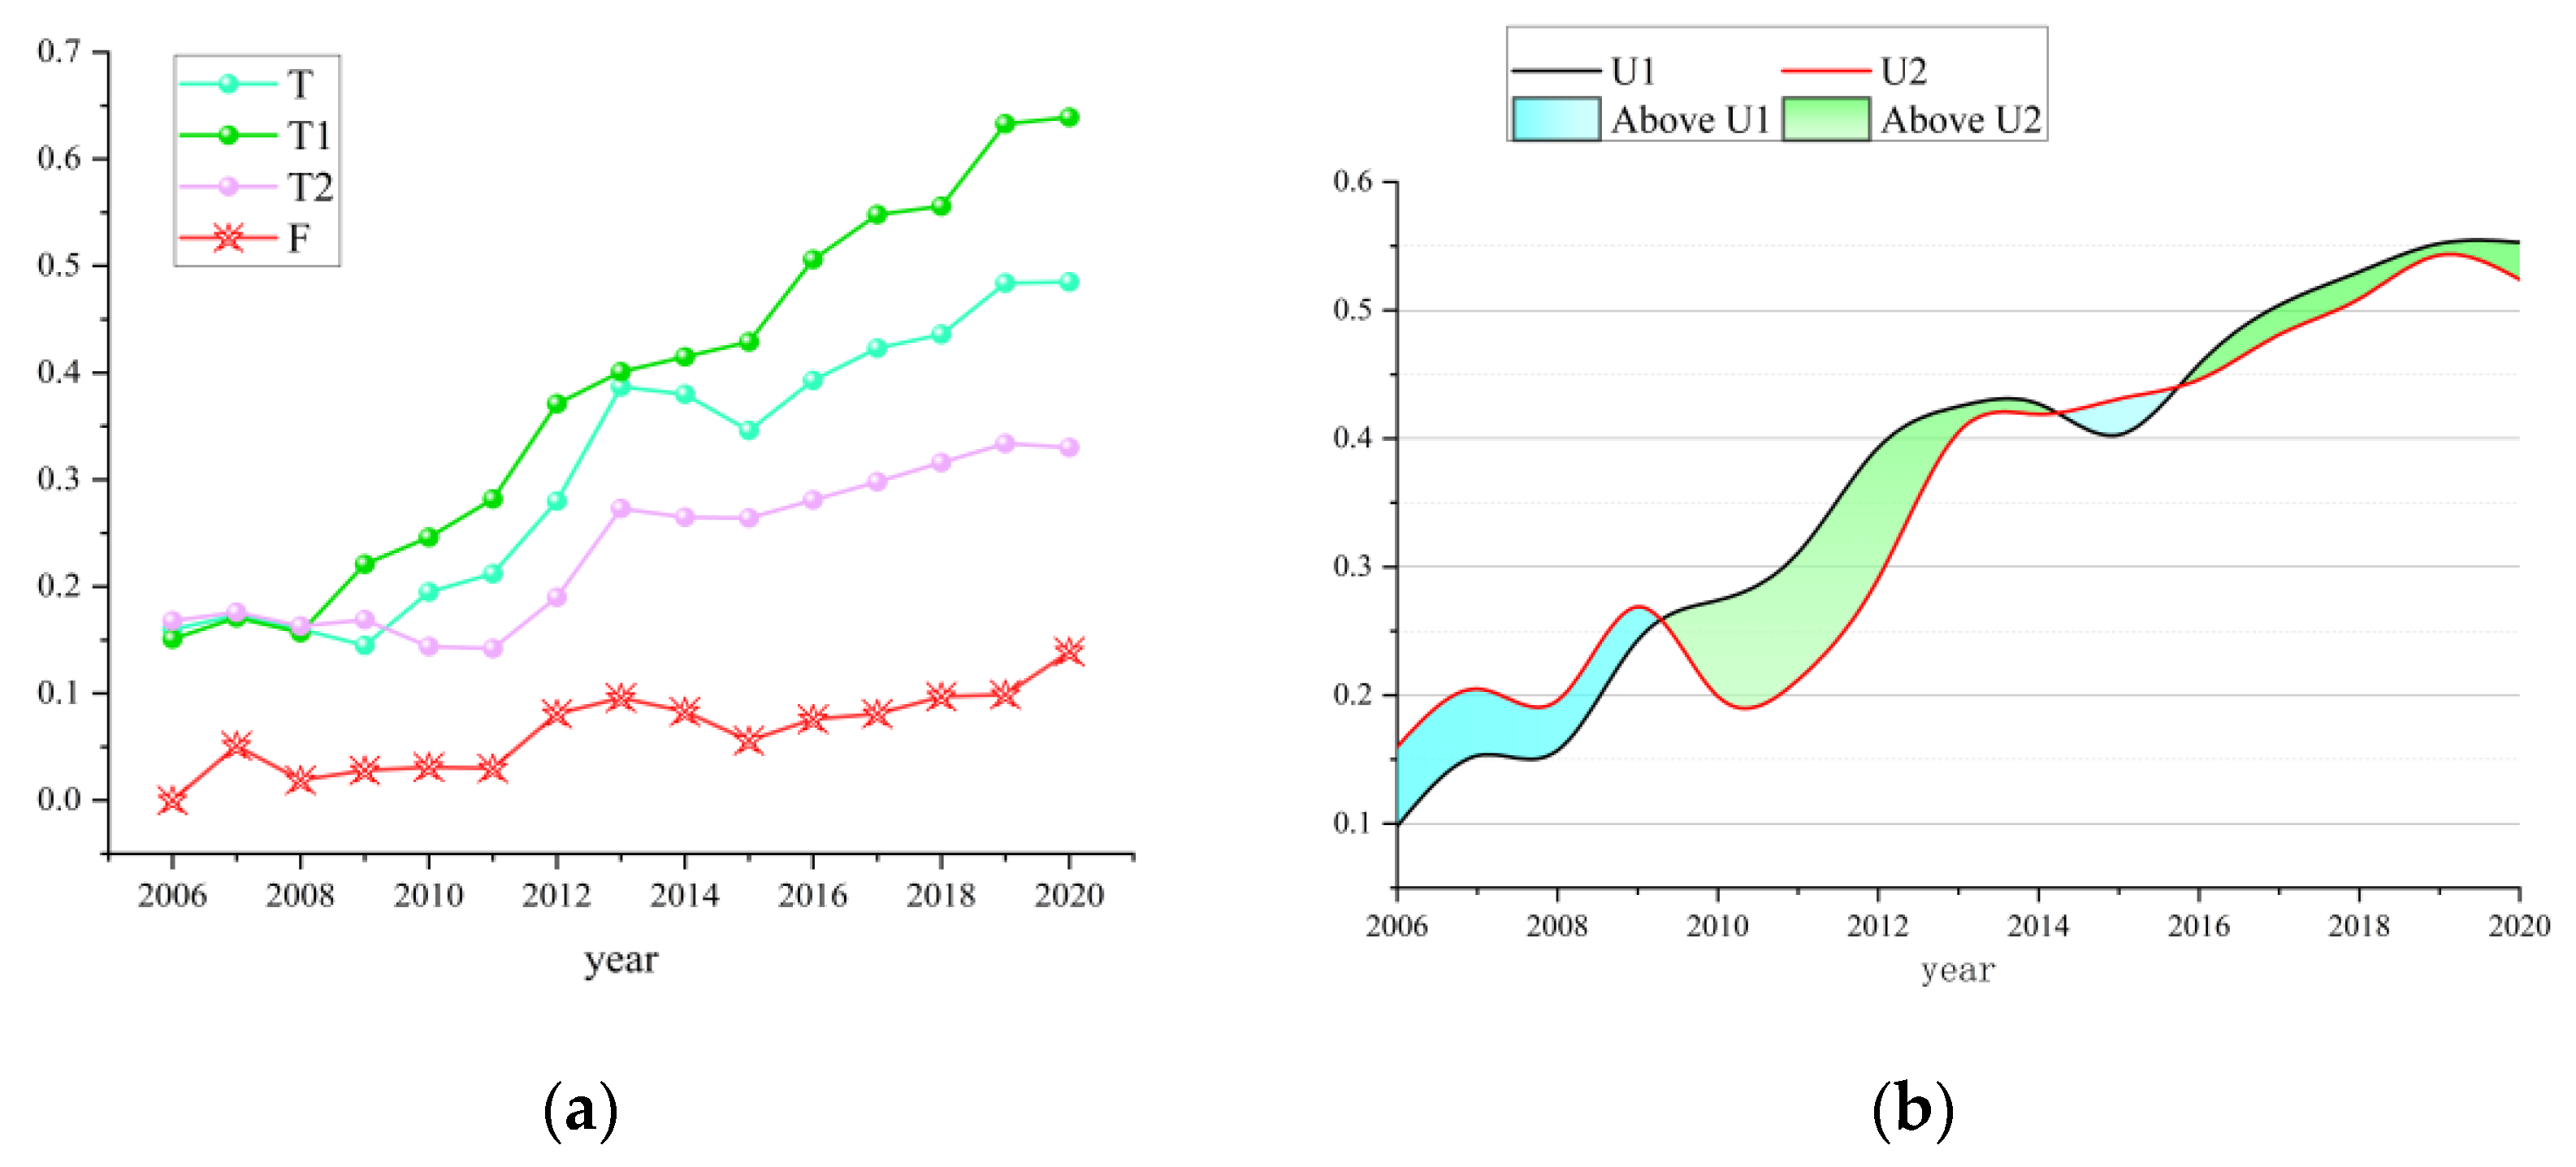
The synergistic development relationship, along with the carrying capacity of the sea area and the marine economy quality development subsystem, shows a gradual upward trend, and the system composite index also shows a slow upward trend. The MCC and MEHD of the subsystem of the order of the overall trend of the rising. Degree of the order of the rising degree of the MEHD of the degree of order of the whole is higher than the MCC, resulting in the overall synergistic degree of the two being lower and a synergistic process of the existence of volatility.
(3)
Geodetector analysis found that the spatial differentiation of the synergistic influence factors of the MCC and the MEHD are mainly the level of marine consumption capacity, the capacity to open up to the outside world, and the level of the structures of the marine industry, and the interaction of the factors is mostly a two-factor enhancement relationship.

Author Contributions

Validation, Q.D., C.L. and X.C.; formal analysis, C.L. and Z.Y.; data curation, X.C.; writing—original draft preparation, X.C. and Z.Y.; writing—review and editing, X.C.; visualisation, X.C.; supervision, C.L. and Z.Y.; project administration, Q.D.; funding acquisition, Q.D. All authors have read and agreed to the published version of the manuscript.

Funding

This research was funded by the National Natural Science Foundation of China, grant number 42076222.

Data Availability Statement

Data are contained within the article. We have use the data from Ministry of Ecology and Environment of the People’s republic of China, Ministry of Natural Resources of the People’s Republic of China, China Oceanic Information Network (http://www.nmdis.org.cn) and National Science & Technology Infrastructure (http://mds.nmdis.org.cn).

Conflicts of Interest

The authors declare no conflicts of interest.

References

  1. Zhang, K.; Tian, S.-Z.; Wu, Y.; Wu, J.; Liu, N.; Wang, D. Evaluation of China’s maritime power construction index and policy textual analysis. Mar. Econ. Manag. 2023, 6, 2116–2150. [Google Scholar] [CrossRef]
  2. Zou, W.; Yang, Y.; Yang, M.; Zhang, X.; Lai, S.; Chen, H. Analyzing efficiency measurement and influencing factors of China’s marine green economy: Based on a two-stage network DEA mode. Front. Mar. Sci. 2023, 10, 1020373. [Google Scholar] [CrossRef]
  3. Barry, J.; Maxwell, D.; Jennings, S.; Walker, D.; Murray, J. Emon: An R-package to support the design of marine ecological and environmental studies, surveys and monitoring programmes. Methods Ecol. Evol. 2017, 8, 1342–1346. [Google Scholar] [CrossRef]
  4. Shao, W.; Xiong, Y.; Shi, D.; Xu, X.; Yue, W.; Soomro, M.A. Time dependent analysis of lateral bearing capacity of reinforced concrete piles combined with corrosion and scour. Ocean Eng. 2023, 282, 115065. [Google Scholar] [CrossRef]
  5. Casimiro, D.; Ventura, M.A.; Botelho, A.Z.; Guerreiro, J. Ecotourism in Marine Protected Areas as a tool to valuate natural capital and enhance good marine governance: A review. Front. Mar. Sci. 2023, 9, 1002677. [Google Scholar] [CrossRef]
  6. Xiao, J.; Hu, D. Construction and empirical study of the evaluation index system for high-quality development of marine economy in Guangdong Province based on five new development concepts. J. Phys. Conf. Ser. IOP Publ. 2020, 1629, 012030. [Google Scholar] [CrossRef]
  7. Di, Q.B.; Lv, D.H. Exploration of the relationship between the marine carrying capacity and the measurement of marine economic benefits and its response. Ecol. Econ. 2019, 35, 126–133+169. [Google Scholar]
  8. Han, L.M.; Luan, X.Z. A review of research on the marine carrying capacity. Mar. Dev. Manag. 2008, 25, 32–36. [Google Scholar]
  9. Kaeriyama, M.; Seo, H.; Kudo, H.; Nagata, M. Perspectives on wild and hatchery salmon interactions at sea, potential climate effects on Japanese chum salmon, and the need for sustainable salmon fishery management reform in Japan. Environ. Biol. Fish. 2012, 94, 165–177. [Google Scholar] [CrossRef]
  10. Chen, X.L.; Yu, Z.; Di, Q.B. Assessing the marine ecological welfare performance of coastal regions in China and analysing its determining factors. Ecol. Ind. 2023, 147, 109942. [Google Scholar] [CrossRef]
  11. Levrel, H.; Pioch, S.; Spieler, R. Compensatory mitigation in marine ecosystems: Which indicators for assessing the “no net loss” goal of ecosystem services and ecological functions? Mar. Policy 2012, 36, 1202–1210. [Google Scholar] [CrossRef]
  12. Li, W.; Yue, Q.; Hu, H.; Liu, L. Current status of ecological compensation for Bohai Sea reclamation and management countermeasures. Mar. Policy 2023, 155, 105778. [Google Scholar] [CrossRef]
  13. Alfosail, F.K.; Nayfeh, A.H.; Younis, M.I. A state space approach for the eigenvalue problem of marine risers. Meccanica 2018, 53, 747–757. [Google Scholar] [CrossRef]
  14. Bui, L.T.; Tran, D.L.T. Assessing marine environmental carrying capacity in semi-enclosed coastal areas—Models and related databases. Sci. Total Environ. 2022, 838, 156043. [Google Scholar] [CrossRef]
  15. Wang, L.; Kerr, L.A.; Record, N.R.; Bridger, E.; Tupper, B.; Mills, K.E.; Armstrong, E.M.; Pershing, A.J. Modeling marine pelagic fish species spatiotemporal distributions utilizing a maximum entropy approach. Fish. Oceanogr. 2018, 27, 571–586. [Google Scholar] [CrossRef]
  16. Sadiq, R.; Husain, T.; Veitch, B.; Bose, N. Risk-based decision-making for drilling waste discharges using a fuzzy synthetic evaluation technique. Ocean Eng. 2004, 31, 1929–1953. [Google Scholar] [CrossRef]
  17. Shao, W.; Sun, Q.; Xu, X.; Yue, W.; Shi, D. Durability life prediction and horizontal bearing characteristics of CFRP composite piles in marine environments. Constr. Build. Mater. 2023, 367, 130116. [Google Scholar] [CrossRef]
  18. Yu, Z.K.; Kong, H.Z. Evaluation of the rationality of spatial layout of marine fishery based on the marine carrying capacity: An example from the Blue Zone of Shandong Peninsula. Econ. Geogr. 2014, 34, 112–117. [Google Scholar]
  19. Shan, C.H.; Cui, S.S. Study on the development strategy selection of China’s coastal tourism under the perspective of marine carrying capacity. J. Ocean Univ. China (Soc. Sci. Ed.) 2016, 14–19. [Google Scholar] [CrossRef]
  20. Adams, C.M.; Hernandez, E.; Cato, J.C. The economic significance of the Gulf of Mexico related to population, income, employment, minerals, fisheries and ship. Ocean Coast. Manag. 2004, 47, 565–580. [Google Scholar] [CrossRef]
  21. Yu, Z.; Chen, X.L.; Di, Q.B. Integration of marine and terrestrial ecological economies in the cities of the Bohai rim, China, based on the concept of viscosity. Water 2023, 15, 749. [Google Scholar] [CrossRef]
  22. Chen, X.; Di, Q.; Hou, Z.; Yu, Z. Measurement of carbon emissions from marine fisheries and system dynamics simulation analysis: China’s northern marine economic zone case. Mar. Policy 2022, 145, 105279. [Google Scholar] [CrossRef]
  23. Bennett, N.J.; Dearden, P. From measuring outcomes to providing inputs: Governance, management, and local development for more effective marine protected areas. Mar. Policy 2014, 50, 96–110. [Google Scholar] [CrossRef]
  24. Nong, T.N.M. Performance efficiency assessment of Vietnamese ports: An application of Delphi with Kamet principles and DEA model. Asian J. Shipp. Logist. 2023, 39, 1–12. [Google Scholar] [CrossRef]
  25. Wang, S.; Lu, B.; Yin, K. Financial development, productivity, and high-quality development of the marine economy. Mar. Policy 2021, 130, 104553. [Google Scholar] [CrossRef]
  26. Chen, X.; Di, Q.; Jia, W.; Hou, Z. Spatial correlation network of pollution and carbon emission reductions coupled with high-quality economic development in three Chinese urban agglomerations. Sustain. Cities Soc. 2023, 94, 104552. [Google Scholar] [CrossRef]
  27. Chen, X.; Sun, Z.; Di, Q.; Liang, C. Marine fishery carbon emission reduction and changing factors behind marine fishery eco-efficiency growth in China. Ecol. Inform. 2024, 80, 102478. [Google Scholar] [CrossRef]
  28. Cavallo, M.; Bugeja Said, A.; Pérez Agúndez, J.A. Who is in and who is out in ocean economies development? Sustainability 2023, 15, 3253. [Google Scholar] [CrossRef]
  29. Wei, X.; Hu, Q.; Shen, W.; Ma, J. Influence of the evolution of marine industry structure on the green total factor productivity of marine economy. Water 2021, 13, 1108. [Google Scholar] [CrossRef]
  30. Blasiak, R.; Jouffray, J.B.; Amon, D.J.; Claudet, J.; Dunshirn, P.; Søgaard Jørgensen, P.; Pranindita, A.; Wabnitz, C.C.C.; Zhivkoplias, E.; Österblom, H. Making marine biotechnology work for people and nature. Nat. Ecol. Evol. 2023, 7, 482–485. [Google Scholar] [CrossRef]
  31. Zheng, J.H.; Di, Q.B. Coupling analysis of marine economic development level and sea-shore carrying capacity in Round-the-Bohai Region. Mar. Econ. 2017, 7, 37–46. [Google Scholar]
  32. Uddin, M.G.; Nash, S.; Rahman, A.; Dabrowski, T.; Olbert, A.I. Data-driven modelling for assessing trophic status in marine ecosystems using machine learning approaches. Environ. Res. 2023, 242, 117755. [Google Scholar] [CrossRef]
  33. Cheng, J.; Zhang, X.; Gao, Q. Analysis of the spatio-temporal changes and driving factors of the marine economic–ecological–social coupling coordination: A case study of 11 coastal regions in China. Ecol. Ind. 2023, 153, 110392. [Google Scholar] [CrossRef]
  34. Cao, Q.; Sun, C.; Zhao, L.; Cao, W.; Yan, X. Marine resource congestion in China: Identifying, measuring, and assessing its impact on sustainable development of the marine economy. PLoS ONE 2020, 15, e0227211. [Google Scholar] [CrossRef]
  35. Xin, Z. Study on the evaluation of the carrying capacity of marine resources and Environment in Weihai City in China. Popul. Res. Environ. Econ. 2023, 4, 1–14. [Google Scholar]
  36. Ma, R.; Ji, S.; Ma, J.; Shao, Z.; Zhu, B.; Ren, L.; Li, J.; Liu, L. Exploring resource and environmental carrying capacity and suitability for use in marine spatial planning: A case study of Wenzhou, China. Ocean Coast. Manag. 2022, 226, 106258. [Google Scholar] [CrossRef]
  37. Gao, J.; An, T.; Shen, J.; Zhang, K.; Yin, Y.; Zhao, R.; He, G.; Hynes, S.; Jattak, Z.U. Development of a land-sea coordination degree index for coastal regions of China. Ocean Coast. Manag. 2022, 230, 106370. [Google Scholar] [CrossRef]
  38. Oldenburg, M.; Jensen, H.J. Maritime welfare facilities—Utilization and relevance for the compensation of shipboard stress. J. Occup. Med. Toxicol. 2019, 14, 11. [Google Scholar] [CrossRef]
  39. Sedghiyan, D.; Ashouri, A.; Maftouni, N.; Xiong, Q.; Rezaee, E.; Sadeghi, S. RETRACTED: Prioritization of renewable energy resources in five climate zones in Iran using AHP, hybrid AHP-TOPSIS and AHP-SAW methods. Sustain. Energy Technol. Assess. 2021, 44, 101045. [Google Scholar] [CrossRef]
  40. Wang, S.; Chen, S.; Zhang, H.; Song, M. The model of early warning for China’s marine ecology-economy symbiosis security. Mar. Policy 2021, 128, 104476. [Google Scholar] [CrossRef]
  41. Possamai, B.; Vollrath, S.R.; Vieira, J.P.; Garcia, A.M. Synergistic climatic and anthropogenic effects on marine species turnover in estuarine waters. Sci. Total Environ. 2024, 908, 168324. [Google Scholar] [CrossRef]
  42. Kosmopoulos, J.C.; Campbell, D.E.; Whitaker, R.J.; Wilbanks, E.G. Horizontal gene transfer and CRISPR targeting drive phage-bacterial host interactions and co-evolution in pink berry marine microbial aggregates. bioRxiv 2023, 2. [Google Scholar] [CrossRef]
  43. Hao, Y.; Sun, C.; Wei, J.; Gu, S. Study on measuring and evaluating the synergy effect of regional coal mine emergency management in China based on the composite system synergy model. Geofluids 2022, 2022, 1845795. [Google Scholar] [CrossRef]
  44. Sun, Z.; Guan, H.; Zhao, A. Research on the synergistic effect of the composite system for high-quality development of the marine economy in China. Systems 2023, 11, 282. [Google Scholar] [CrossRef]
  45. Wang, J.F.; Xu, C.D. Geodetector: Principles and Prospects. Acta Geogr. Sin. 2017, 72, 116–134. [Google Scholar]
  46. Glein, C.R.; Shock, E.L. Sodium chloride as a geophysical probe of a subsurface ocean on Enceladus. Geophys. Res. Lett. 2010, 37. [Google Scholar] [CrossRef]
  47. Zhang, C.; Wang, M. Assessing the conjugal of the marine economy-ecology-society composite system: China’s Case. Front. Mar. Sci. 2022, 9, 963468. [Google Scholar] [CrossRef]
  48. Lin, Y.; Yang, Y.; Li, P.; Feng, C.; Ding, J.; Zhou, J.; Jiang, Q.; Ye, G. Spatial-temporal evaluation of marine ecological civilization of Zhejiang province, China. Mar. Policy 2022, 135, 104835. [Google Scholar] [CrossRef]
  49. Lv, P.; Li, X.; Zhang, H.; Liu, X.; Kong, L. Research on the spatial and temporal distribution of logistics enterprises in Xinjiang and the influencing factors based on POI data. Sustainability 2022, 14, 14845. [Google Scholar] [CrossRef]
Figure 1. Research design.
Water 16 00394 g001
Figure 2. Mechanisms for synergistic development.
Water 16 00394 g002
Figure 3. Indicator system of the marine carrying capacity.
Water 16 00394 g003
Figure 4. Indicator system of the high-quality development of the marine economy.
Water 16 00394 g004
Figure 5. China’s gross ocean product and its share in 2006–2021.
Water 16 00394 g005
Figure 6. The weights of indexes with the entropy weight method.
Water 16 00394 g006
Figure 7. The trend of the marine carrying capacity.
Water 16 00394 g007
Figure 8. (a) Box diagram of the marine carrying capacity. (b) Box diagram of marine economy high-quality development.
Water 16 00394 g008
Figure 9. The trend of the high-quality development index of the marine economy.
Water 16 00394 g009
Figure 10. (a) Overall trend. (b) Collaborative change trend.
Water 16 00394 g010
Table 1. Composite system synergy evaluation criteria.
Synergy Degree[−1, −0.6](−0.6, −0.2](−0.2, 0](0, 0.2](0.2, −0.6](0.6, −1]
Collaborative stateHighly non-synergyModerate non-synergyMild non-synergyMild synergyModerate synergyHighly synergy
Table 2. Composite synergy index of the marine carrying capacity and marine economy high-quality development.
YearSystem Comprehensive Development Index (T)Marine Carrying Capacity (N)High-Quality Development Index (H)Order Degree of Marine Carrying Capacity Subsystem (U1)Order Degree of High-Quality Development Subsystem (U2)Composite System Coordination Degree (F)Standards
20060.160 0.151 0.168 0.098 0.160 --
20070.173 0.171 0.176 0.153 0.205 0.156Mild non-synergy
20080.160 0.157 0.163 0.157 0.196 0.191Mild non-synergy
20090.145 0.221 0.169 0.243 0.269 0.281Mild synergy
20100.195 0.246 0.144 0.274 0.199 0.309Mild synergy
20110.212 0.282 0.142 0.311 0.212 0.304Mild synergy
20120.280 0.371 0.190 0.393 0.291 0.281Mild synergy
20130.387 0.401 0.273 0.425 0.405 0.296 Mild synergy
20140.380 0.415 0.265 0.427 0.419 0.383 Mild synergy
20150.346 0.429 0.264 0.403 0.431 0.356 Mild synergy
20160.393 0.506 0.281 0.458 0.446 0.376 Mild synergy
20170.423 0.548 0.298 0.504 0.481 0.381 Mild synergy
20180.436 0.556 0.316 0.530 0.509 0.397 Mild synergy
20190.484 0.633 0.334 0.552 0.543 0.409 Moderate synergy
20200.485 0.639 0.330 0.553 0.524 0.339 Mild synergy
Table 3. Geodetection results of the impact factors.
Level Measurement of Factor2006201020152020
(Z1) Land economic development capacity0.3380.4590.5640.688
(Z2) Marine industrial structure level0.8640.7460.9200.763
(Z3) Marine science and technology innovation0.5740.6540.8250.734
(Z4) Marine economic development capacity0.4260.5280.7470.573
(Z5) Marine consumption capacity level0.8310.8570.8420.652
(Z6) Marine opening capacity level0.7110.7430.7680.663
Table 4. Interaction detection results from different influencing factors.
YearZ1∩Z2Z1∩Z3Z1∩Z4Z1∩Z5Z1∩Z6Z2∩Z3Z2∩Z4Z2∩Z5Z2∩Z6Z3∩Z4Z3∩Z5Z3∩Z6Z4∩Z5Z4∩Z6Z5∩Z6
2006BENENEBENEBEBEBEBENENENEBEBEBE
2010BENEBEBENENEBEBEBENEBEBEBEBEBE
2015BEBENEBENEBEBEBEBEBEBEBEBENEBE
2020BEBENEBENEBEBENEBENEBENENENEBE
Note: NE represents non-linear enhancement; BE represents bi-factor enhancement.
Disclaimer/Publisher’s Note: The statements, opinions and data contained in all publications are solely those of the individual author(s) and contributor(s) and not of MDPI and/or the editor(s). MDPI and/or the editor(s) disclaim responsibility for any injury to people or property resulting from any ideas, methods, instructions or products referred to in the content.

