
Exploring Key Aspects of Sea Level Rise and Their Implications: An Overview


1
College of Engineering and IT, University of Dubai, Dubai 14143, United Arab Emirates
2
Department of Earth and Environmental Sciences, University of Milano-Bicocca, 20126 Milan, Italy
*
Author to whom correspondence should be addressed.
Water 2024, 16(3), 388; https://doi.org/10.3390/w16030388
Submission received: 19 December 2023
/
Revised: 18 January 2024
/
Accepted: 19 January 2024
/
Published: 24 January 2024
(This article belongs to the Section Water and Climate Change)
Abstract
:Sea level rise (SLR) is one of the most pressing challenges of climate change and has drawn noticeable research interest over the past few decades. Factors induced by global climate change, such as temperature increase, have resulted in both direct and indirect changes in sea levels at different spatial scales. Various climatic and non-climatic events contribute to sea level changes, posing risks to coastal and low-lying areas. Nevertheless, changes in sea level are not uniformly distributed globally due to several regional factors such as wave actions, storm surge frequencies, and tectonic land movement. The high exposure to those factors increases the vulnerability of subjected areas to SLR impacts. The impacts of events induced by climate change and SLR are reflected in biophysical, socioeconomic, and environmental aspects. Different indicator-based and model-based approaches are used to assess coastal areas’ vulnerabilities, response to impacts, and implementation of adaptation and mitigation measures. Various studies have been conducted to project future SLR impacts and evaluate implemented protection and adaptation approaches, aiding policymakers in planning effective adaptation and mitigation measures to reduce damage. This paper provides an overview of SLR and its key elements, encompassing contributing factors, impacts, and mitigation and adaptation measures, featuring a dedicated section on the Arabian Gulf, a semi-enclosed sea.
1. Introduction
Climate change is one of the most pressing challenges of the century. The increase in CO2 emissions and greenhouse gases (GHGs) is causing a rise in temperature, which leads to a range of far-reaching consequences for economies, societies, and ecosystems around the world. One of the most significant impacts of climate change is sea level rise (SLR) [1,2]. According to the Intergovernmental Panel on Climate Change (IPCC), the global mean sea level (GMSL) has been increasing at accelerating rates for the past century, reaching a rate of 3.7 mm/year in 2018 and is estimated to reach up to 77 cm by the end of the current century [3]. It is also projected that GMSL could reach up to 5.4 m by 2300 [4] depending on the rate of GHG emissions and the approaches taken to mitigate them. SLR is primarily caused by two factors: the thermal expansion of seawater and the melting of ice sheets and glaciers [2]. Other climatic and non-climatic events such as cyclone-driven events and earthquakes also contribute to changes in the regional/relative mean sea level (RMSL) [4].
Coastal areas are of significant economic and environmental importance, and increasing human activities are placing additional stress on them. The impacts of sea level rise are already persistent in many coastal areas globally [5]. Low-lying coastal areas, such as Small Island Developing States (SIDS), are particularly vulnerable to inundation, storm surges, and floods [3,4]. Areas exposed to tidal events also experience the impacts of SLR [6]. In some areas, saltwater intrusion into groundwater and freshwater aquifers threatens freshwater supplies and the production of agricultural [4,7]. Furthermore, SLR can cause physical changes to coastal areas such as coastal erosion and flooding, leading to a loss of land and infrastructure [3,8]. To address the challenges caused by climate change and SLR and reduce their impacts, a comprehensive and coordinated response is needed. This includes reducing GHG emissions to mitigate the anticipated damage of future SLR scenarios and the associated extreme weather events [9], as well as investing in adaptation measures to help vulnerable communities cope with the impacts that are already occurring [10], including hard or soft engineering solutions, ecosystem-based structures, and strategy plans [11]. The use of visualization tools that represent the relationship between impacts and contributing factors to SLR can bridge the gap in understanding the relationship between different components of SLR, raising awareness, and helping decision makers form proper mitigation and adaptation measures [5].
This work presents an overview of SLR and its key elements as found in the literature, shaped by our interpretation of those resources. These elements were identified based on our review of IPCC reports [3,12]. It also highlights the climatic and non-climatic drivers of SLR and its consequences. The studies in this work cover all spatial scales (global, regional, national, and local) and emphasize the distinction between global and regional contributing factors to SLR. As we found a complex interconnection relation among SLR impacts, we grouped them into three categories: physical/biophysical, socioeconomic, and environmental/ecological/chemical impacts. Furthermore, because of the lack of a standardized way of categorizing different analysis approaches in the literature and the vast variations among research studies, we identified two main categories for coastal analysis and assessment approaches, namely: coastal impact modeling approaches and coastal vulnerability assessment approaches. Figure 1 shows the main aspects related to SLR that were covered in this paper. The reviewed papers were collected from different databases and publications repositories, including IEEE Xplore, Science Direct, JSTOR, Springer, Elsevier, MDPI, Wiley Online Library, Francis and Taylor, and Frontiers for the years between 2015 and 2022 (with the exception of papers that discuss general concepts, historical information, highly relevant info, and three latest analysis papers of 2023) using the following keywords and their combination: “sea level rise”, “coastal vulnerability assessment”, “factors of sea-level rise”, “climate change impacts on sea level rise”, “visualizing sea level changes”, “sea level rise impacts”, “adaptation and mitigation measures to SLR”, and “modeling sea-level rise”. A screening process of the search results was conducted and over 100 references were selected for the review process, with emphasis on studies that included highly vulnerable coastal areas/communities such as Southeast Asia and Mediterranean Basin countries. Papers with a sole focus on SLR impacts on ecosystems such as mangroves were excluded from the review process. Nevertheless, they were briefly mentioned in Section 3.3 and Section 5.1. Similarly, papers that focused solely on flooding were excluded to differentiate flooding caused by SLR and climatic events in coastal regions from flooding in inland areas and riversides. Additionally, a targeted search was conducted to gain a deeper understanding of topics associated with SLR that we found highly relevant. These topics were briefly or repeatedly mentioned in papers during the screening processes without sufficient details. Examples include sea level budget, tectonic movements and SLR, El Niño events, and time-series forecasting of SLR. Figure 2 shows the number of papers that were reviewed in each category over the years.
2. Contributing Factors
SLR is a significant indicator of climate change as the increase in global temperature contributes to the increase in GMSL. Thermal expansion of ocean water and glacier and ice melts have been identified as the main contributors to sea level changes [13]. However, changes in sea levels are neither linear nor uniform [2,9,14]. The propagation of changes in GMSL depends on the bathymetry of seas and oceans, which can take anywhere from less than a decade to hundreds of years to be reflected deep ocean regions [2]. Uncertainties associated with changes in sea levels should be accounted for in SLR analysis and projections, as it was found that earlier IPCC reports did not give them sufficient emphasis. Associated uncertainties and the variations in different contributing factors to sea levels can lead to different changes in RMSL compared with GMSL [14,15,16]. This section highlights the contributing factors of various spatial scales and the associated uncertainties.
2.1. Global Factors
Global changes in sea level can be a result of both non-climatic (geological) and climatic changes, with the latter having a more noticable influence on GMSL [1]. In 1983, Hoffmann [1] identified five climatic change factors that contribute to changes in sea level and used them to build 90 different scenarios. Hoffmann factors include (1) carbon dioxide emission; (2) fraction airborne, which considers the movement and chemical actions of carbon between atmosphere, biosphere, and hydrosphere; (3) concentration of other GHGs, specifically methane, nitrous oxide, and chlorofluorocarbons; (4) climate sensitivity that measures the change in temperature due to gas emissions; (5) thermal expansion of ocean water, which measures the transport of heat into deeper ocean water; and (6) snow and ice contributions. The contributing factors identified by IPCC Assessment Reports (AR) were narrowed to the (1) thermal expansion of ocean water and (2)ice and glacier melting. Nevertheless, uncertainties associated with the factors contributing to GMSL were considered in projections by [3,17]. An example of uncertainty that they considered is the future estimation of GHGs in future SLR projections. In addition to the factors listed by IPCC, additional factors that contribute to GMSL have been identified by [14], including (1) land-based ice melting (whihc will eventually end up in the sea) and (2) changes in land water storage due to natural and human activities, such as building dams and extracting water for agricultural activities. These activities can result in both an increase or decrease in SLR rates. Although there were no historical observational data to identify the contribution of land water storage, it was stated in [14] that it could cause a change of up to 2 mm/y during ENSO [18] events. Furthermore, uncertainties associated with global contributing factors were considered for SLR projection. These uncertainties include deep ocean warming (although it has a relatively small contribution to SLR compared with upper ocean warming) and dynamical instabilities in melting glaciers and ice sheets that are below sea water level, which cause an accelerated increase in SLR due to the thermal expansion of ocean water. Overall, it was found that considering uncertainties of thermal expansion and melting ice sheet would cause a deviation in projections by 10% and 15%, respectively, to GMSL by the year 2100, making glaciers and ice sheets the main contributors to GMSL [14]. Figure 3 shows the interpretation of [14] of the contributing factors to GMSL in IPCC AR5. The percentage of contributions of ice melt and thermal expansion to GMSL were 45.5% and 34%, respectively, where glaciers’ melts formed the highest share of land ice melting contribution. The estimated uncertainties associated with land ice melt and thermal expansion factors were 15% and 10%. The uncertainty was determined by how much the individual time series deviated from the mean. This chart also considered the contribution of the net impact of anthropogenic land water storage to GMSL and the small contribution of deep ocean water to thermal expansion. The uncertainty associated with the remaining 20% and the other contributors to GMSL were not explicitly addressed in [14]. The contribution of different factors to GMSl was continuously analyzed and corrected via sea level budget analysis, where observations were compared with the estimated values of a sum of different factors [19]. Equation (1) is an example of considering different contributing factors, where refers to changes in GMSL due to thermal expansion and salinity and refers to changes in GMSL due to water exchange between land and ocean, such as ice melts and land water storage. Updated versions of the sea level budget can include sea level change in deep ocean due to thermal expansion [20] and atmospheric water vapor [19].
2.2. Regional Factors
RMSL diverges from GMSL at 80% of coastal areas globally [21]. The divergence between GMSL and RMSL is attributed to some adjustments in global contributing factors. These adjustments include contributing factors that affect SLR at the regional scales and beyond, such as vertical land movement, melting land-based ice, and dynamic ocean movements [22]. IPCC AR6 [3] has considered the contribution of other factors and uncertainties that affect both GMSL and RMSL. Overall, changes in RMSL result from both climatic and non-climatic factors, in addition to changes in GMSL [23]. Figure 4 illustrates the variations between RMSL and GMSL, with positive values indicating high variation rates. Notably, these variations are evident near Greenland and in many global coastal zones, particularly in Southeast Asia, East Africa, and Northern Europe. However, this figure excluded semi-enclosed seas, such as the Mediterranean Sea, despite numerous studies indicating they will be highly impacted [17]. Time and distance dimensions have been identified as sources of deviation between RMSL and GMSL in which both those dimensions will influence when and how changes in sea levels will propagate globally. As events contributing to SLR at both global and local scales are interconnected, changes can propagate through different water, ultimately reflecting on coastal processes [24]. Bosello and De Cian [8] listed a number of climatic and non-climatic components that cover environmental, physical, and socioeconomic aspects of SLR and its impacts, including CO2 emissions, SST, characteristics of extreme weather events and rainfall, land movement and subsidence due to natural and human activities, flooding, wetland loss, impeded drainage, and saltwater intrusion. The following subsections discuss some climatic and non-climatic factors that lead to a deviation between GMSL and RMSL.
2.2.1. Climatic Drivers
Climatic drivers encompass factors arising from atmospheric and oceanic changes [25]. SLR rates are influenced by the intensity, height, and frequency of wave actions in the coastal and tidally influenced areas [26,27], whereas linear SLR scenarios and extreme events can also influence wave actions in coastal areas [26]. Short-term impacts of tide-driven and storm-driven events also exhibit prominent seasonal patterns, which are used to assess the changes in regional sea levels [6]. Wave intensity can be calculated via the Dyer function of wave power that uses components such as wave height, gravity, and density [28]. Wave actions can be modeled using historical data [29], and numerical simulators such as SWAN [26,30,31,32], TOMAWAC [26], XBeach [27], Method of Splitting Tsunami (MOST) [33], or forecasting models [26,32]. Google Earth engines and satellite images were used to monitor the dynamics of seawater via an open-source Python-based tool PyGEE-SWToolbox [34].
Another climatic driver of RMSL is the melting of land-based ice, which causes the transfer of freshwater into the ocean. This alters the density structure of the ocean and the wave actions, resulting in changes in RMSL over time. However, the elastic response to this process induces another non-climatic change that influences RMSL (see Section 2.2.2) [35].
The salinity of the nearby sea also alters SLR [14]. Moreover, some studies have shown that there is a linear relationship between estuarine hydrodynamics and SLR [36]. Ocean dynamics can potentially affect the salinity of seawater [9]. Adding salinity as a factor in future SLR projections will provide more accurate and realistic estimates of SLR impacts than what is estimated by scenarios that do not include such uncertainties [37]. Salinity is attributed as a contributing factor alongside thermal expansion contribution in sea level budget calculations, despite the fact that the changes caused by this factor become evident over longer time periods [19].
SST, associated with the increasing global air temperature and thermal expansion of the oceans, increases SLR rates. For example, changes in SST in the Arabian Gulf, in addition to other climate change factors, has caused thermal expansion of seawater [38]. The study used various data to create spatial distribution over 16 years and for all seasons of the region. The results identified three thermal zones and confirmed that the Gulf region was the warmest sea in the world, exhibiting a temperature three times higher than the global average temperature rates. The increase in SST in what is known as the Indian Ocean Dipole was also found to increase SLR rates [23]. The warming effects of ENSO (El Niño oscillations) events were also found, alongside other climatic components, to affect SLR in southeast Asia [39,40].
Rainfall is a climatic driver that is frequently overlooked in SLR projections, despite its influence on flooding. Consequently, it should not be neglected as an uncertainty component in these projections [37]. SLR can also be impacted by the type of event causing it, and whether it is short-term or long-term [41]. For example, extreme weather events will have an impact on wave height and intensity, which can result in a short-term SLR in the form of flooding [42]. Wave and tidal actions lead to coastal erosion, cliff erosion, and marine erosion [31]. Cites that are subject to be impacted by SLR and extreme weather events respond differently to those forcing factors based on a number of variations [6]. A study on the contributing factors to SLR in mangrove areas found that they are highly exposed to climatic components and listed factors like SLR, increased wave, wind, increased air and water temperatures, increased rainfall activities, and freshwater availability that affect salinity processes, as the main causes that influenced inundation periods and accretion rates [43]. Other factors that determine the degree of impact on a mangrove area in correspondence to those climatic components were used in vulnerability assessment studies (see Section 4). Generally, the increasing regional SLR trends will increase the vulnerability of the exposed areas [43].
2.2.2. Non-Climatic Drivers
There are several non-climatic factors that drive changes in RMSL, including geological factors, human activities, and natural causes. The melting of land-based ice results in the movement of masses of water from land to ocean, creating an elastic response that deforms the ocean basin [35]. Increasing evidence suggests that the recent negative mass balance of ice sheets is caused by the accelerated flow of outlet glaciers along certain margins of Greenland and West Antarctica, as well as the increasing rates of discharge by icebergs into the surrounding oceans [35]. The mass loss in Greenland and Antarctica is subject to surface mass balance (SMB). Under the influence of dynamic discharges and ocean warming, a huge mass loss of ice sheets will occur [15]. Glacial-isostatic adjustment (GIA) refers to the “viscoelastic response of the redistribution of ice and ocean loads” [25]. Once a certain threshold is exceeded, the interplay between decreasing surface elevation and escalating surface melting can trigger further ice loss, potentially resulting in the total loss of the Greenland ice sheet [15]. Additionally, this phenomena of water mass redistribution and the deformation of the lithosphere induce shifts in the Earth’s rotation and gravitational field. The gravitational field in areas adjacent to ice melting activities decreases, resulting in a decrease in RMSL. Contrary, RMSL can increase by 30% more than GMSL in areas that are far from where those activities occur. This explains another phenomena of lower RMSL rates in adjacent areas to ice melting activities compared with GMSL [4]. Although there are uncertainties associated with future ice melting levels, they should be considered in SLR projections in order to increase the reliability of results. Additionally, the estimates of changes induced by GIA-induced in sea level, gravity, and solid Earth have notable uncertainties. The input components of GIA and their associated uncertainties are not dependent; hence, their influence in sea level budget calculations should be considered [44]. Given that the input parameters for GIA impact multiple components of the sea-level budget, these components and their uncertainties are interconnected. For instance, the uncertainties associated with ice melting were included in a study by [37] to project SLR scenarios in the Italian peninsula, which have shown higher rates of projected RMSL than the scenarios that do not consider them.
Human activities have contributed to physical shoreline changes and their susceptibility to SLR [45,46], in which including building dams and extracting water for agricultural purposes also play a role in changes in SLR [14]. In Thailand, groundwater pumping increased SLR [17]. The increasing human activities in the oil industry have increased land subsidence, which will lead to an increase in seawater levels in the low-lying coastal areas [38]. Although non-climatic attributes were not a focal point in SLR studies, they have a considerable influence on SLR and future projections [35].
Land movements (upward/downward) occur due to a number of factors, including tectonic movements, gravitational effects [6,14,35], and natural and anthropogenic processes [4], which were found to influence regional SLR. Tectonic movements along with the Glacial-hydro-Isostatic Adjustments showed major variations in RMSL compared with GMSL [37]. Over historical timescales, tectonic movements can result in both gradual changes and sudden coseismic shifts in RMSL [25]. According to [47], tectonic movement is the primary driver of RMSL variations. Examples of the effects of land movements can be observed in Finland (uplifting tectonic movements) and Japan (post-earthquakes effect), which have caused variations in RMSL rates compared with GMSL [17]. Moreover, ground motions influence tide gauge measurements and SLR rate estimations [35]. Tide gauge data are used to measure sea level with respect to the ground, and can be used for monitoring land movements and regional SLR [35]. Historical evidence shows that non-climatic factors have contributed to changes in RMSL and induced other extreme weather events that influenced SLR. Historical evidence in the city of Venice in Italy showed that vertical land movement caused by human activities could significantly contribute to a rise in RMSL, further worsening the hazard posed by SLR and extreme weather events caused by climate change [48]. In Greece, massive destructive tsunami waves that impacted the coastal areas occurred post-earthquake on Crete island [33]. It is also predicted that coastal areas in the Arabian Gulf will be affected by post-earthquake tsunami waves. In the case of a significant earthquake occuring in Markan Subduction Zone (MSZ), tsunami waves will pass through the strait of Hormuz and cause an increase in sea levels by 1–2 m [38]. Sediment compaction, influenced by the weight of overlying materials, leads to subsidence land movements in coastal areas, which increases the relative SLR [25]. Sediment movements and volcanic loading activities can induce isostatic responses, which can lead to significant variations in RMSL [47].
3. Impacts
3.1. Physical Impacts
The physical impacts of SLR are highly visible in coastal areas where they affect physical communities directly. The physical changes to coastal areas due to SLR and climatic events occur in both short- and long-term situations, where they can be irreversible in the absence of appropriate adaptation measures (see Section 5 for more details). Short-term physical impacts, including flooding and inundation, usually occur due to extreme weather events and can cause severe damage to the impacted areas. Long-term physical impacts include coastal erosion, wetland loss, saltwater intrusion into groundwater and raising water tables, and impeded drainage [17].
Under extreme GHG emission scenarios, coastal areas are at risk of high erosion rates. In Krk island in the Mediterranean Sea, the increasing levels of wave height and energy due to climatic components have caused both beach and cliff erosion [31]. A higher deviation of RMSL over GMSL at Victoria Beach in Spain caused a drastic increase in erosion rates, leading to an additional need for beach maintenance activities, which are costly [49]. Erosion caused by increased and intense wave activities has also impacted the coastal areas at Beaufort Sea in the Arctic Ocean [50], UAE [42,51], Mostaganem shoreline in Algeria [52], Hawaiian Islands [53], India [54], Italy and shorelines in the Mediterranean sea [55], and Estonia [56]. In addition to variations in wave activities, erosion is also influenced by changes in sediment supply transported from rivers and onshore overwash activities [49]. The imbalance in sediment supply and removal can lead to coastal erosion and can affect the stability of delta formations [43]. One of the methods to predict erosion rates is Bruun’s Rule [41,49], which is used to predict changes in coastlines under mean SLR situations. According to Bruun’s Rule, under the SLR effect, the coast should naturally retreat in an upward horizontal direction, such that the eroded sediment from the upper beach is deposited in the nearshore area and the resulting elevation in the bottom of the nearshore area is equivalent to the SLR.Although Bruun’s Rule is widely used [57] for its simplicity in linking shoreline changes to sea level changes, and because of the absence of straightforward alternative models, concerns have been raised in the scientific community about its general applicability [58]. A study by Le Cozannet [58] evaluated different approaches in predicting shoreline changes due to sea level changes, and found that Bruun’s rule lacks accuracy and validation capability for some types of shorelines, particularly those subject to complex sediment transport changes. Overall, the application of Brunn’s rule necessitates the selection of consistent subsets of coastal sites that are not influenced by morphological changes, along with understanding other potential factors influencing shoreline changes. It is also worth noting that while other approaches such as incorporating a sediment budget into Bruun’s rule or applying a passive submersion model may result in better accuracy, they also come with their own underlying uncertainties and limitations that impact the results [58]. Other physical impacts of SLR include wetland loss [41,49]. Although coastal wetland forms a natural protection structure for coastal areas against inundation and flooding, the increasing rates in climate-induced activities, such as SLR and wind-driven waves, makes them subject to coastal erosion and inundation, which threaten the ecosystem environment they protect [59,60].
Another long-term physical impact of SLR is altering coastal watersheds and groundwater discharge, which results in saltwater intrusion into the groundwater [41]. This phenomenon is also known as water salinization. Saltwater intrusion into groundwater has been reported in Wadi Ham in UAE, due to the misuse of water in agricultural activities [61]. The intrusion of saltwater into groundwater was also reported in coastal areas along the Gulf of Oman and Arabian Gulf [62], SIDS [63], Niland the Delta in Egypt [64], and is expected to increase in West African countries in the future [65]. It is worth noting that groundwater extraction approaches and other factors also contribute to the salinization phenomena. Salinity was also found to increase with the associated changes in estuarine hydrodynamics under SLR scenarios in Eastern China [36].
SLR has the potential to induce short-term flooding, resulting from sudden climatic and non-climatic events, through immediate changes in tidal hydrodynamics, including the increased height and intensity of waves and storm surge flooding [41]. Furthermore, SLR can induce long-term flooding in the form of inundation [66]. This process can lead to an increase in water salinization as more saline seawater penetrates further inland and reaches groundwater and aquifers [4]. SLR and other regional factors increase the susceptibility of coastal flooding at coastal areas in the Mediterranean Sea [31,37,48,49,55,67,68], U.S. coasts [9,69], UAE [70], Bangladesh [30], India [29], and Malaysia [71].
Physical shoreline changes can be measured using different remote sensing data and geophysical location systems [42,51,71,72,73]. Moreover, soft computing techniques can be used on remote sensing data in shoreline mapping to estimate land use (LU) and land cover (LC), which are terms used to describe the use of land for human activities and the physical characteristics of the land surface. Dwarakish and Nithyapriya [73] conducted a comparison study between conventional and soft computing methods of inundation mapping using remote sensing data, and concluded that support vector machine (SVM) [74] algorithms show promising applications due to their adaptability and learning capacity with limited data. Data that were used to analyze shoreline changes were geomorphology, LU/LC, elevation data, and tide gauges.
3.2. Socioeconomic Impacts
The impacts of climate-change-induced SLR can vary according to the nature of the impacted areas. Low-lying lands will be highly impacted by SLR, with an increasing sociological and economic risk due to the high density of population in those areas [75]. In SIDS, a group of countries that consists of small islands with a similar topographical nature, climate change and SLR will result in changes in biodiversity and coastal resources, which will be reflected through economic losses and negative population growth. For example, SLR in the Kingdom of Bahrain will result in a major hit to socioeconomics due to the lack of capacity and space to accommodate the changes [60]. In many developed countries, the LU of the coastal areas was restructured for economic purposes to the extent of building artificial lands, such as Palm Islands in Dubai; however, these developed coastal areas are considered more vulnerable to SLR due to their socioeconomic importance. For instance, erosion caused by SLR affected properties and street infrastructure along the coast in some emirates in UAE [42]. The increasing economic pressure on coastal areas results in changes in seawater levels and the occurrence of climatic-driven extreme events results in a significant impact on various sectors. This include, but is not limited to, transportation, leisure activities such as scuba diving, and commercial trade [76]. Approximately 100 airports globally, that were built in low-lying lands, will be impacted by SLR under a global temperature increase scenario of 2 °C degrees. This impact will significantly affect airports located in southeast Asia that are highly susceptible to climatic SLR. Aside from transportation, airports are vital for many sectors such as healthcare and food security, which means that the impacts of SLR on airports might lead to economic paralysis [77]. In the Middle East, 24 coastal ports will be impacted under climate changes induced by SLR and extreme weather event scenarios [78]. SLR will also impact the military’s marine operations and equipment installations [79]. Loss of land due to the physical impacts of SLR will cause the migration of coastal habitations [3]. In Indonesia, it has been estimated that there will be a huge impact of SLR on the economy, as an increase of 100 cm of seawater will cause a land loss of 34 km2. This loss of land will impact coastal buildings and infrastructure, and the high population density of people living near the coastal areas will result in huge national socioeconomic loss [80]. In Mombasa, Kenya, SLR will cause direct and indirect impacts on coastal tourism activities, as a Geographic Information System (GIS) analysis showed that the population and economic assets are highly exposed and sensitive to climate variability. This could lead to the loss of billions of dollars and the negative growth and distribution of the population [81]. Coastal areas in some of the Gulf Cooperation Council (GCC) countries have changed in the past few years due to the construction of artificial lands for economic purposes [38]. As GMSL rates are anticipated to increase further in the future, coastal artificial lands will be significantly affected by these changes, leading to substantial economic losses. Figure 5 illustrates the areas affected by SLR and the percentage of the population that are at risk.
3.3. Environmental, Ecological, and Chemical Impacts
SLR and extreme climatic events will have a large impact on environmental ecosystems. The impacts on ecosystems can be perceived as both positive and negative. Generally, some ecosystems have the ability to adapt naturally to increases in SLR, up to a certain rate. However, variations between the rates of SLR and the ecosystem’s adaptability to cope with those changes will lead to a negative impact [41]. Marine habitats are subject to extinction due to the effect of rising SST and the thermal expansion of oceans [3,38]. The increase in sea temperature due to climatic events causes coral bleaching, which damages marine habitats and the biodiversity of the coral species [60,82]. Changes in climatic components associated with regional SLR, such as El Niño oscillation, have led to coral bleaching and decreased mangrove-covered areas in the Arabian Gulf [38,82]. Additionally, the increase in salinity, increase in temperature, and decrease in oxygen levels in the Arabian Gulf have impacted the biodiversity of fish species. On the contrary, the increase in the surface and deep ocean temperature in the Arabian Gulf and Gulf of Oman caused jellyfish outbreaks [82]. In California, similar variations between positive and negative impacts on the number of fish species were noticed in correlation with the increase in SST [83]. Marine ecosystems in the South China Sea are experiencing both negative and positive impacts with the regional variation of SLR [84]. Coastal wetland areas are expected to decrease by 22% globally before the end of the century, which will directly impact the ecosystem and the natural habitats they contain [60]. Chemical changes in carbon dynamics due to water intrusion will lead to metal toxicity of the soil, as well as affect the quality and volume of the agricultural crops [4]. In Portugal, ecologists are concerned with water pollution, as coastal erosion in the city of Maceda allowed seawater to reach the nearby landfill [10]. Additionally, water pollution is a potential aftermath scenario of flooding events, where drinking water can intersect with sewage water, causing serious health problems to human life [7]. Pollution in the sea and ocean water can also occur as a result of SLR’s and extreme weather events having an impact on coastal power infrastructure, such as power stations. Flooding can also impact drinking water supplies and create a habitat for disease-carrying insects like mosquitoes [85]. However, due to the lack of available data about pollution rates pre- and post-extreme weather events, such as storm surges and flooding events, there are not enough studies that model the impact of pollution on future SLR scenarios [82].
4. Coastal Assessment
4.1. Coastal Impact Modelling
The inundation model or bathtub model [86] is a popular and simple model that is used to assess the coastal impacts of SLR and climate-driven events at different spatial scales (i.e., global, regional, national, and local). The inundation model is a quantitative model that uses topographic maps to indicate and predict impacted areas by calculating adjacent cells that are under a certain elevation value. Although this model is widely used in research, it is reliant on the accuracy of elevation data and might provide false inundation results with a low resolution or inaccurate data with high uncertainties. The inundation model was utilized in [66] to assess SLR and flooding in coastal areas and highlighted the importance of considering vertical uncertainties inherited in the digital elevation data used. Error correction and transformation methods can also be applied to digital elevation data to increase the reliability and confidence of the analysis results. For example, the Aster Global Digital Elevation Map (GDEM), a public source of elevation data, has conducted a validation assessment of their data and enhanced the resolution using different horizontal shifts, as well as elevation error estimation and correction of Band3B error [87].
A variety of research has relied on modeling SLR via inundation. Light Detection and Ranging (LiDAR) [88] remote sensing data have been used to build an inundation model to project different scenarios of SLR in the eastern emirates of UAE. Every eight pixels in the LiDAR images were grouped to determine the adjacent pixels that should be inundated for each SLR scenario [70]. An integrated modeling system combining hydrodynamic and hydrological models was used to study the impact of SLR and river discharge on estuarine hydrodynamics and ecosystems. The 3D model utilized various tidal and climatic factors with different SLR scenarios. The results suggested that salinization was impacted by the river discharge process more than SLR. However, SLR will have more of an impact on estuarine hydrodynamics, which will eventually alter freshwater transportation into the sea [36]. The hydrological model and watershed modeling system HEC-GeoHMS were used to simulate watersheds from land to sea, which occur due to climatic events, such as rainfall and post-storm floods, as well as other human activities, including the usage of aquifers. The data used in the simulation included public elevation data, LU/LC from governmental data, and simulated rainfall data measured based on different public repositories [62].
SimCLIM [89] is an integrated modeling system that is used to assess coastal sensitivity to climate change and variability using biophysical and socioeconomic parameters. This commercialized tool also includes an SLR scenario generator that is used to measure the sensitivity of coastal areas to climatic events. This tool is applicable to all spatial scales and various computational requirements depending on the data and resolution [86]. SimCLIM modeling was used in [17] to project future changes in specific locations. The tool was set to utilize the normalized patterns of Atmosphere-Ocean General Circulation Models (AOGCMs) [90] in a multi-mode by combining GMSL, regional, and local factors [17]. Other ocean modeling tools have been used to analyze the impact of SLR in coastal areas, such as HYCOM [91] ocean modeling, which was developed for the area of the Gulf of Mexico [7]. Another example of an integrated modeling system that uses biophysical and socioeconomic components is the Dynamic Interactive Vulnerability Assessment (DIVA) [17], which produces quantitative results on the coastal vulnerabilities on spatial scales ranging from regional to local. This model utilizes a number of regional factors that contribute to SLR to measure regional SLR changes. Examples of the adaptation and impact options integrated within the DIVA model include flooding, population density, erosion, estimated land for nourishment, wetland loss, and salinization [8]. Biophysical and socioeconomic data from the DIVA model with regional variables have been used to estimate the global economic loss and coastal damage under different SLR scenarios in [92]. This study estimated a global Gross Domestic Product (GDP) loss of 0.5% and a 2% decrease in human well-being under high SLR scenarios. The drawback of this model was the elimination of some of the climate-induced factors that contributed to SLR, such as storm surges effects, and only considering a limited range of adaptation measures [17]. Other models that were used to study the ecological and environmental impacts of SLR and climatic events were the Ecological Landscape Spatial Simulation Models and Sea Level Affecting Marshes Model (SLAMM) [86].
Climate change models make use of future estimations of GHG emissions, as well as ice sheets and glacier melting to project future SLR based on how sea levels respond to changes in those factors [93]. Future projections can be based on IPCC’s Representative Concentration Pathway (RCP) emission scenarios that estimate the influence of GHG emissions on future global mean and temperature levels. Future projections under RCP2.6., RCP4.5., RCP6.0. and RCP8.5. will increase the global mean temperature by 1, 1.8, 2.2, and 3.7 Celsius degrees, and GMSL by 0.4, 0.47, 0.48, and 0.63 m, respectively, by the year 2100 [12]. Figure 6 shows the projection of GMSL under different RCP scenarios according to IPCC AR5 [12]. IPCC’s RCP emission scenarios, local vertical land movement, and glacio-hydro-isostatic movement were used to project future flooding scenarios in the Italian peninsula using topographic maps, elevation data, bathymetry data, and Interferometric Synthetic Aperture Radar (InSAR) satellite images [92]. The results obtained from this study showed that coastal areas were highly vulnerable and subject to marine flooding by the year 2100. Tide gauge data were used in [48] to extract the vertical land movement data. Different scenarios were modeled in [46] to study the impact of future SLR on the low-lying land and protection structure in the coastline of the Tianjin–Hebei district in China. Three scenarios were modeled according to values obtained from the literature (low, medium, and high) for different years (2030, 2050, and 2100), taking into consideration land subsidence and flooding that can result from extreme storm surge events (occurrence rate of once in 50 years, 100 years, 200 years, and 500 years), which were modeled via the Regional Ocean Modelling System (ROMS). SLR projections were used in [10] as a part of a systematic planning strategy to evaluate three different adaptation measures, which ranged from hard-engineered protection structures to planning land use (LU) and maintenance activities in coastal areas, namely beach nourishment, under extreme scenarios (IPCC RCP8.5). The results of this projection were showcased to help in decision making. The increasing use of probabilistic models in projecting future SLR scenarios were surveyed in [16], with consideration of the uncertainties associated with the contributing factors to regional and local sea level changes, such as mesoscale ocean processes. However, probabilistic projections also have uncertainties due to their dependence on emission scenarios, which are also uncertain. In [41], it was mentioned that SLR future LU/LC projections were used to evaluate the impacts of storm surges on coastal areas. It was also mentioned that statistical and probabilistic Bayesian Networks were used with SLR projections to study the long-term coastal impacts of SLR. Although the geomorphological and biological impacts of SLR and the exposure of near-shore structures to SLR in their projection scenarios were not considered in [6], the influence of uncertainties associated with climatic and non-climatic events was acknowledged, but it was emphasized that projection scenarios were built to determine the influence of different factors and not project uncertainties, and hence did not consider them. Several regional factors were used in SLR projection and visualization due to their huge influence on SLR. With the inclusion of regional components in projection, these scenarios could amplify the impacts of global factors, which would be reflected in the increase in projected SLR levels [15,17]. In [15], the contributing regional factors alongside the Atlantic Ocean were used to provide comprehensive projections about SLR in the Mediterranean Sea. Figure 7 illustrates a standard framework developed by an IPCC working group [17] that can be applied in building SLR scenarios using a set of contributing factors as identified by IPCC.
Some studies incorporated AI techniques into SLR projection and simulation. In [94], an AI-based visualization of flooding in the province of Quebec, Canada, was used to raise awareness about climate change. Because of the lack of accurate and high-quality flooding data, a simulated environment was created to obtain data, in addition to other real data, to be used in training a custom Generative Adversarial Network (GAN). GAN models use a generator to create data based on real data parameters and then use a discriminator to distinguish between the generated data and the real data [95]. The flooded areas were covered using a painter model to provide a realistic flooding scenario [94]. In [33], an extreme SLR scenario that occurred in the Mediterranean Sea in 350 AD was re-modeled to visualize how it would impact the current Heraklion port in Crete, Greece. Spatial data that contained topographic, bathymetry, and LU data were fed alongside modeled SLR and tsunami wave scenarios into an animation suite to build a 3D visualization tool with a scientific output. Others used historical data to calculate SLR over the years to analyze the trends causing SLR for future projects. Matlab was used in [39] to pre-process and calculate SLR and Mean Sea Level (MSL) trends using linear regression models applied on historical tide gauge data collected from tide stations’ sensors in Indonesia [39]. Error correction was performed in [39] on historical tide gauge data of Hong Kong coasts and used multiple regression models to calculate changes in sea levels. Regression models such as Auto-Regressive Integrated Moving Average (ARIMA) and Vector Auto-Regression (VAR) were also used to forecast changes in both GMSL and RMSL [96,97,98]. A comparative study on the use of historical GMSL data for forecasting using different machine and deep learning algorithms was conducted in [99], where the results showed that deep learning algorithms such as Dense Neural Network (DNN) and WaveNet Convolutional Neural Networks could provide more reliable results than linear regression.
4.2. Coastal Vulnerability Assessment
Part of studying the impacts of SLR on coastal areas is to assess the extent to which they are vulnerable to SLR. The term “vulnerability” is used to define the susceptibility level of coastal areas when being exposed to certain climate hazards [100]. This term also encompasses concepts such as risk, resilience, and adaptability [76]. Different analytical approaches can be used to assess the degree of vulnerability by incorporating elements of different aspects, such as physical, socioeconomic, and ecological aspects. Furthermore, vulnerability assessments are spatially scale-dependent; therefore, the spatial scale of the study area (regional, national, or local) should be taken into consideration. Vulnerability can be defined as “The degree to which a system, sub-system, or component is likely to experience harm due to exposure to a hazard, either a perturbation or stress” [100], with it having the following three components: exposure, sensitivity, and adaptive capacity [76,100]. The exposure (e.g., population density and LU) and sensitivity (e.g., inundation depth) components are used to measure the impact of climate hazards, while the adaptive capacity component (e.g., disaster management and response) is used to identify the ability of socioeconomic factors (e.g., humans, infrastructure, and habitats) to adapt to changes following climate hazards [76]. In [100], indicator-based approaches have been identified as the main coastal vulnerability assessment tools in events related to climate change. Index-based vulnerability assessment methods are a sub-category of indicator-based methods that focus on simplifying the complex interaction among different parameters of various aspects and representing them in a simpler and more understandable format, to help decision-makers plan proper responses. Another sub-category of indicator-based methods is variable-based methods, which focus on studying a set of independent variables related to coastal issues. Many researchers have relied on using index-based approaches to assess coastal vulnerabilities. Index-based approaches include the coastal susceptibility/sensitivity index (CSI), coastal vulnerability index (CVI), coastal risk index (CRI), and socioeconomic vulnerability index (SVI) [55]. CVI is the most popular index-type approach in research that is used to study and assess the coastal vulnerabilities of specific study areas [101]. A standardized and quantitative way of assessing CVI was developed by Gornitz [102]. This approach uses the geometric average (Equation (2)) of different biophysical parameters, including geomorphology, shoreline change rate (i.e., erosion and accretion), coastal slope, regional SLR, mean significant wave height, and mean tidal range [29].
where x represents a parameter and n refers to the total number of parameters used in the CVI assessment.
Gornitz’s CVI assessment approach was widely utilized and adopted by others [29]. Thieler and Hammer-Klose (defined the standard U.S. Geological Survey (USGS) CVI assessment) [103,104] used similar physical parameters to assess both the positive and negative coastal responses to climate-change-driven events [93]. Coastal assessment methods are applicable to regional, national, and local spatial scales, and can provide a detailed assessment of different segments of the shoreline.
Index-based approaches that depend on Gornitz’s method use a variety of physical parameters to assess coastal vulnerability with a variation of the selected variables, according to the nature of the study area. On a national level, Norezan et al. [105] stated that The Department of Irrigation and Drainage in Malaysia used a CVI method in what is called the National Coastal Vulnerability Index Study (NCVI), to assess the vulnerability of coastal areas to SLR and to help policymakers adopt proper adaptation measures. Nevertheless, a CVI study was conducted on Tok Jembal Beach using Thelier and Hammar-Klose ranking scheme, but with three physical variables and climatic-related components. The set of used parameters included geomorphology, coastal slope, regional SLR, temperature, wind speed, and wave’s type. Other CVI-based works included variables from other non-climatic parameters, such as environmental and socioeconomic [30,54]. Mclaughlin et al. [106] believed in the importance of including socioeconomic factors in CVI assessment; thus, they developed a CVI technique (Equation (3)) that incorporated parameters related to climatic components, socioeconomic, and physical parameters.
where CC represents the coastal characteristic sub-index associated with physical/biophysical parameters, CF represents the coastal forcing sub-index associated with climatic components, and SE represents the socioeconomic sub-index.
In [43], Cooper’s guidelines [107] were used to conduct a vulnerability of ecosystem habitats, such as mangrove and seagrass beds in some countries in Africa and the Pacific Islands. The assessment involved 19 different parameters, which fell under three categories: exposure, sensitivity, and adaptive capacity. The study found that the regional factors, particularly the continuous tectonic uplift movement, in the study area of Tanzania resulted in a higher resilience to climate change and SLR compared with the other areas involved in the study. Vulnerability assessments were also used to evaluate the economic risk and market shock via the economic vulnerability assessment (EVA) model [60], which was developed by UN and Fedri using different socioeconomic attributes that fell under either exposure (size, specialization, and location) or shocks (trade and natural shocks) [108]. The coastal sensitivity index (CSI) was also used in a number of research works to include ecosystem and oceanographic parameters, in addition to the physical parameters used in the CVI assessments [109].
Generally, the selection of the type and number of indexes will be reflected in the assessment results, and the selected index set can vary according to the specification of the studied areas. Ref. [32] listed some of the criteria that should be considered when choosing an index-based assessment approach, such as the availability of the data associated with the selected index and its robustness to be influenced by other indexes. Furthermore, the number of selected indexes should be sufficient to obtain reliable assessment results [32]. Table 1 shows different types of parameters that were used in research.
5. Mitigation and Adaptation Measures (MAM)
This section discusses mitigation and adaptation measures (MAM) that can be implemented in response to SLR induced by climate change. Overall, these responses can be categorized into mitigation measures as a proactive response to SLR, and adaptation measures that act as both proactive and reactive responses. These measures include man-made/natural structures and non-structural measures that involve policies and sets of best practices to protect coastal areas and communities. Utilizing both structural and non-structural measures will increase the effectiveness of protection and reduce losses [11].
5.1. Structural Adaptation Measures
Structural mitigation measures are widely implemented across the globe. Various research works have been conducted to study both their long- and short-term effectiveness for protecting coastal areas against SLR [11]. Examples of structural mitigation measures are as follows:
- Seawall: a protection structure used to protect the coastal landform from the impact of SLR [42].
- Breakwater: used to protect coastal zone areas and beach material from strong wave actions. It also enables extending the beach area for different human/economic activities. Breakwaters are built either perpendicular or parallel to the beach according to the beach’s nature, to provide maximum protection. The elevation of the breakwater should be determined according to the height of the local maximum tidal wave [42].
- Dike: structures built along the coast to protect against high wave actions and flooding [11]
- Dunes: Piles of sand and/or other materials that are formed due to either natural causes such as wind actions or built constructions (filled with artificial material) to reduce the impact of wave actions and coastal erosion [69].
- Beach Nourishment: a structural measure that is implemented by filling up the impacted areas with artificial material to protect the coastal areas from the impact of SLR. Beach nourishment is costly and may cause a negative impact on the environment; therefore, it is usually implemented after conducting assessments studies and strategical evaluations of the affected areas [11].
The impact of structural infrastructure at Damietta Promontory, Egypt, in protecting coastal areas against SLR was studied in [45], using satellite images and historical data on changes in the shoreline. It was found that seawalls and detached breakwater bodies have effectively protected the coastline against SLR. However, it was also found that anthropogenic interventions were causing changes to shorelines that were far greater than those caused by SLR. Furthermore, the importance of the maintenance of those structural bodies to maintain the current elevation was also highlighted. Additionally, some recommendations about extending the length of the breaker were provided. Other existing adaptation measures that are being used to protect against high waves and te impact of SLR in the northeastern coast of Egypt were mentioned in [67], particularly the city of Alexandria. This includes the Muhammed Ali Seawall and the international coastal road that was constructed with a high elevation (3 m) by the government. The impact of the type of material used to construct the structural protection measures was also discussed in the literature, as it determines their efficiency in stopping SLR. In [69], unmanned aerial vehicles (UAVs) [115] were used to study the prior and post outcomes of constructing a dune at Cardiff State Beach, California, to protect against flooding and extreme water events. The constructed dune consisted of different materials, including vegetation, sand, cobble, and rip-rap. Although this dune was affected by a storm during the construction process, the post-construction imagery results obtained from UAV during an observation period of 9 months showed that it had, overall, effectively reduced the impact of flooding. In China, a seawall was constructed to protect the coastline of the Tianjin–Hebei District against SLR and extreme weather events that occur once every 100 years; however, it was suggested in [46] that the current elevation of this seawall would not be able to survive against such an extreme event by 2030 based on a presented study of future projections of SLR. This study simulated different SLR scenarios including the existence and absence of extreme weather events of different intensities using the regional ocean modeling system (ROMS) and other data related to that area. Seawalls were built in the coastal areas of Mombasa in Kenya by the tourism sectors to protect against SLR, extreme weather event impacts, and coastal erosion, in addition to maintaining tourism activities [81]. The effectiveness of some of the implemented structural adaptation measures at some of UAE’s vulnerable coastal areas to prevent erosion that resulted from SLR and wave activities were studied in [42]. Detached breakwaters and offshore barriers were found to be better at protecting the coastal areas against coastal erosion compared with seawalls, as they impacted the beach and were degraded over time due to tidal wave actions [42].
Sediment movements due to wave actions during storm surges in the Croatian Krk island in the Adriatic Sea led to the formation of a beach winter profile that acted as a natural protection structure for the coastal areas against erosion. It was found that this naturally formed protection structure acted better in protecting against coastal erosion than the existing landslide protection wall, which was constructed with a low quality and was susceptible to collapse under the impact of continuous intense wave actions [31]. Existing wetlands and lakes near the coastal zone in Alexandria, Egypt were considered as a defense line to hold seawater from propagating further into the land in case of the occurrence of an extreme weather event [67]. In [114], the impact of using different scenarios by combining adaptation measures with natural ecosystems to protect coastal areas was studied. This study relied on using data-based approaches from the literature and qualitative-based approaches carried out via field studies in the area of Mecklenburg, Germany, in the southeast coast of the Baltic Sea by groups of experts. This research found that combining structural adaptation measures with submerged vegetation would result in both positive economic and environmental impacts by adding an appealing look and value to the coastal areas, which could attract both tourists and environmental scientists.
5.2. Non-Structural Adaptation Measures
The negative impact of climate change and SLR on islands can be more severe compared with coastal states [3,60]. For example, SIDS, will be highly impacted by environmental changes and SLR [60]. As per IPCC, economically disadvantaged SIDS countries are highly vulnerable to climate change and SLR impacts [3]; hence, the necessity of implementing proper and effective adaptation measures arises. Conversely, financially well-off members of SIDS like the Kingdom of Bahrain can adopt non-structural adaptation measures in the form of policies and regulations on energy-related sectors to reduce CO2 and GHG emissions [60]. Because of challenges associated with SIDS, it was suggested in [4] that those countries use eco-based adaptation (EbA) measures that “provide a combination of protect and advance benefits based on the sustainable management, conservation, and restoration of ecosystems” [4]. EbA provides protection by deflecting waves and reducing erosion, thus increasing land elevation via sediment buildup, which has proven its effectiveness at mitigating the impact of SLR [4,82]. Reinforcement learning was used in [116] to build a Marcov Decision Process (MDP)-based model to help policymakers evaluate the economic cost of investing in an adaptation infrastructure for SLR. It also provided a proactive measurement by evaluating the cost of implementing a protection infrastructure versus the economic loss as a consequence of the impact of SLR. The model also considered different SLR scenarios according to the NOAA model, the impact of extreme natural events associated with SLR (such as storms and hurricanes), and residents’ and corporations’ willingness to support the government’s decision to implement the SLR adaptation measures. In [117], a national survey was conducted in the USA to measure how local communities perceived different SLR adaptation measures adopted by their local authorities. Fu’s definition of adaptation measures was used to create four categories, as follows: (1) protection, (2) accommodation, (3) managed retreats, and (4) planning. The survey results showed that adaptation measures at coastal localities focused more on planning, which included hazard plans, coastal and emergency management plans, SLR vulnerability assessments, raising public awareness and education, forming an SLR task force, and conducting vulnerability assessments. Nevertheless, planning might provide a false sense of safety, thus the public preferred having protection measures implemented as part of adaptation measures to SLR. A participatory approach that involved different stakeholders was used in [10] to evaluate the impact of implementing different adaptation measures in Portugal’s coasts to protect them from erosion. Adaptation measures were classified into adaption, nourishment, management, relocation, protection, and restoration. The overall benefit-to-cost ratio was in favor of scenarios that involved protection structures and beach nourishment when considering environmental, economic, and social impacts. Adaptation suggestions were provided in [118] to be used alongside the existing structural protection measure in Po River Delta–Italy to reduce the impact of SLR, including farmers switching to crops that would yield higher economic returns. In [5], the adaptation measure in Southeast Asian countries, like Malaysia, were evaluated and the existing flaws were identified, including the unavailability of documentation, the absence of a centralized assessment and strategies platform, the gap between assessment and application, and the emphasis on the importance of socioeconomic components in assessments, which was reflected negatively on the produced set of policies and strategies.
Generally, hard-engineered structures are preferred as protection measures to reduce the impact of SLR, wave actions, and extreme weather events; however, they might result in negative socioeconomic and ecological impacts. The built-in protection structures might limit the usage of coastal areas, which are usually utilized for habitation and touristic activities. This could be even more challenging in cities that are highly dependent on coastal activities and lack the necessary land capacity for relocation, such as SIDS countries [69]. Additionally, some hard structures may reduce the attractiveness of the beach and impact fisheries activities, leading to negative economic impact [42]. A combination of eco-based systems and other structural protection measures can be effective at protecting against the physical impacts of SLR, while maintaining the socioeconomic and ecological value of the coastal areas; however, we found that such scenarios might not be feasible in all regions, due to many local factors like environmental conditions [4], which play a role in determining the effectiveness of implementing such measures. Some ecosystems that protect the shoreline against changes have the ability to adapt to changes in their environment and can cope with SLR up to a certain extent [82]. However, their ability to continue adapting to recent SLR trends and provide the same level of protection to shorelines against changes are questioned. Although stakeholders are aware of the importance of using protection structures for mitigating coastal changes induced by climate change and SLR, they still prefer soft adaptation measures, such as beach nourishment, as they are easier, simpler, and more cost-efficient to implement [10]. Overall, the trade-off between economic cost loss, such as the value of land and properties, and implementation costs drives the decision to implement proper adaptation measures to reduce the risk caused by climatic-driven events [8]. At a local scale, communities are also playing a role in protecting their areas by taking proactive measures and supporting local authorities [4,117]. Table 2 compares different mitigation and adaptation measures covered in the literature over the past 5 years.
6. Sea Level Changes in the Arabian Gulf
The Arabian Gulf is a semi-enclosed sea located in Western Asia, extending from the Gulf of Oman and the Indian Ocean through the Straight of Hormuz. Its bathymetry ranges from 5 m for shallow zones to 94 m for the deepest zones. It is surrounded by eight countries: United Arab Emirates (UAE), Qatar, Kingdom of Saudia Arabia (KSA), Kingdom of Bahrain, Sultanate of Oman, Kuwait, Iran, and Iraq. The majority of these countries have prosperous economies driven by their substantial oil reserves [38]. The coastal population and activities in these countries have also witnessed substantial growth, leading to an increasing demand for coastal urbanization [42].
The increasing SST in the Arabian Gulf due to a number of climatic and non-climatic drivers has resulted in significant impacts in the region [120]. In addition to its environmental impact, including coral bleaching, the extension of fish species, and salinity changes, the increasing evaporation rate, driven by the increase in sea and air temperatures, has resulted in physical and chemical processes that altered the intensity and frequency of climatic events occurrence. Trend analysis showed that there are homogeneous changes in SST throughout the Arabian Gulf with visible seasonal patterns in summer and autumn seasons, specifically in the inner northwestern zone of the Gulf, which varies from the outer zone near the Hormuz Strait [121]. An unobserved extreme SST of 37.8 °C was recorded near Kuwait’s coasts in 2020 [82]. The difference in water levels between the Arabian Gulf and the Gulf of Oman, driven by high evaporation rates, which resulted in a movement of a water mass of 416 km3/year through the Strait of Hormuz into the Arabian Gulf [38,122]. Differences in water pressure also play a significant role in inward and outward water movement through the Strait of Hormuz [123]. Additionally, the growing population and demand for water supply, coupled with limited freshwater resources, have led to an increase in the number and operations of seawater desalination plants along the coastal areas of the Arabian countries in the Gulf. This has resulted in an increasing salinity of seawater in beach areas and has contributed to rising steric sea levels [124]. Furthermore, wind actions and extreme events caused by Shamal wind during the winter season can influence local tidal wave patterns, potentially resulting in a sea-level rise of a few meters [125], with evaporation being higher in the winter season compared with the summer, despite the high temperature during this season [123]. In summer, Kaus wind, in addition to a wind draft influenced by variations in temperature between land and water, causes complex variability in short-term sea level changes and drives surface pollutants towards the coastal areas. The freshwater budget of the Arabian Gulf is driven by evaporation, precipitation, and freshwater discharge, particularly in the northwestern region [123]. The flow of water through the Strait of Hormuz occurs in two layers: the upper layer consists of an inward flow from the Gulf of Oman and the Indian Ocean toward the Arabian Gulf, including seasonal surface variations. The second layer (bottom layer) consists of an outward flow toward the Gulf of Oman and includes saltier water [126]. Non-eustatic sea level rise can be triggered by the occurrence of sudden events such as earthquakes generated from the north and east zones or tsunamis generated by extreme events in the Arabian Sea and the Indian Ocean [109]. The timeline of changes in sea levels in the Arabian Gulf can be traced back to the late Quaternary when the Gulf experienced a reflooding, reaching its peak of more than 1 m above the current sea levels during the mid-Holocene. Sea levels gradually decreased to reach their present levels by the late-Holocene period [127].
The majority of the northeastern shorelines of the Arabian Gulf near the Hormuz Strait are protected by the Hajar and Zagros mountains, while the shorelines within the Gulf basin contain various landforms, including sandy beaches, mudflats, mangroves, seagrass beds, and sabkhas [128]. The geomorphology of these areas serves as a natural barrier against sea level rise (SLR) in some regions, while in other areas it makes them vulnerable to variations in sea levels. In low-lying areas, offshore barriers, including both natural and man-made structures, have been employed to reduce wave velocity and intensity [42]. Satellite images data and modeling tools have enabled the monitoring of changes and impacts of sea levels in the Arabian Gulf. An example of this is the GULF18-4.0 Model, which simulates various oceanographic features with a high resolution of 1.8 km and optimizes the vertical grid for important physical processes, including SST, waves, and tides [122]. A combination of hydrodynamics and spectral wave models were customized to incorporate regional factors such as the wind/wave effects induced by the Shamal wind, the characteristics of the inner water channel regions, and the submerged areas of the Arabian Gulf, with a focus on studying the southeastern region [125]. Satellite altimetry was used to study changes in sea level SST [38,120,123].
7. Discussion and Conclusions
There is no doubt that climate change is a major force that is leading to overall negative changes worldwide. The rise in temperature increases the melting rates of ice sheets and glaciers. It also causes a temperature rise in ocean water that propagates both horizontally and vertically, which impacts both the underwater environment and coastal areas. One of the perceived changes to those global temperature changes is SLR. Further, climate change leads to changes in other climatic events, such as an increase in the occurrence and intensity of extreme weather events, like storm surges and rainfall rates. Additionally, these climatic changes directly influence wave and wind actions, leading to rapid changes in shorelines and increasing the exposure of coastal areas to inundation and flooding events. Nevertheless, studies have shown that non-climatic regional effects can have a noticeable influence on SLR and climatic events [1] (e.g., tsunamis are triggered by an earthquake [31,82]). These components include vertical land movement, land-based ice melting, water exchange between the land and sea, and an elastic response to mass loss of land ice melting. Although the percentage of contribution of the different climatic and non-climatic components to SLR can vary, they should be considered in future projections and scenario-building topology to obtain realistic results.
It is worth mentioning that uncertainty associated with these components should be considered for future projections. Even though the earlier IPCC reports did not consider them in future projections, recent studies have incorporated them when estimating future SLR changes and its related components. Generally, the majority of studies use IPCC RCP emission scenarios for estimating future GMSL and customize them to calculate regional SLR trends according to the specifications of the studied areas. Other studies have used scenarios developed by NOAA and other research groups (e.g., NCA) or relied on historical regional data to measure the regional SLR. Studies have also found a deviation between RMSL and GMSL rates when incorporating regional factors and uncertainties. This is explained by the fact that changes in sea levels are not uniform globally and they depend on the geographical location. Furthermore, the propagation of changes in GMSL are timescale-dependent. The relation between the geographical location and propagation of changes is perhaps what led [14] to identify some of the regional factors, according to findings of studies, as global contributing factors. Other climatic regional factors, such as ENSO [35], can play a significant role in SLR both globally and regionally. Nevertheless, we believe that SLR projections and scenarios should incorporate both regional factors and uncertainties associated with global factors that contribute to GMSL to provide a comprehensive analysis and reliable estimations of the impacts of SLR. Those uncertainties and deviations in estimated results should be presented clearly by researchers without any conflict of interest to avoid the consequences of false results. Furthermore, researchers should present their analysis outcomes to policymakers as a proactive measure for mitigating events driven by climate change. Additionally, visualization tools should be utilized to showcase the impacts of climate change and SLR to different stakeholders, for appropriate planning and decision making, as well as raising awareness.
Data requirements vary according to the purpose of the study and the number and type of parameters used in the analysis. Spatial data (satellite images and digital elevation data) were used in the majority of SLR studies as they can be easily obtained from a number of public repositories, such as AsterGDEM and USGS. Using other types of data add more value to the assessment SLR impacts. Examples of other data that can be used for assessments are population, LU/LC, shoreline geomorphology, and climatic and non-climatic factors. However, research works on this topic suffer from the lack of accurate and recent data needed for projection and visualization. Simulation tools were used to cope with the lack of available data associated with different contributing factors, while visualization tools were used to interpret changes and impacts of climate-driven events. Several studies used simulation tools to generate data related to contributing factors, such as wave action and rainfall, to be used in impact assessments (see Section 2). Historical data were used to create future projections about GMSL and RMSL to assess their impacts and propose adaptation measures. Those data were fed into different models and tools for processing. Machine learning algorithms such as linear regression were also used in SLR forecasting studies. However, a recent comparative study by [99] suggested that deep learning could provide more reliable results in forecasting GMSL based on historical data. Although the use of deep learning algorithms is plausible, neither machine learning nor deep learning studies considered the uncertainties associated with the contributing factors to SLR. SLR trends have accelerated in the 20th century [14], which raises the question of to which extent the historical data are reliable for obtaining realistic results.
The impacts of SLR and its associated climatic events on physical, socioeconomic, and environmental/ecological/chemical aspects are correlated and perceived negatively, except for the ecological aspects, in which some ecosystems were positively impacted by the increase in SLR and SST. The level of SLR impact relied on a number of characteristics of the studied area such as the geographical location and geomorphology of the coast, which determined the type of regional factors that influence SLR and the coast’s vulnerability to it. Socioeconomic components also help in determining the level of impact and can be a used as a driving force towards implementing MAM policies. According to [3], Southeast Asian countries are classified as highly vulnerable countries for SLR as they suffer from an increasing frequency and intensity of extreme weather events and encompass vulnerable communities. We found that the study areas in the majority of SLR studies were focused on the Mediterranean Basin and Southeast Asian countries. This aligns with the distribution of vulnerable areas and communities to SLR, as shown in Figure 5. Nevertheless, it is worth mentioning that SLR is not the only source of physical changes on shoreline, as anthropogenic intervention impacts can exceed the physical impacts caused by SLR and climatic events.
Index-based approaches were used widely in assessing coastal vulnerability to SLR impacts, while coastal modeling approaches were used for assessing SLR impacts. Each assessment approach used a different set of contributing factors and other parameters to assess coastal areas based on the spatial scale, available data, objective of the assessment, and processing requirements. The results of those assessments were used to suggest the proper MAM strategies to be implemented. It was noticed that the studies conducted on the Mediterranean Basin countries and the USA area relied more on adaption structures, in comparison with those of Southeast Asian countries, where adaptation policies were mainly seen as their primary MAM strategy. Nevertheless, we believe that both MAM strategies should be implemented to reduce potential damage, incorporating global efforts to reduce GHG emissions. An example of long-term planning of MAM strategies can be found in the UAE [129], where several protection structures were built at the vulnerable segments of coasts and artificially constructed coastal areas. Additionally, national monitoring platforms have been used to monitor and forecast climate hazards, and adaptation plans and policies were placed as part of the national development plan towards achieving sustainability. Some final remarks to be considered for future research:
- Uncertainties associated with global contributing factors should be properly incorporated into GMSL and RMSL projections, and updated versions of sea level budget should be used (as per data availability)
- GMSL is not uniformly distributed globally; hence, time and location dimensions should be considered when estimating individual contributing factors for SLR projections.
- The impacts of geological processes and the resulting post-effects should be considered in RMSL analyses.
- Geomorphological changes on coastal zones due to anthropogenic interventions should be isolated from SLR impacts during coastal assessment studies as changes caused prior can surpass the latter, leading to false results and interpretations of the current status.
- The lack of available data are limiting studies on SLR impacts on ecosystems and chemical aspects (e.g., groundwater contamination, and seawater pollution after flooding and natural disasters).
- There is a limit to the extent of considering historical data as reliable when forecasting future SLR, where significant changes of trends in climatic events and GMSL are evident (noting that historical data are not sufficient on their own in forecasting future SLR and other factors and their associated uncertainties must be considered).
Author Contributions
Conceptualization, L.E., M.S.Z. and H.A; methodology, L.E. and M.S.Z.; validation, M.S.Z. and P.G.; writing—original draft, L.E.; writing—review and editing, L.E., M.S.Z. and H.M.; supervision, M.S.Z., H.M., P.G. and H.A.-A.; project administration, M.S.Z., H.M., P.G. and H.A.-A.; funding acquisition, M.S.Z., H.M. and H.A.-A. All authors have read and agreed to the published version of the manuscript.
Funding
This research received no external funding.
Data Availability Statement
This research was conducted without using any dataset.
Acknowledgments
The authors declare that the research was conducted in the absence of any commercial or financial relationships that could be construed as a potential conflict of interest.
Conflicts of Interest
The authors declare no conflicts of interest.
Abbreviations
The following abbreviations are used in this manuscript:
| SLR | Sea level rise |
| GMSL | Global mean sea level |
| RMSL | Relative or regional mean sea level |
| IPCC | Intergovernmental Panel on Climate Change |
| SST | sea surface temperature |
References
- Titus, J.G.; Barth, M.C.; Gibbs, M.J.; Hoffman, J.S.; Kenney, M. An Overview of the Causes and Effects of Sea Level Rise; Van Nostrand Reinhold: London, UK, 1984. [Google Scholar]
- Clark, P.U.; Shakun, J.D.; Marcott, S.A.; Mix, A.C.; Eby, M.; Kulp, S.; Levermann, A.; Milne, G.A.; Pfister, P.L.; Santer, B.D. Consequences of twenty-first-century policy for multi-millennial climate and sea-level change. Nat. Clim. Change 2016, 6, 360–369. [Google Scholar] [CrossRef]
- IPCC. Climate Change 2022: Impacts, Adaptation, and Vulnerability; IPCC: Geneva, Switzerland, 2022; AR6. [Google Scholar] [CrossRef]
- Oppenheimer, M.; Glavovic, B.; Hinkel, J.; van de Wal, R.; Magnan, A.K.; Abd-Elgawad, A.; Cai, R.; Cifuentes Jara, M.; Deconto, R.M.; Ghosh, T. IPCC Special Report on the Ocean and Cryosphere in a Changing Climate; Chapter Sea Level Rise and Implications for Low-Lying Islands, Coasts and Communities; Cambridge University Press: Cambridge, UK; New York, NY, USA, 2019; pp. 321–445. [Google Scholar] [CrossRef]
- Noor, N.M.; Abdul Maulud, K.N. Coastal vulnerability: A brief review on integrated assessment in southeast Asia. J. Mar. Sci. Eng. 2022, 10, 595. [Google Scholar] [CrossRef]
- Hall, J.A.; Gill, S.; Obeysekera, J.; Sweet, W.; Knuuti, K.; Marburger, J. Regional Sea Level Scenarios for Coastal Risk Management: Managing the Uncertainty of Future Sea Level Change and Extreme Water Levels for Department of Defense Coastal Sites Worldwide; Technical Report; U.S. Department of Defense, Strategic Environmental Research and Development Program: Washington, DC, USA, 2016.
- Wright, L.D.; Caruson, K.; D Elia, C.; Draayer, J.; Nichols, R.; Weiss, R.; Zarillo, G. Assessing and Planning for the Impacts of Storms, Flooding and Sea Level Rise on Vulnerable Gulf of Mexico Coastal Communities: A White Paper. In Proceedings of the Global Oceans 2020: Singapore–US Gulf Coast, Biloxi, MI, USA, 5–30 October 2020; IEEE: Piscataway, NJ, USA, 2020; pp. 1–6. [Google Scholar] [CrossRef]
- Bosello, F.; De Cian, E. Climate change, sea level rise, and coastal disasters. A review of modeling practices. Energy Econ. 2014, 46, 593–605. [Google Scholar] [CrossRef]
- Sweet, W.V.; Hamlington, B.D.; Kopp, R.E.; Weaver, C.P.; Barnard, P.L.; Bekaert, D.; Brooks, W.; Craghan, M.; Dusek, G.; Frederikse, T.; et al. Global and Regional Sea Level Rise Scenarios for the United States: Updated Mean Projections and Extreme Water Level Probabilities Along U.S. Coastlines; Technical Report NOAA Technical Report NOS 01; National Oceanic and Atmospheric Administration, National Ocean Service: Silver Spring, MD, USA, 2022.
- Matos, F.A.; Alves, F.; Coelho, C.; Lima, M.; Vizinho, A. Participatory Approach to Build Up a Municipal Strategy for Coastal Erosion Mitigation and Adaptation to Climate Change. J. Mar. Sci. Eng. 2022, 10, 1718. [Google Scholar] [CrossRef]
- Dedekorkut-Howes, A.; Torabi, E.; Howes, M. When the tide gets high: A review of adaptive responses to sea level rise and coastal flooding. J. Environ. Plan. Manag. 2020, 63, 2102–2143. [Google Scholar] [CrossRef]
- IPCC. Climate Change 2014: Synthesis Report; IPCC: Geneva, Switzerland, 2014; p. 151. [Google Scholar]
- Etkins, R.; Epstein, E.S. The rise of global mean sea level as an indication of climate change. Science 1982, 215, 287–289. [Google Scholar] [CrossRef] [PubMed]
- Cazenave, A.; Le Cozannet, G. Sea level rise and its coastal impacts. Earth’s Future 2014, 2, 15–34. [Google Scholar] [CrossRef]
- Slangen, A.; Adloff, F.; Jevrejeva, S.; Leclercq, P.W.; Marzeion, B.; Wada, Y.; Winkelmann, R. Integrative Study of the Mean Sea Level and Its Components; Chapter A Review of Recent Updates of Sea-Level Projections at Global and Regional Scales; Springer International Publishing: Cham, Switzerland, 2017; pp. 395–416. [Google Scholar] [CrossRef]
- Jevrejeva, S.; Frederikse, T.; Kopp, R.; Le Cozannet, G.; Jackson, L.; Van De Wal, R. Probabilistic sea level projections at the coast by 2100. Surv. Geophys. 2019, 40, 1673–1696. [Google Scholar] [CrossRef]
- Nicholls, R.J.; Hanson, S.E.; Lowe, J.A.; Warrick, R.A.; Lu, X.; Long, A.J.; Carter, T. Constructing Sea-Level Scenarios for Impact and Adaptation Assessment of Coastal Areas: A Guidance Document; Technical Report; Supporting Material, Intergovernmental Panel on Climate Change Task Group on Data and Scenario Support for Impact and Climate Analysis (TGICA): Geneva, Switzerland, 2011. [Google Scholar]
- Trenberth, K.E. The definition of el nino. Bull. Am. Meteorol. Soc. 1997, 78, 2771–2778. [Google Scholar] [CrossRef]
- Dieng, H.B.; Cazenave, A.; Meyssignac, B.; Ablain, M. New estimate of the current rate of sea level rise from a sea level budget approach. Geophys. Res. Lett. 2017, 44, 3744–3751. [Google Scholar] [CrossRef]
- Wang, F.; Shen, Y.; Chen, Q.; Geng, J. Revisiting sea-level budget by considering all potential impact factors for global mean sea-level change estimation. Sci. Rep. 2022, 12, 10251. [Google Scholar] [CrossRef]
- Carson, M.; Kohl, A.; Stammer, D.; Slangen, A.A.; Katsman, C.; van de Wal, R.W.; Church, J.; White, N. Coastal sea level changes, observed and projected during the 20th and 21st century. Clim. Change 2016, 134, 269–281. [Google Scholar] [CrossRef]
- Sweet, W.V.; Kopp, R.E.; Weaver, C.P.; Obeysekera, J.; Horton, R.M.; Thieler, E.R.; Zervas, C. Global and Regional Sea Level Rise Scenarios for the United States; National Oceanic and Atmospheric Administration: Silver Spring, MD, USA, 2017.
- Palanisamy, H.; Cazenave, A.; Meyssignac, B.; Soudarin, L.; Wöppelmann, G.; Becker, M. Regional sea level variability, total relative sea level rise and its impacts on islands and coastal zones of Indian Ocean over the last sixty years. Glob. Planet. Change 2014, 116, 54–67. [Google Scholar] [CrossRef]
- Woodworth, P.L.; Melet, A.; Marcos, M.; Ray, R.D.; Woppelmann, G.; Sasaki, Y.N.; Cirano, M.; Hibbert, A.; Huthnance, J.M.; Monserrat, S. Forcing factors affecting sea level changes at the coast. Surv. Geophys. 2019, 40, 1351–1397. [Google Scholar] [CrossRef]
- Kopp, R.E.; Hay, C.C.; Little, C.M.; Mitrovica, J.X. Geographic variability of sea-level change. Curr. Clim. Change Rep. 2015, 1, 192–204. [Google Scholar] [CrossRef]
- Chini, N.; Stansby, P.; Leake, J.; Wolf, J.; Roberts-Jones, J.; Lowe, J. The impact of sea level rise and climate change on inshore wave climate: A case study for East Anglia (UK). Coast. Eng. 2010, 57, 973–984. [Google Scholar] [CrossRef]
- Hang, Y. Numerical Study of Coastal Erosion Based on Sea Level Rise. In Proceedings of the International Conference on Hydraulic and Civil Engineering: Deep Space Intelligent Development and Utilization Forum (ICHCE), Xi’an, China, 25–27 November 2022; Number 1. pp. 495–498. [Google Scholar] [CrossRef]
- Seenipandi, K.; Ramachandran, K.; Chandrasekar, N. Modeling of coastal vulnerability to sea-level rise and shoreline erosion using modified CVI model. In Remote Sensing of Ocean and Coastal Environments; Elsevier: Amsterdam, The Netherlands, 2021; pp. 315–340. [Google Scholar] [CrossRef]
- Kantamaneni, K.; Sudha Rani, N.; Rice, L.; Sur, K.; Thayaparan, M.; Kulatunga, U.; Rege, R.; Yenneti, K.; Campos, L.C. A systematic review of coastal vulnerability assessment studies along Andhra Pradesh, India: A critical evaluation of data gathering, risk levels and mitigation strategies. Water 2019, 11, 393. [Google Scholar] [CrossRef]
- Mullick, M.R.A.; Tanim, A.; Islam, S.S. Coastal vulnerability analysis of Bangladesh coast using fuzzy logic based geospatial techniques. Ocean. Coast. Manag. 2019, 174, 154–169. [Google Scholar] [CrossRef]
- Ruzic, I.; Benac, C.; Jovancevic, S.D.; Radisic, M. The application of UAV for the analysis of geological hazard in Krk Island, Croatia, Mediterranean Sea. Remote Sens. 2021, 13, 1790. [Google Scholar] [CrossRef]
- Anfuso, G.; Postacchini, M.; Di Luccio, D.; Benassai, G. Coastal sensitivity/vulnerability characterization and adaptation strategies: A review. J. Mar. Sci. Eng. 2021, 9, 72. [Google Scholar] [CrossRef]
- Giannakidis, A.; Giakoumidakis, G.; Mania, K. 3D photorealistic scientific visualization of tsunami waves and sea level rise. In Proceedings of the 2014 IEEE International Conference on Imaging Systems and Techniques (IST) Proceedings, Santorini, Greece, 14–17 October 2014; IEEE: Piscataway, NJ, USA, 2014; pp. 167–172. [Google Scholar] [CrossRef]
- Owusu, C.; Snigdha, N.J.; Martin, M.T.; Kalyanapu, A.J. PyGEE-SWToolbox: A Python Jupyter Notebook Toolbox for Interactive Surface Water Mapping and Analysis Using Google Earth Engine. Sustainability 2022, 14, 2557. [Google Scholar] [CrossRef]
- Meyssignac, B.; Cazenave, A. Sea level: A review of present-day and recent-past changes and variability. J. Geodyn. 2012, 58, 96–109. [Google Scholar] [CrossRef]
- Wu, W.; Yang, Z.; Zhang, X.; Zhou, Y.; Tian, B.; Tang, Q. Integrated modeling analysis of estuarine responses to extreme hydrological events and sea-level rise. Estuar. Coast. Shelf Sci. 2021, 261, 107555. [Google Scholar] [CrossRef]
- Antonioli, F.; Anzidei, M.; Amorosi, A.; Presti, V.L.; Mastronuzzi, G.; Deiana, G.; De Falco, G.; Fontana, A.; Fontolan, G.; Lisco, S. Sea-level rise and potential drowning of the Italian coastal plains: Flooding risk scenarios for 2100. Quat. Sci. Rev. 2017, 158, 29–43. [Google Scholar] [CrossRef]
- Hereher, M.E. Assessment of climate change impacts on sea surface temperatures and sea level rise—The Arabian Gulf. Climate 2020, 8, 50. [Google Scholar] [CrossRef]
- Faridatunnisa, M.; Heliani, L.S. Study of Sea Level Rise Using Tide Gauge Data Year 1996 to 2015 at Semarang and Prigi Stations. In Proceedings of the 2018 4th International Conference on Science and Technology (ICST), Yogyakarta, Indonesia, 18–19 October 2018; IEEE: Piscataway, NJ, USA, 2018; pp. 1–4. [Google Scholar] [CrossRef]
- Zou, F.; Tenzer, R.; Fok, H.S.; Meng, G.; Zhao, Q. The sea-level changes in Hong Kong from tide-gauge records and remote sensing observations over the last seven decades. IEEE J. Sel. Top. Appl. Earth Obs. Remote Sens. 2021, 14, 6777–6791. [Google Scholar] [CrossRef]
- Passeri, D.L.; Hagen, S.C.; Medeiros, S.C.; Bilskie, M.V.; Alizad, K.; Wang, D. The dynamic effects of sea level rise on low-gradient coastal landscapes: A review. Earth’s Future 2015, 3, 159–181. [Google Scholar] [CrossRef]
- Subraelu, P.; Ebraheem, A.A.; Sherif, M.; Sefelnasr, A.; Yagoub, M.; Rao, K.N. Land in Water: The Study of Land Reclamation and Artificial Islands Formation in the UAE Coastal Zone: A Remote Sensing and GIS Perspective. Land 2022, 11, 2024. [Google Scholar] [CrossRef]
- Ellison, J.C. Vulnerability assessment of mangroves to climate change and sea-level rise impacts. Wetl. Ecol. Manag. 2015, 23, 115–137. [Google Scholar] [CrossRef]
- Frederikse, T.; Landerer, F.; Caron, L.; Adhikari, S.; Parkes, D.; Humphrey, V.W.; Dangendorf, S.; Hogarth, P.; Zanna, L.; Cheng, L.; et al. The causes of sea-level rise since 1900. Nature 2020, 584, 393–397. [Google Scholar] [CrossRef]
- El-Asmar, H.M.; Taha, M.M. Monitoring Coastal Changes and Assessing Protection Structures at the Damietta Promontory, Nile Delta, Egypt, to Secure Sustainability in the Context of Climate Changes. Sustainability 2022, 14, 15415. [Google Scholar] [CrossRef]
- Wang, F.; Li, J.; Shi, P.; Shang, Z.; Li, Y.; Wang, H. The impact of sea-level rise on the coast of Tianjin-Hebei, China. China Geol. 2019, 2, 26–39. [Google Scholar] [CrossRef]
- Rovere, A.; Stocchi, P.; Vacchi, M. Eustatic and relative sea level changes. Curr. Clim. Change Rep. 2016, 2, 221–231. [Google Scholar] [CrossRef]
- Zanchettin, D.; Bruni, S.; Raicich, F.; Lionello, P.; Adloff, F.; Androsov, A.; Antonioli, F.; Artale, V.; Carminati, E.; Ferrarin, C. Sea-level rise in Venice: Historic and future trends. Nat. Hazards Earth Syst. Sci. 2021, 21, 2643–2678. [Google Scholar] [CrossRef]
- Aguilera-Vidal, M.; Munoz-Perez, J.J.; Contreras, A.; Contreras, F.; Lopez-Garcia, P.; Jigena, B. Increase in the Erosion Rate due to the Impact of Climate Change on Sea Level Rise: Victoria Beach, a Case Study. J. Mar. Sci. Eng. 2022, 10, 1912. [Google Scholar] [CrossRef]
- Aryal, B.; Escarzaga, S.M.; Vargas Zesati, S.A.; Velez-Reyes, M.; Fuentes, O.; Tweedie, C. Semi-automated semantic segmentation of arctic shorelines using very high-resolution airborne imagery, spectral indices and weakly supervised machine learning approaches. Remote Sens. 2021, 13, 4572. [Google Scholar] [CrossRef]
- Aldogom, D.; Albesher, S.; Al Mansoori, S.; Nazzal, T. Assessing Coastal Land Dynamics Along UAE Shoreline Using GIS and Remote Sensing Techniques. In IOP Conference Series: Earth and Environmental Science; IOP Publishing: Bristol, UK, 2020; Volume 540, p. 012031. [Google Scholar] [CrossRef]
- Bengoufa, S.; Niculescu, S.; Mihoubi, M.K.; Belkessa, R.; Rami, A.; Rabehi, W.; Abbad, K. Machine learning and shoreline monitoring using optical satellite images: Case study of the Mostaganem shoreline, Algeria. J. Appl. Remote Sens. 2021, 15, 026509. [Google Scholar] [CrossRef]
- Onat, Y.; Marchant, M.; Francis, O.P.; Kim, K. Coastal exposure of the Hawaiian Islands using GIS-based index modeling. Ocean. Coast. Manag. 2018, 163, 113–129. [Google Scholar] [CrossRef]
- Sudha Rani, N.; Satyanarayana, A.; Bhaskaran, P.K. Coastal vulnerability assessment studies over India: A review. Nat. Hazards 2015, 77, 405–428. [Google Scholar] [CrossRef]
- Sarkar, N.; Rizzo, A.; Vandelli, V.; Soldati, M. A Literature Review of Climate-Related Coastal Risks in the Mediterranean, a Climate Change Hotspot. Sustainability 2022, 14, 15994. [Google Scholar] [CrossRef]
- Kont, A.; Jaagus, J.; Aunap, R. Climate change scenarios and the effect of sea-level rise for Estonia. Glob. Planet. Change 2003, 36, 1–15. [Google Scholar] [CrossRef]
- Dean, R.; Houston, J. Determining shoreline response to sea level rise. Coast. Eng. 2016, 114, 1–8. [Google Scholar] [CrossRef]
- Le Cozannet, G.; Garcin, M.; Yates, M.; Idier, D.; Meyssignac, B. Approaches to evaluate the recent impacts of sea-level rise on shoreline changes. Earth-Sci. Rev. 2014, 138, 47–60. [Google Scholar] [CrossRef]
- Smith, K.E.; Terrano, J.F.; Pitchford, J.L.; Archer, M.J. Coastal wetland shoreline change monitoring: A comparison of shorelines from high-resolution WorldView Satellite imagery, aerial Imagery, and field surveys. Remote Sens. 2021, 13, 3030. [Google Scholar] [CrossRef]
- Saleh, A.S.; Altaei, S.; Alkhaldi, F.K. Climate Change Implications on Small Island Developing States (SIDS): A Socioeconomic Perspective from the Kingdom of Bahrain. In Proceedings of the 2021 Third International Sustainability and Resilience Conference: Climate Change, Virtual, 15–17 November 2021; IEEE: Piscataway, NJ, USA, 2021; pp. 39–44. [Google Scholar] [CrossRef]
- Sowe, M.A.; Sadhasivam, S.; Mostafa Mohamed, M.; Mohsen, S. Modeling the mitigation of seawater intrusion by pumping of brackish water from the coastal aquifer of Wadi Ham, UAE. Sustain. Water Resour. Manag. 2019, 5, 1435–1451. [Google Scholar] [CrossRef]
- Abdouli, K.A.; Hussein, K.; Ghebreyesus, D.; Sharif, H.O. Coastal runoff in the United Arab Emirates—The hazard and opportunity. Sustainability 2019, 11, 5406. [Google Scholar] [CrossRef]
- Pernetta, J.C. Impacts of climate change and sea-level rise on small island states: National and international responses. Glob. Environ. Change 1992, 2, 19–31. [Google Scholar] [CrossRef]
- Susnik, J.; Vamvakeridou-Lyroudia, L.S.; Baumert, N.; Kloos, J.; Renaud, F.G.; La Jeunesse, I.; Mabrouk, B.; Savic, D.A.; Kapelan, Z.; Ludwig, R. Interdisciplinary assessment of sea-level rise and climate change impacts on the lower Nile delta, Egypt. Sci. Total Environ. 2015, 503, 279–288. [Google Scholar] [CrossRef]
- Parthasarathy, K.; Deka, P.C. Remote sensing and GIS application in assessment of coastal vulnerability and shoreline changes: A review. ISH J. Hydraul. Eng. 2021, 27, 588–600. [Google Scholar] [CrossRef]
- Gesch, D.B. Best practices for elevation-based assessments of sea-level rise and coastal flooding exposure. Front. Earth Sci. 2018, 6, 230. [Google Scholar] [CrossRef]
- Abou-Mahmoud, M.M.E. Assessing coastal susceptibility to sea-level rise in Alexandria, Egypt. Egypt. J. Aquat. Res. 2021, 47, 133–141. [Google Scholar] [CrossRef]
- Carbognin, L.; Teatini, P.; Tomasin, A.; Tosi, L. Global change and relative sea level rise at Venice: What impact in term of flooding. Clim. Dyn. 2010, 35, 1039–1047. [Google Scholar] [CrossRef]
- Winters, M.A.; Leslie, B.; Sloane, E.B.; Gallien, T.W. Observations and Preliminary Vulnerability Assessment of a Hybrid Dune-Based Living Shoreline. J. Mar. Sci. Eng. 2020, 8, 920. [Google Scholar] [CrossRef]
- Arthur, R.M.; Garland, G. Predicting the Extent of Inundation due to Sea-Level Rise: Al Hamra Development, Ras Al Khaimah, UAE. A Pilot Project. Misc. Geogr. 2016, 20, 25–31. [Google Scholar] [CrossRef]
- Maulud, K.N.A.; Rafar, R.M. Determination the impact of sea level rise to shoreline changes using GIS. In Proceedings of the 2015 International Conference on Space Science and Communication (IconSpace), Langkawi, Malaysia, 10–12 August 2015; IEEE: Piscataway, NJ, USA, 2015; pp. 352–357. [Google Scholar] [CrossRef]
- Barboza, E.G.; Dillenburg, S.R.; do Nascimento Ritter, M.; Angulo, R.J.; da Silva, A.B.; da Camara Rosa, M.L.C.; Caron, F.; de Souza, M.C. Holocene sea-level changes in southern Brazil based on high-resolution radar stratigraphy. Geosciences 2021, 11, 326. [Google Scholar] [CrossRef]
- Dwarakish, G.; Nithyapriya, B. Application of soft computing techniques in coastal study—A review. J. Ocean. Eng. Sci. 2016, 1, 247–255. [Google Scholar] [CrossRef]
- Vishwanathan, S.; Murty, M.N. SSVM: A simple SVM algorithm. In Proceedings of the 2002 International Joint Conference on Neural Networks, Honolulu, HI, USA, 12–17 May 2002; IEEE: Piscataway, NJ, USA, 2002; Volume 3, pp. 2393–2398. [Google Scholar] [CrossRef]
- Fitz Gerald, D.M.; Fenster, M.S.; Argow, B.A.; Buynevich, I.V. Coastal Impacts Due to Sea-Level Rise. Annu. Rev. Earth Planet. Sci. 2008, 36, 601–647. [Google Scholar] [CrossRef]
- Ku, H.; Kim, T.; Song, Y.i. Coastal vulnerability assessment of sea-level rise associated with typhoon-induced surges in South Korea. Ocean. Coast. Manag. 2021, 213, 105884. [Google Scholar] [CrossRef]
- Yesudian, A.N.; Dawson, R.J. Global analysis of sea level rise risk to airports. Clim. Risk Manag. 2021, 31, 100266. [Google Scholar] [CrossRef]
- Salimi, M.; Al-Ghamdi, S.G. Climate change impacts on critical urban infrastructure and urban resiliency strategies for the Middle East. Sustain. Cities Soc. 2020, 54, 101948. [Google Scholar] [CrossRef]
- Chadwick, B.; Flick, R.; Helly, J.; Nishikawa, T.; Wang, P.F.; O Reilly, W.; Guza, R.; Bromirski, P.; Young, A.; Crampton, W. A framework for sea level rise vulnerability assessment for southwest US military installations. In Proceedings of the OCEANS’11 MTS/IEEE KONA, Waikoloa, HI, USA, 19–22 September 2011; IEEE: Piscataway, NJ, USA, 2011; pp. 1–10. [Google Scholar] [CrossRef]
- Marfai, M.A.; King, L. Potential vulnerability implications of coastal inundation due to sea level rise for the coastal zone of Semarang city, Indonesia. Environ. Geol. 2008, 54, 1235–1245. [Google Scholar] [CrossRef]
- Kebede, A.S.; Nicholls, R.J.; Hanson, S.; Mokrech, M. Impacts of Climate Change and Sea-Level Rise: A Preliminary Case Study of Mombasa, Kenya. J. Coast. Res. 2010, 28, 8–19. [Google Scholar] [CrossRef]
- Lincoln, S.; Buckley, P.; Howes, E.L.; Maltby, K.M.; Pinnegar, J.K.; Ali, T.S.; Alosairi, Y.; Al-Ragum, A.; Baglee, A.; Balmes, C.O.; et al. A Regional Review of Marine and Coastal Impacts of Climate Change on the ROPME Sea Area. Sustainability 2021, 13, 13810. [Google Scholar] [CrossRef]
- Scavo, A.N.; Singh, R.P. Effect of climate change on California fish species. In Proceedings of the 2016 IEEE International Geoscience and Remote Sensing Symposium (IGARSS), Beijing, China, 10–15 July 2016; IEEE: Piscataway, NJ, USA, 2016; pp. 6070–6073. [Google Scholar] [CrossRef]
- Zuo, X.; Su, F.; Yu, K.; Wang, Y.; Wang, Q.; Wu, H. Spatially Modeling the Synergistic Impacts of Global Warming and Sea-Level Rise on Coral Reefs in the South China Sea. Remote Sens. 2021, 13, 2626. [Google Scholar] [CrossRef]
- Mohanty, A. Impacts of climate change on human health and agriculture in recent years. In Proceedings of the 2021 IEEE Region 10 Symposium (TENSYMP), Jeju, Republic of Korea, 23–25 August 2021; IEEE: Piscataway, NJ, USA, 2021; pp. 1–4. [Google Scholar] [CrossRef]
- Mcleod, E.; Poulter, B.; Hinkel, J.; Reyes, E.; Salm, R. Sea-level rise impact models and environmental conservation: A review of models and their applications. Ocean. Coast. Manag. 2010, 59, 507–517. [Google Scholar] [CrossRef]
- Tachikawa, T.; Kaku, M.; Iwasaki, A. ASTER GDEM Version 3 Validation Report; Japan Space System: Tokyo, Japan, 2015. [Google Scholar]
- Wandinger, U. Introduction to Lidar. In Lidar: Range-Resolved Optical Remote Sensing of the Atmosphere; Weitkamp, C., Ed.; Springer: New York, NY, USA, 2005; pp. 1–18. [Google Scholar] [CrossRef]
- Warrick, R.A.; Ye, W.; Kouwenhoven, P.; Hay, J.; Cheatham, C. New developments of the SimCLIM model for simulating adaptation to risks arising from climate variability and change. In Proceedings of the International Congress on Modelling and Simulation, Modelling and Simulation Society of Australia and New Zealand, Melbourne, Australia, 12–15 December 2005; pp. 170–176. [Google Scholar]
- Fox-Kemper, B.; Adcroft, A.; Boning, C.; Chassignet, E.; Curchitser, E.; Danabasoglu, G.; Eden, C.; England, M.M.; Gerdes, R.; Greatbatch, R.J.; et al. Challenges and Prospects in Ocean Circulation Models. Front. Mar. Sci. 2019, 6, 65. [Google Scholar] [CrossRef]
- Chassignet, E.P.; Hurlburt, H.E.; Metzger, E.J.; Smedstad, O.M.; Cummings, J.A.; Halliwell, G.R.; Bleck, R.; Baraille, R.; Wallcraft, A.J.; Lozano, C. US GODAE: Global ocean prediction with the HYbrid Coordinate Ocean Model (HYCOM). Oceanography 2009, 22, 64–75. [Google Scholar] [CrossRef]
- Pycroft, J.; Abrell, J.; Ciscar, J.C. The global impacts of extreme sea-level rise: A comprehensive economic assessment. Environ. Resour. Econ. 2016, 64, 225–253. [Google Scholar] [CrossRef]
- Koroglu, A.; Ranasinghe, R.; Jimenez, J.A.; Dastgheib, A. Comparison of coastal vulnerability index applications for Barcelona Province. Ocean. Coast. Manag. 2019, 178, 104799. [Google Scholar] [CrossRef]
- Luccioni, A.; Schmidt, V.; Vardanyan, V.; Bengio, Y. Using artificial intelligence to visualize the impacts of climate change. IEEE Comput. Graph. Appl. 2021, 41, 8–14. [Google Scholar] [CrossRef]
- Pan, Z.; Yu, W.; Yi, X.; Khan, A.; Yuan, F.; Zheng, Y. Recent progress on generative adversarial networks (GANs): A survey. IEEE Access 2019, 7, 36322–36333. [Google Scholar] [CrossRef]
- Tabassum, A.; Rabbani, M.; Omar, S.B. An approach to study on time series components and by using them to enumerate the height of sea level alteration for both Global Mean Sea Level(GMSL) and Bay of Bengal(BOB). In Proceedings of the 2019 IEEE International Conference on Electrical, Computer and Communication Technologies (ICECCT), Coimbatore, India, 20–22 February 2019; IEEE: Piscataway, NJ, USA, 2019; pp. 1–7. [Google Scholar] [CrossRef]
- Krishnamurthy, V.N.D.; Degadwala, S.; Vyas, D. Forecasting Future Sea Level Rise: A Data-driven Approach using Climate Analysis. In Proceedings of the 2023 2nd International Conference on Edge Computing and Applications (ICECAA), Coimbatore, India, 20–21 March 2023; IEEE: Piscataway, NJ, USA, 2023; pp. 646–651. [Google Scholar] [CrossRef]
- Elneel, L.; Zitouni, M.S.; Mukhtar, H.; Al-Ahmad, H. Forecasting Global Mean Sea Level Rise using Autoregressive Models. In Proceedings of the 2023 30th IEEE International Conference on Electronics, Circuits and Systems (ICECS), Istanbul, Turkey, 4–7 December 2023; IEEE: Piscataway, NJ, USA, 2023; pp. 1–4. [Google Scholar] [CrossRef]
- Hassan, K.M.A.; Haque, M.A.; Ahmed, S. Comparative Study of Forecasting Global Mean Sea Level Rising using Machine Learning. In Proceedings of the 2021 International Conference on Electronics, Communications and Information Technology (ICECIT), Khulna, Bangladesh, 14–16 September 2021; IEEE: Piscataway, NJ, USA, 2021; pp. 1–4. [Google Scholar] [CrossRef]
- Nguyen, T.T.; Bonetti, J.; Rogers, K.; Woodroffe, C.D. Indicator-based assessment of climate-change impacts on coasts: A review of concepts, methodological approaches and vulnerability indices. Ocean. Coast. Manag. 2016, 123, 18–43. [Google Scholar] [CrossRef]
- Pantusa, D.; D’Alessandro, F.; Riefolo, L.; Principato, F.; Tomasicchio, G.R. Application of a coastal vulnerability index. A case study along the Apulian Coastline, Italy. Water 2018, 10, 1218. [Google Scholar] [CrossRef]
- Gornitz, V. Global coastal hazards from future sea level rise. Palaeogeogr. Palaeoclimatol. Palaeoecol. 1991, 89, 379–398. [Google Scholar] [CrossRef]
- Thieler, E.R.; Hammar-Klose, E.S. National Assessment of Coastal Vulnerability to Sea-Level Rise: Preliminary Results for the US Atlantic Coast; Technical Report; US Geological Survey: Asheville, NC, USA, 1999. [CrossRef]
- Lopez Royo, M.; Ranasinghe, R.; Jimenez, J.A. A rapid, low-cost approach to coastal vulnerability assessment at a national level. J. Coast. Res. 2016, 32, 932–945. [Google Scholar] [CrossRef]
- Norezan, N.N.M.; Ma’arof, I.; Sulaiman, S.A. Offshore Vulnerability and Sustainability Assessment Affected by Sea Breakwater Construction using Geomatics Engineering Technology. In Proceedings of the 2021 IEEE 12th Control and System Graduate Research Colloquium, Shah Alam, Malaysia, 7 August 2021; IEEE: Piscataway, NJ, USA, 2021; pp. 104–109. [Google Scholar] [CrossRef]
- Mclaughlin, S.; Cooper, J.A.G. A multi-scale coastal vulnerability index: A tool for coastal managers? Environ. Hazards 2010, 9, 233–248. [Google Scholar] [CrossRef]
- Cooper, J.; McLaughlin, S. Contemporary multidisciplinary approaches to coastal classification and environmental risk analysis. J. Coast. Res. 1998, 14, 512–524. [Google Scholar]
- Feindouno, S.; Goujon, M. The Retrospective Economic Vulnerability Index, 2015 Update; Ferdi Working Paper; Ferdi: New York, NY, USA, 2016. [Google Scholar]
- Al-Awadhi, T.; Mansour, S.; Hereher, M. Assessment of coastal sensitivity to non-eustatic sea level rise: A case study on Muscat coast—Sultanate of Oman. Arab. J. Geosci. 2020, 13, 1–11. [Google Scholar] [CrossRef]
- Bagdanaviciute, I.; Kelpaaite, L.; Soomere, T. Multi-criteria evaluation approach to coastal vulnerability index development in micro-tidal low-lying areas. Ocean. Coast. Manag. 2015, 104, 124–135. [Google Scholar] [CrossRef]
- Hereher, M.; Al-Awadhi, T.; Al-Hatrushi, S.; Charabi, Y.; Mansour, S.; Al-Nasiri, N.; Sherief, Y.; El-Kenawy, A. Assessment of the coastal vulnerability to sea level rise: Sultanate of Oman. Environ. Earth Sci. 2020, 79, 1–12. [Google Scholar] [CrossRef]
- Oloyede, M.O.; Williams, A.B.; Ode, G.O.; Benson, N.U. Coastal Vulnerability Assessment: A Case Study of the Nigerian Coastline. Sustainability 2022, 14, 2097. [Google Scholar] [CrossRef]
- Ennouali, Z.; Fannassi, Y.; Lahssini, G.; Benmohammadi, A.; Masria, A. Mapping Coastal vulnerability using machine learning algorithms: A case study at North coastline of Sebou estuary, Morocco. Reg. Stud. Mar. Sci. 2023, 60, 102829. [Google Scholar] [CrossRef]
- Schernewski, G.; Voeckler, L.N.; Lambrecht, L.; Robbe, E.; Schumacher, J. Building with Nature—Ecosystem Service Assessment of Coastal-Protection Scenarios. Sustainability 2022, 14, 15737. [Google Scholar] [CrossRef]
- Fahlstrom, P.G.; Gleason, T.J. Introduction to UAV Systems, 4th ed.; John Wiley and Sons: Hoboken, NJ, USA, 2012; pp. 1–15. [Google Scholar] [CrossRef]
- Shuvo, S.S.; Yilmaz, Y.; Bush, A.; Hafen, M. Scenario Planning for Sea Level Rise via Reinforcement Learning. In Proceedings of the 2019 IEEE Global Conference on Signal and Information Processing (GlobalSIP), Ottawa, ON, Canada, 11–14 November 2019; IEEE: Piscataway, NJ, USA, 2019; pp. 1–5. [Google Scholar] [CrossRef]
- Fu, X. Measuring local sea-level rise adaptation and adaptive capacity: A national survey in the United States. Cities 2020, 102, 102717. [Google Scholar] [CrossRef]
- Da Lio, C.; Tosi, L. Vulnerability to relative sea-level rise in the Po river delta (Italy). Estuar. Coast. Shelf Sci. 2019, 228, 106379. [Google Scholar] [CrossRef]
- Ministry of Climate Change and Environment. UAE Climate Risk Assessment and Adaptation Measures in Key Sectors: Health, Energy, Infrastructure and Environment; Technical Report National Climate Change Adaptation Program; Ministry of Climate Change and Environment: Dubai, United Arab Emirates, 2019.
- Alosairi, Y.; Alsulaiman, N.; Rashed, A.; Al-Houti, D. World record extreme sea surface temperatures in the northwestern Arabian/Persian Gulf verified by in situ measurements. Mar. Pollut. Bull. 2020, 161, 111766. [Google Scholar] [CrossRef] [PubMed]
- Moradi, M. Trend analysis and variations of sea surface temperature and chlorophyll-a in the Persian Gulf. Mar. Pollut. Bull. 2020, 156, 111267. [Google Scholar] [CrossRef]
- Bruciaferri, D.; Tonani, M.; Ascione, I.; Al Senafi, F.; O’Dea, E.; Hewitt, H.T.; Saulter, A. GULF18, a high-resolution NEMO-based tidal ocean model of the Arabian/Persian Gulf. Geosci. Model Dev. Discuss. 2022, 2022, 1–38. [Google Scholar] [CrossRef]
- Al-Subhi, A.M.; Abdulla, C.P. Sea-Level Variability in the Arabian Gulf in Comparison with Global Oceans. Remote Sens. 2021, 13, 4524. [Google Scholar] [CrossRef]
- Al-Maamary, H.M.; Kazem, H.A.; Chaichan, M.T. Climate change: The game changer in the Gulf Cooperation Council Region. Renew. Sustain. Energy Rev. 2017, 76, 555–576. [Google Scholar] [CrossRef]
- Chow, A.C.; Sun, J. Combining Sea level rise inundation impacts, tidal flooding and extreme wind events along the Abu Dhabi coastline. Hydrology 2022, 9, 143. [Google Scholar] [CrossRef]
- Campos, E.J.; Gordon, A.L.; Kjerfve, B.; Vieira, F.; Cavalcante, G. Freshwater budget in the Persian (Arabian) Gulf and exchanges at the Strait of Hormuz. PLoS ONE 2020, 15, e0233090. [Google Scholar] [CrossRef]
- Lokier, S.W.; Bateman, M.D.; Larkin, N.R.; Rye, P.; Stewart, J.R. Late Quaternary sea-level changes of the Persian Gulf. Quat. Res. 2015, 84, 69–81. [Google Scholar] [CrossRef]
- Vaughan, G.O.; Al-Mansoori, N.; Burt, J.A. The arabian gulf. In World Seas: An Environmental Evaluation; Elsevier: Amsterdam, The Netherlands, 2019; pp. 1–23. [Google Scholar]
- Ministry of Climate Change and Environment. Adaptation of the UAEs Infrastructure to Climate Change; Technical Report National Climate Change Adaptation Program; Ministry of Climate Change and Environment: Dubai, United Arab Emirates, 2019.
Figure 1.
Classification of SLR aspects, as identified and discussed in this paper.

Figure 2.
Number of reviewed papers for each category over the years.
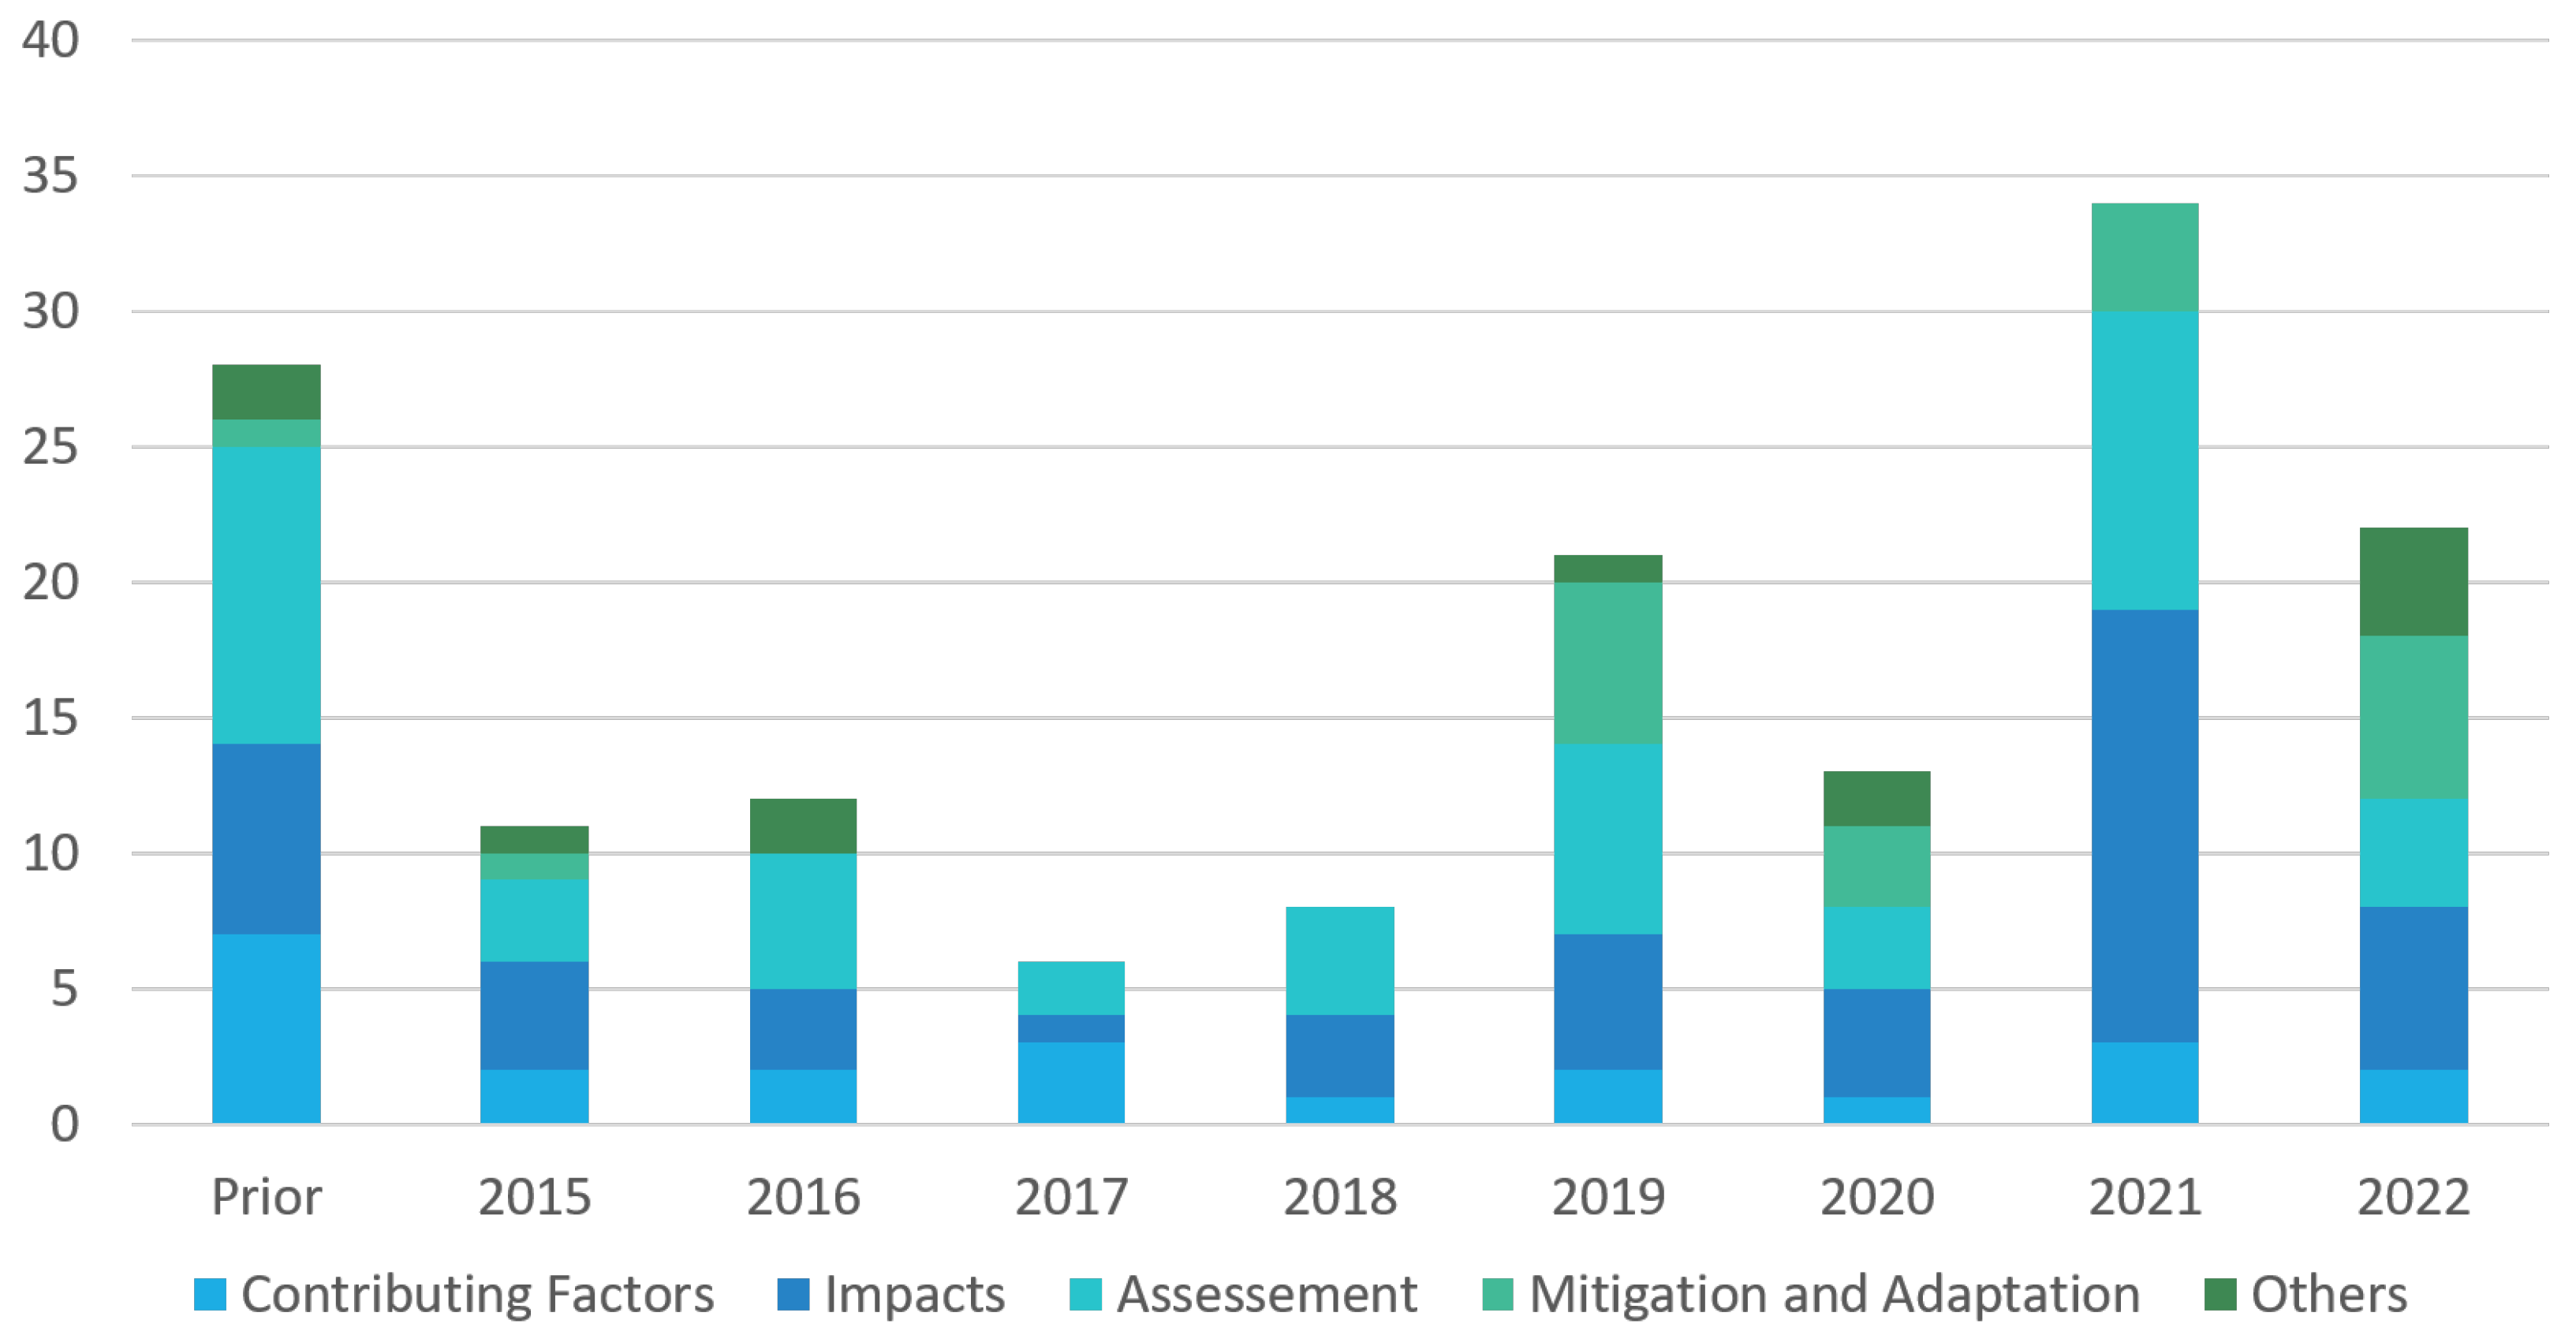
Figure 3.
Factors contributing to GMSL.

Figure 4.
Variation between the average RMSL and GMSL. Positive values indicate higher deviation from GMSL [17].
Figure 4.
Variation between the average RMSL and GMSL. Positive values indicate higher deviation from GMSL [17].
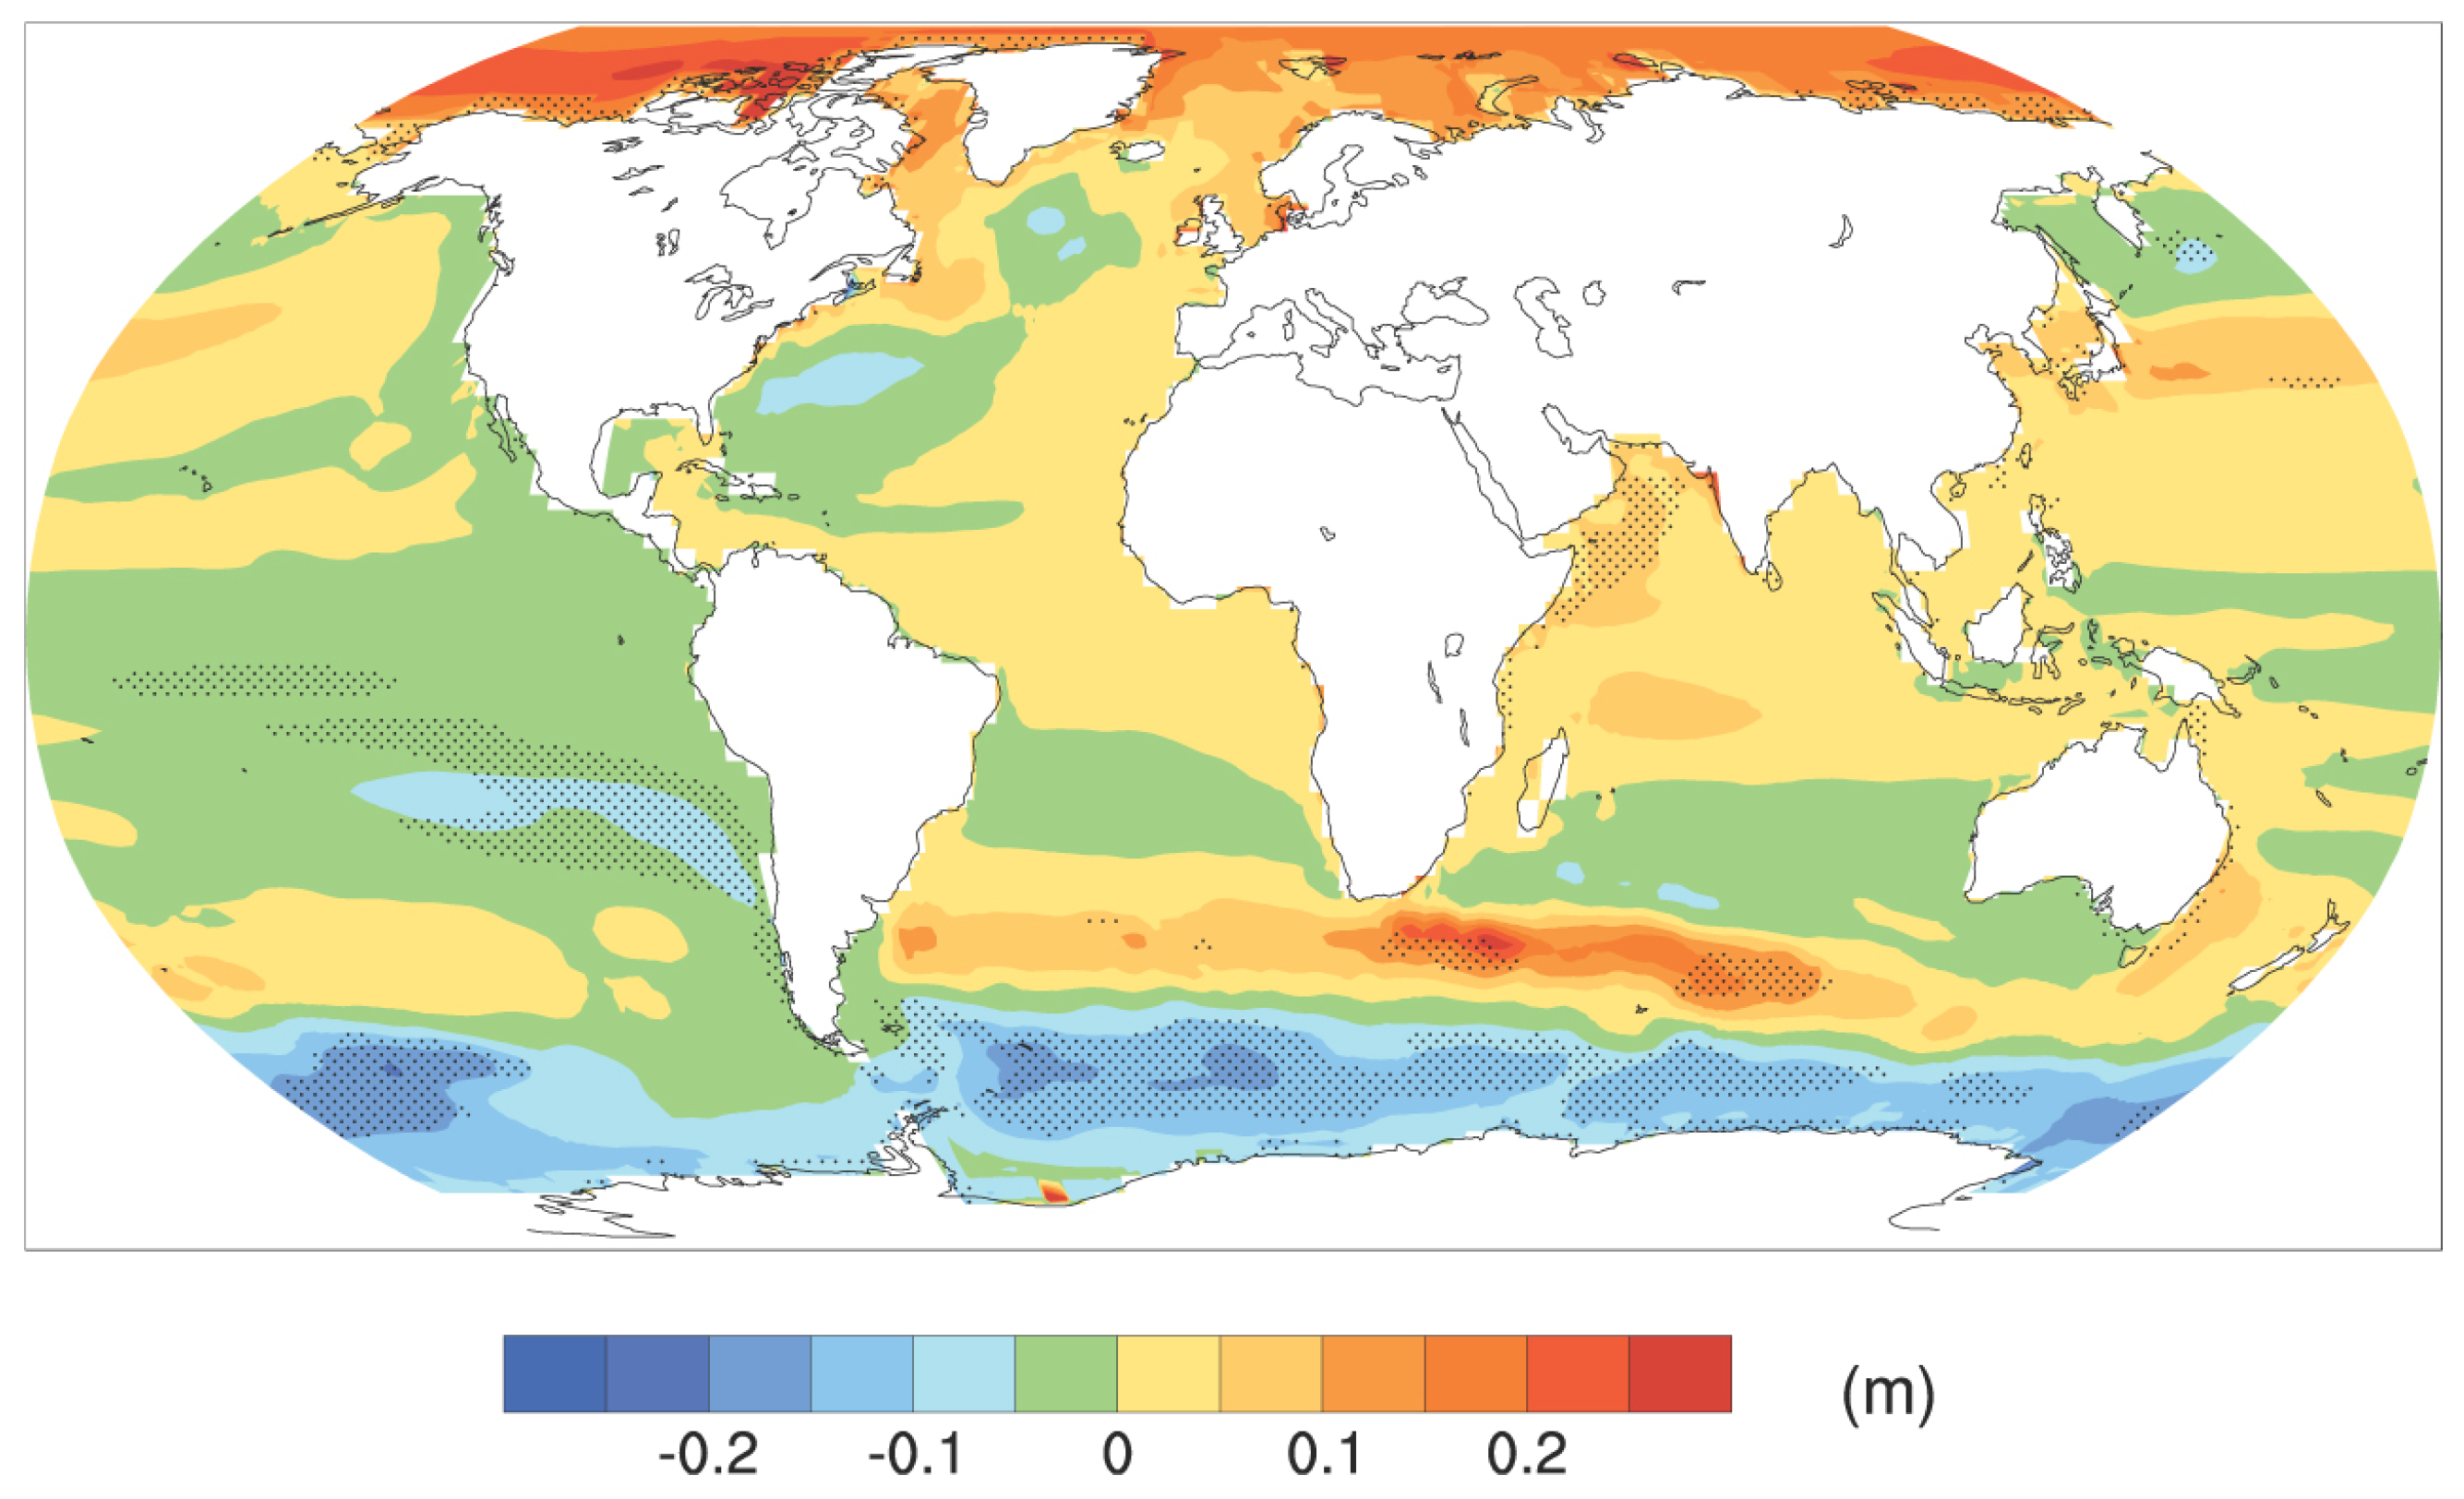
Figure 5.
Areas impacted by SLR and the affected percentage of the population [2].
Figure 5.
Areas impacted by SLR and the affected percentage of the population [2].
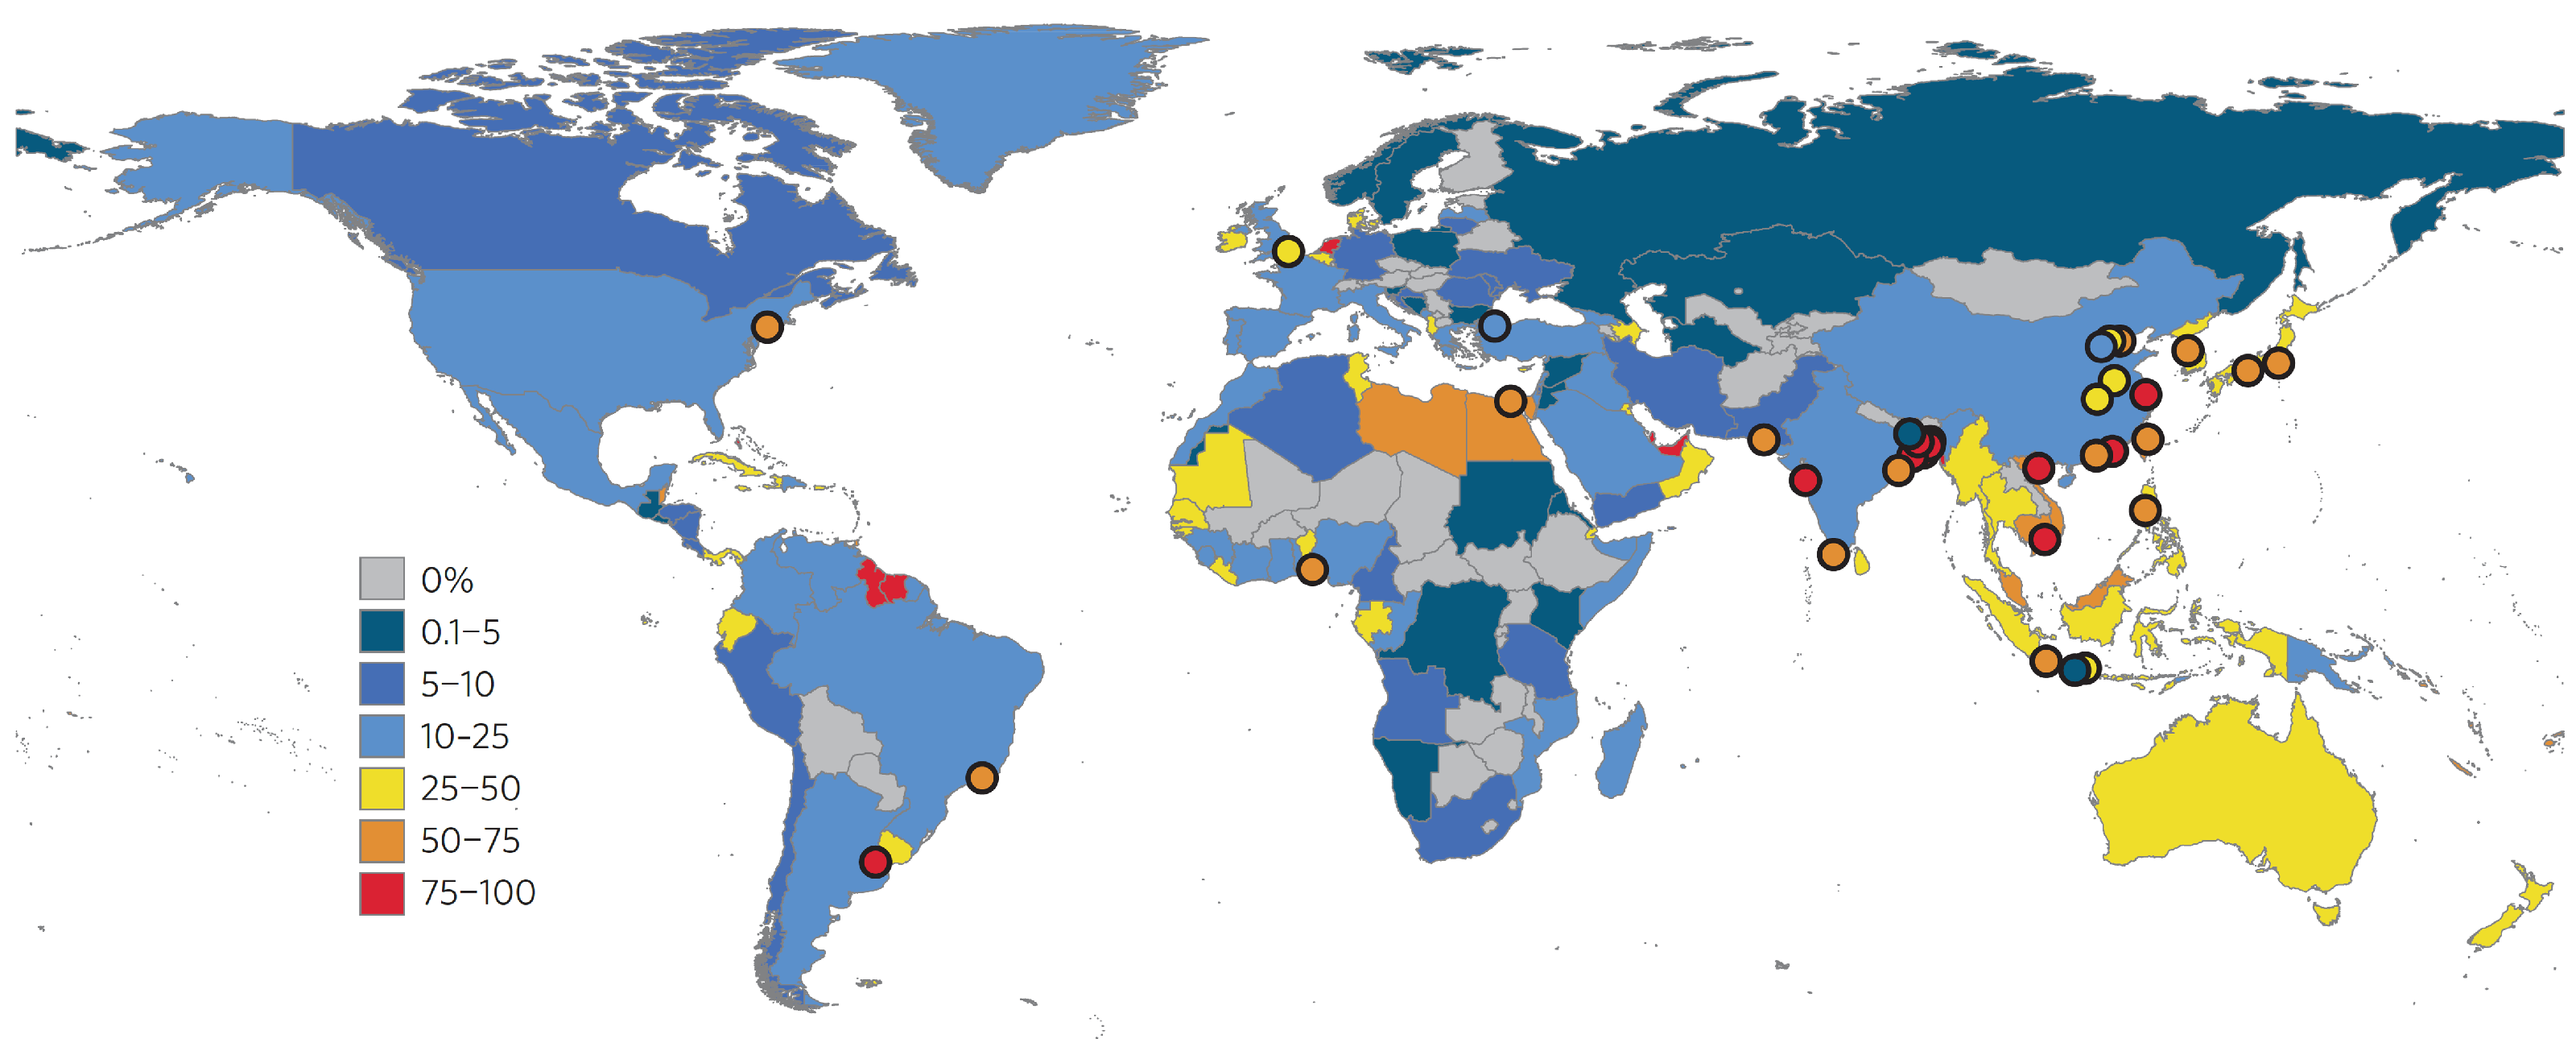
Figure 6.
Projection of GMSL (in meters) under different RCP scenarios with associated uncertainties (shading) [12].
Figure 6.
Projection of GMSL (in meters) under different RCP scenarios with associated uncertainties (shading) [12].

Figure 7.
Methodology for developing SLR scenarios for impact, mitigation and adaptation assessments [17].
Figure 7.
Methodology for developing SLR scenarios for impact, mitigation and adaptation assessments [17].


Table 1.
Comparison of coastal vulnerability assessment (CVI) techniques in the literature.
| Paper | Year | Region | Spatial Scale | Approach |
|---|---|---|---|---|
| [103] | 1999 | US Atlantic coast | National | CVI (geomorphology, shoreline change rate, coastal slope, regional SLR, mean significant wave height, and mean tidal range) |
| [106] | 2010 | Northern Ireland | Local | CVI coastal characteristics (resilience and susceptibility) + coastal forcing + socioeconomic factors |
| [110] | 2015 | Lithuania in the south-eastern Baltic Sea | Local | CVI are combined with DS (the outcome analytical hierarchical process (AHP)) |
| [104] | 2016 | peninsular coastline of Spain | National | CVI (geomorphology, shoreline change rate, coastal slope, regional SLR, mean significant wave height, and mean tidal range) |
| [101] | 2018 | Italy | Local | CVI with 10 parameters: (1) geologic (geomorphology, coastal slope, shoreline erosion/accretion, emerged beach width, and dune width), (2) physical process (regional SLR, mean significant wave height, and mean tide range), and (3) vegetation (width of vegetation behind the beach and Posidonia oceanica)) |
| [53] | 2018 | Hawaiian Islands | Local | CVI and InVEST model to calculate the exposure index (EI). Parameters: bathymetry, shoreline geomorphology, regional SLR, wind and wave actions, LU/LC, and population |
| [29] | 2019 | Andhra Pradesh (CAP) region in India | local | CVI (geomorphology, shoreline change rate, coastal slope, regional SLR, mean significant wave height, and mean tidal range) |
| [30] | 2019 | Bangladesh | National | CVI method of Mclaughlin and Cooper (2010) [106] that consists of three sub-indices: (1) coastal characteristics vulnerability sub-index; (2) coastal forcing vulnerability sub-index, and (3) socioeconomic vulnerability sub-index |
| [111] | 2020 | Sultanate of Oman | National | CVI (coastal geomorphology coastal slope, coastal elevation, tidal range, and bathymetry) |
| [105] | 2021 | Malaysia’s east coast, Terengganu State beaches | Local | CVI of coastal vulnerabilities using Hammar–Klose and Thieler CVI rankings |
| [28] | 2021 | South India | Regional | CVI with 10 parameters: geomorphology, shoreline erosion/accretion rate, coastal slope, regional SLR, mean significant wave height, mean tide range, storm wave run-up, regional elevation, LU/LC change, and mean wave height |
| [76] | 2021 | South Korea | National | CVI of 3 main components: exposure (population density and age group distribution, coastal industrial facilities, and GRDP), sensitivity (inundated depth and impacted areas), and adaptive capacity (humans, emergency response and disaster management, relief fund, and public officials) |
| [112] | 2022 | Nigeria | National | CVI using physical and socioeconomic parameters (geomorphology, coastal slope, bathymetry, wave height, mean tidal range, shoreline change rate, regional SLR, population, cultural heritage, LU/LC, and road network) |
| [113] | 2023 | Northern area of the estuary of Sebou’ in Morocco | Local | CVI with machine learning algorithms (geomorphology, elevation, slope, shoreline change, natural habitat, SLR, maximum wave height, and tidal range) |
Table 2.
Comparison of different mitigation and adaptation measures (MAM) in the literature.
| MAM Category | Type (# Papers) | Papers | Examples |
|---|---|---|---|
| Structural | Hard Structures (6) | [10,31,42,45,46,67,118] | Breakwaters, seawalls, dikes |
| Soft Structures (2) | [31,69] | Dunes, beach nourishment | |
| Eco-Based Structures (4) | [4,67,82,114] | Seagrass bed, wetlands & reef conversion and restoration | |
| Non-Structural | Policies and Regulations (6) | [4,60,116,117,118,119] | Relocation, hazard mapping, public awareness |
Disclaimer/Publisher’s Note: The statements, opinions and data contained in all publications are solely those of the individual author(s) and contributor(s) and not of MDPI and/or the editor(s). MDPI and/or the editor(s) disclaim responsibility for any injury to people or property resulting from any ideas, methods, instructions or products referred to in the content. |
© 2024 by the authors. Licensee MDPI, Basel, Switzerland. This article is an open access article distributed under the terms and conditions of the Creative Commons Attribution (CC BY) license (https://creativecommons.org/licenses/by/4.0/).
Share and Cite
MDPI and ACS Style
Elneel, L.; Zitouni, M.S.; Mukhtar, H.; Galli, P.; Al-Ahmad, H. Exploring Key Aspects of Sea Level Rise and Their Implications: An Overview. Water 2024, 16, 388. https://doi.org/10.3390/w16030388
AMA Style
Elneel L, Zitouni MS, Mukhtar H, Galli P, Al-Ahmad H. Exploring Key Aspects of Sea Level Rise and Their Implications: An Overview. Water. 2024; 16(3):388. https://doi.org/10.3390/w16030388
Chicago/Turabian StyleElneel, Leena, M. Sami Zitouni, Husameldin Mukhtar, Paolo Galli, and Hussain Al-Ahmad. 2024. "Exploring Key Aspects of Sea Level Rise and Their Implications: An Overview" Water 16, no. 3: 388. https://doi.org/10.3390/w16030388
Note that from the first issue of 2016, this journal uses article numbers instead of page numbers. See further details here.