
Optimization of Forest and Grass Vegetation Distribution in the Aksu River Basin by Water Resources Carrying Capacity


Abstract
1. Introduction
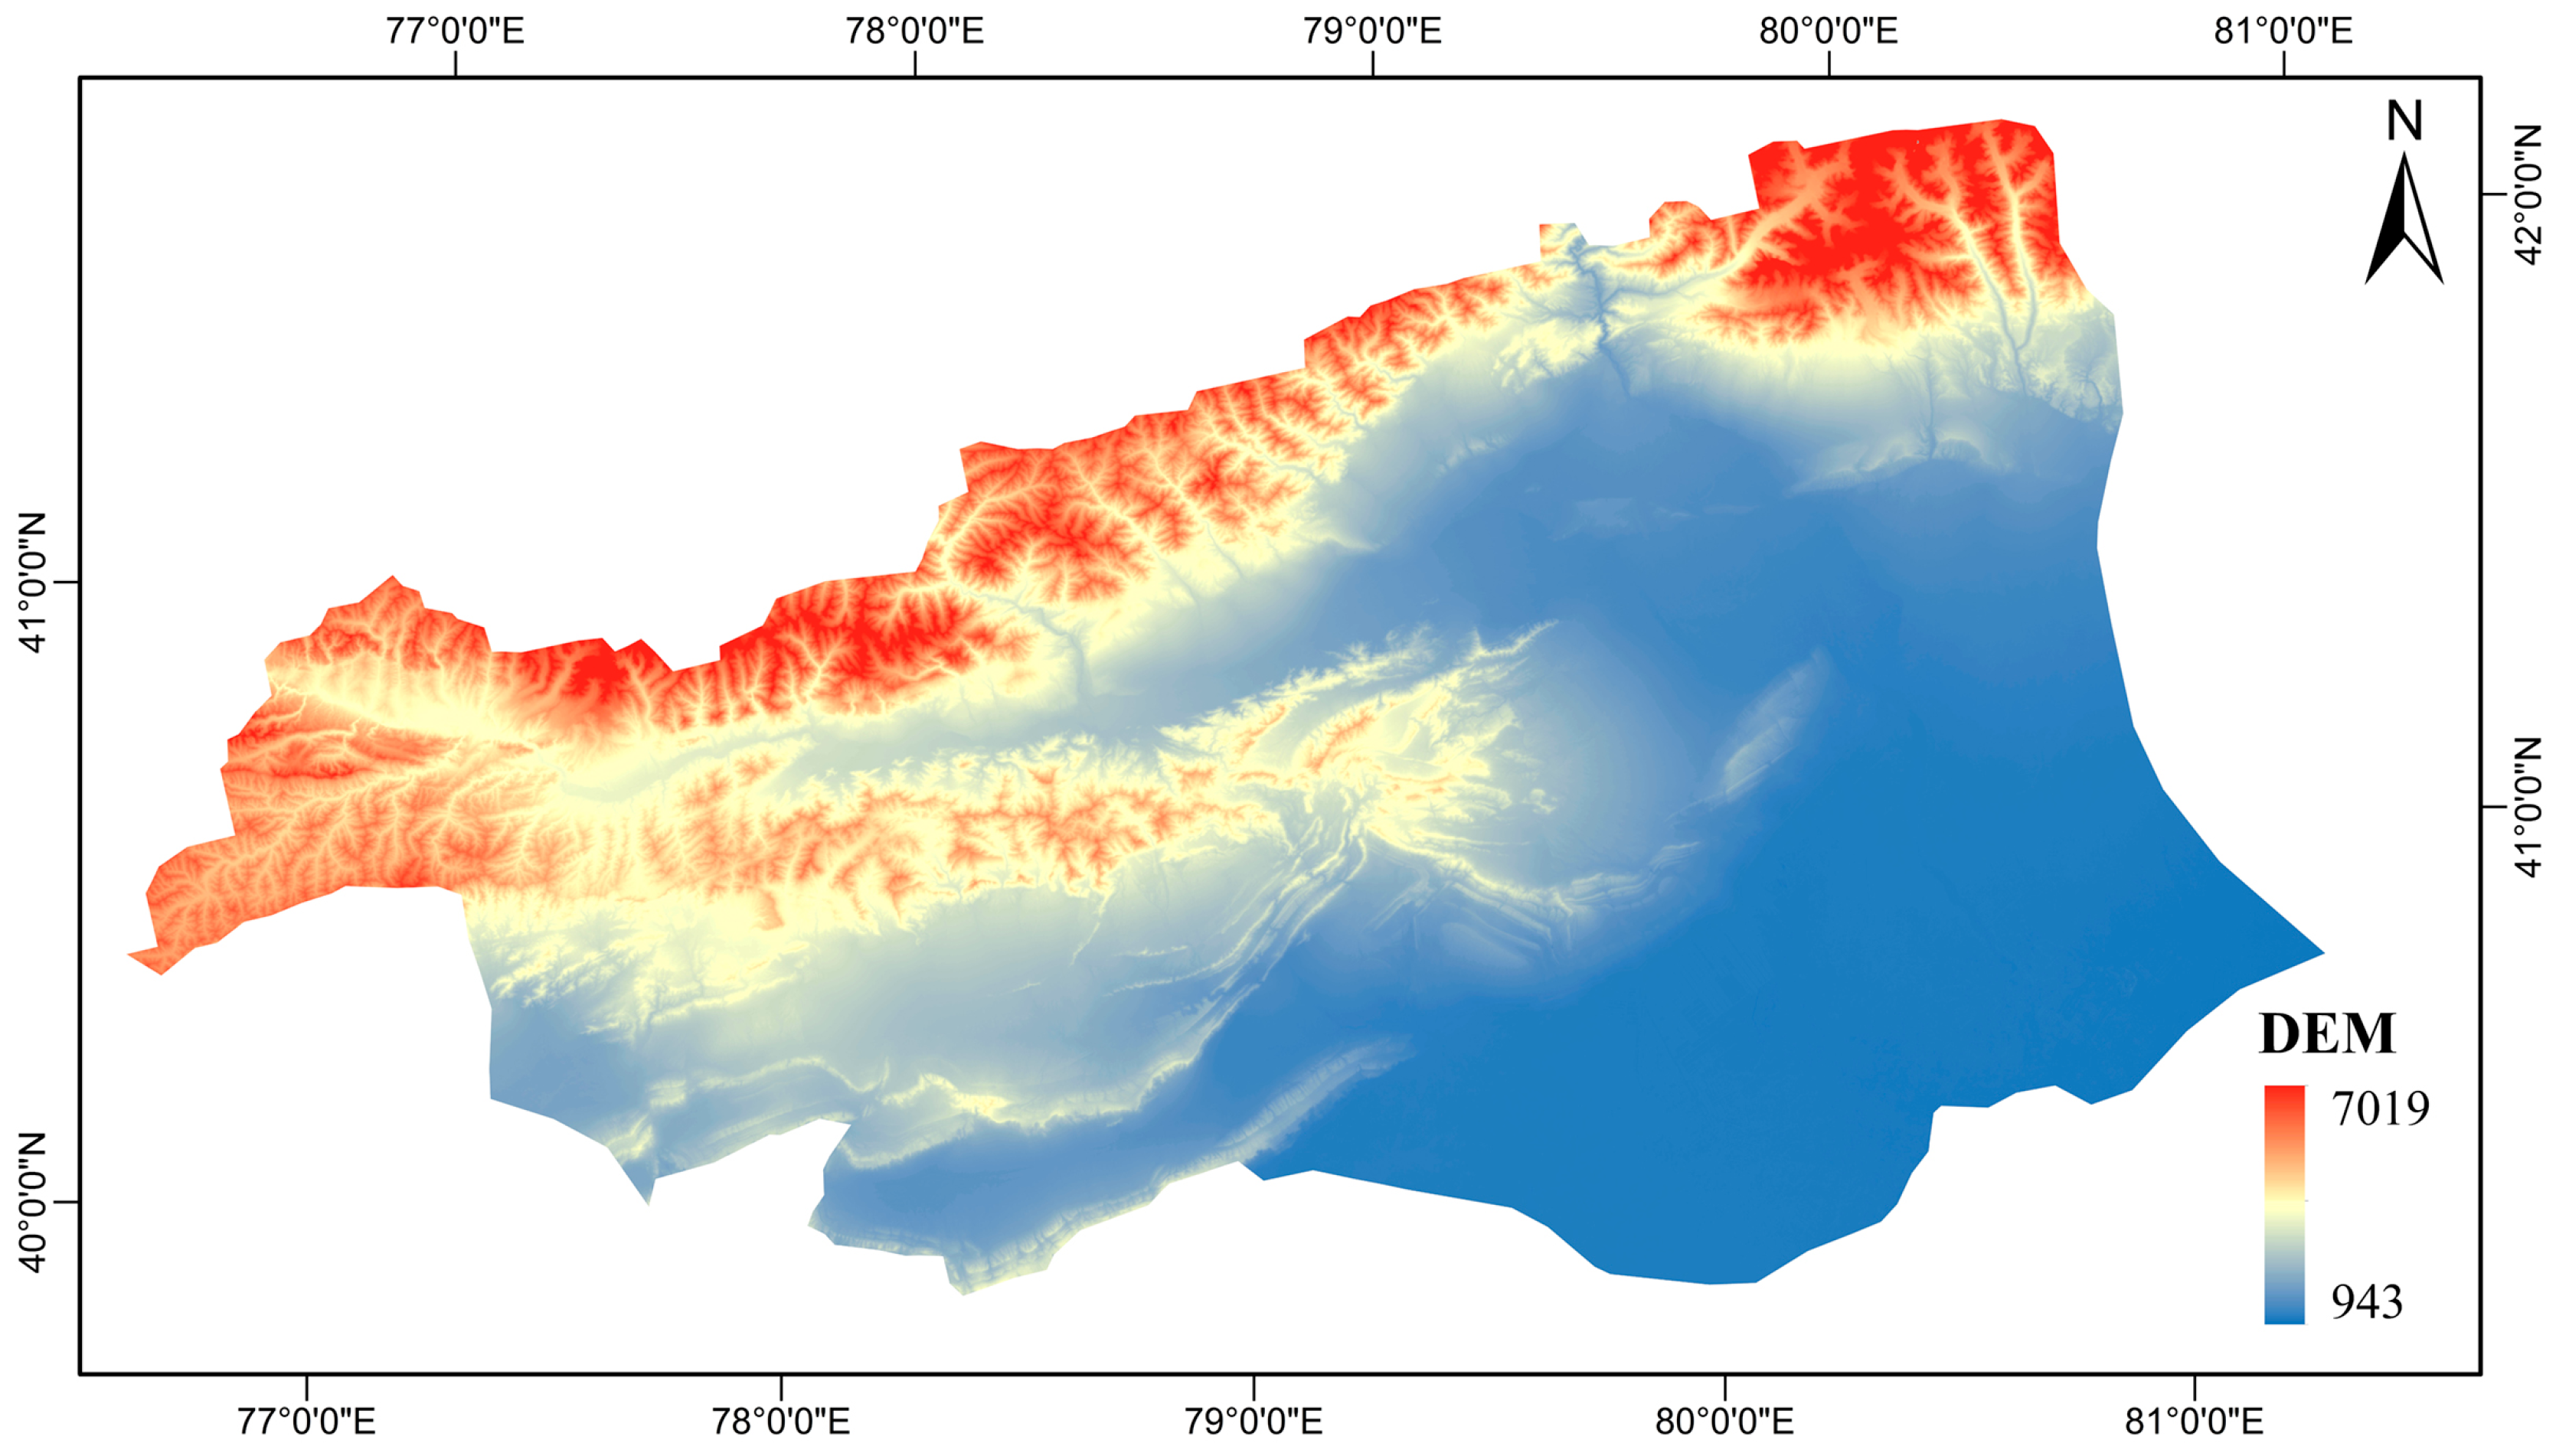
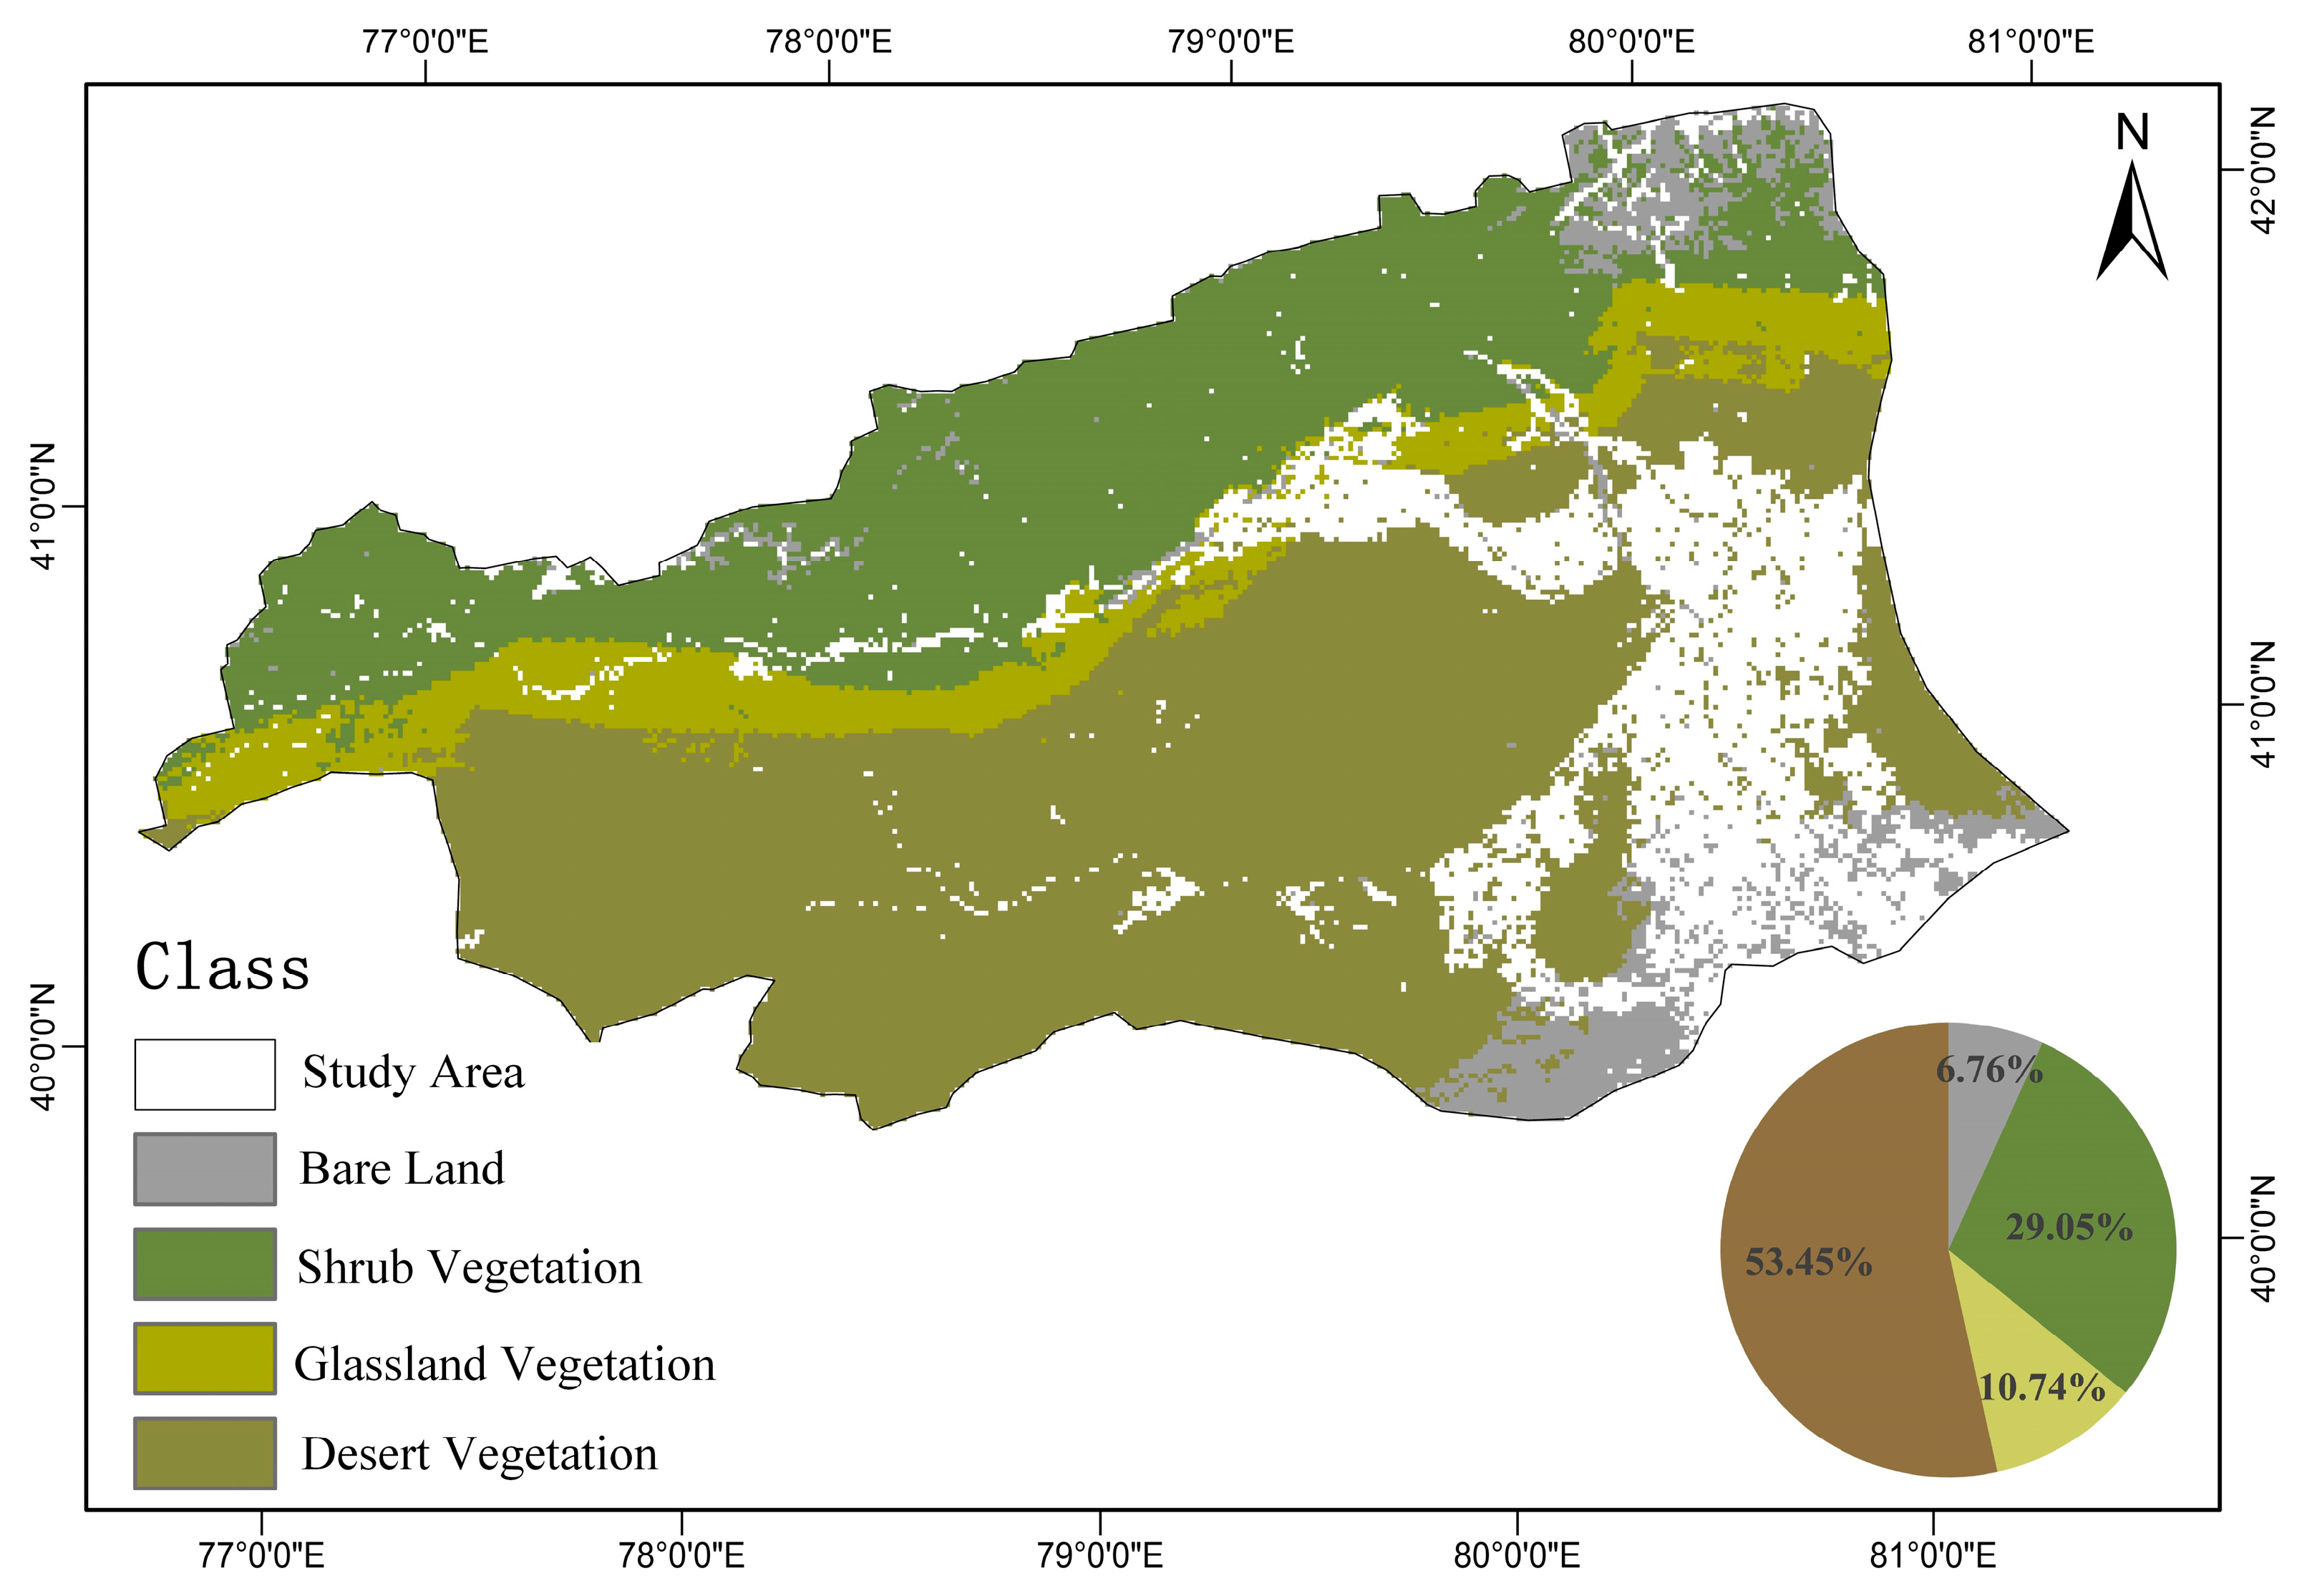
2. Study Area
3. Data and Methodology
3.1. Data
- (1)
- Precipitation Data: The data were collected from the Data Center for Resource and Environmental Science, Chinese Academy of Sciences (http://www.resdc.cn, accessed on 11 October 2022), mainly including daily observations of meteorological element stations in Xinjiang from 1990 to 2020, and the annual values of each meteorological element station were obtained by summing the station data for each year. The annual total precipitation raster data were then generated at a spatial resolution of 1 km using Anusplin interpolation.
- (2)
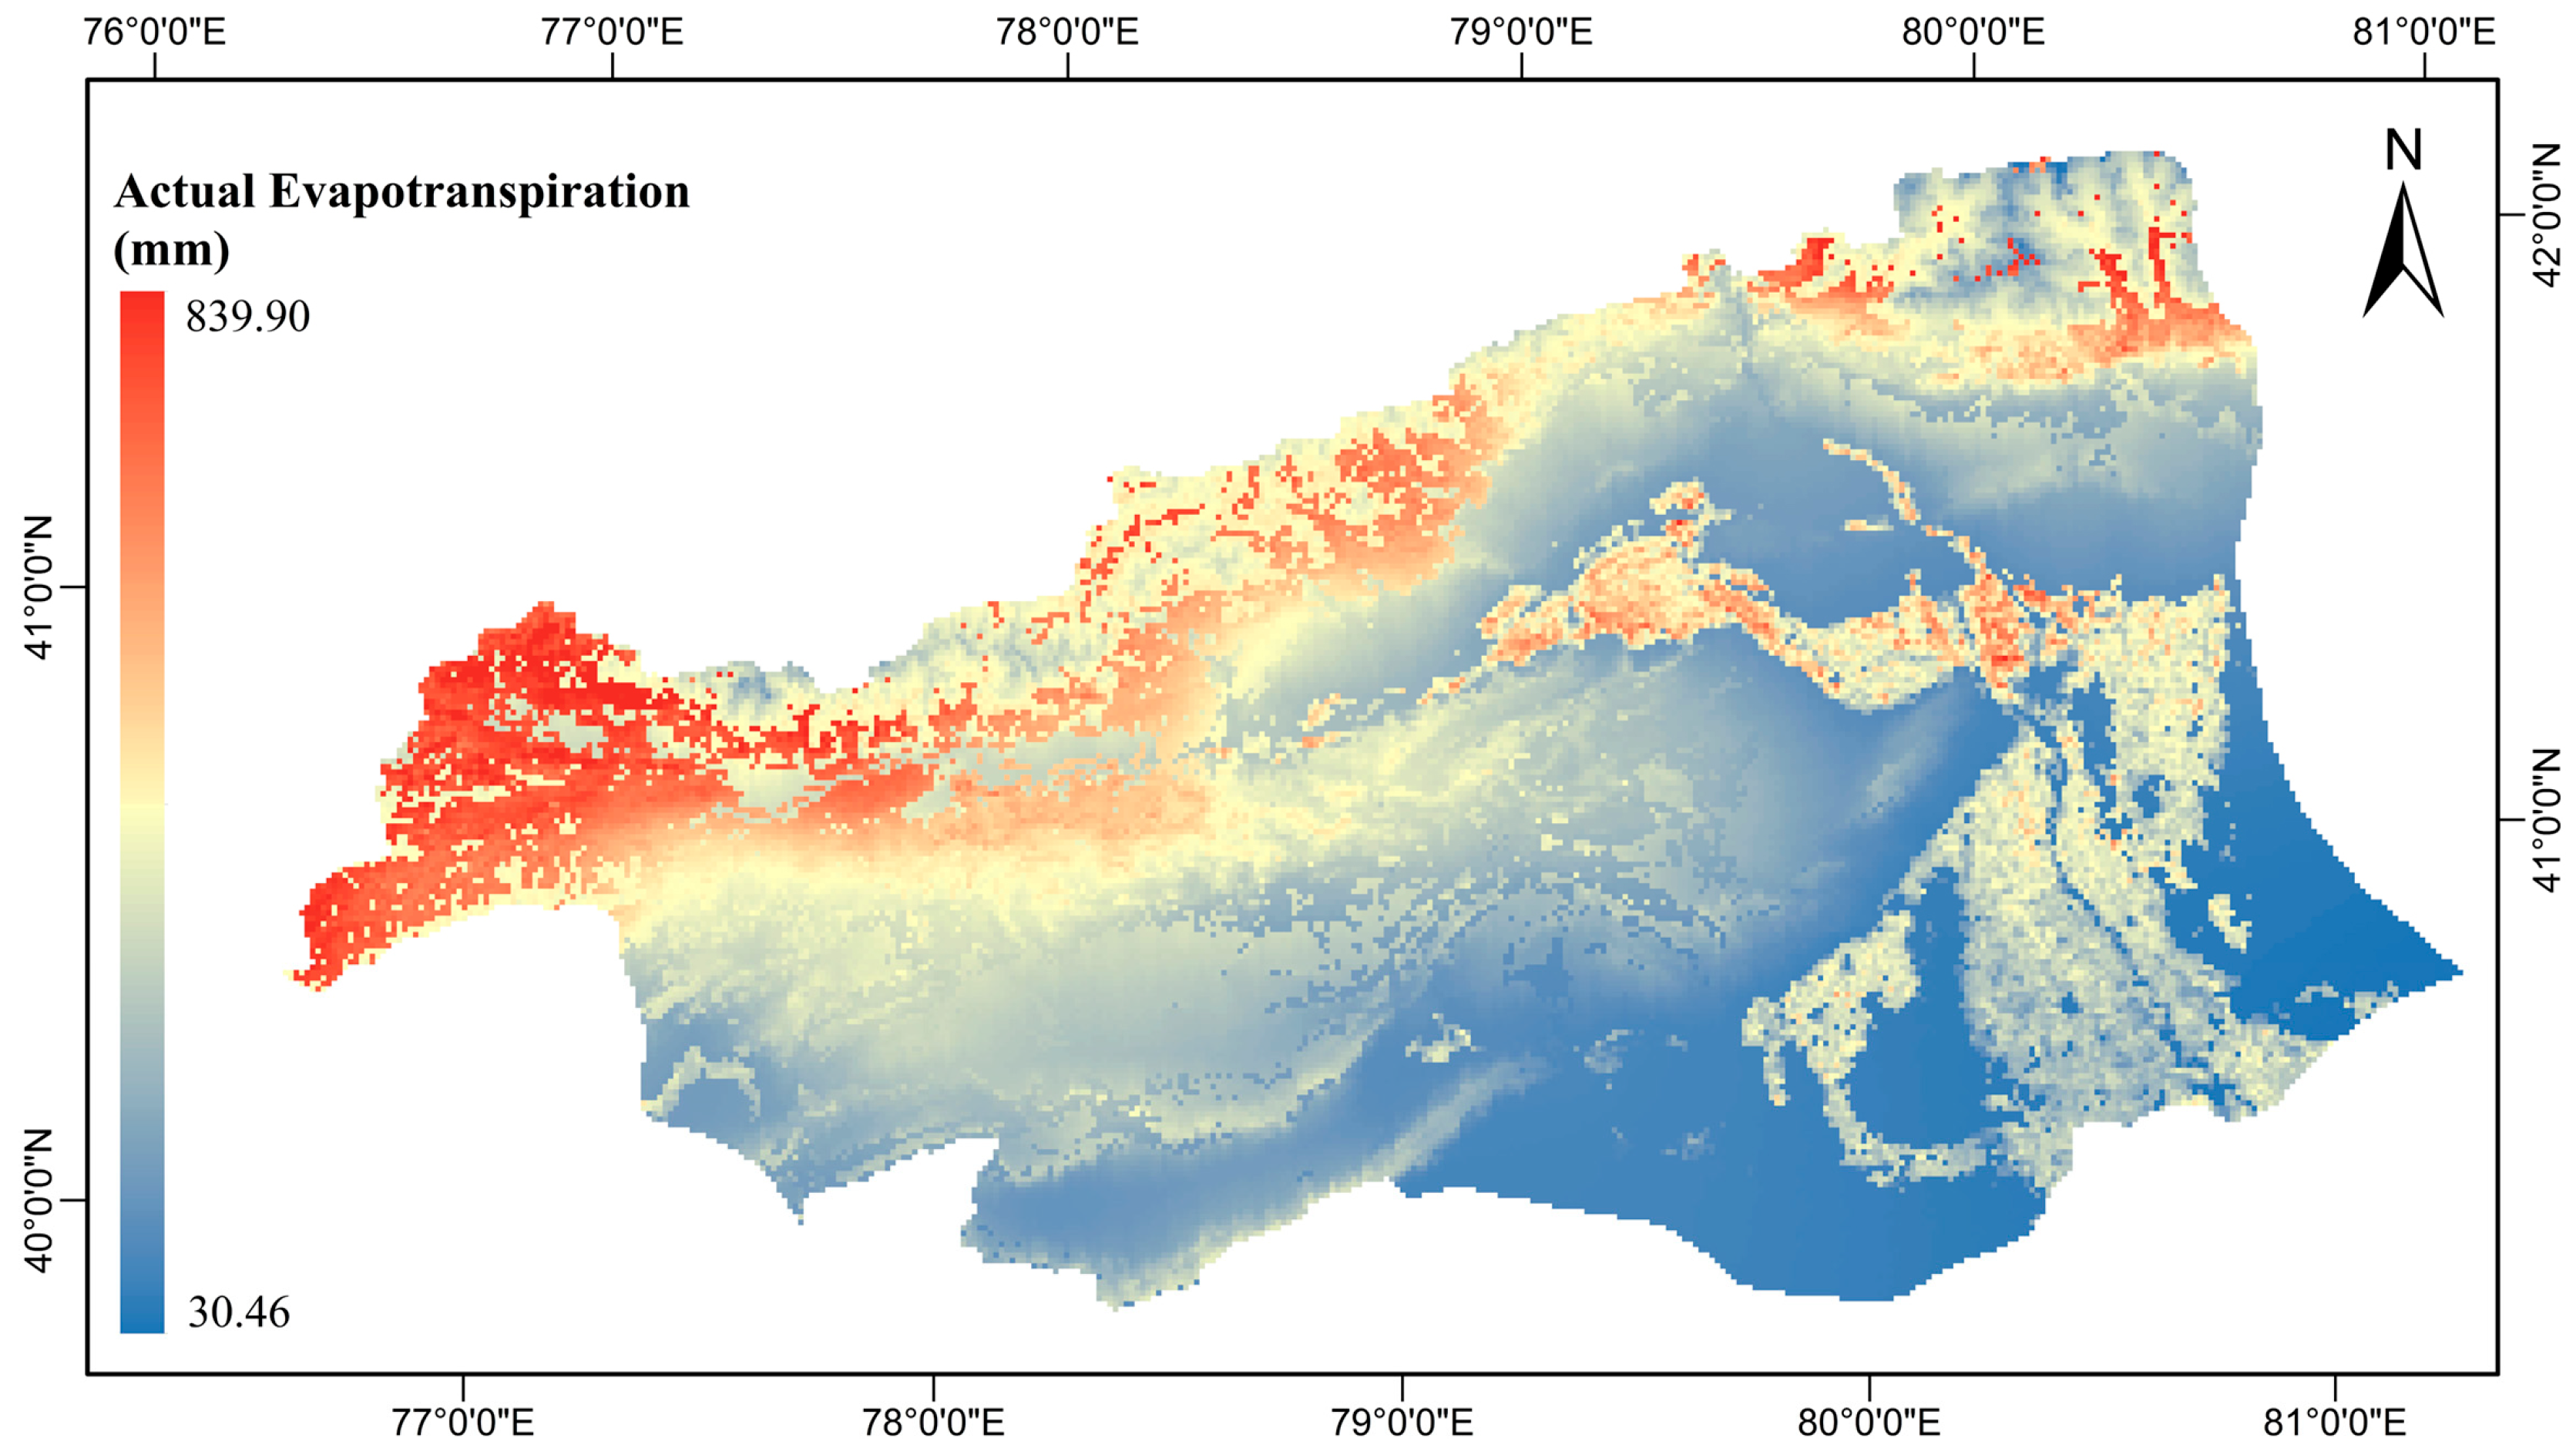
- Potential Evapotranspiration Data: the data were obtained from the MODIS16A2 PET dataset (https://search.earthdata.nasa.gov, accessed on 15 October 2022) for the period from 1990 to 2020 with a spatial resolution of 500 m, which was adjusted to 1 km by resampling and a temporal resolution of 1 year.
- (3)
- Digital Elevation Model (DEM) data: ASTER GDEM 30 M resolution digital elevation data were collected from the geospatial data cloud (http://www.gscloud.cn/, accessed on 17 October 2022), with a spatial resolution of 30 m.
- (4)
- Soil Data: the data include soil type, texture, and soil depth data, all from the Data of the second National Land Survey in 2009 and the Harmonized World Soil Database (HWSD) (https://www.fao.org/soils-portal/en/, accessed on 27 October 2022), with a spatial resolution of 1 km.
- (5)
- Land Use and 1:1 million Chinese Vegetation Zonation Data: the spatial resolution of the data was 1 km from the Data Center for Resources and Environmental Sciences, Chinese Academy of Sciences (http://www.resdc.cn, accessed on 3 November 2022), from which the land use data was downloaded from 2020.
- (6)
- Xinjiang Statistical Yearbook Data: the data for 2020 were derived from the Xinjiang Uygur Autonomous Region Bureau of Statistics (https://tjj.xinjiang.gov.cn, accessed on 27 October 2022), including information on agricultural water consumption, population numbers, domestic water consumption, agricultural land area, industrial water consumption, GDP data, and other data by the region.
3.2. Research Methodology
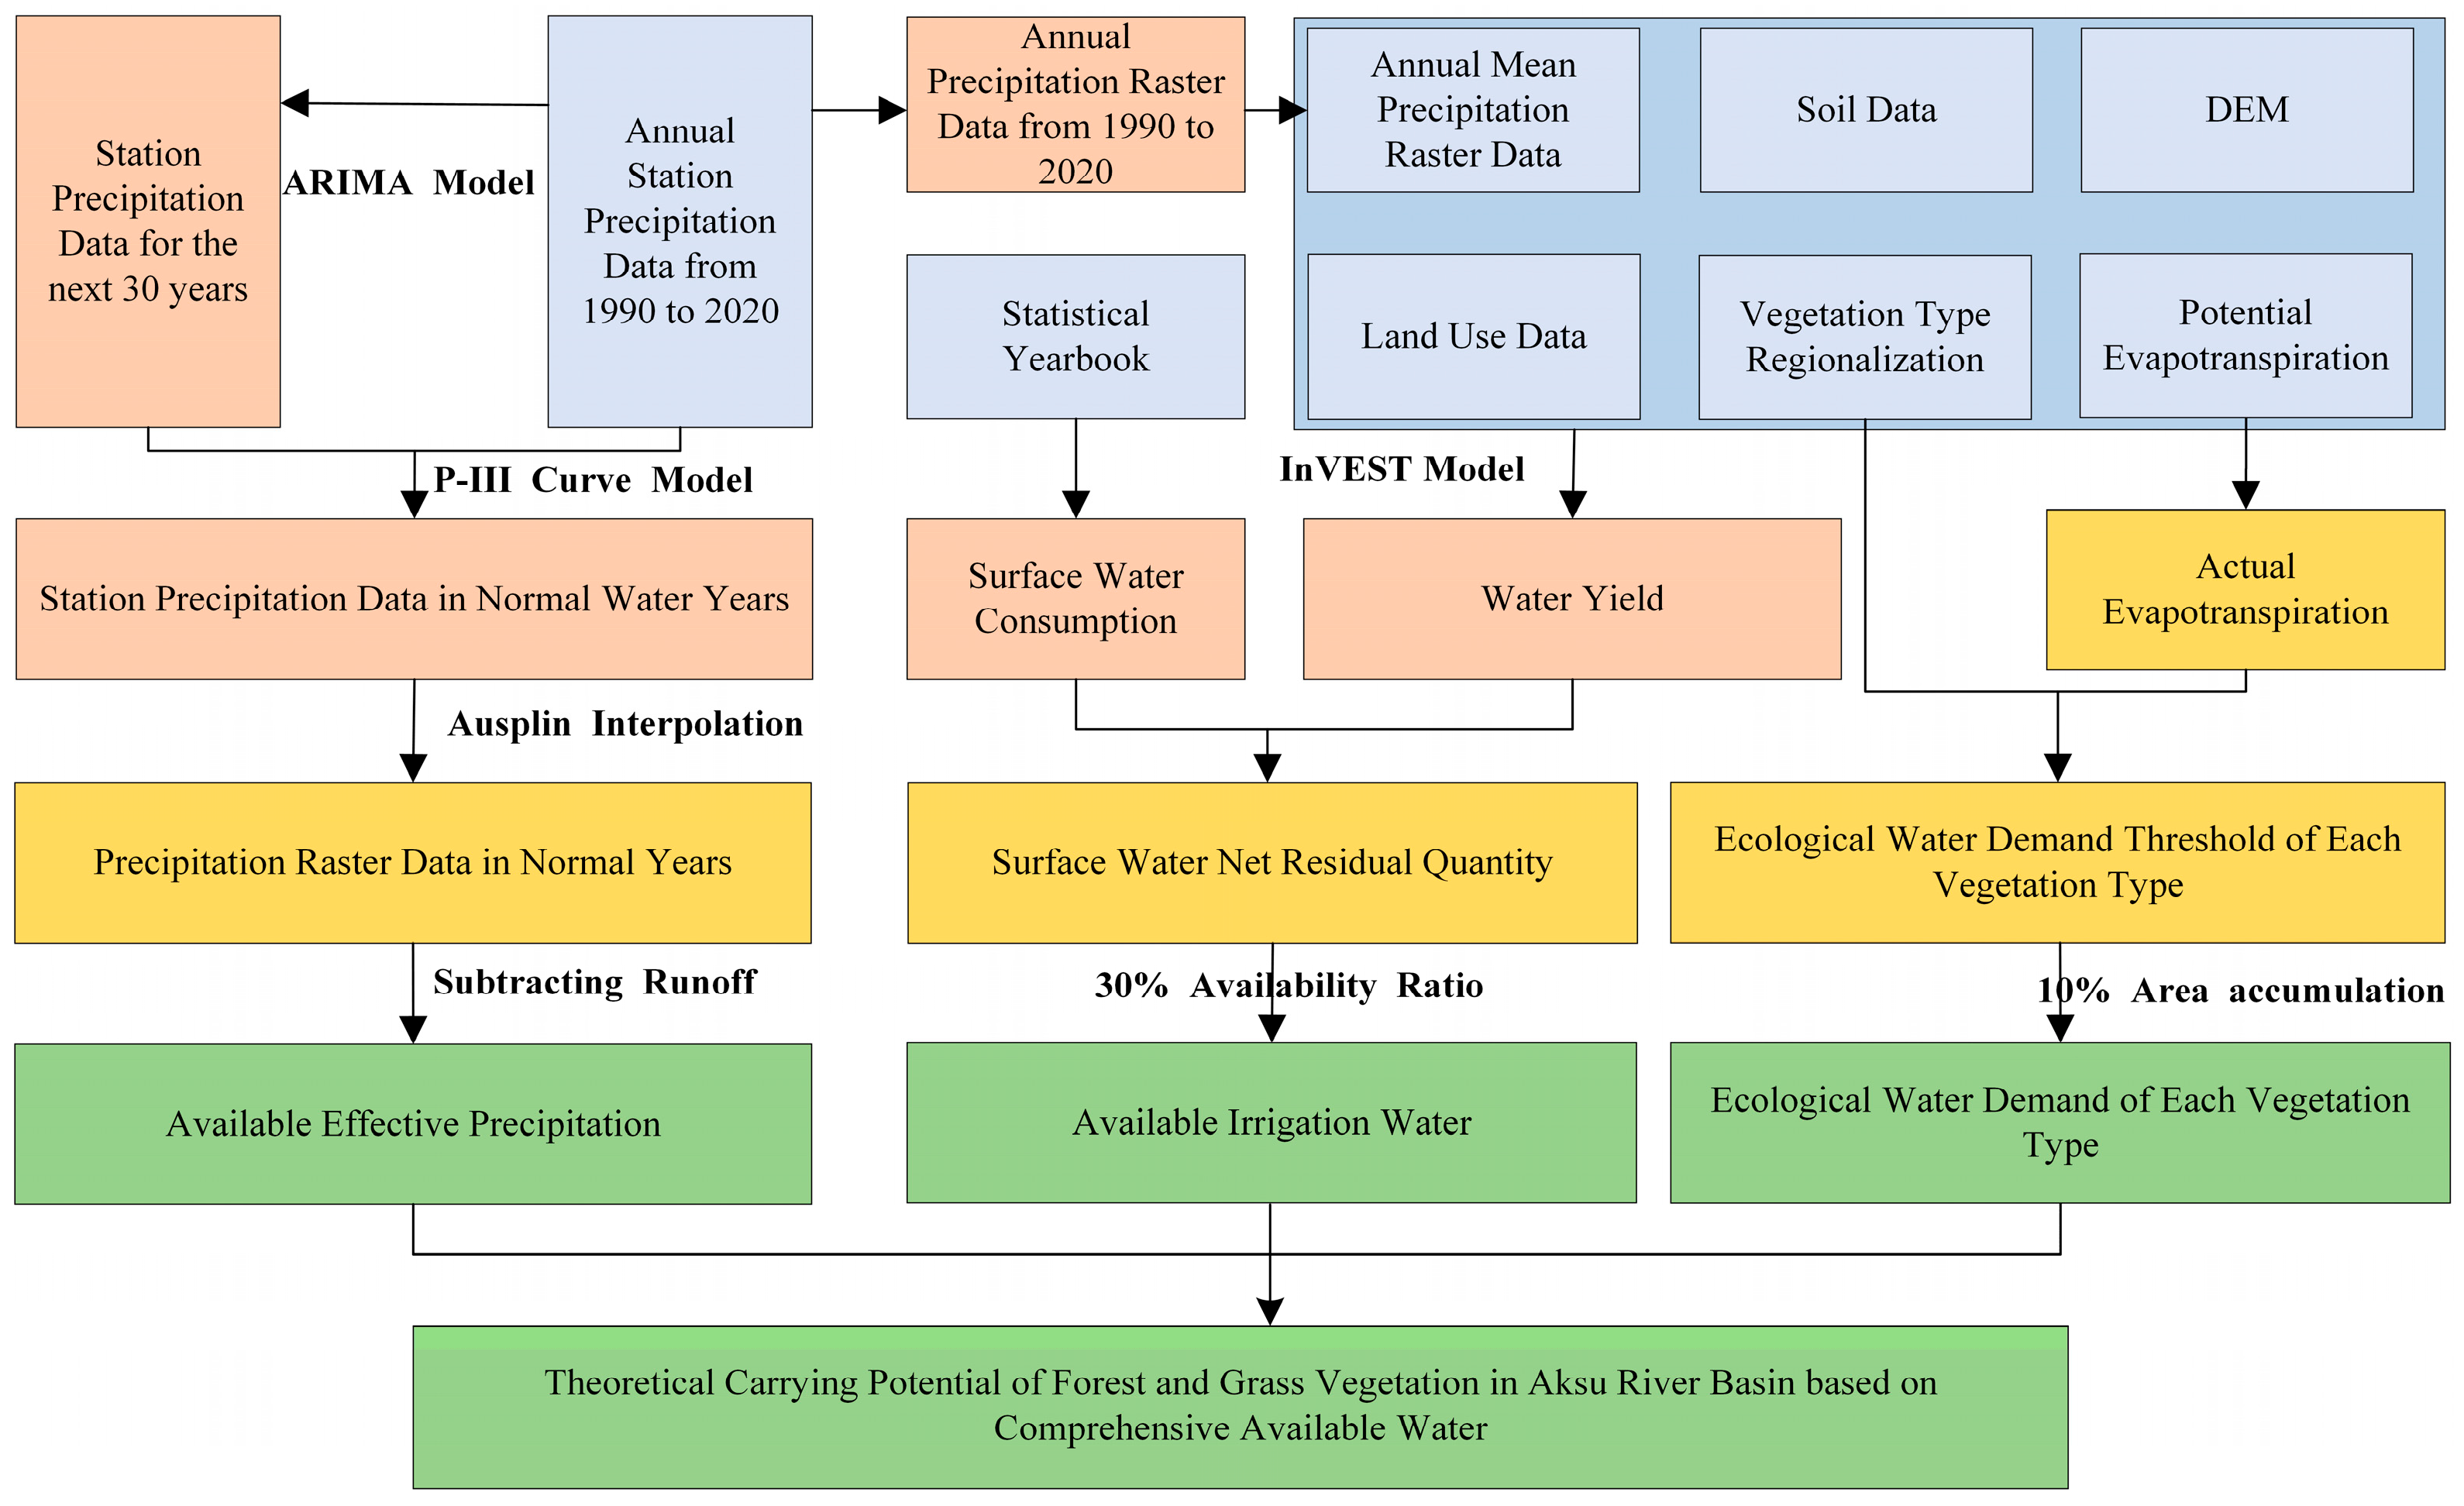
3.2.1. Method Overview
3.2.2. Calculation of the Available Effective Precipitation
3.2.3. Calculation of the Availability of Irrigation Water
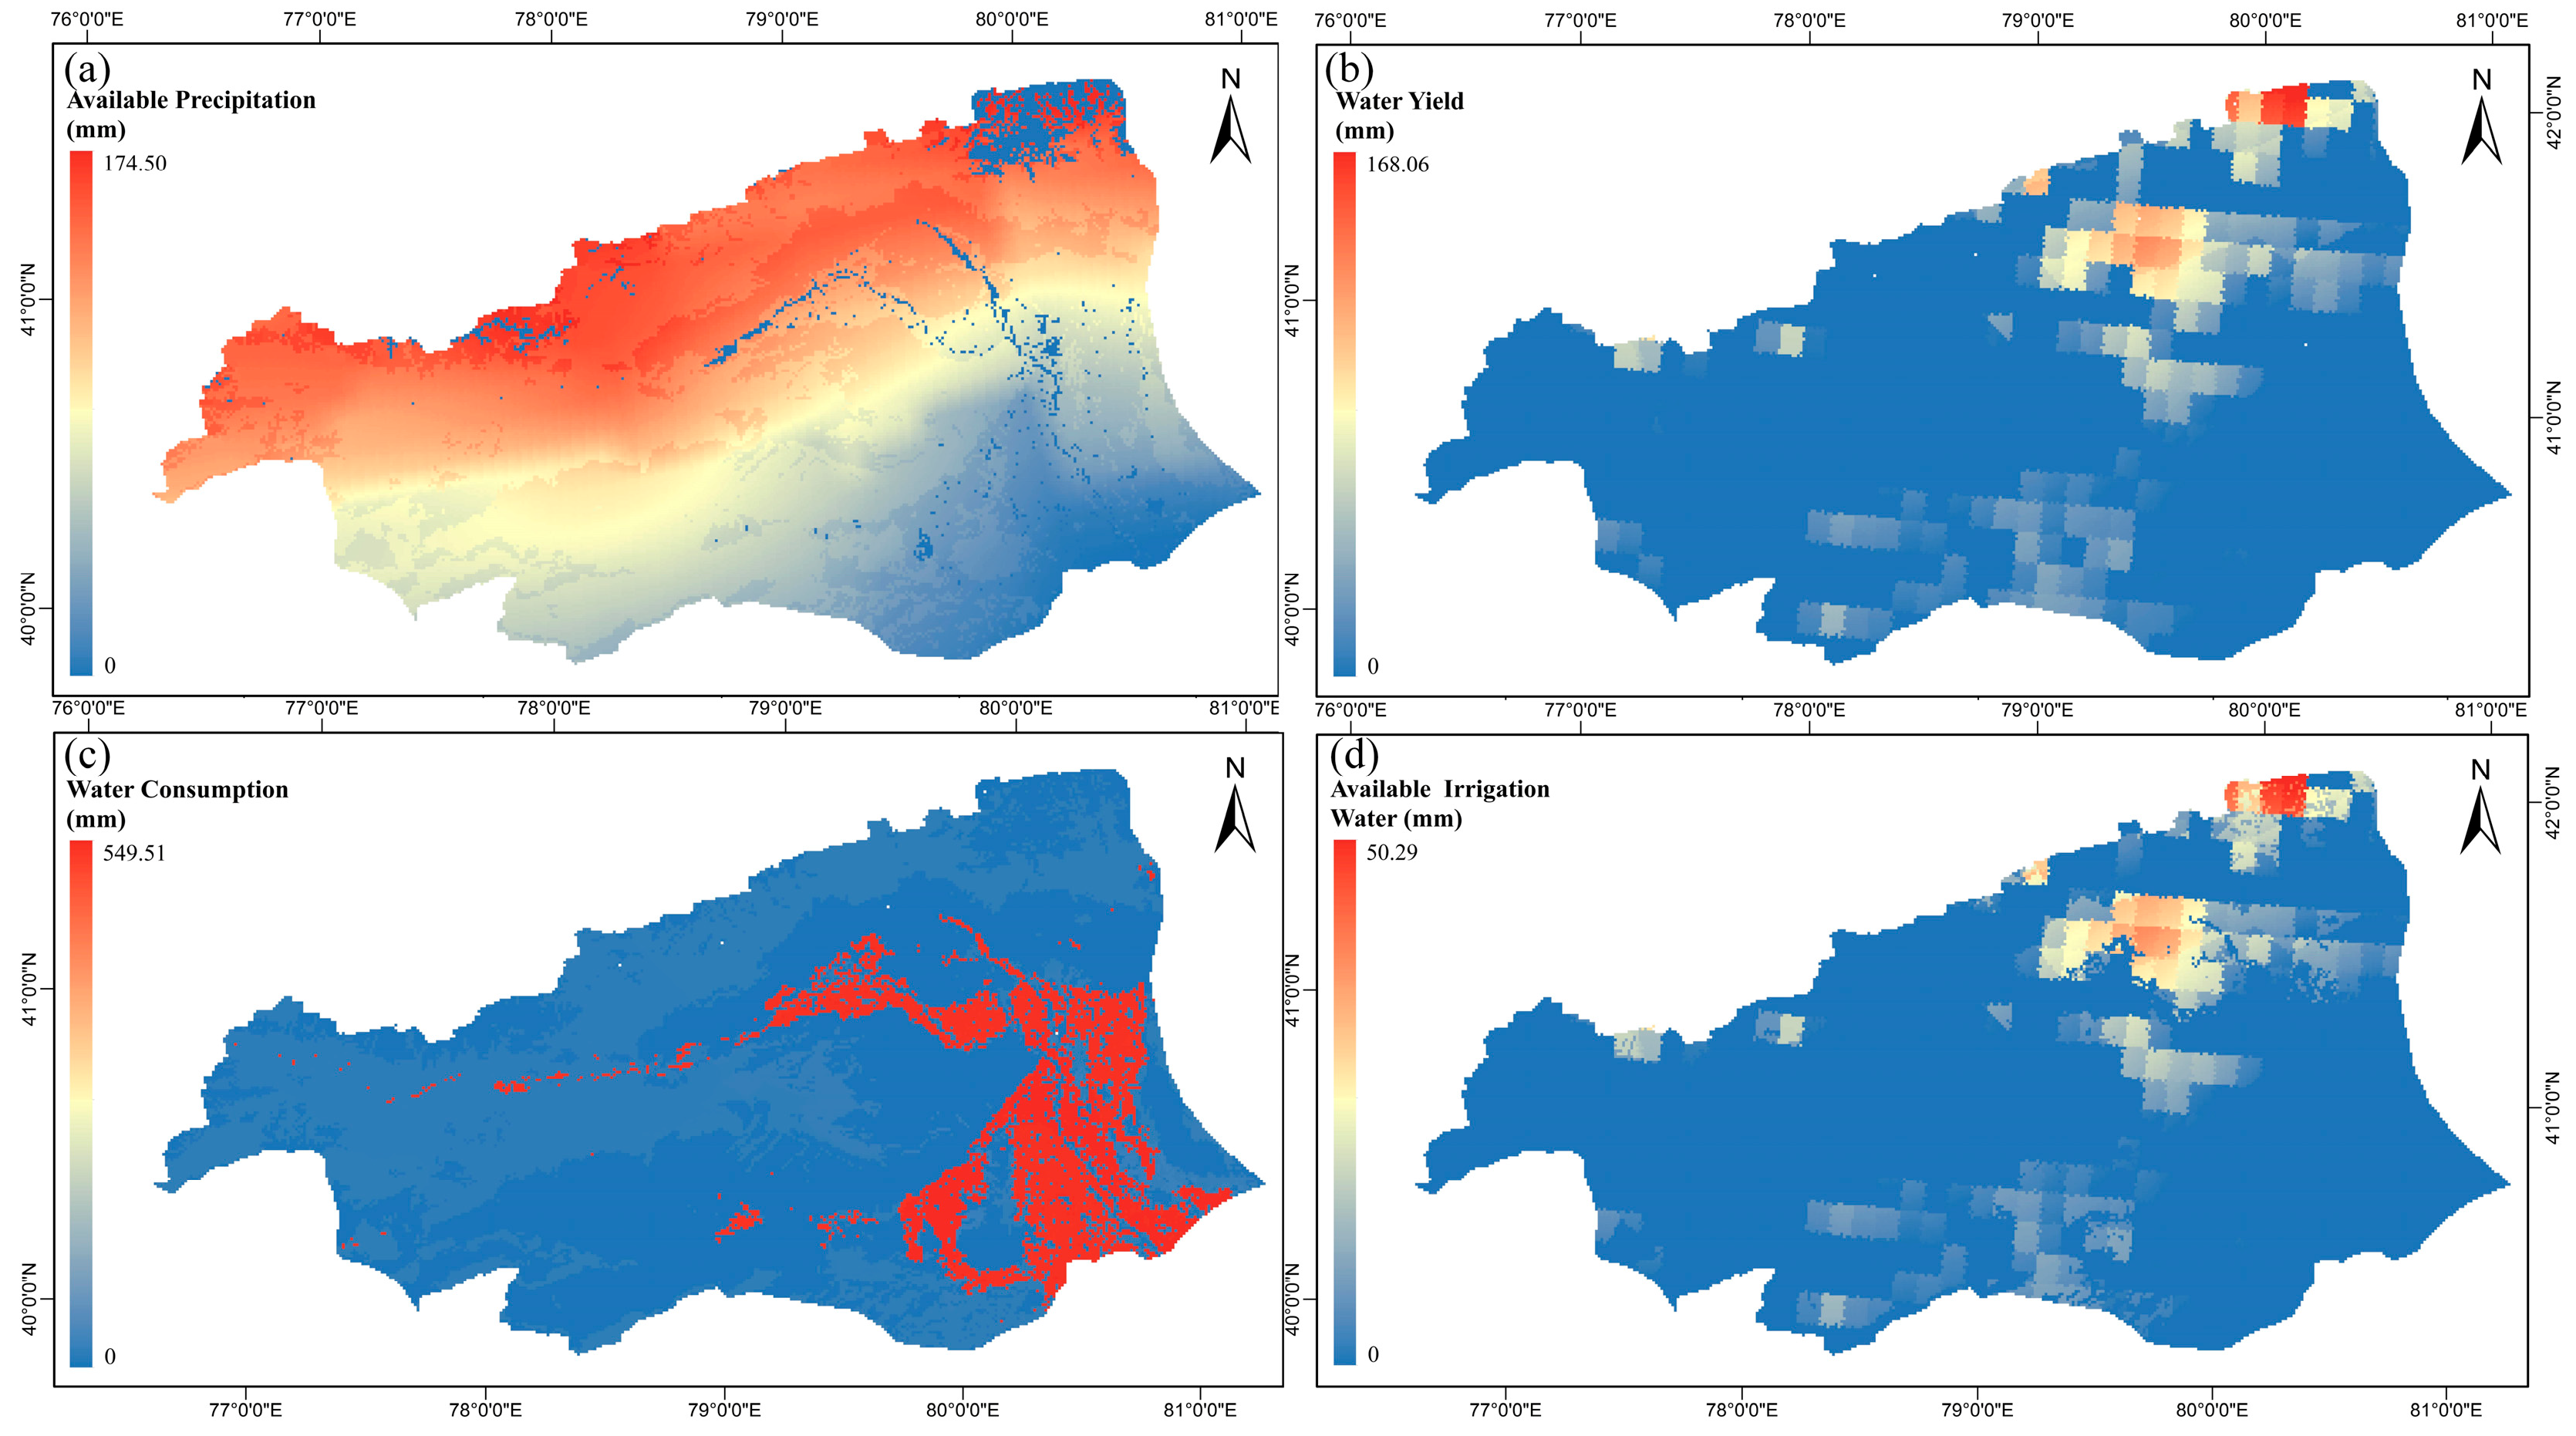
Water Yield
Water Consumption
Rationalization of Surface Water Resource Estimates
3.2.4. Definition of the Ecological Water Demand Threshold for Vegetation
4. Results
4.1. Available Effective Precipitation
4.2. Availability of Irrigation Water
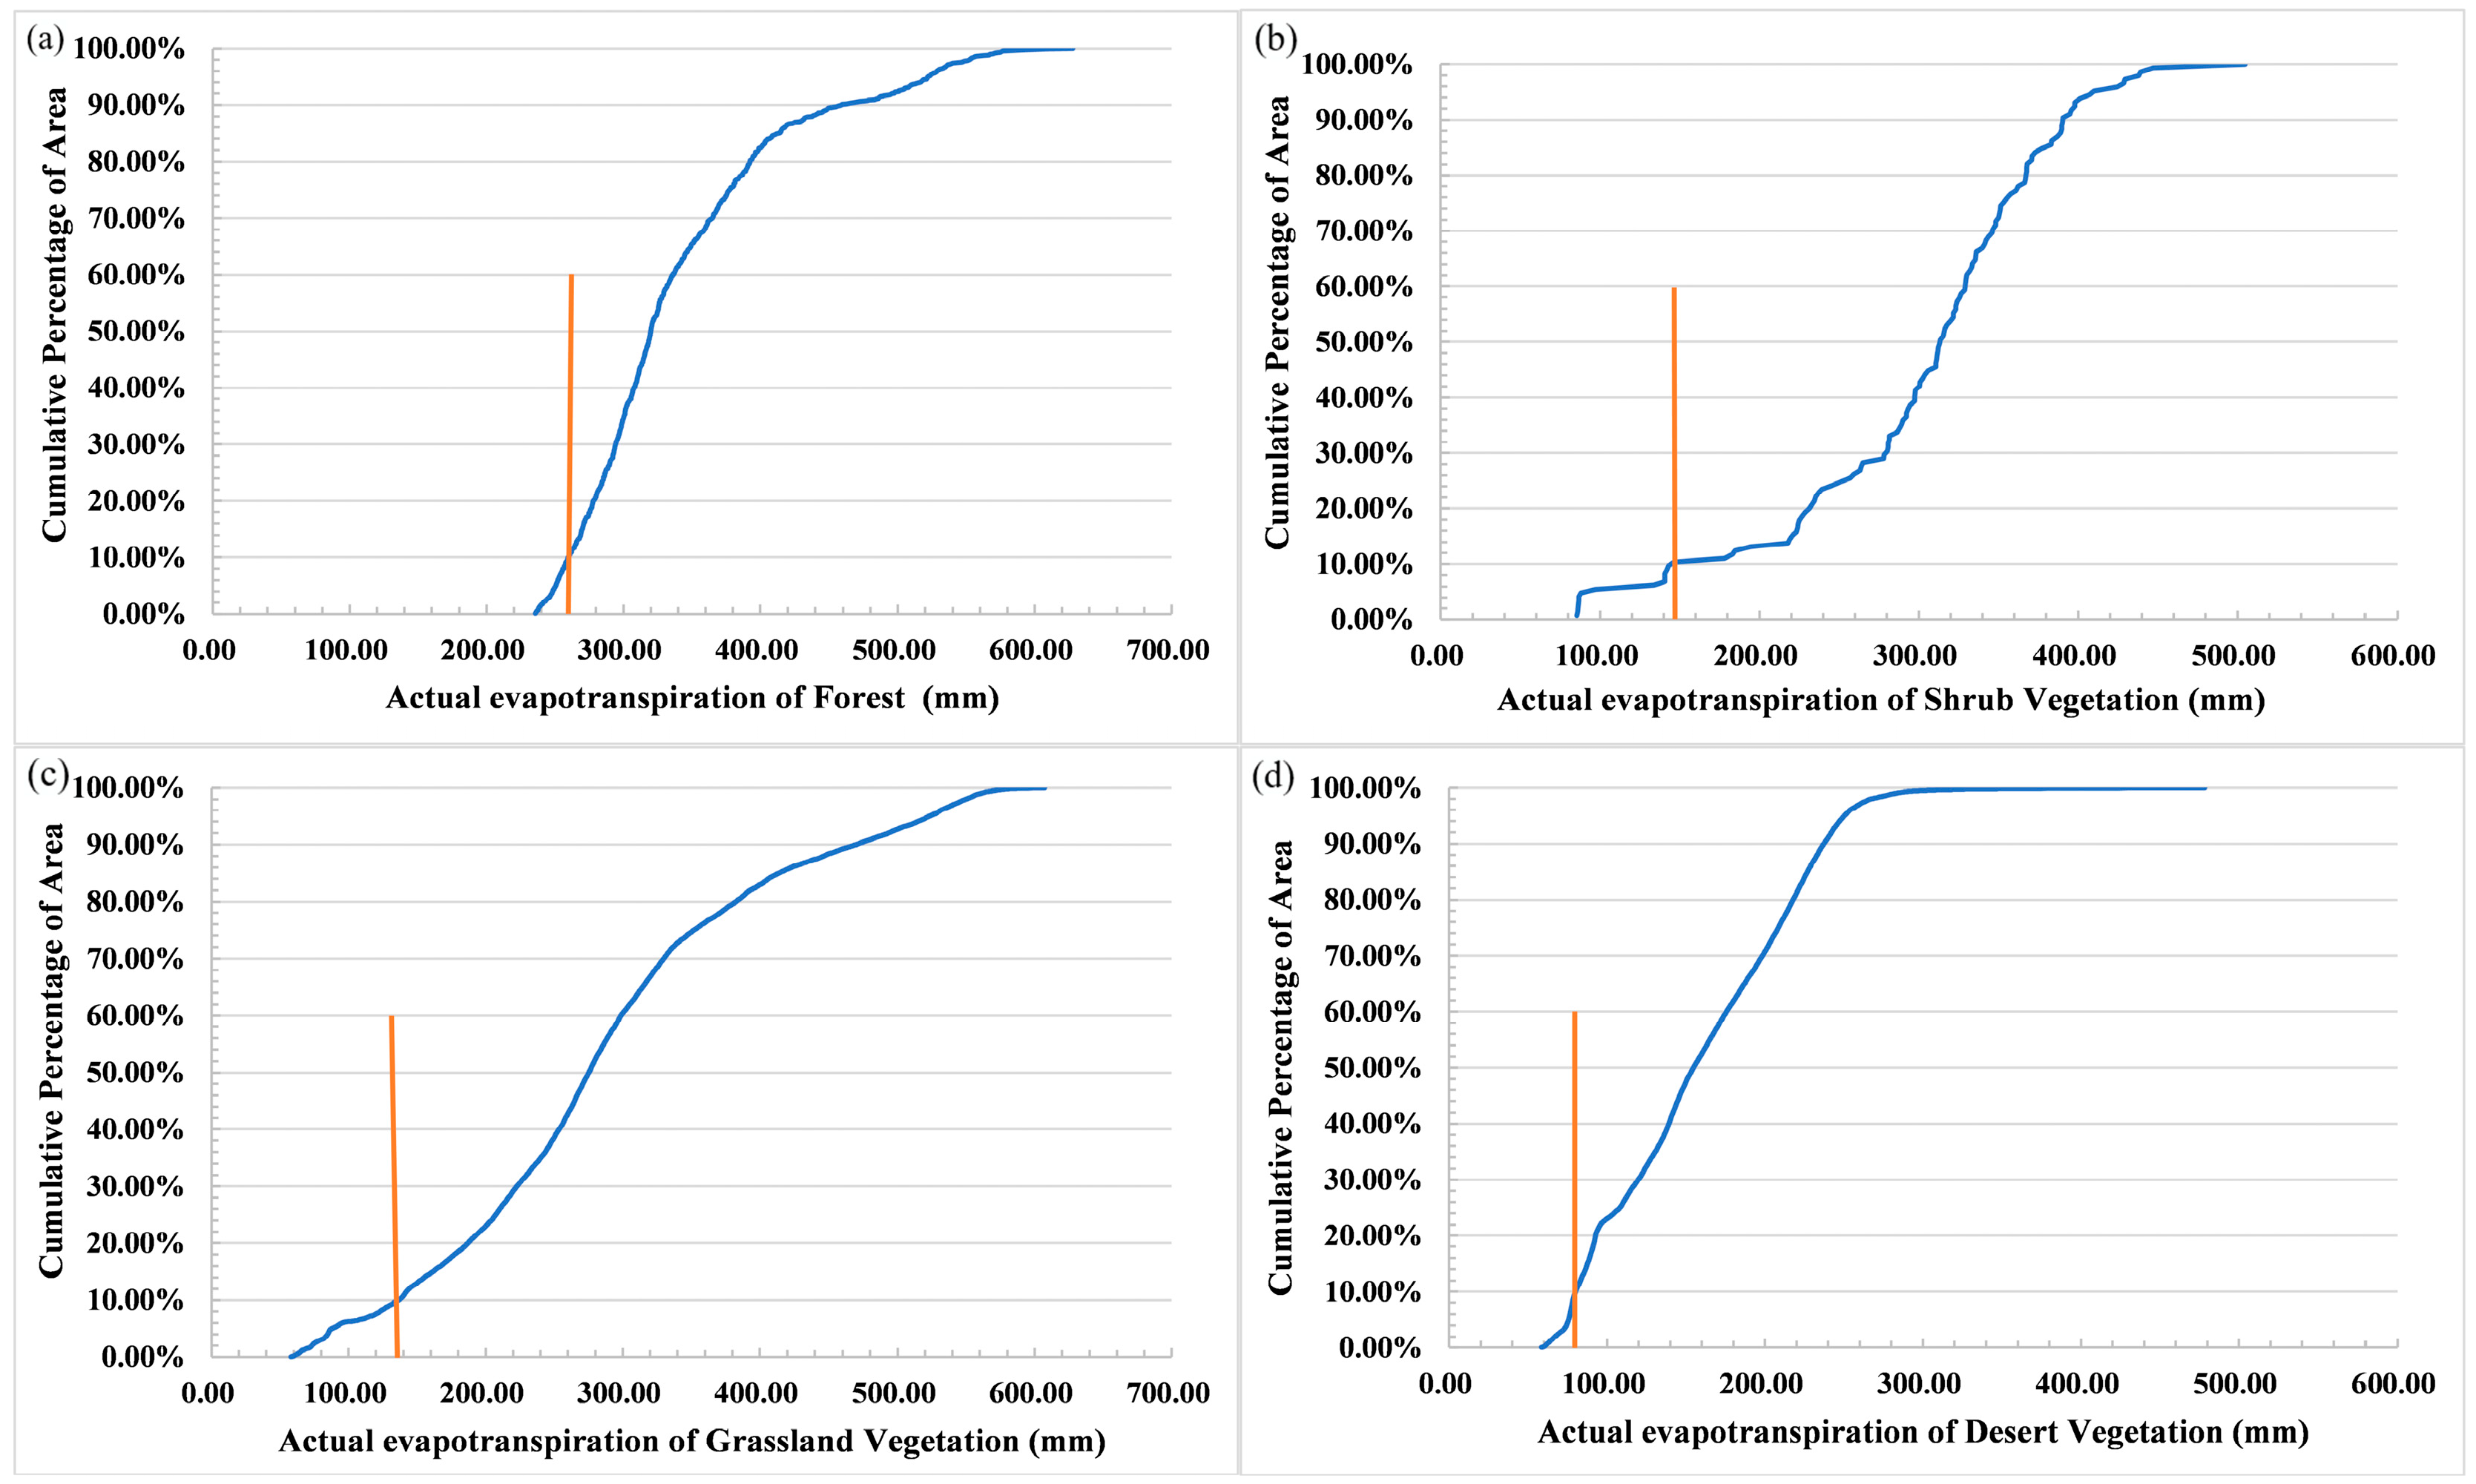
4.3. Threshold of Ecological Water Demand for Vegetation
4.4. Distribution of Vegetation Theoretically Carried by Water Resources
5. Discussion
5.1. Water Yield Analysis
5.2. Ecological Water Demand of Vegetation
6. Conclusions
Author Contributions
Funding
Data Availability Statement
Acknowledgments
Conflicts of Interest
References
- Ma, Z.G.; Li, L.L.; Yang, R.T. Research status and analysis of resources and environment carrying capacity. China Agric. Resour. Reg. Plan. 2020, 41, 130–137. [Google Scholar]
- Zhao, Y.B.; Ni, Z.Y.; Ouyang, Y.; Chen, X.Y.; Wang, D.; Liu, J.J.; Liu, H. Research progress of eco-geological environment carrying capacity. Sediment. Geol. Tethyan Geol. 2022, 42, 529–541. [Google Scholar]
- Cao, J.; Wang, W.Q.; Zhang, X.P.; Zhang, Y.; Luo, Z.Q. Assessment of Coastal Zone Ecological Carrying Capacity—A Case Study of Haikou City. In Proceedings of the 2015 Joint International Mechanical, Electronic and Information Technology Conference (JIMET-15), Chongqing, China, 18–20 December 2015; Atlantis Press: Amsterdam, The Netherlands, 2015. ISSN 2352-538X. [Google Scholar]
- Chen, Y.; Cao, Y. The Application of EF Analysis in Quantitative Assessment of Sustainable Development. In Proceedings of the 2017 International Conference on Applied Mathematics, Modelling and Statistics Application (AMMSA 2017), Paris, France, 21–22 May 2017; Atlantis Press: Amsterdam, The Netherlands, 2017. ISSN 1951-6851. [Google Scholar]
- Wei, C.X.; Wang, X.; Li, C.H.; Liu, Q.; Cai, Y.P. Research progress on spatial carrying capacity of waters. J. Water Resour. Water Eng. 2022, 19, 54–60. [Google Scholar]
- Martire, S.; Castellani, V.; Sala, S. Carrying capacity assessment of forest resources: Enhancing environmental sustainability in energy production at local scale. Resour. Conserv. Recycl. 2015, 94, 11–20. [Google Scholar] [CrossRef]
- Guo, Z.S. Study on Carrying Capacity of Soil Moisture and Vegetation in Semi-Arid Loess Hilly Region. Ph.D. Thesis, Northwest A&F University, Xianyang, China, 2004. [Google Scholar]
- Qu, Z.X.; Wu, Y.S.; Wang, H.X. Plant Ecology; Higher Education Press: Beijing, China, 1983; pp. 152–179. [Google Scholar]
- Li, X.; Guli, G.; Yu, T.; Yi, H.M.; Tu, H.Y. Temporal and spatial dynamic monitoring and driving factors analysis of ecological carrying capacity in five Central Asian countries. J. Univ. Chin. Acad. Sci. 2023, 40, 474–485. [Google Scholar]
- Zeng, P.; Sun, F.; Liu, Y.; Che, Y. Future river basin health assessment through reliability-resilience-vulnerability: Thresholds of multiple dryness conditions. Sci. Total Environ. 2020, 741, 140395. [Google Scholar] [CrossRef] [PubMed]
- Fan, D.Z.; Mei, X.M.; Li, P.; Zhang, X.M.; Zhang, G.J. Ecological and hydrological equilibrium in Ningxia region vegetation carrying capacity simulation. J. Soil Water Conserv. 2023, 5, 166–172. [Google Scholar]
- Jin, Y.Y.; Jin, X.M.; Li, C. Applying supporting-pressuring coupling curve to the evaluation of urban land carrying capacity: The case study of 32 cities in Zhejiang province. Geogr. Res. 2018, 37, 1087–1099. [Google Scholar]
- Boris, Z. Optimal stand density: A solution. Can. J. For. Res. 2004, 34, 846–854. [Google Scholar]
- Price, D. Carrying Capacity Reconsidered. Popul. Environ. 1999, 21, 5–26. [Google Scholar] [CrossRef]
- Guo, Z.S.; Shao, M.G. Application of the research results of soil water and vegetation carrying capacity in practice. J. Nat. Resour. 2009, 24, 2187–2193. [Google Scholar]
- Jia, S.M.; Du, L.N.; Feng, H.; Zhang, Q.; Liu, X. Comprehensive evaluation of eco-geological environment quality in ecological conservation area of Daqing River Basin in Beijing. Urban Geol. 2020, 15, 125–136. [Google Scholar]
- Wang, W.Y.; Zhang, Q.; Yang, F.L. Study on minimum effective precipitation and precipitation conversion in semi-arid Yuzhong region. Acta Meteorol. Sin. 2013, 71, 952–961. [Google Scholar]
- Lai, X.Q.; Wang, J.L.; Zhang, F.H.; Li, L.H.; Zhang, W. Discussion and prospect of oasis research in China. Arid Zone Res. 2017, 34, 663–668. [Google Scholar]
- Xu, W.; Zhou, C.; Liu, B.; Wang, D.X.; Zhao, X.Z.; Zhu, X.T.; Lin, M.Z. Study on water resources carrying capacity in zhuanglang river basin. Environ. Monit. Assess. 2022, 194, 390. [Google Scholar] [CrossRef] [PubMed]
- Yang, G.; Li, F.D.; Chen, D.; He, X.L.; Xue, L.Q.; Long, A.H. Assessment of changes in oasis scale and water management in the arid manas river basin, north western China. Sci. Total Environ. 2019, 691, 506–515. [Google Scholar] [CrossRef]
- Francisco, C.C.; Ana, E.S.; Clara, S.D.B.; David, M.C. A Forecast Model Applied to Monitor Crops Dynamics Using Vegetation Indices (NDVI). Appl. Sci. 2021, 11, 1859. [Google Scholar]
- Hong, G.Y. Characteristics of Transpiration Water Consumption and Vegetation Carrying Capacity of Artificial Forest Land in Mu Us Sandy Land of Poplar and Willow. Ph.D. Thesis, Inner Mongolia Agricultural University, Inner Mongolia, China, 2021. [Google Scholar]
- Wang, Y.R. Vegetation Optimal Allocation in Diengjiagou Watershed Based on Soil Water Vegetation Carrying Capacity. Master’s Thesis, Chinese Academy of Forestry, Beijing, China, 2016. [Google Scholar]
- Li, X.R.; Zhang, Z.S.; Tan, H.J.; Gao, Y.H.; Wang, X.P. Ecological restoration and recovery in the wind-blown sand hazard areas of northern China: Relationship between soil water and carrying capacity for vegetation in the Tengger Desert. Sci. China Life Sci. 2014, 57, 539–548. [Google Scholar] [CrossRef]
- Zhang, W.W.; Guo, Z.S.; Ning, T.; Bao, D.M. Effects of Caragana density on soil moisture and Caragana growth in semi-arid Loess hilly region. Acta Ecol. Sin. 2015, 35, 725–732. [Google Scholar]
- Lu, C. Modeling Research on Water Use Efficiency and Carrying Capacity of Typical Soil and Water Conservation Forest Vegetation. Master’s Thesis, Northwest A&F University, Xi’an, China, 2021. [Google Scholar]
- Zhang, P. Optimization of Vegetation Allocation in Small Watershed in Loess Alpine Region. Master’s Thesis, Beijing Forestry University, Beijing, China, 2020. [Google Scholar]
- Guo, Z.S. Soil water carrying capacity for vegetation. Land Degrad. Dev. 2021, 32, 3801–3810. [Google Scholar] [CrossRef]
- Jia, X.; Shao, M.G.; Yu, D.X.; Zhang, Y.; Binley, A. Spatial variations in soil-water carrying capacity of three typical revegetation species on the Loess Plateau, China. Agric. Ecosyst. Environ. 2019, 273, 25–35. [Google Scholar] [CrossRef]
- Wang, L. Study on Ecological Carrying Capacity of Arid Barren Mountain Soil in Yimeng Mountain Area. Ph.D. Thesis, Shandong Agricultural Sciences, Shandong, China, 2022. [Google Scholar]
- Yu, X.W. Study on Vegetation Ecological Process and Its Response Mechanism to Hydrology in Semi-Arid Watershed. Ph.D. Thesis, Inner Mongolia University, Inner Mongolia, China, 2022. [Google Scholar]
- Zhai, J.Y.; Jin, X.; Jin, Y.X.; Fu, D. Impact on hydrological processes in continental river basin in arid zone vegetation restoration. Water Electr. Energy Sci. 2023, 9, 26–29+100. [Google Scholar]
- Zhu, L. Study on the Evolution Mechanism of Water Cycle in Semi-Arid Basin under Large-Scale Vegetation Restoration. Ph.D. Thesis, The Chinese Academy of Geological Sciences, Beijing, China, 2021. [Google Scholar]
- Zhang, J.Y.; Liu, T.X.; Luo, Y.Y.; Duan, L.M.; Li, W.; Yang, L. Spatial and temporal distribution of aboveground biomass in semi-arid steppe basin and its influencing factors. Chin. J. Ecol. 2020, 39, 364–375. [Google Scholar]
- Tian, M.Q.; Zhou, J.Z.; Zhang, Y.C.; Jia, B.J.; Chen, L. Response of Vegetation Cover to Climate Before and After Impoundment in Three Gorges Reservoir. J. Yangtze River Sci. Res. Inst. 2021, 38, 43–49. [Google Scholar]
- Maierdang, K.; Halik, U.; Florian, B.; Choimaa, D. Vitality variation and population structure of a riparian forest in the lower reaches of the Tarim River, NW China. J. For. Res. 2018, 29, 749–760. [Google Scholar]
- Wang, Y.J. Optimal Allocation of Agricultural Water and Soil Resources in Aksu River Basin Based on Water Resources Carrying Capacity. Master’ Thesis, Huazhong University of Science and Technology, Wuhan, China, 2021. [Google Scholar]
- Wu, H.X.; Muhetal, A.; Zhang, H.; Nie, Y.; Jia, F.S. Analysis on the change map and driving force of land use pattern in Aksu Irrigation Area. J. Yangtze River Sci. Res. Inst. 2018, 35, 147–152+158. [Google Scholar]
- Zhang, Y.X. Vegetation construction and water resources protection in the Loess Plateau. Shanxi Agric. Econ. 2021, 1, 105–106. [Google Scholar]
- Zhou, G.Y.; Xia, J.; Zhou, P.; Shi, T.; Li, L. Inadequate revegetation leads to reduced water resources. Sci. China Earth Sci. 2021, 51, 175–182. [Google Scholar]
- Zhou, C.X. Analysis on the development and utilization of water resources in Aksu City. Water Technol. Econ. 2015, 5, 99–100. [Google Scholar]
- Li, J.W. Problems and countermeasures in the exploitation and utilization of groundwater in Xinjiang. Groundwater 2019, 41, 45–46. [Google Scholar]
- Wang, F. Analysis of Problems and Countermeasures of Groundwater Utilization in Xinjiang. Energy Conserv. 2019, 2, 83–84+106. [Google Scholar]
- Wang, Z.C.; Li, Z.; Zhang, H.; Li, W.J.; Xu, Y.J. Effects of land use change on evapotranspiration and water consumption in Aksu River Basin. J. Irrig. Drain. 2018, 37, 79–85. [Google Scholar]
- 46Zhou, D.C.; Luo, G.P.; Xu, W.Q.; Feng, Y.X. Dynamics of ecosystem services value in Aksu River watershed in 1960-2008. Ying Yong Sheng Tai Xue Bao 2010, 21, 399–408. [Google Scholar]
- Wang, Z.D. Optimal Allocation of Soil and Water Resources and Spatial Pattern Optimization of Planting Structure in Aksu River Basin. Master’s Thesis, Northwest A&F University, Shaanxi, China, 2021. [Google Scholar]
- Chen, Y.N.; Li, Z.Q.; Xu, J.H.; Shen, Y.J.; Xing, X.X.; Xie, T.; Li, Z.; Yang, L.S.; Xi, H.Y.; Zhu, C.G.; et al. Changes and Protection Suggestions in Water Resources and Ecological Environment in Arid Region of Northwest China. Chin. Acad. Sci. 2023, 38, 385–393. [Google Scholar]
- Wang, R. Estimation and Characteristic Analysis of Vegetation and Lake Ecological Water Demand in Aksu River Irrigation District. Master’s Thesis, Central China Normal University, Wuhan, China, 2020. [Google Scholar]
- Xu, F.Q. Concise analysis of effective precipitation. J. Hydrol. Meteorol. Oceanogr. Instrum. 2009, 26, 96–100. [Google Scholar]
- Gong, X.; Zhang, H.; Ren, C.; Sun, D.Y.; Yang, J.T. Optimization allocation of irrigation water resources based on crop water requirement under considering effective precipitation and uncertainty. Agric. Water Manag. 2020, 239, 106264. [Google Scholar] [CrossRef]
- Nistor, M.M.; Satyanaga, A.; Dezsi, S.; Lonel, H. European grid dataset of actual evapotranspiration, water availability and effective precipitation. Atmosphere 2022, 13, 772. [Google Scholar] [CrossRef]
- Chen, Y.Q.; Wu, L.L.; Zhang, G.X.; Tan, Z.Q.; Qiao, S.J. Quantitative assessment of surface hydrological connectivity in momoge national nature reserve, northeast China. Chin. J. Appl. Ecol. 2020, 31, 3833–3841. [Google Scholar]
- Li, C.Y.; Zhang, W.J.; Lai, Z.M.; Peng, F.; Chen, X.J. Study on community productivity, species diversity and soil characteristics of alpine steppe with different degradation degrees and their relationships in the source region of the Yellow River. Acta Ecol. Sin. 2013, 41, 4541–4551. [Google Scholar]
- 56Liao, K.; Wu, Z.H.; Li, X.X.; Sun, C.L. Distribution of effective precipitation and available precipitation resources in Mulan River Basin of Putian City. Straits Sci. 2021, 45, 13–20. [Google Scholar]
- Liu, Z.D.; Duan, A.W.; Xiao, J.F.; Liu, Z.G. Research Progress on Calculation Methods of Effective Rainfall in Growing Period on Dry Crop. J. Irrig. Drain. 2007, 26, 27–30+34. [Google Scholar]
- Patwardhan, A.S.; Nieber, J.L.; Eldon, L.J.; Member, A. Methods for estimating effective rainfall. Northeast China Water Resour. Hydropower 1991, 5, 39–45. [Google Scholar]
- Sands, G.R.; Moore, I.D.; Robert, C.R. Supplementary irrigation of horticultural crops in humid areas. J. Am. Water Resour. Assoc. 1982, 18, 831–839. [Google Scholar] [CrossRef]
- Liu, Z.D.; Duan, A.W.; Xiao, J.F.; Gao, Y.; Liu, H. Study on calculating model of effective precipitation in winter wheat growth period. J. Irrig. Drain. 2009, 28, 21–25. [Google Scholar]
- Liu, S.R.; Sun, P.S.; Wen, Y.G. Comparative Analysis of Hydrological Functions of Major Forest Ecosystems in China. Acta Phytoecol. Sin. 2003, 27, 16–22. [Google Scholar]
- Lv, X.Z. Study on the Effect of Forest Vegetation on Hydrological Process on Slope in Beijing Mountain Area. Ph.D. Thesis, Beijing Forestry University, Beijing, China, 2013. [Google Scholar]
- Gong, S.H.; Xiao, Y.; Fang, Y.; Zheng, H.; Xiao, Y. Forest ecosystem surface run-off requlation characteristics in China. Acta Ecol. Sin. 2016, 36, 7472–7478. [Google Scholar]
- Li, W.H.; He, W.T.; Yang, L.W. A summary and perspective of forest vegetation impacts on water yield. J. Nat. Resour. 2001, 16, 398–406. [Google Scholar]
- Li, H.J.; Zhang, X.P.; Zhang, Y.T.; Han, Z.T.; Li, X. Study on Water Resource Conservation of Natural Spruce Forest Ecosystem Based on Month Water Balance in the Middle Tiansh Mountains. J. Soil Water Conserv. 2011, 25, 227–232. [Google Scholar]
- Yang, X.; Chen, R.; Meadows, M.E.; Ji, G.X.; Xu, J.H. Modelling water yield with the invest model in a data scarce region of northwest China. Water Sci. Technol. Water Supply 2020, 20, 1035–1045. [Google Scholar] [CrossRef]
- Wei, P.J.; Wu, M.H.; Jia, Y.L.; Gao, Y.Y.; Xu, H.J. Spatiotemporal variation of water yield in the upstream regions of the Shule River Basin using the InVEST Model. Acta Ecol. Sin. 2022, 42, 6418–6429. [Google Scholar]
- Zhang, F.P.; Li, X.J.; Feng, Q.; Wang, H.W.; Wei, Y.F. Spatial and Temporal Variation of Water Conservation in the Upper Reaches of Heihe River Basin Based on InVEST Model. J. Desert Res. 2018, 38, 1321–1329. [Google Scholar]
- Zhao, Y.R.; Zhou, J.J.; Lei, L.; Xiang, J.; Huang, M.H.; Feng, W.; Zhu, G.F.; Wei, W.; Wang, J.A. Identification of drivers for water yield in the upstream of Shiyang River based on InVEST model. Chin. J. Ecol. 2019, 38, 3789–3799. [Google Scholar]
- Guo, L.J.; Yin, X.J.; Gou, Z.Z.; Chen, Y.N.; Zhang, Y.Y.; Cai, W.; Wang, W.Y.; Wang, H.J.; Luo, X.G.; Chen, X. Evaluation of water yield and Environmental Factors in Aksu River Basin based on InVEST Model. J. Shihezi Univ. 2020, 38, 216–224. [Google Scholar]
- Dou, M.; Sun, J.G.; Chen, H.P. Water Production Simulation in Hengduan Mountainous Region Based on InVEST Model. J. Anhui Agric. Sci. 2017, 21, 54–58. [Google Scholar]
- Li, D.L.; Wu, S.Y.; Li, H.C.; Liang, Z.; Li, S.C. Evaluating regional water security through a freshwater ecosystem service flow model: A case study in Beijing-Tianjian-Hebei region, China. Ecol. Indic. 2017, 81, 159–170. [Google Scholar] [CrossRef]
- Lai, H. Study on Calculation Method and Application of Environmental Discharge in Middle and Lower Reaches of Yangtze River. Master’ Thesis, Wuhan University, Wuhan, China, 2017. [Google Scholar]
- Hughes, D.A.; Hannart, P. A desktop model used to provide an initial estimate of the ecological instream flow requirements of rivers in South Africa. J. Hydrol. 2003, 270, 167–181. [Google Scholar] [CrossRef]
- Han, Q.; Tan, G.M.; Fu, X.; Yang, H.J.; Li, X. Calculation method of river environmental flow and its application. J. Wuhan Univ. 2018, 51, 189–197. [Google Scholar]
- Zhao, W.Z.; Chang, X.L.; He, Z.B.; Zhang, Z.H. Study on Ecological Water requirement of vegetation in Ejin Desert Oasis. Sci. China Ser. 2006, 36, 559–566. [Google Scholar]
- Hao, X.M.; Zhao, Z.Y.; Fan, X.; Zhang, J.J.; Zhang, S. Evaluation method of ecological water demand threshold of natural vegetation in arid-region inland river basin based on satellite data. Ecol. Indic. 2023, 146, 109811. [Google Scholar] [CrossRef]
- Chen, Y.N.; Yang, Q.; Luo, Y.; Shen, Y.J.; Pan, X.L.; Li, L.H.; Li, Z. Ponder on the issues of water resources in the arid region of northwest China. Arid Land Geogr. 2012, 35, 1–9. [Google Scholar]
- 80Tang, Q.C.; Zhang, J.B. Water Resources and Eco environment Protection in the Arid Regions in Northwest of China. Prog. Geogr. 2001, 20, 226–232. [Google Scholar]
- Gao, G.; Zhang, J.; Liu, Y.; Ning, Z.; Fu, B.; Sivapalan, M. Spatio-temporal patterns of the effects of precipitation variability and land use/cover changes on long-term changes in sediment yield in the Loess Plateau, China. Hydrol. Earth Syst. Sci. 2017, 21, 4363–4378. [Google Scholar] [CrossRef]
- 83Wang, K.L.; Wang, Z.H.; Xiao, P.Q.; Wang, T.S.; Zhang, P. Evaluation of forest and grass vegetation coverage restoration potential based on water balance principle in Loess Plateau. Acta Ecol. Sin. 2022, 42, 8352–8364. [Google Scholar]
- Jiang, W.G.; Yuan, L.H.; Wang, W.J.; Cao, R.; Zhang, Y.F.; Shen, W.M. Spatio-temporal analysis of vegetation variation in the Yelow River Basin. Ecol. Indic. 2015, 51, 117–126. [Google Scholar] [CrossRef]
- Li, H.; Wei, W. Ecological environment change in arid area of Northwest China: A case study of Hetian River in Xinjiang. China Flood Control Drought Relief 2019, 31 (Suppl. S1), 123–126. [Google Scholar]
- Han, Z.Y.; Wu, Q.; Lai, R.X.; Soomro, S.E.H.; Hou, D.G.; Hu, C.H. Spatio-temporal variations of vegetation cover and its influence on surface air temperature change over the Yellow River Basin, China. J. Water Clim. Chang. 2022, 13, 3239–3252. [Google Scholar] [CrossRef]
- Shao, Y.H. In continental river basin in arid zone of northwest ecological water requirement study. J. Water Resour. Hydropower Technol. Gansu Prov. 2020, 56, 15–20. [Google Scholar]
- Zhang, Y.Q.; Kang, W.J.; Qiao, H.J.; Long, Y.; Zhang, C.L. Climate change under the background of ecological water requirement forecast—Good creek valley, for example. J. South-North Water Divers. Water Conserv. Sci. Technol. 2023, 21, 313–323. [Google Scholar]
- Wang, J.H. Analysis of groundwater ecological regulation and monitoring and early warning in arid area of Tarim River Basin. Henan Water Resour. South-North Water Divers. 2019, 49, 13–15+26. [Google Scholar]
- Deng, M.J.; Zhou, H.Y.; Xu, H.L.; Ling, H.B.; Zhang, P. The tarim aggregate and the situation of ecological water regulation. J. Arid. Zone Res. 2017, 5, 59–966. [Google Scholar]
- Xue, L.Q.; Wei, Q.; Wei, G.H. Coupling simulation of surface water and groundwater in Tarim River. J. Hohai Univ. 2019, 47, 195–201. [Google Scholar]
- Yan, M.H.; Zhang, W.C.; Liu, G. Shule river trunk stream of precipitation in space-time distribution study. J. Groundw. 2022, 44, 197–200. [Google Scholar]
- Huang, X.; Chen, F.L.; Zhao, Q.; He, C.F.; Long, A.H. Study on annual runoff abundance and dry occurrence of Hetian River in Xinjiang. J. Res. Arid. Areas 2021, 38, 1570–1578. [Google Scholar]
- Xue, S.W.; Qi, C.S.; Cao, S.G.; Wang, L.D.; Zhang, T. Analysis of annual runoff abundance and depletion in the Yellow River and Xiaoqing River. People’s Yellow River 2017, 39, 5–7. [Google Scholar]
- Terrado, M.; Acuna, V.; Ennaanay, D.; Tallis, H.; Sabater, S. Impact of climate extremes on hydrological ecosystem services in a heavily humanized Mediterranean basin Ecological Indicators. Ecol. Indic. 2014, 37, 199–209. [Google Scholar] [CrossRef]
- Temesgen, G.; Abeyou, W.W.; Yihun, T.D.; Mesfin, S.; Anwar, A.A.; Amare, B.; Zara, T.; Tena, A.; Derege, T.M.; Getachew, B. Evaluating InVEST model for simulating annual and seasonal water yield in data-scarce regions of the Abbay (Upper Blue Nile) Basin: Implications for water resource planners and managers. Sustain. Water Resour. Manag. 2022, 8, 170. [Google Scholar]
- Wang, X.J.; Liu, G.X.; Lin, D.R.; Lin, Y.B.; Lu, Y.; Xiang, A.C. Water yield service influence by climate and land use change based on InVEST model in the monsoon hilly watershed in South China. Geomat. Nat. Hazards Risk 2022, 13, 2024–2048. [Google Scholar] [CrossRef]
- Valencia, B.J.; Guryanov, V.V.; Diez, M.J.; Jeimar, T.; Aetyom, V.G. Assessing the Effectiveness of the Use of the InVEST Annual Water Yield Model for the Rivers of Colombia: A Case Study of the Meta River Basin. Water 2023, 15, 1617. [Google Scholar] [CrossRef]
- Liu, Y. Research on the Planting Structure of Grassland in Typical Pastoral Areas of Western China Based on Ecological Water Demand. Master’s Thesis, Xian University of Science and Technology, Xian, China, 2022. [Google Scholar]
- Zhang, Z.; Zhang, P.Y.; Zhang, G.M. Study on Ecological Water Requirement of Vegetation in Wuhai Based on GIS. IOP Conf. Ser. Earth Environ. Sci. 2021, 621, 012132. [Google Scholar] [CrossRef]
- Ling, H.B.; Guo, B.; Xu, H.L.; Fu, J.Y. Configuration of water resources for a typical riverbasin in an arid region of China based on the ecological water requirements (EWRs)of desert riparian vegetation. Glob. Planet Chang. 2014, 122, 292–304. [Google Scholar] [CrossRef]
- Li, L.J.; Jiang, D.J.; Hou, X.X.; Li, J.Y. Simulated runoff responses to land use in the middle and upstream reaches of Taoerhe River basin, Northeast China, in wet, average and dry years. Hydrol. Process. 2013, 27, 3484–3494. [Google Scholar] [CrossRef]
- Li, D.H. The Vegetation Ecological Water Requirement Estimation and Safety Risk Assessment in Xinjiang. Master’s Thesis, East China Normal University, Shanghai, China, 2021. [Google Scholar]
- Chi, D.; Wang, H.; Li, X.B.; Liu, H.H.; Li, X.H. Estimation of the ecological water requirement for natural vegetation in the Ergune River basin in Northeastern China from 2001 to 2014. Ecol. Indic. 2018, 92, 141–150. [Google Scholar] [CrossRef]
- Gao, G.; Shen, O.; Zhang, Y.; Pan, N.Q.; Ma, Y.; Jiang, X.H.; Fu, B.J. Determining spatio-temporal variations of ecological water consumption by natural oases for sustainable water resources allocation in a hyper-arid endorheic basin. J. Clean. Prod. 2018, 185, 1–13. [Google Scholar] [CrossRef]
- Wang, G. Research on Water Resource Allocation Scheme in Northwest Agricultural Region Based on Water-Crop-Ecology Link. Master’s Thesis, Hefei University of Technology, Hefei, China, 2022. [Google Scholar]
- Li, J.Y.; Cui, L.B.; Dou, M.; Akhtar, A. Water resources allocation model based on ecological priority in the arid region. Environ. Res. 2021, 199, 111201. [Google Scholar]

Disclaimer/Publisher’s Note: The statements, opinions and data contained in all publications are solely those of the individual author(s) and contributor(s) and not of MDPI and/or the editor(s). MDPI and/or the editor(s) disclaim responsibility for any injury to people or property resulting from any ideas, methods, instructions or products referred to in the content. |
© 2024 by the authors. Licensee MDPI, Basel, Switzerland. This article is an open access article distributed under the terms and conditions of the Creative Commons Attribution (CC BY) license (https://creativecommons.org/licenses/by/4.0/).
Share and Cite
Qi, Z.; Xi, L.; Cui, M.; Wang, L.; Feng, Y.; Cao, X. Optimization of Forest and Grass Vegetation Distribution in the Aksu River Basin by Water Resources Carrying Capacity. Water 2024, 16, 389. https://doi.org/10.3390/w16030389
Qi Z, Xi L, Cui M, Wang L, Feng Y, Cao X. Optimization of Forest and Grass Vegetation Distribution in the Aksu River Basin by Water Resources Carrying Capacity. Water. 2024; 16(3):389. https://doi.org/10.3390/w16030389
Chicago/Turabian StyleQi, Zhao, Lei Xi, Mengchun Cui, Lili Wang, Yiming Feng, and Xiaoming Cao. 2024. "Optimization of Forest and Grass Vegetation Distribution in the Aksu River Basin by Water Resources Carrying Capacity" Water 16, no. 3: 389. https://doi.org/10.3390/w16030389
APA StyleQi, Z., Xi, L., Cui, M., Wang, L., Feng, Y., & Cao, X. (2024). Optimization of Forest and Grass Vegetation Distribution in the Aksu River Basin by Water Resources Carrying Capacity. Water, 16(3), 389. https://doi.org/10.3390/w16030389