Article

Impact of CO2 Viscosity and Capillary Pressure on Water Production in Homogeneous and Heterogeneous Media

LRST at The National Energy Technology Laboratory, Morgantown, WV 26505, USA
Water 2024, 16(24), 3566; https://doi.org/10.3390/w16243566
Submission received: 30 October 2024 / Revised: 6 November 2024 / Accepted: 25 November 2024 / Published: 11 December 2024
(This article belongs to the Special Issue Hydraulic Engineering and Numerical Simulation of Two-Phase Flows)

Abstract

:
This study explores the numerical modeling of CO2 injection in water within a lab-scale domain, where the dimensions are in the order of centimeters, highlighting its diverse applications and significant environmental and economic benefits. The investigation focuses on the impacts of heterogeneity, capillary pressure, and CO2 viscosification on water production. Findings reveal that increasing CO2 viscosity by a factor of 5 drastically influences water production, while further increasing it to a factor of 10 yields minimal additional effect. Capillary pressure notably delays breakthrough and reduces sweeping efficiency (effectiveness of the injected CO2 in displacing water), with a more pronounced impact in slim cores (1 cm) compared to thick cores (3.8 cm). The numerical modeling of CO2 injection in water within a lab-scale domain provides valuable insights into enhanced oil recovery (EOR) techniques. These optimized strategies can improve the efficiency and effectiveness of CO2-EOR, leading to increased oil and gas recovery from reservoirs.

1. Introduction

The simulation of flow processes is a crucial tool for investigating various fluid injection schemes, providing valuable insights into their efficiency and effectiveness. In the United States alone, over 7 billion USD has been invested in CO2-related projects [1]. These projects encompass a wide range of applications, including CO2 sequestration, enhanced oil recovery, and CO2 storage in depleted reservoirs. The potential benefits of CO2 injection are significant, not only for improving oil recovery but also for its environmental advantages. Some of the benefits include reducing atmospheric CO2 levels and mitigating climate change [2,3,4].
CO2 injection in the subsurface presents far more complexities than hydrocarbon gas injection due to the unique density and viscosity characteristics of CO2. When CO2 interacts with oil and/or water, various processes become critical in describing fluid flow. For instance, the dissolution of CO2 in the aqueous phase can create density contrasts, leading to different types of gravity fingering that alter the fluid flow path [5,6]. These phenomena make the simulation of CO2 injection a challenging yet essential task for optimizing injection strategies and predicting outcomes.
Modifying the mobility of injected fluids can significantly enhance oil and gas recovery [7,8]. Adding a viscosity reducer can facilitate oil displacement [7], while a viscosity thickener may be necessary for highly mobile injected fluids. Water-alternating-gas (WAG) injection, which alternates between water and CO2, improves sweep efficiency and oil recovery, with CO2 displacement typically leaving less residual oil than water displacement [9]. This method also offers environmental benefits by reducing greenhouse gas emissions. CO2 foam is another technique for mobility control, although its high mobility can lead to low sweep efficiency due to gravity override and viscous fingering. To address this, Bond and Holbrook [10] and Fried [11] proposed foam processes to enhance the sweep efficiency; however, oil recovery can be compromised by foam destabilization and surfactant partitioning [12,13,14,15,16]. CO2 viscosification, using polymer thickeners, presents a simpler alternative, increasing CO2 viscosity and reducing mobility without the complexities of foam. Effective CO2 thickeners should have low adsorption to rock, minimal partitioning in oil and water, and reversible flow rate changes [17]. Options for CO2 thickening include polymers with cosolvents, nanoparticles, and polymers alone. Bae and Irani [18] developed a CO2 polymer thickener that significantly increases viscosity, although high cosolvent concentrations can be costly. Nanoparticles and fluorinated compounds also enhance CO2 viscosity, but their use is limited by cost and environmental concerns [19,20,21]. Recent research on CO2 viscosification and new molecule engineering has shown that a five-fold increase in viscosity can improve oil recovery, although the breakthrough time remains unchanged with neat CO2 [22,23].
Mir Muhammad et al. [2] highlighted the dual benefits of CO2 injection for enhancing oil recovery and sequestering carbon dioxide. Their field-scale simulations using the CMG software package (Builder 2015.1) [24] demonstrate that CO2 injection can significantly improve oil recovery, with the highest recovery achieved by injecting CO2 into the reservoir using vertical wells. Additionally, a CO2 injection into the aquifers also enhanced oil recovery, with the horizontal wells outperforming vertical wells. Dai et al. [4] provided a quantitative evaluation of the operational and technical risks associated with CO2-EOR projects. Using Monte Carlo simulations, they defined risk factor metrics such as CO2 injection rate, cumulative CO2 storage, and oil production rate to assess project risks. Their study on the Morrow reservoir at the Farnsworth Unit site in Texas showed that approximately 31% of the realizations could be profitable under the current oil prices, with profitability increasing if carbon tax credits were available or if operational costs decreased. Together, these studies underscore the potential of CO2 injection to enhance oil recovery and sequester carbon dioxide, while also highlighting the importance of risk assessment and economic considerations in CO2-EOR projects.
This work presents a series of numerical simulation examples that focus on CO2 injection in water within a lab-scale domain. The simulations examine the effects of the heterogeneity, capillary pressure, and varying levels of CO2 viscosification on water production (refers to the ratio of the volume of produced water to the total produced volume). By understanding these factors, the work aims to provide a comprehensive analysis of how different conditions impact the efficiency of CO2 injection. The findings have significant implications for current energy and environmental policies. By demonstrating the potential for optimized CO2 injection strategies to enhance water production, this study supports the development of more efficient and sustainable practices in oil and gas recovery. Additionally, the environmental benefits of reducing greenhouse gas emissions through improved CO2 sequestration techniques align with global efforts to combat climate change.
The numerical model employed in these simulations is based on advanced techniques, including mixed finite elements and discontinuous Galerkin discretization schemes. These methods offer high accuracy and stability, making them suitable for capturing the complex behaviors associated with CO2 injection. Detailed information about the numerical model and its implementation can be found in references [25,26]. For completeness, this information is also included in the Appendix A.
In addition to the primary focus on CO2 viscosification and capillary pressure, the study also considers the broader implications of CO2 injection in various geological settings. This includes the potential for CO2 to enhance oil recovery in mature fields, the long-term storage of CO2 in depleted reservoirs, and the environmental benefits of reducing greenhouse gas emissions. The interplays between these factors are critical for developing effective CO2 injection strategies that maximize both economic and environmental benefits.
Through this study, the work aims to contribute to the growing body of knowledge on CO2 injections, offering insights that could inform future research and practical applications in the field. By addressing the challenges and opportunities presented by CO2 injections, the study hopes to advance the development of more efficient and environmentally friendly fluid injection strategies.

2. Numerical Simulation Results

This section presents the numerical simulation examples for CO2 injections in both homogeneous and heterogeneous media. The simulations compare water production with and without capillary pressure. The following two viscosification factors are examined: five times (5×) and ten times (10×) CO2 viscosification, compared to the base case of no viscosification. In all the examples, CO2 is injected at the left side of a horizontal core, with production occurring at the right side. The temperature is maintained at 308.15 K, and the pressure is set at 172 bar. The residual water saturation (the fraction of the pore volume occupied by water, typically expressed as a percentage) is 0.33.
The endpoint relative permeabilities for CO2 and water are 0.17 and 1.0, respectively, with a power of 1.1 for CO2 and 2.8 for water. Production is conducted at a constant pressure, while injection is maintained at a constant volumetric rate of 0.68 pore volume per day. This rate is chosen to provide a steady state condition for the simulations, allowing for the clear observation of the effects of a CO2 injection. Maintaining constant pressure at the production end ensures that the pressure gradient driving the flow remains consistent, which is crucial for analyzing the displacement efficiency. The domain in all simulations is a horizontal core measuring 27 cm in length. The following two different thicknesses are tested: one case with a thickness of 3.8 cm and another with a thickness of 1 cm.
The factors of five and ten times viscosification are selected to explore a range of viscosities that could significantly impact water production. These values are representative of the potential viscosification scenarios in enhanced oil recovery (EOR) processes.

2.1. Simulation in a Homogeneous Domain

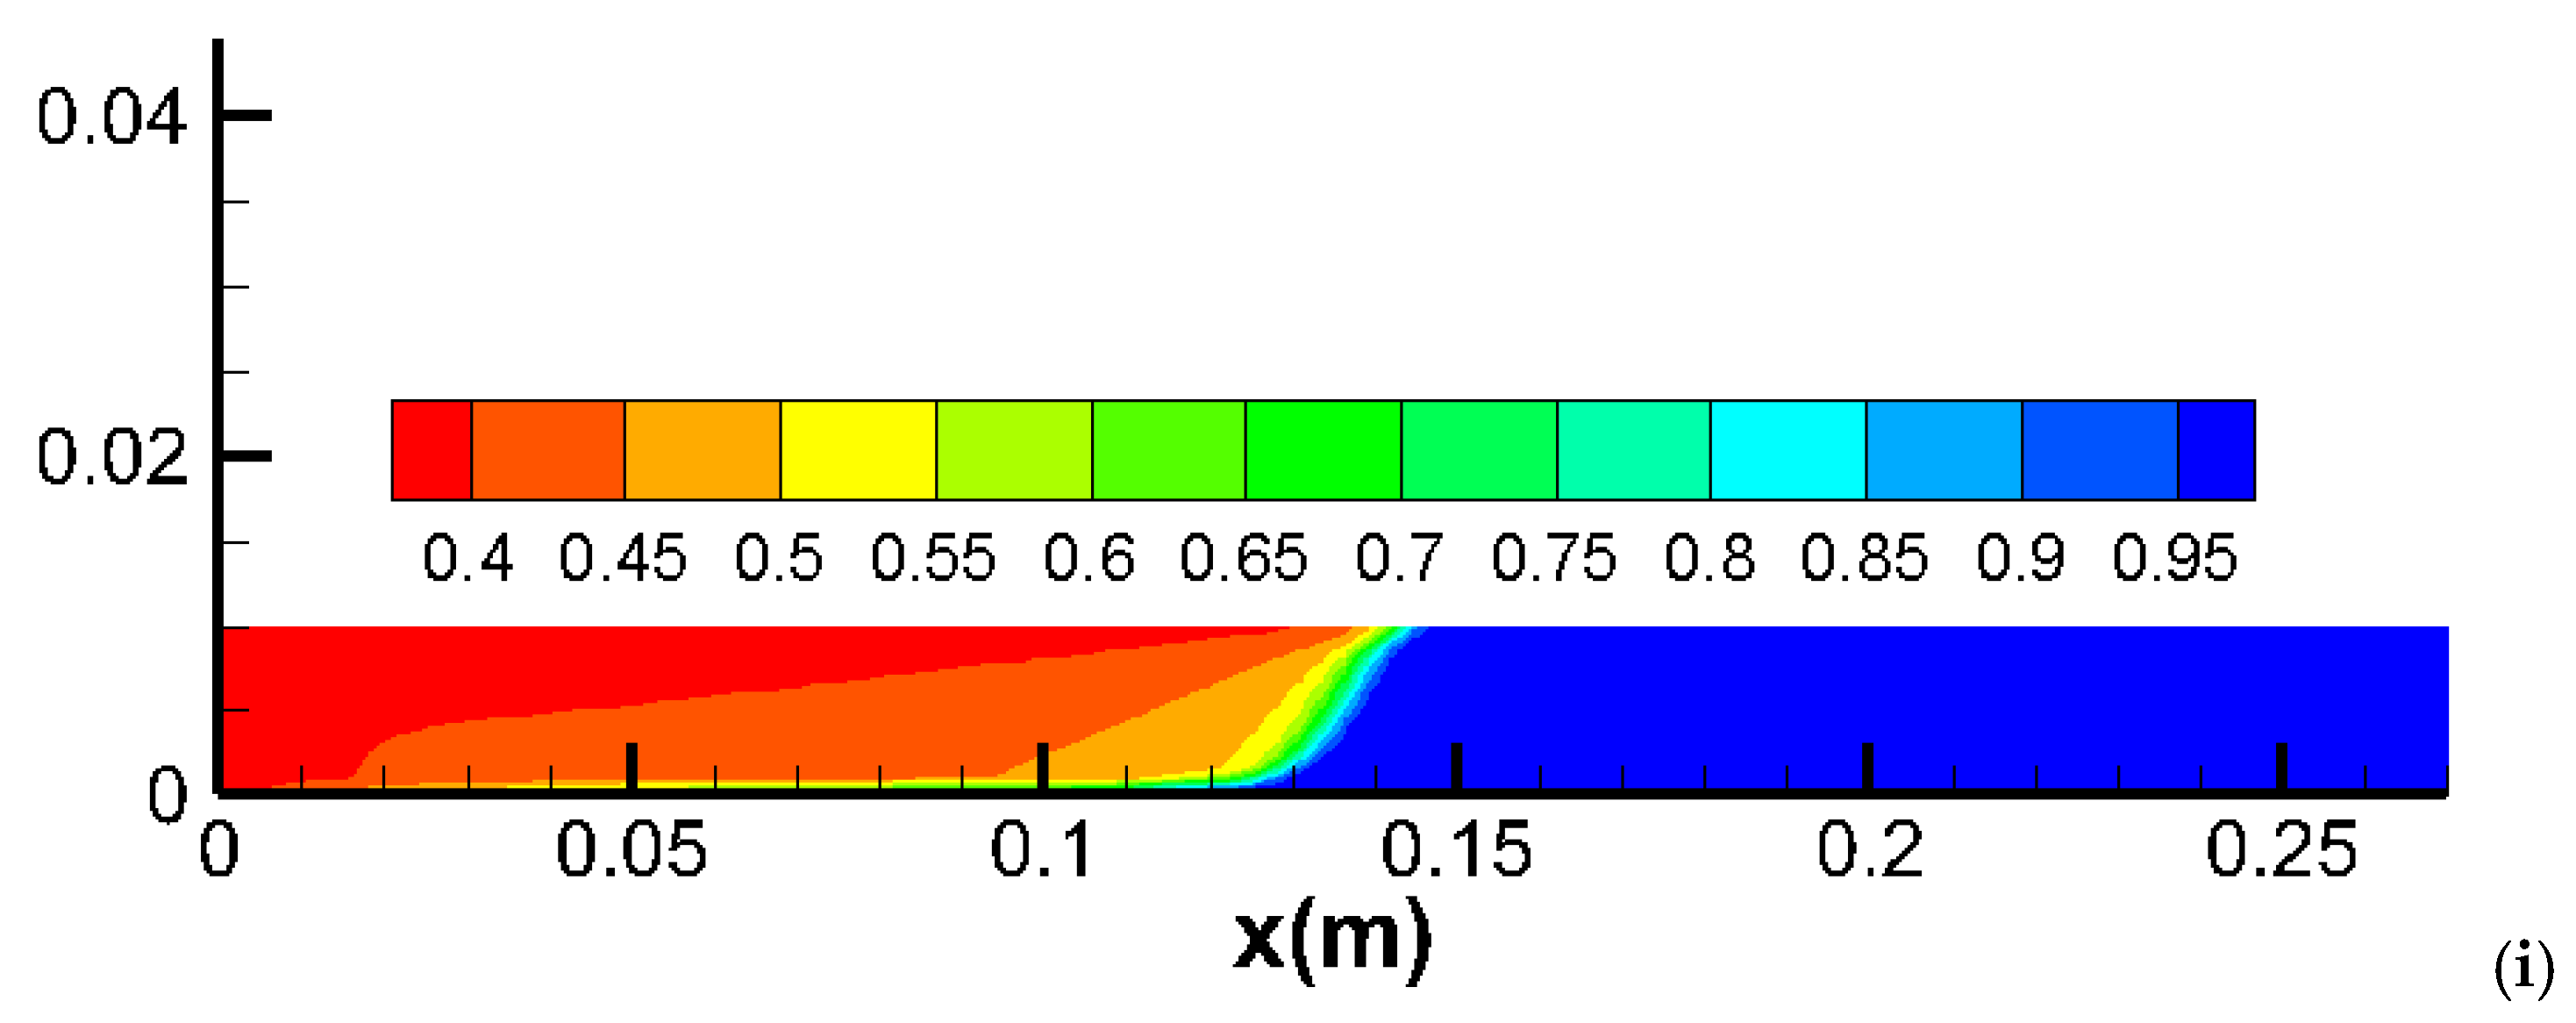
This example examines the simulation in a homogeneous domain with a permeability of 100 mD and a porosity of 19%. This value represents a moderately permeable rock, which is common in many reservoir formations. It allows us to study the effects of CO2 injection in a typical reservoir setting. The core thickness is 3.8 cm (Figure 1) and is discretized with 2000 structured grids. The effect of viscosification in homogeneous media is investigated by considering the following three cases: the base case with no viscosification, a viscosification by a factor of five, and a viscosification by a factor of ten. Figure 2a–i illustrate the water saturation at different pore volume injections (PVIs) for these three cases.
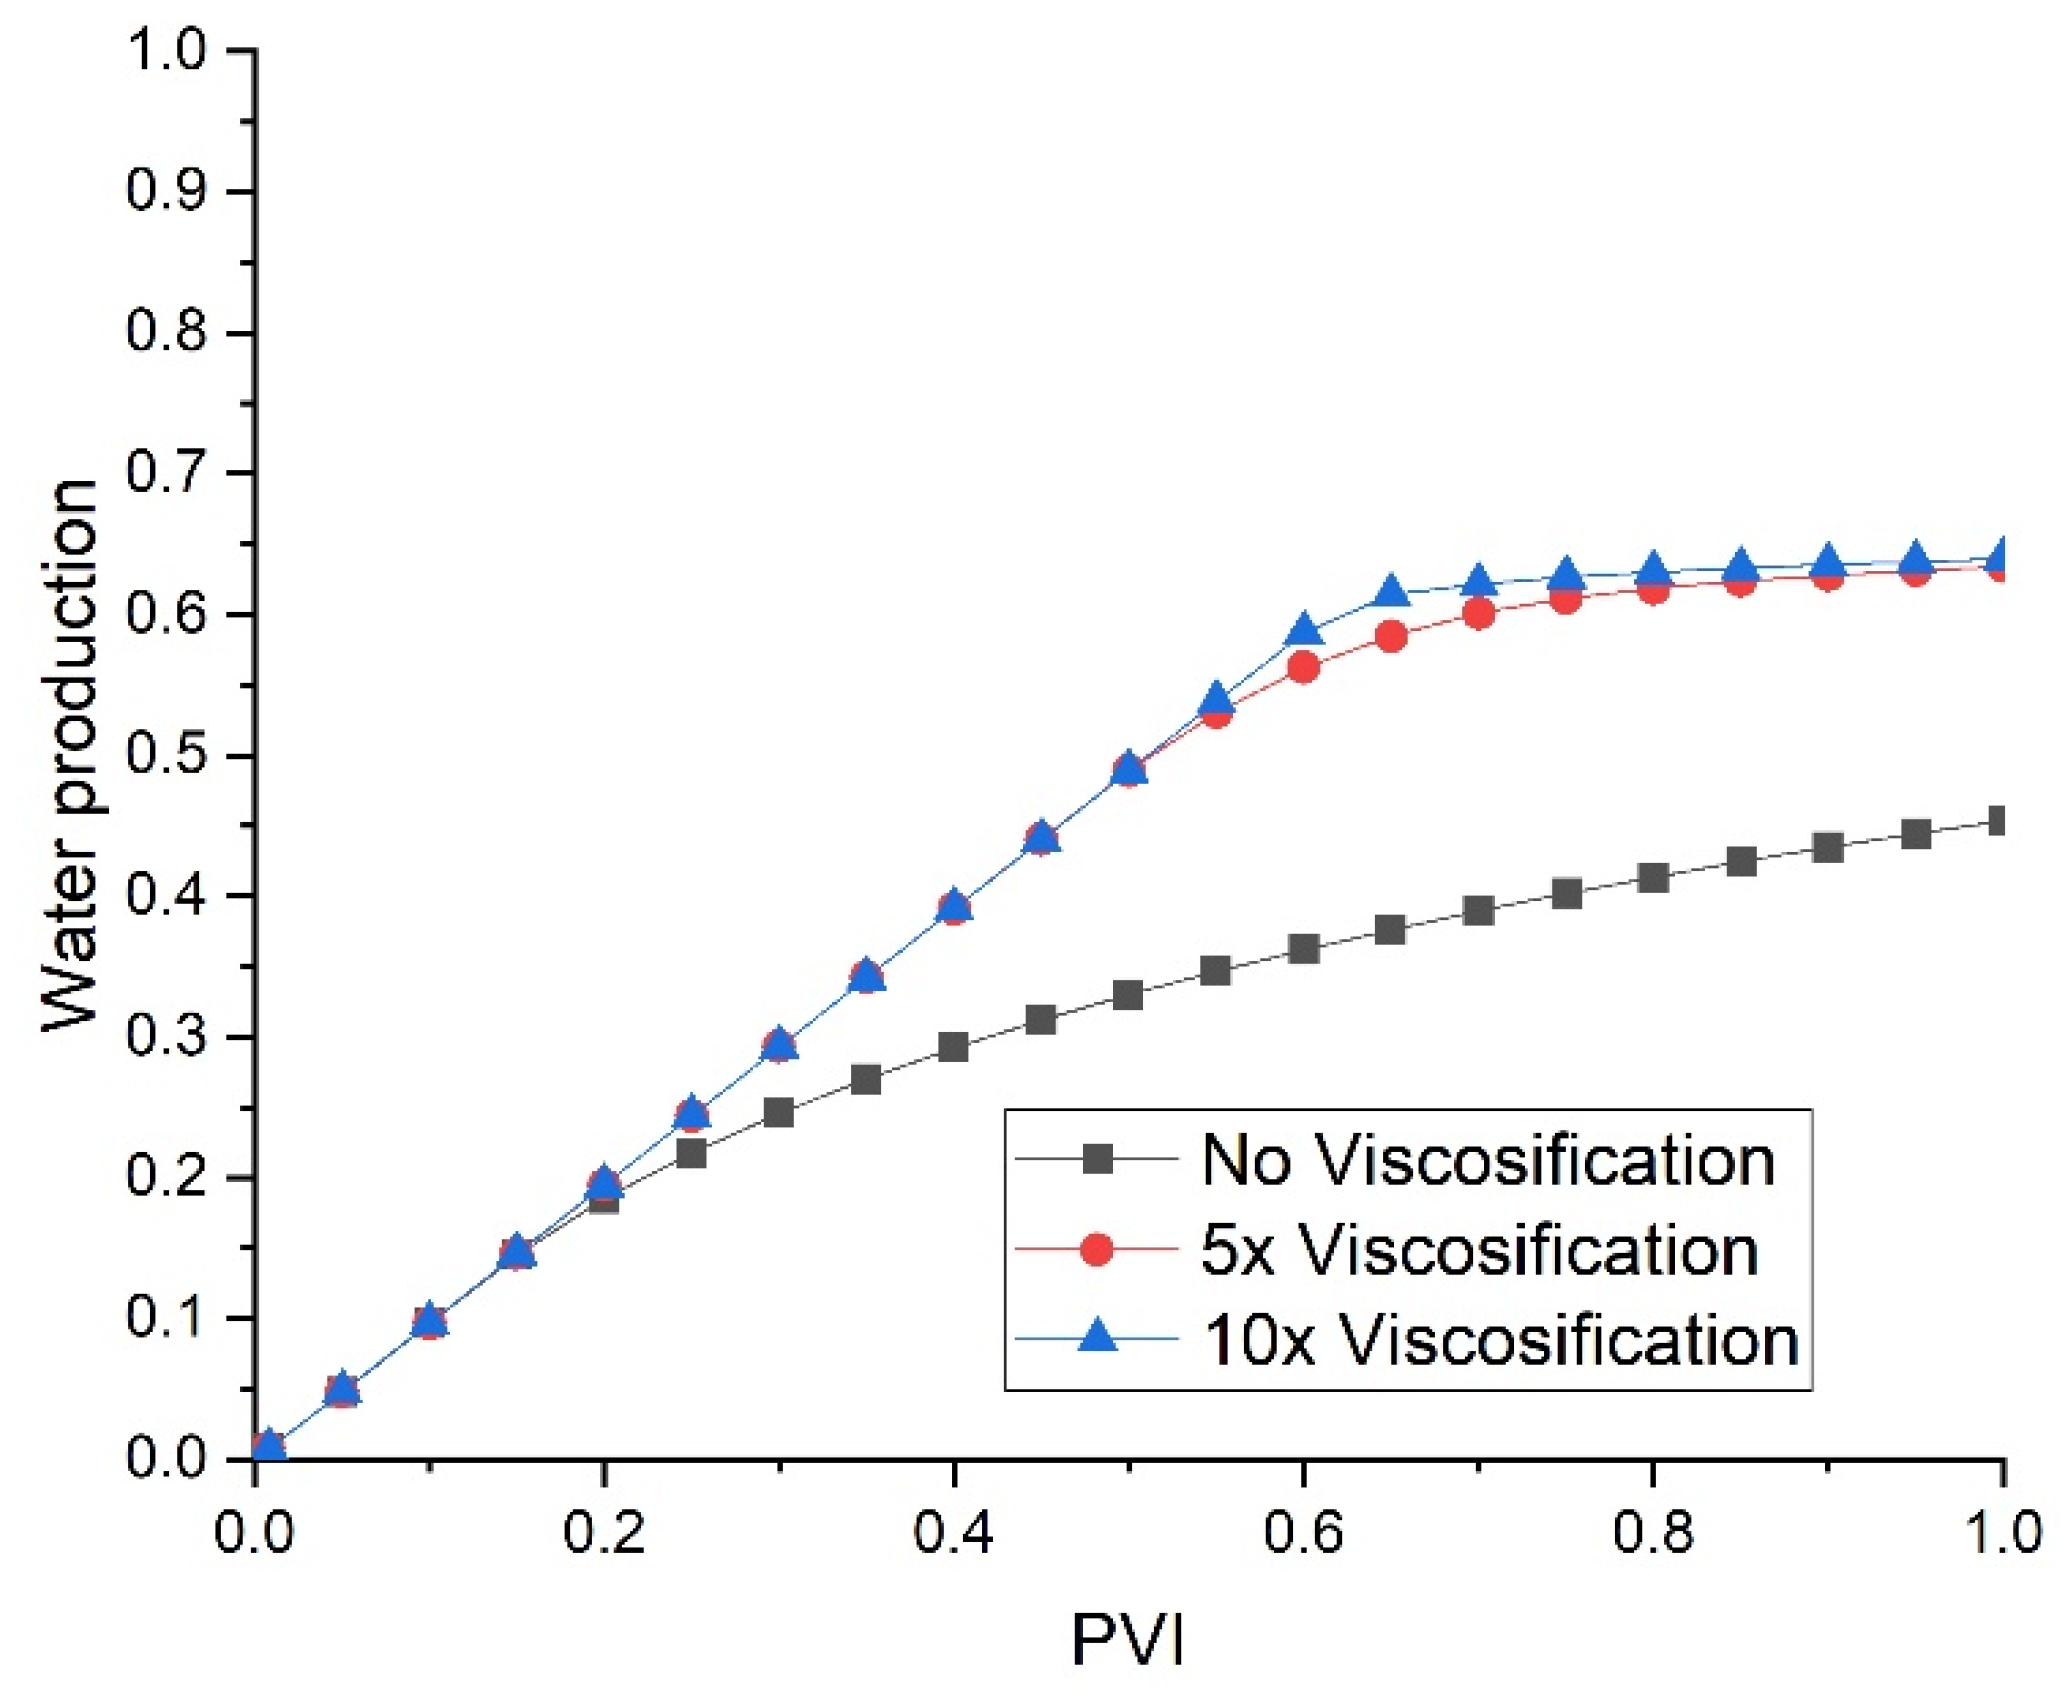
The results indicate that a 5× viscosification delays the breakthrough compared to the base case without viscosification. Increasing the viscosification to 10× further delays the breakthrough and enhances the sweeping efficiency. Figure 3 illustrates the water production for the three cases. As shown, the highest production is achieved with the highest viscosification factor; however, the difference between 5× and 10× viscosification is minimal.

2.2. Simulation in a Slim Core

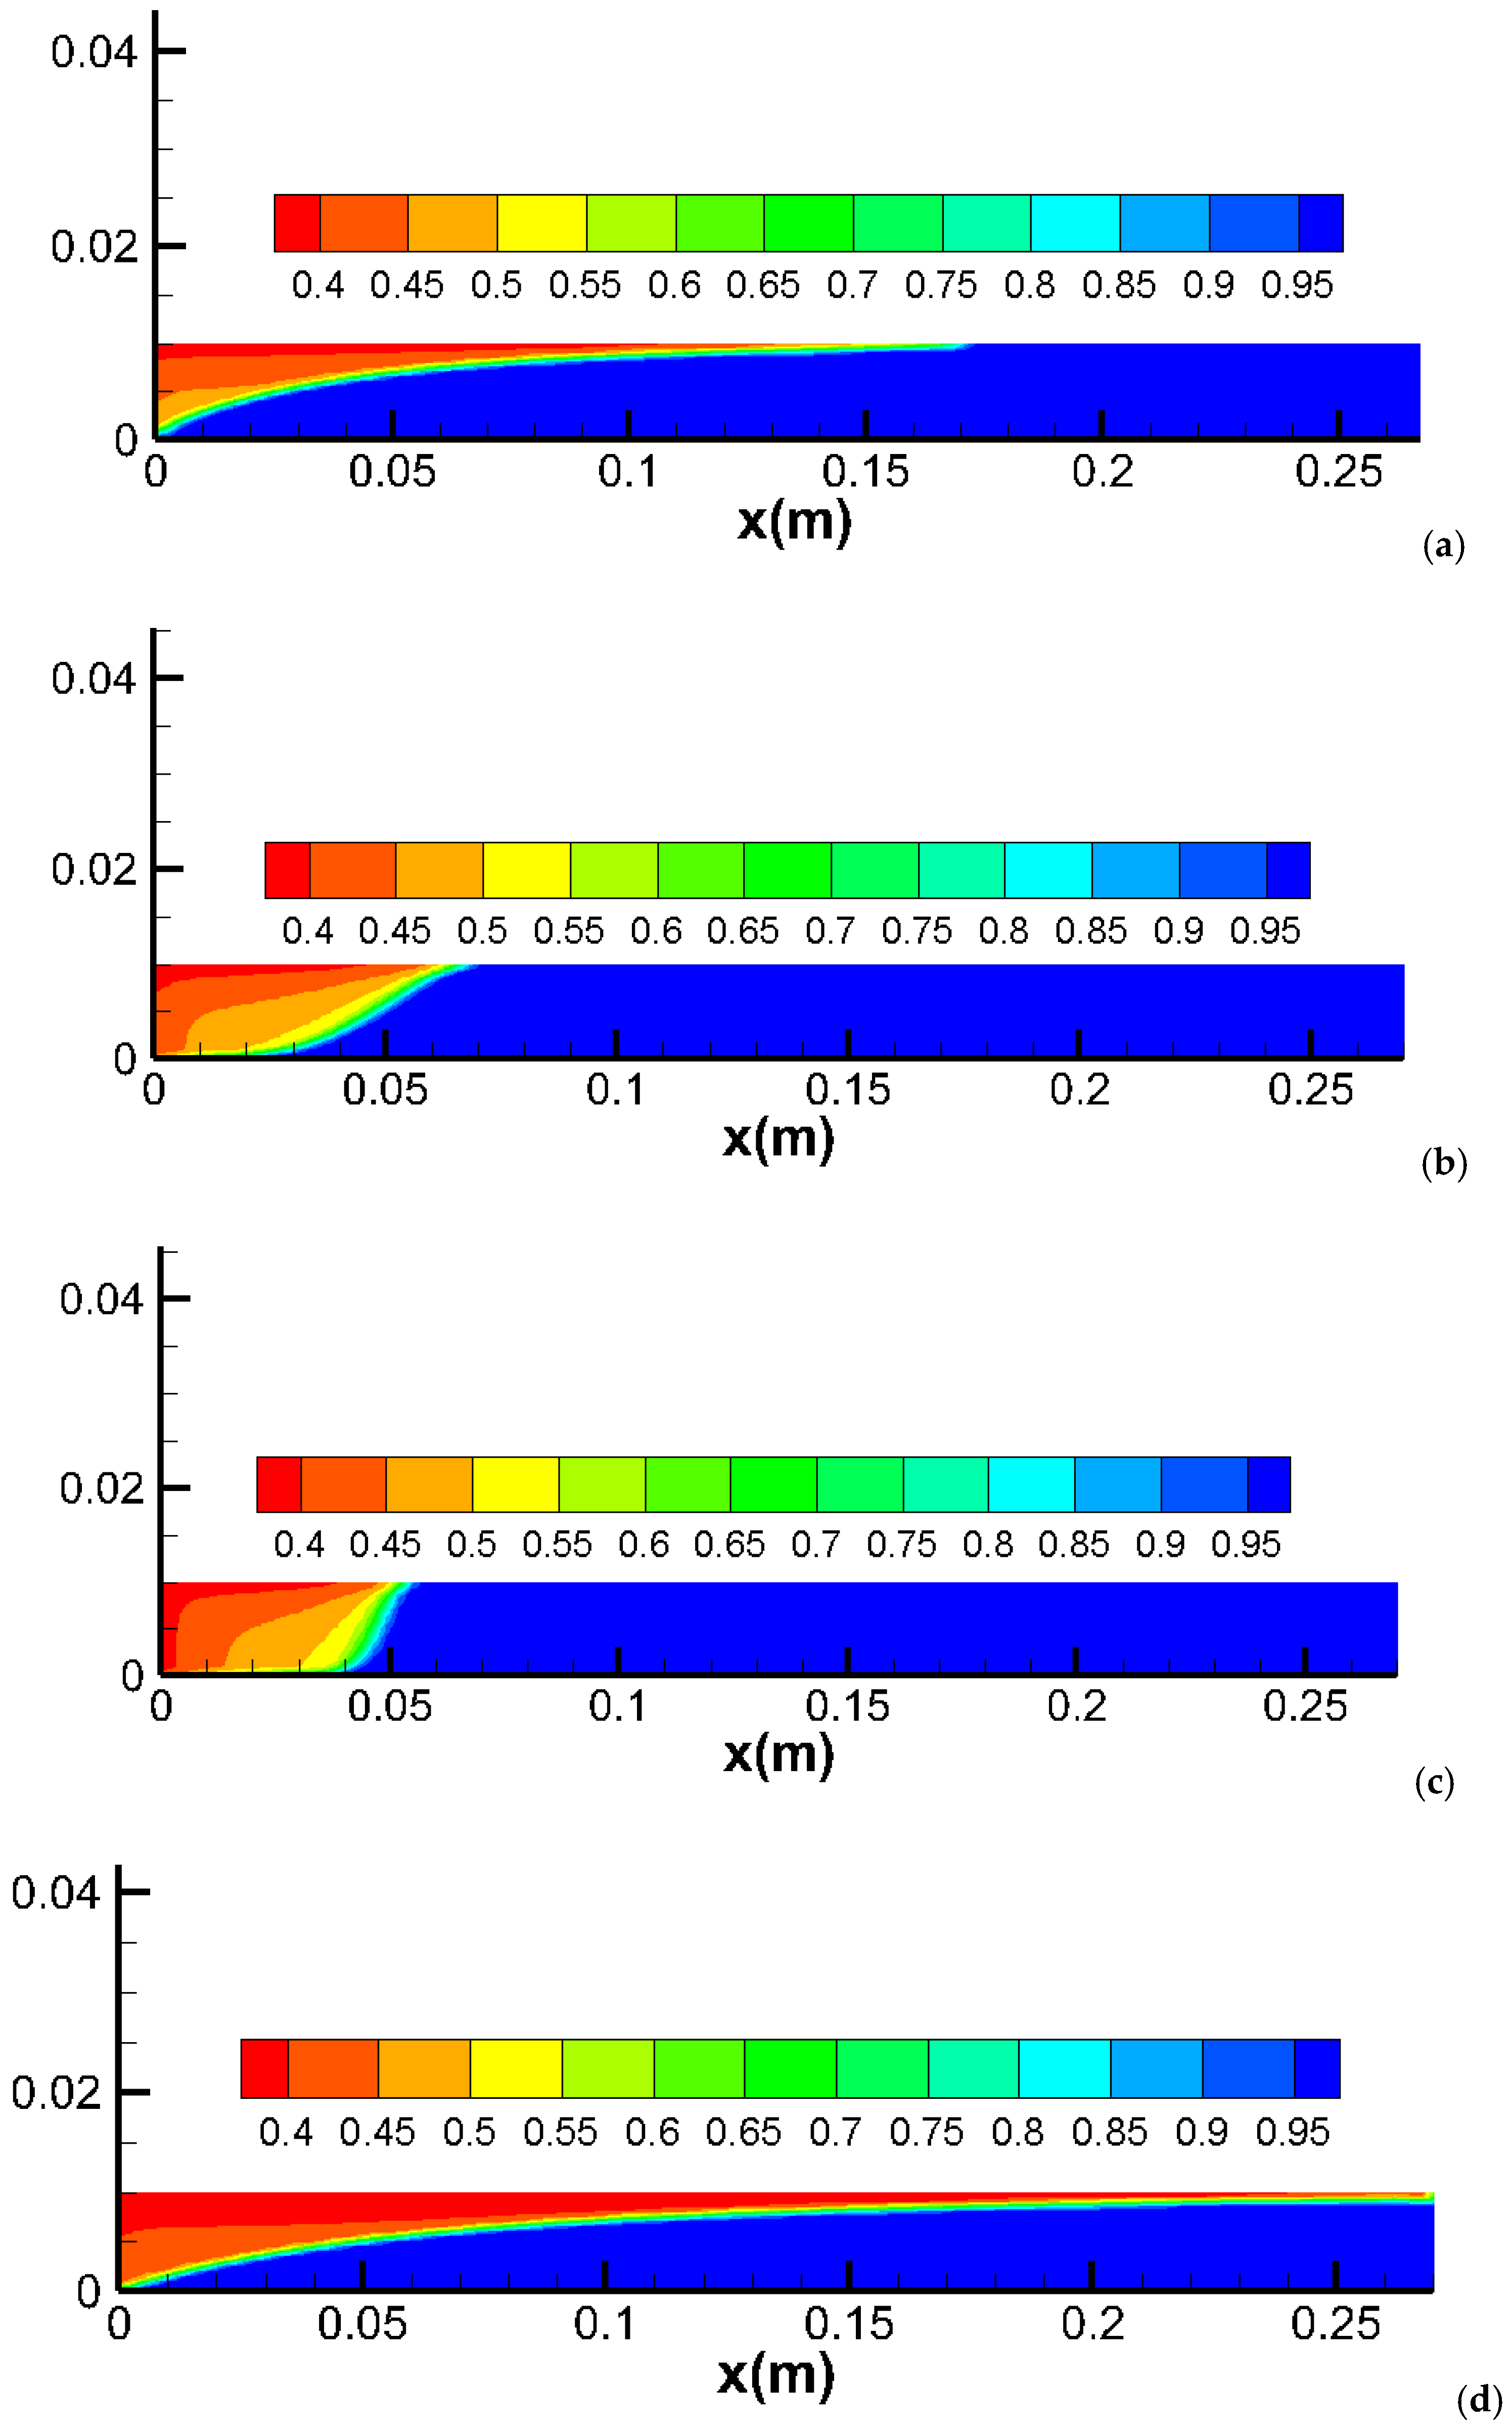
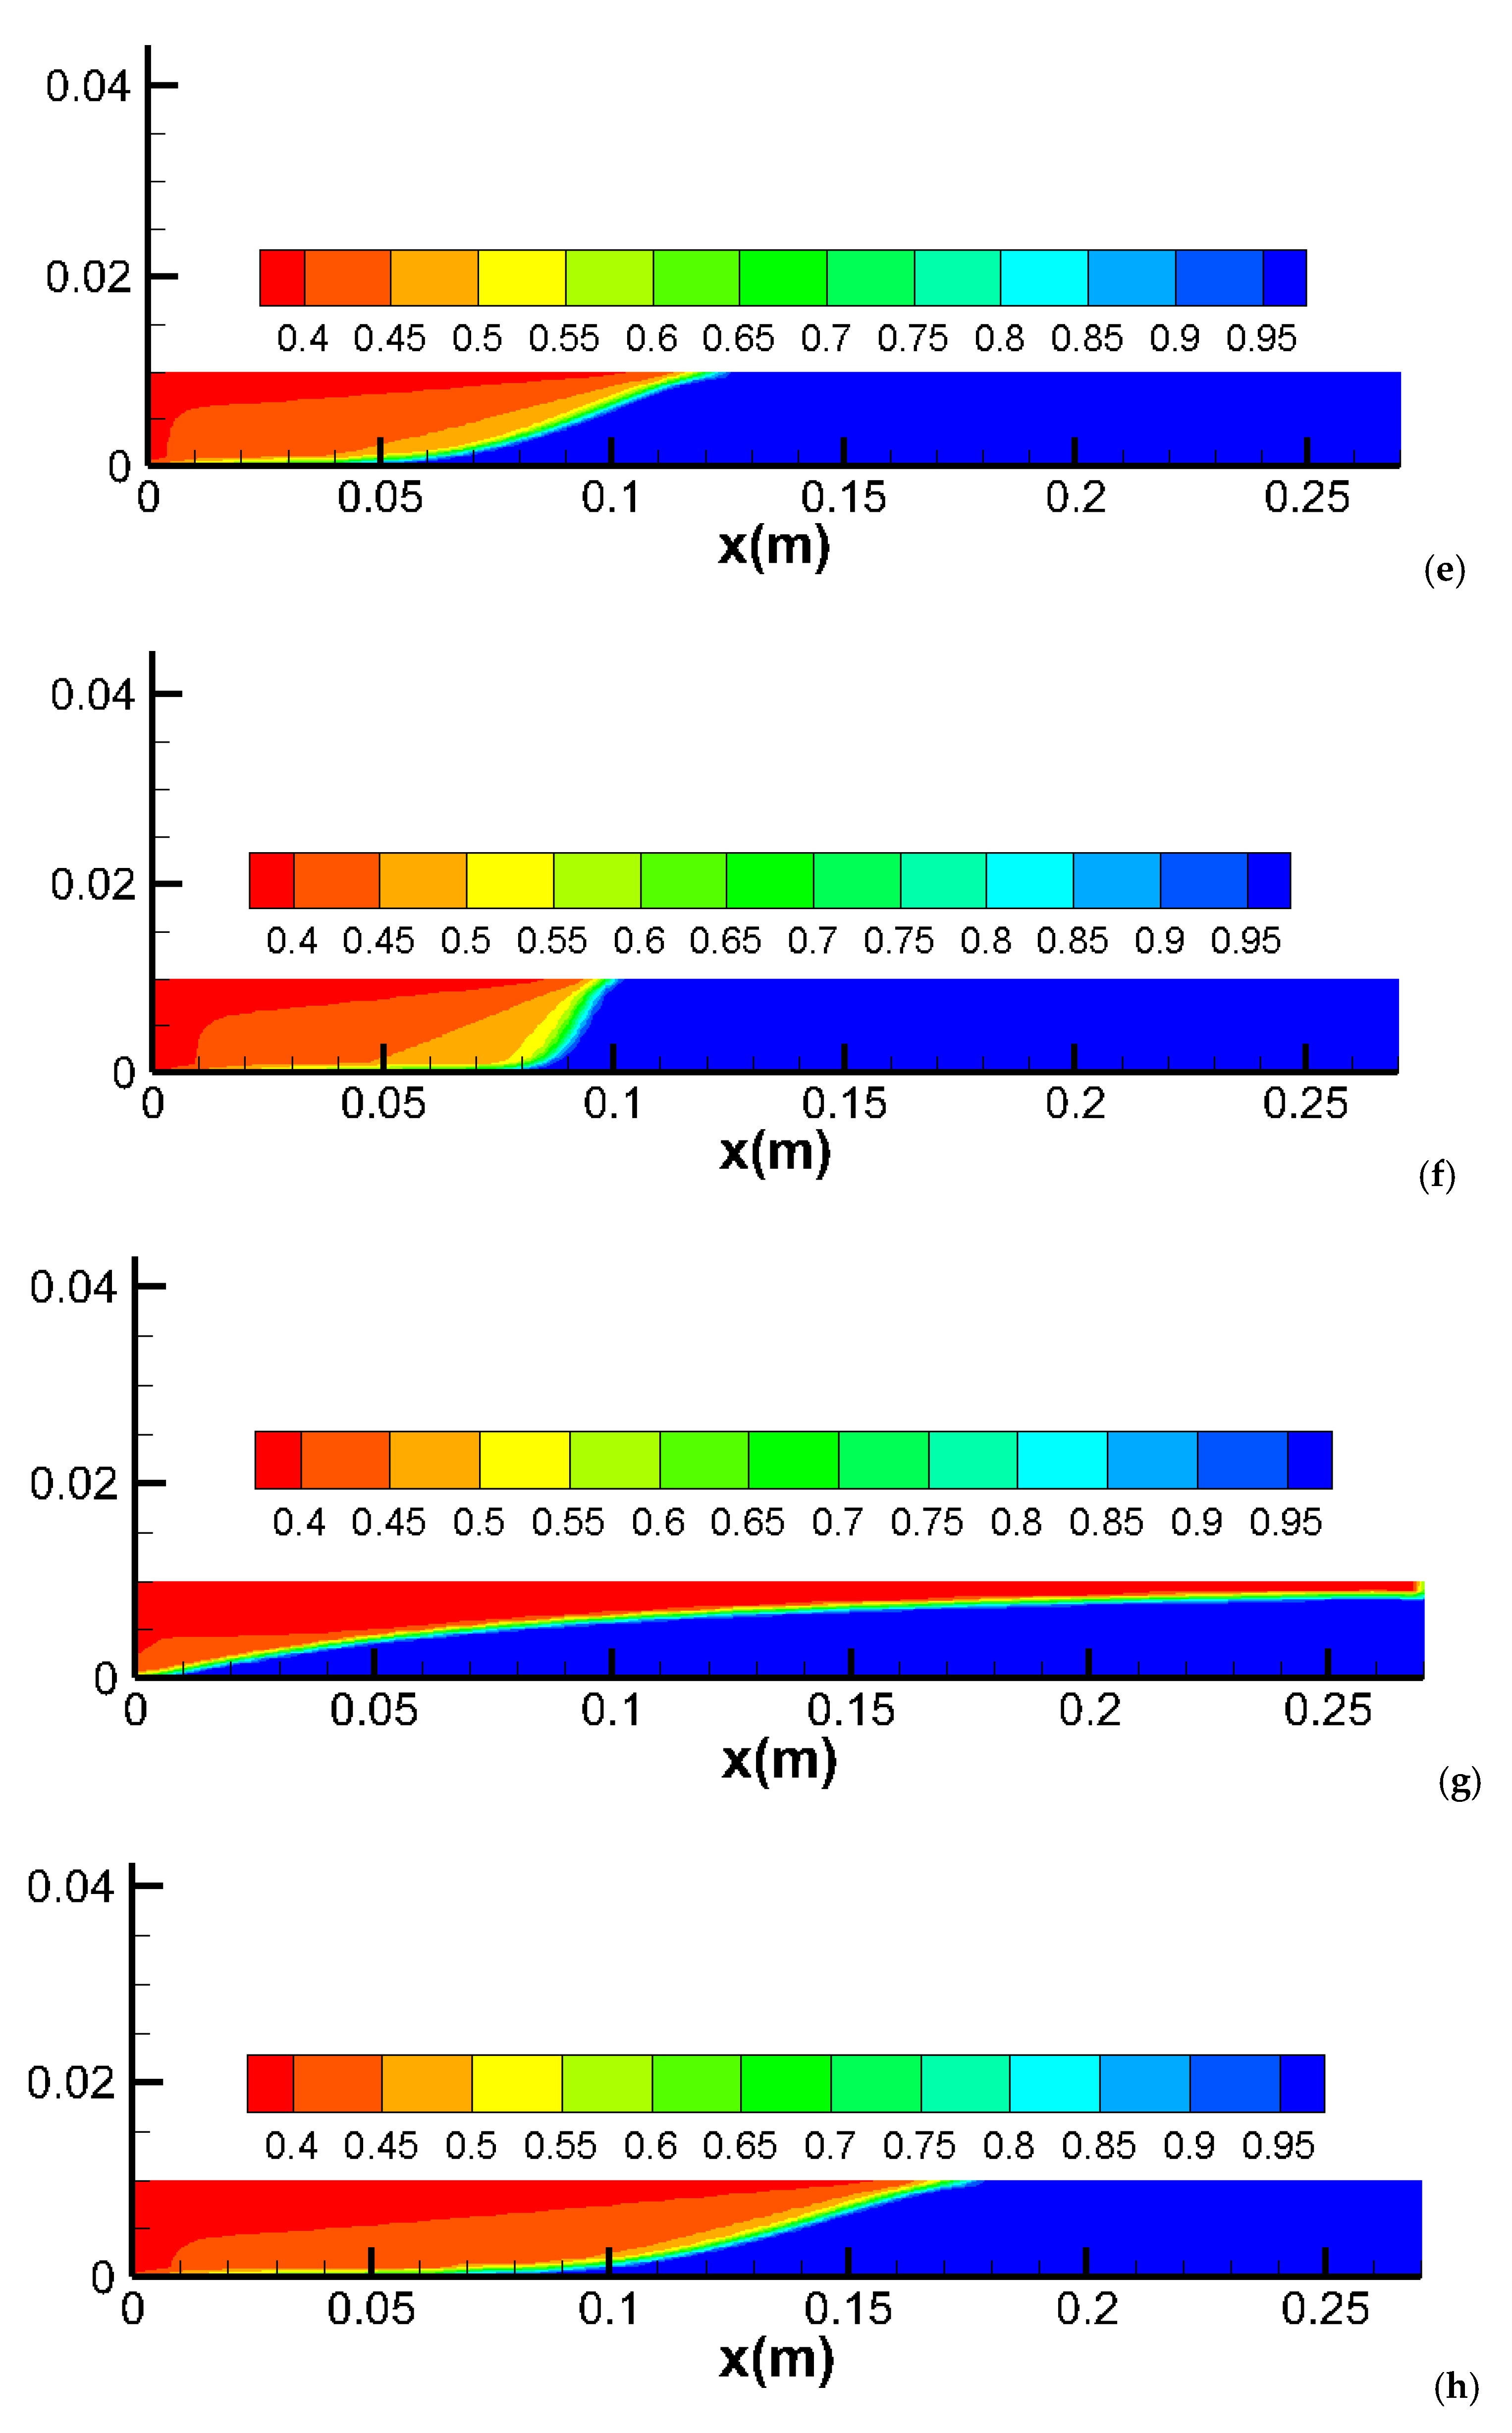
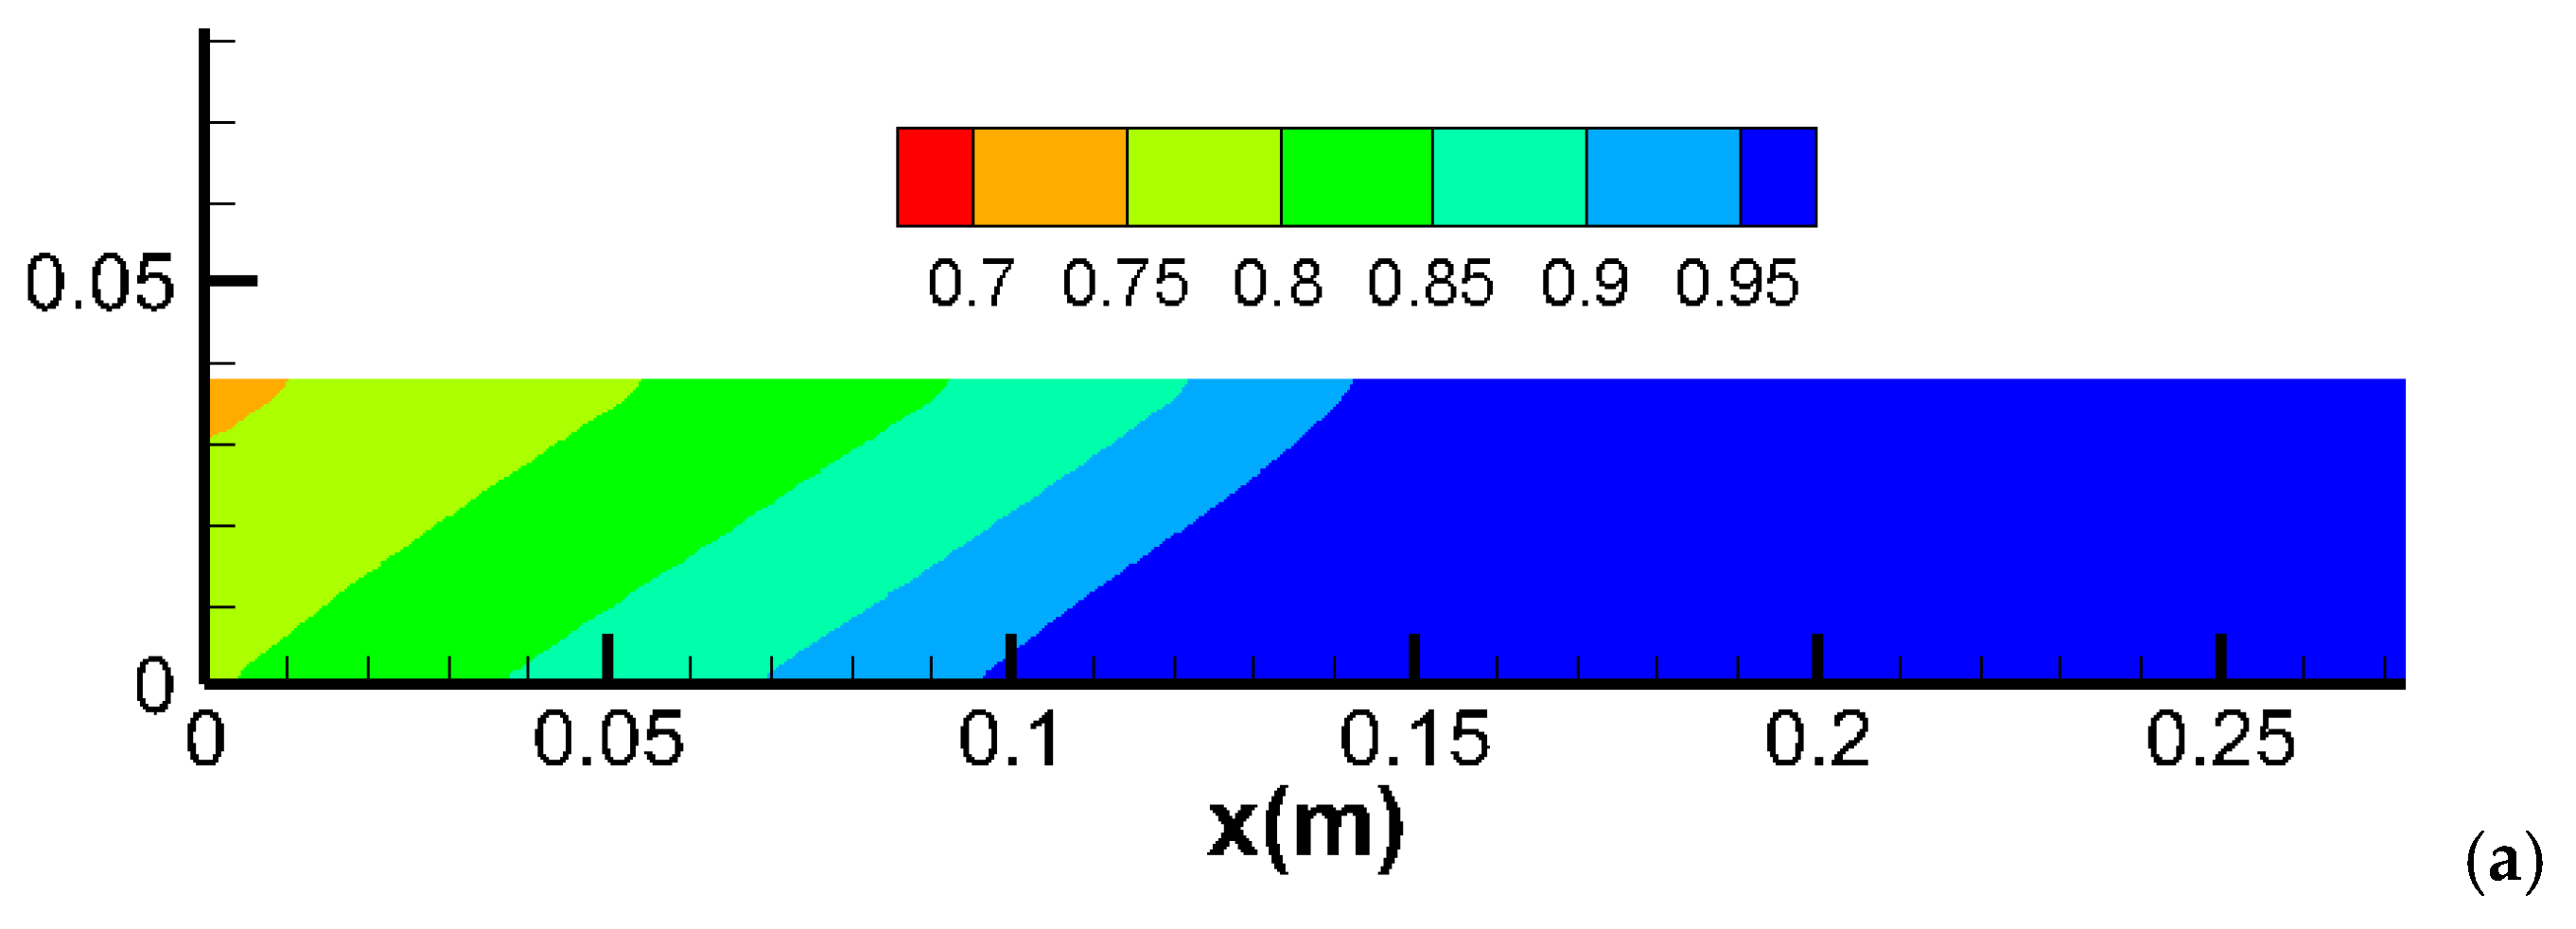
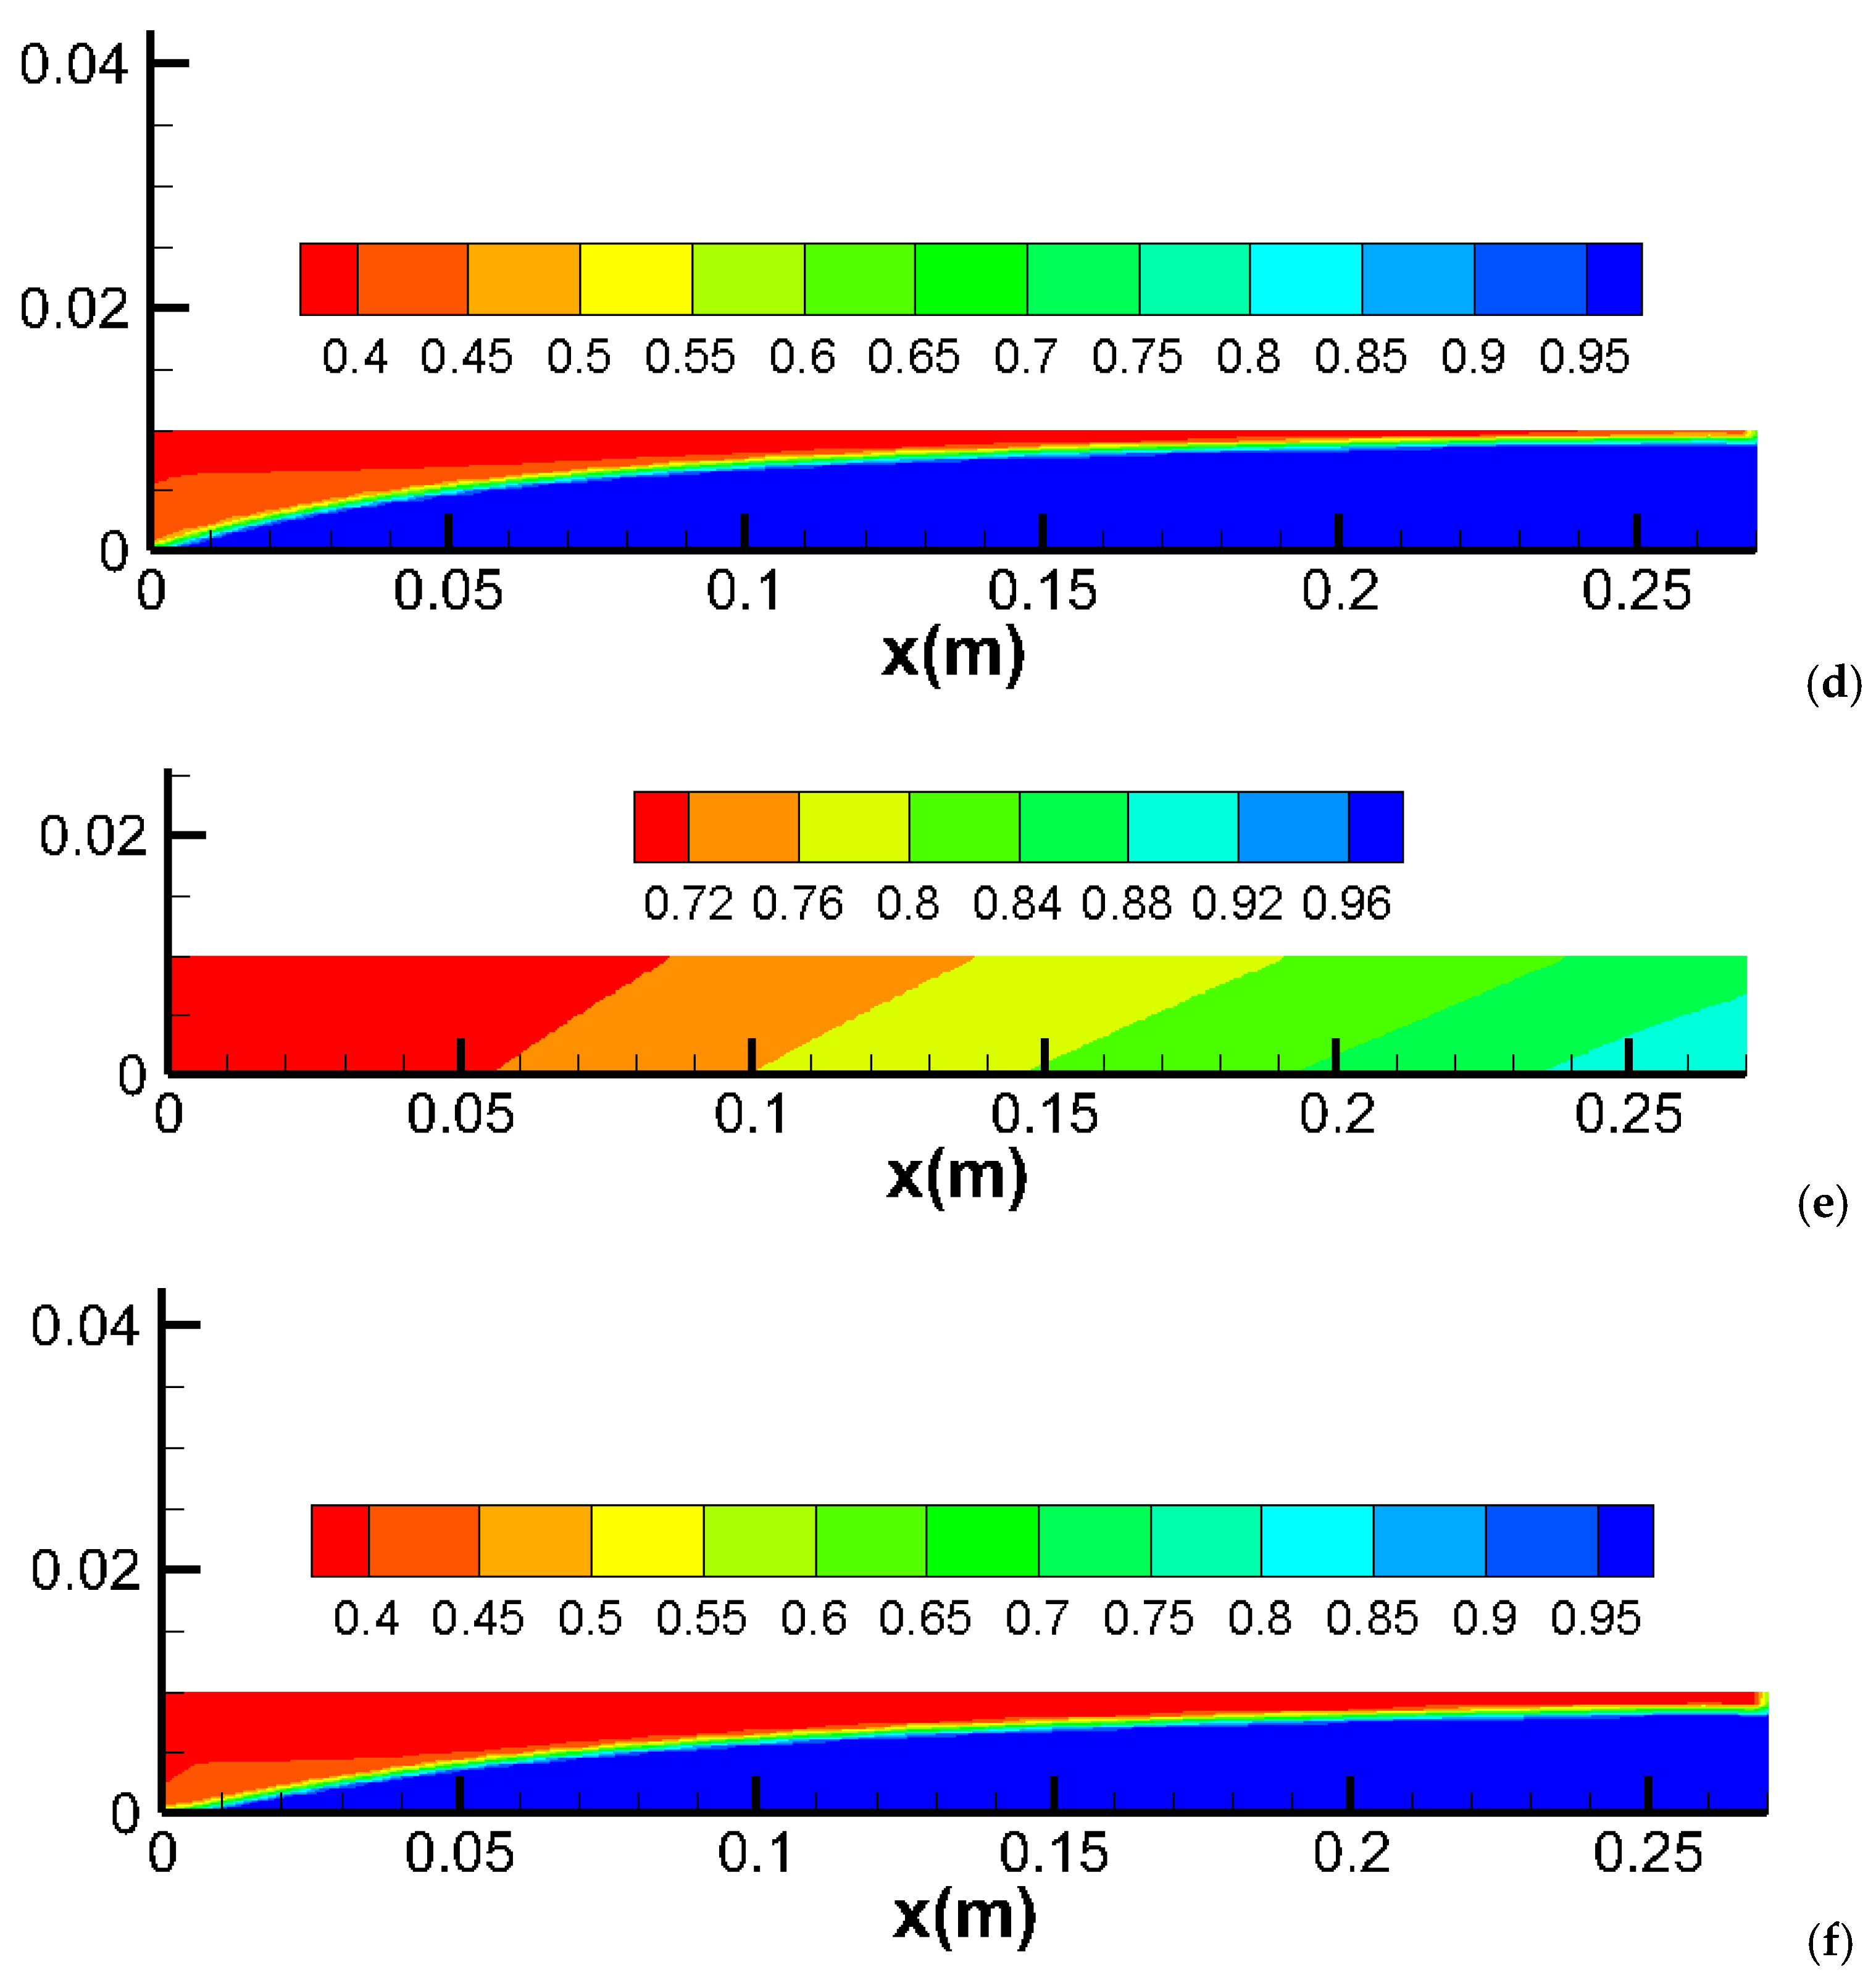
This example examines a thinner core with a thickness of 1 cm. The same cases as in the previous example are studied—the base case with no viscosification, and the two viscosification cases with factors of 5 and 10. Figure 4a–i illustrate the water saturation for the three cases at different pore volume injections (PVI). The water production results, shown in Figure 5, exhibit a similar trend to what was observed in the previous example with a 3.8 cm thickness.

2.3. Effect of Capillary Pressure

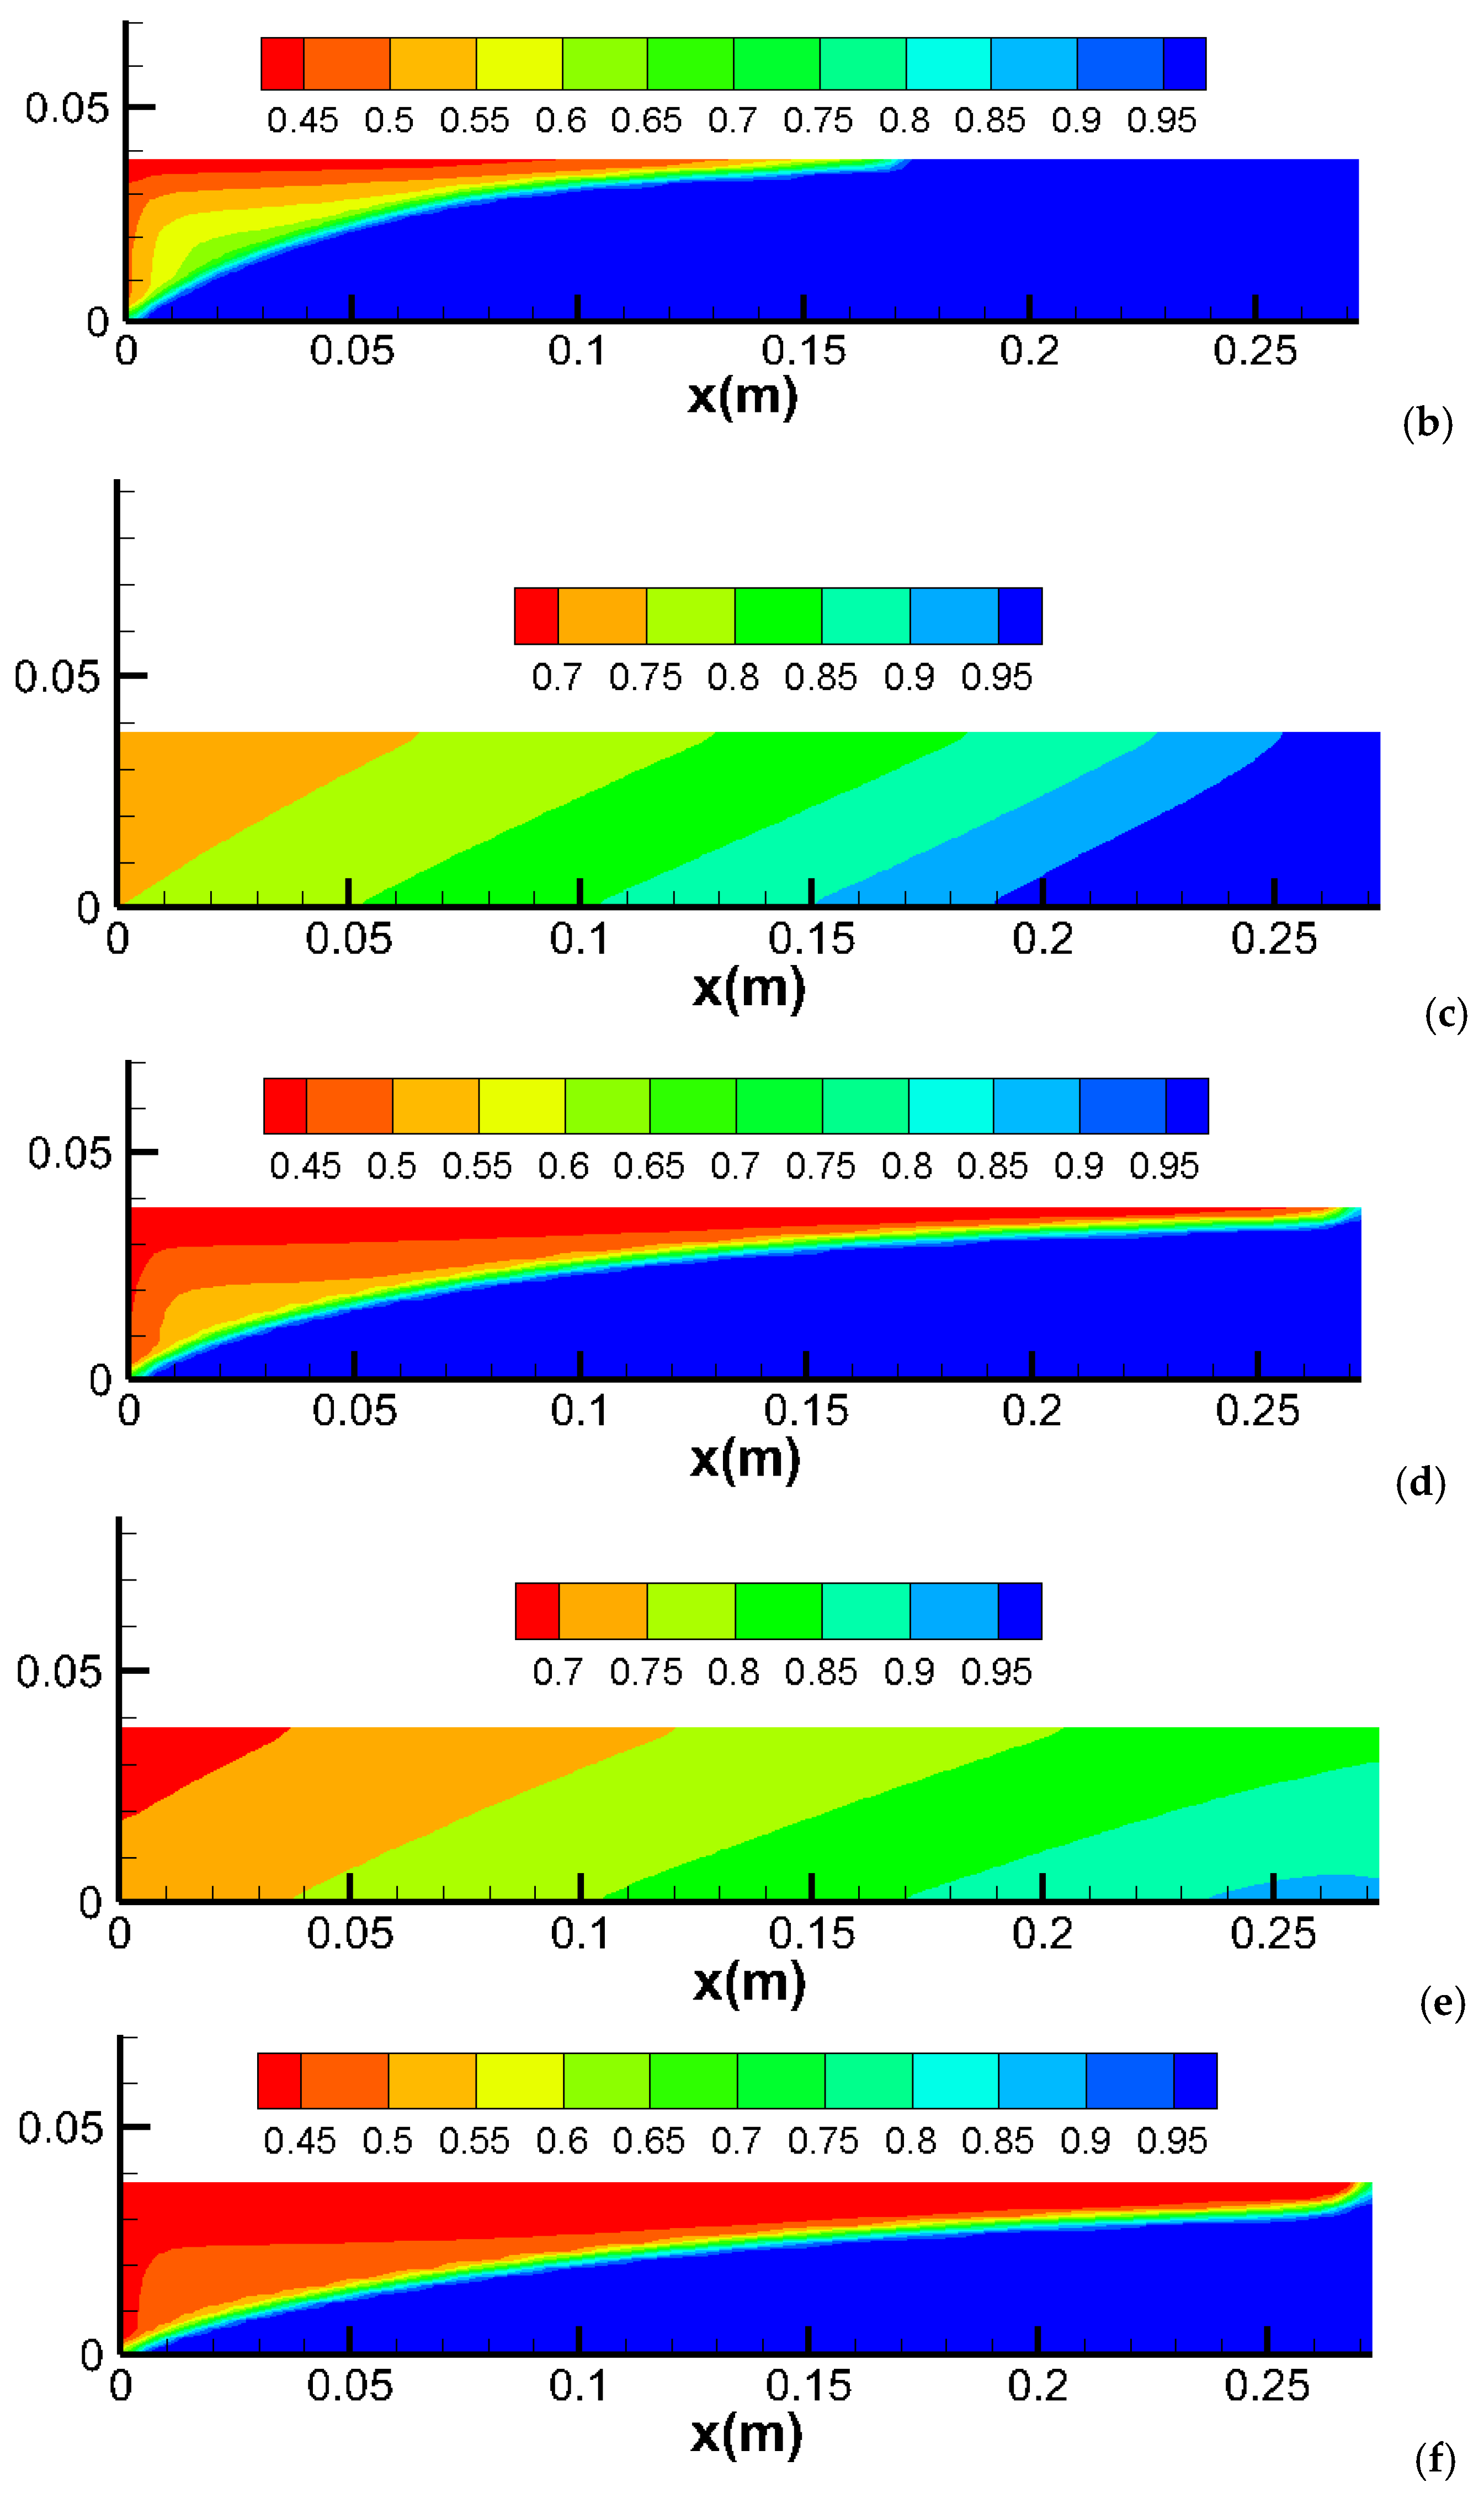
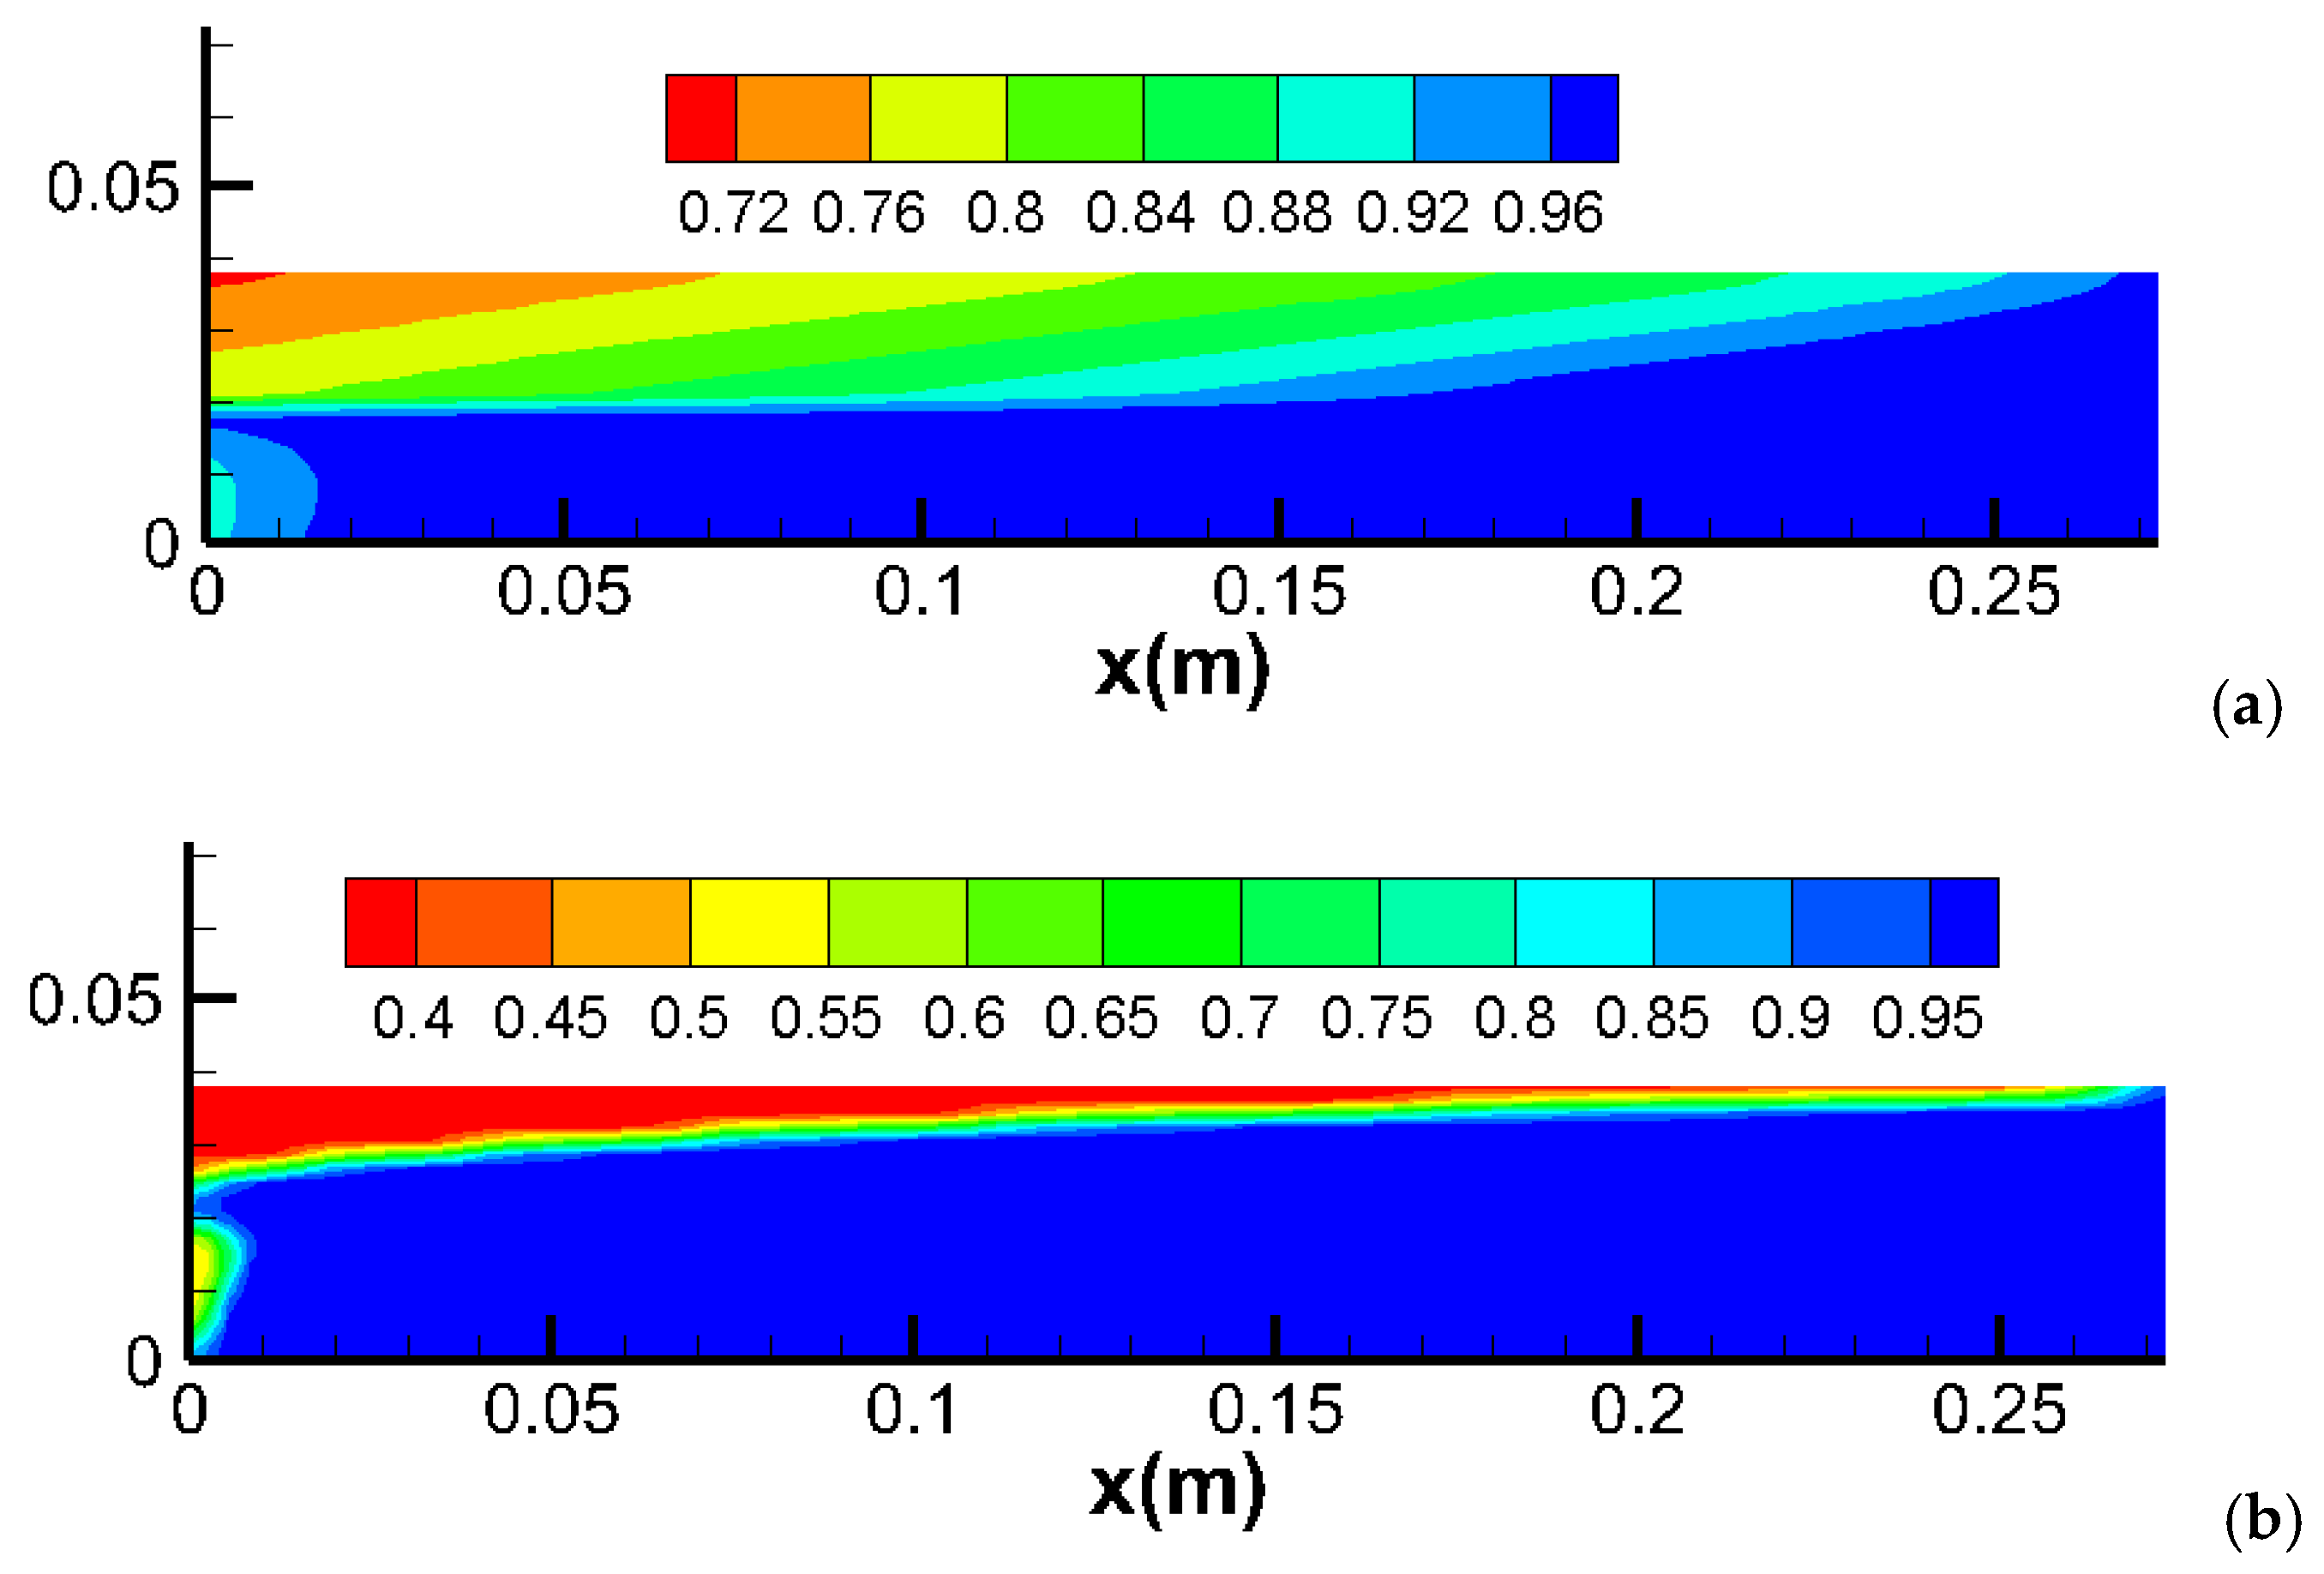
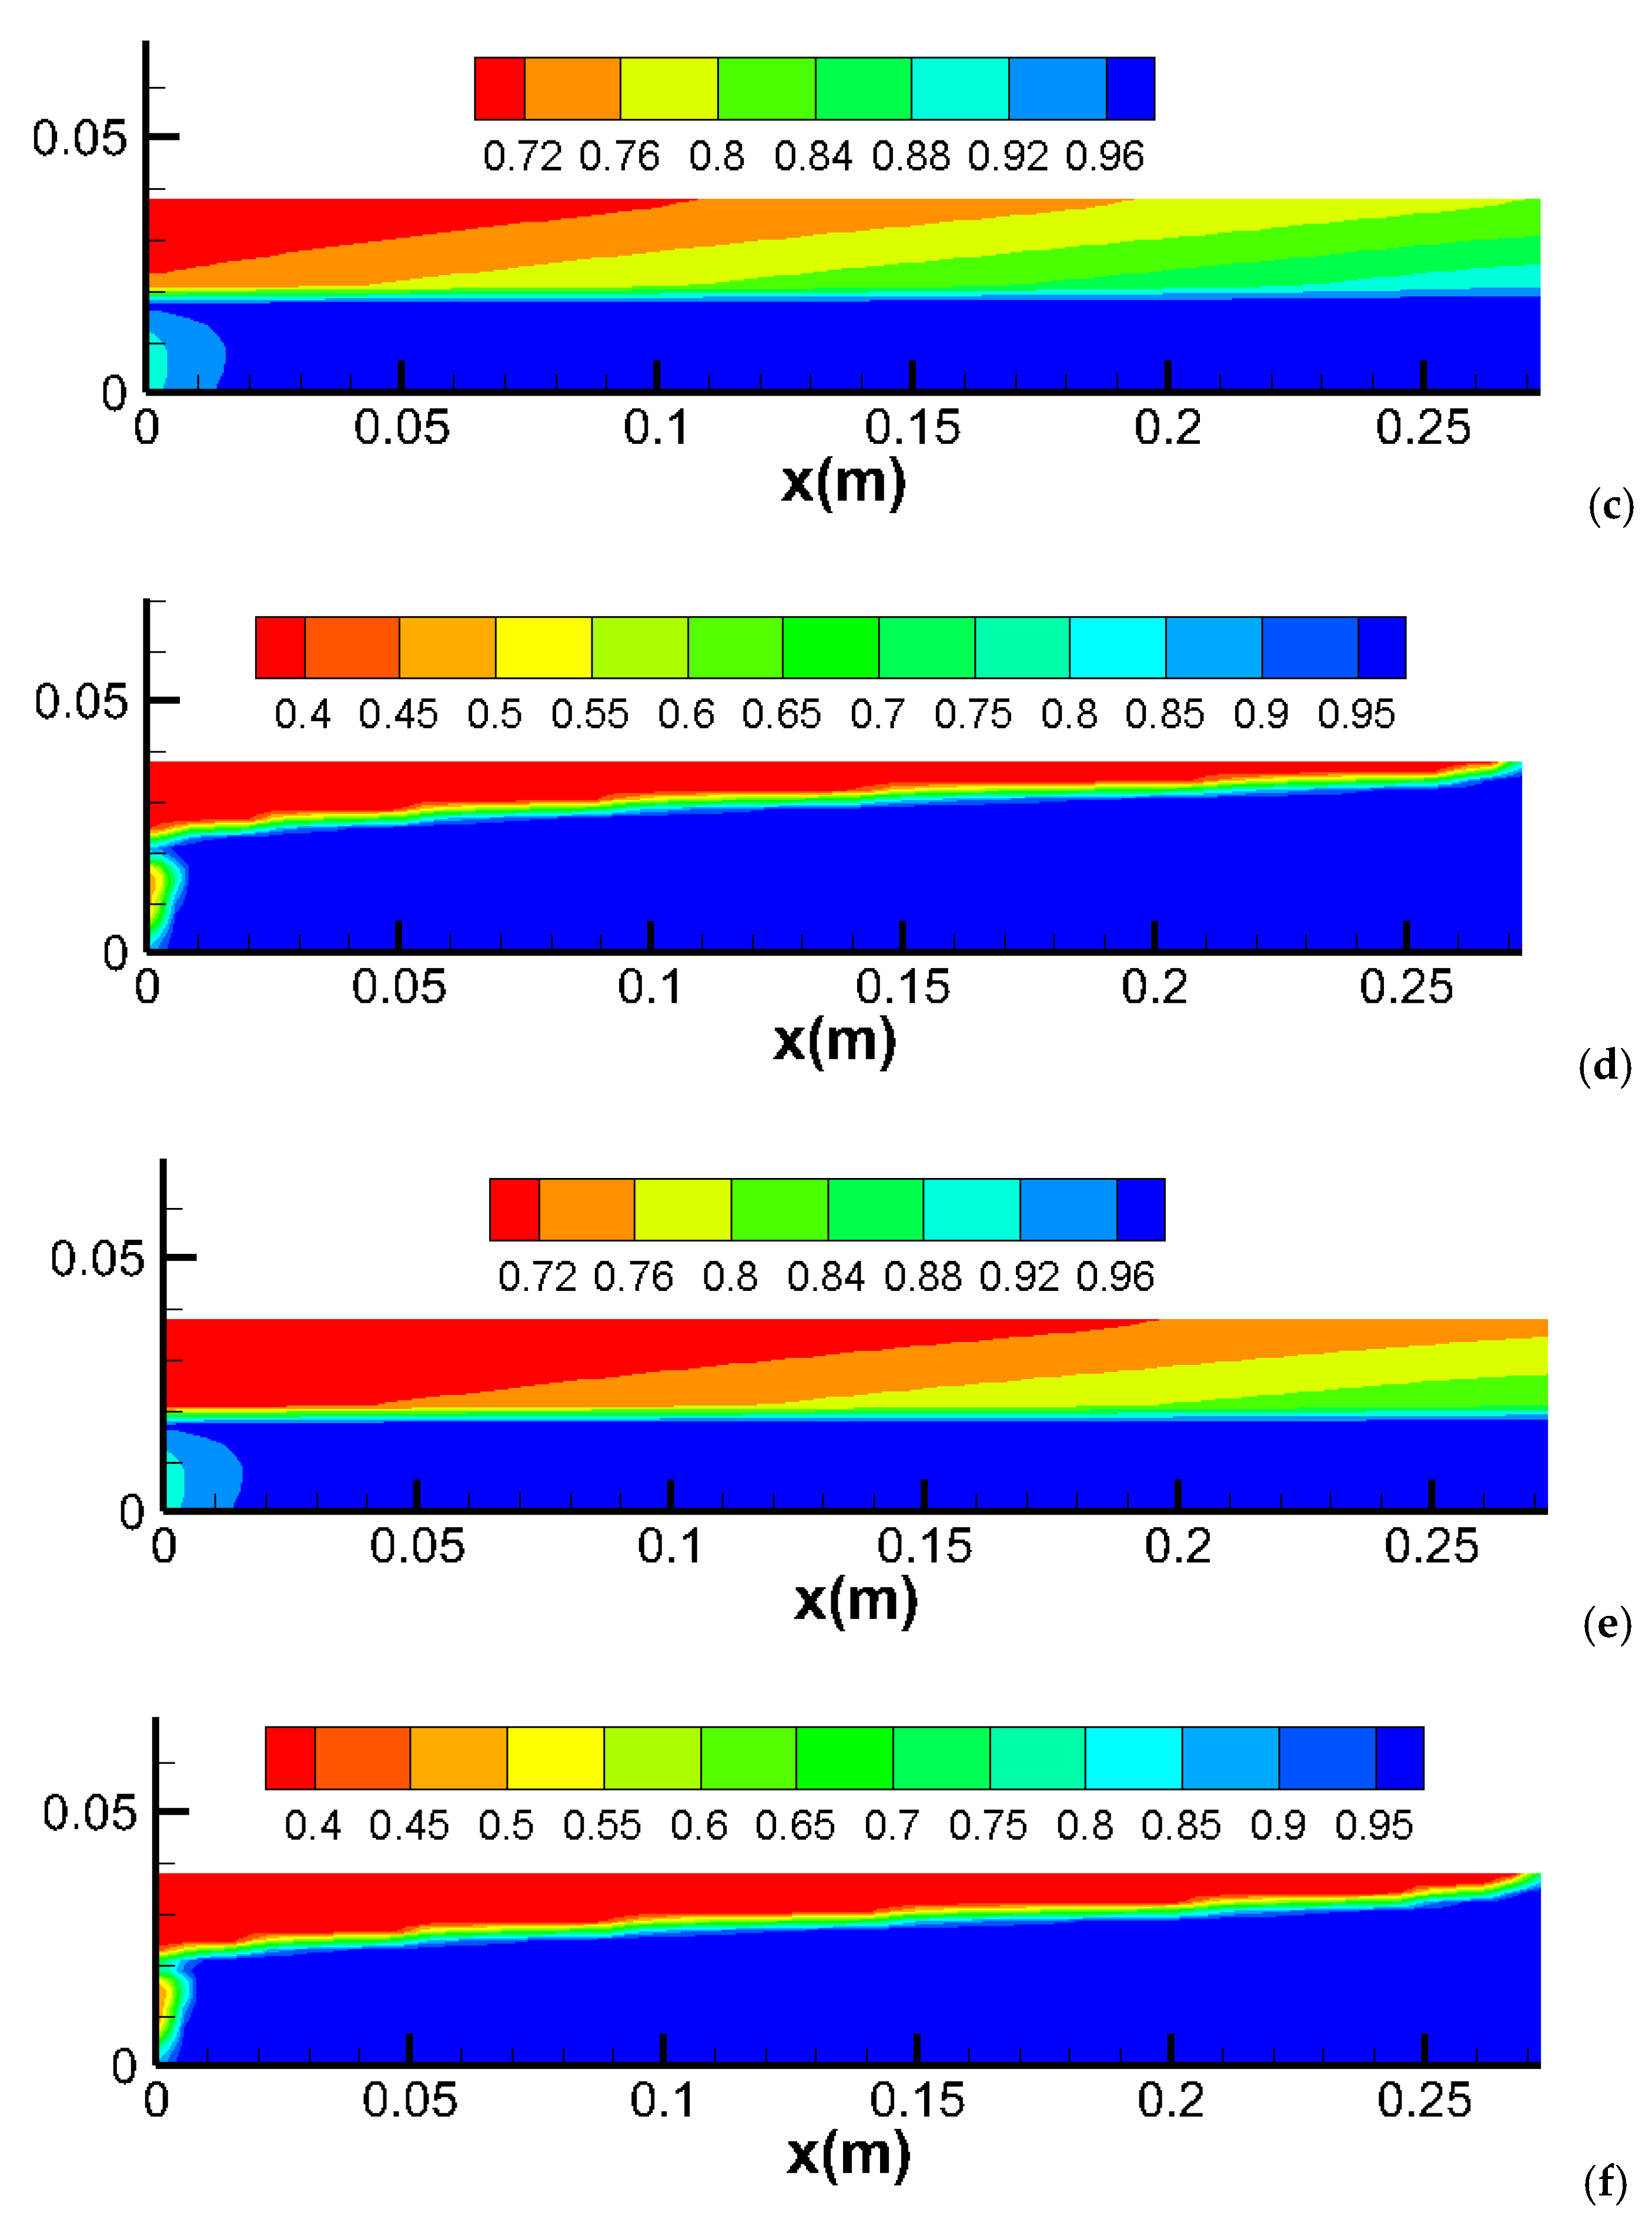
This example investigates the effect of capillary pressure (Pc) using the original core with a thickness of 3.8 cm. All conditions remain the same as in the previous examples. The following two test cases are considered: one includes the effect of capillary pressure, and the other serves as the base case without capillary pressure. The capillary pressure function used in the simulations is derived from reference [27]. Figure 6a–f illustrate the water saturation with and without capillary pressure at different pore volume injections (PVI).
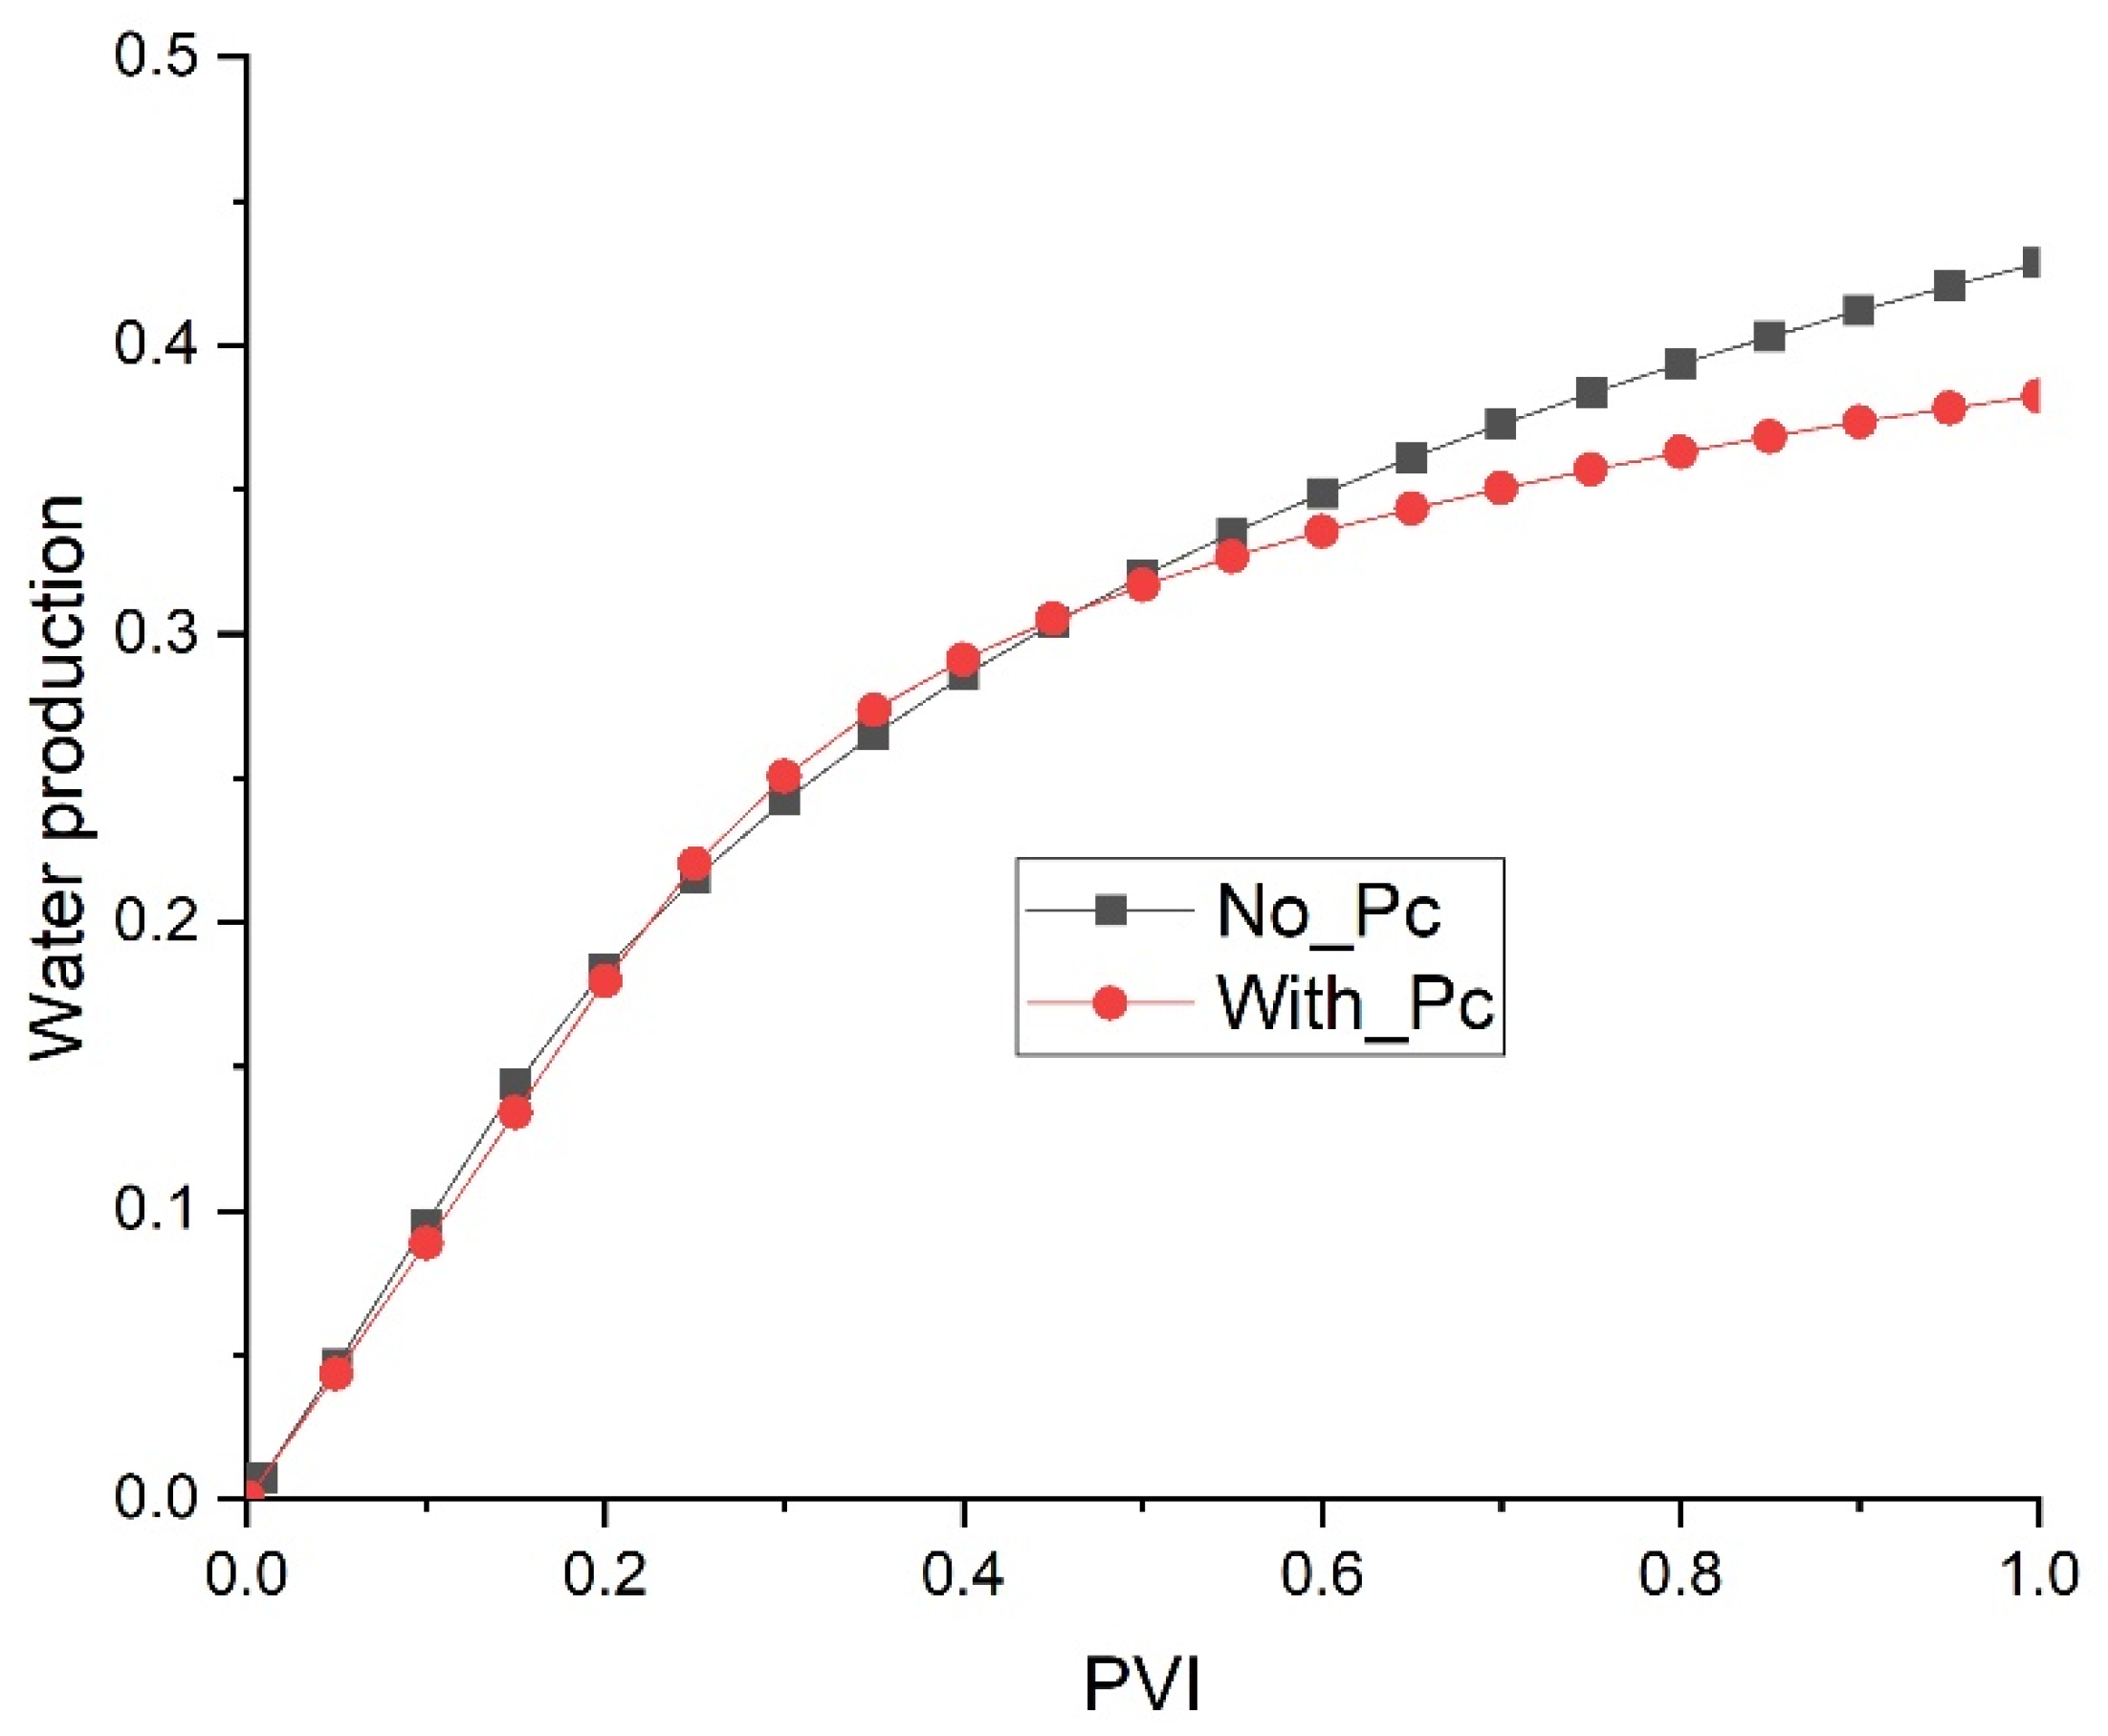
The introduction of capillary pressure results in a significant change in the saturation profiles. Although capillary pressure delays the breakthrough, it also decreases the sweeping efficiency. Consequently, water production with capillary pressure is lower compared to the base case without capillary pressure, as illustrated in Figure 7.

2.4. Capillary Pressure in a Heterogeneous Core

Similar to the previous example, this study examines the effect of capillary pressure in a heterogeneous core. The 3.8 cm core is divided horizontally into two layers with permeability zones of 100 mD and 1000 mD, as depicted in Figure 8. Water saturation at different pore volume injections (PVI) is shown in Figure 9a–f.
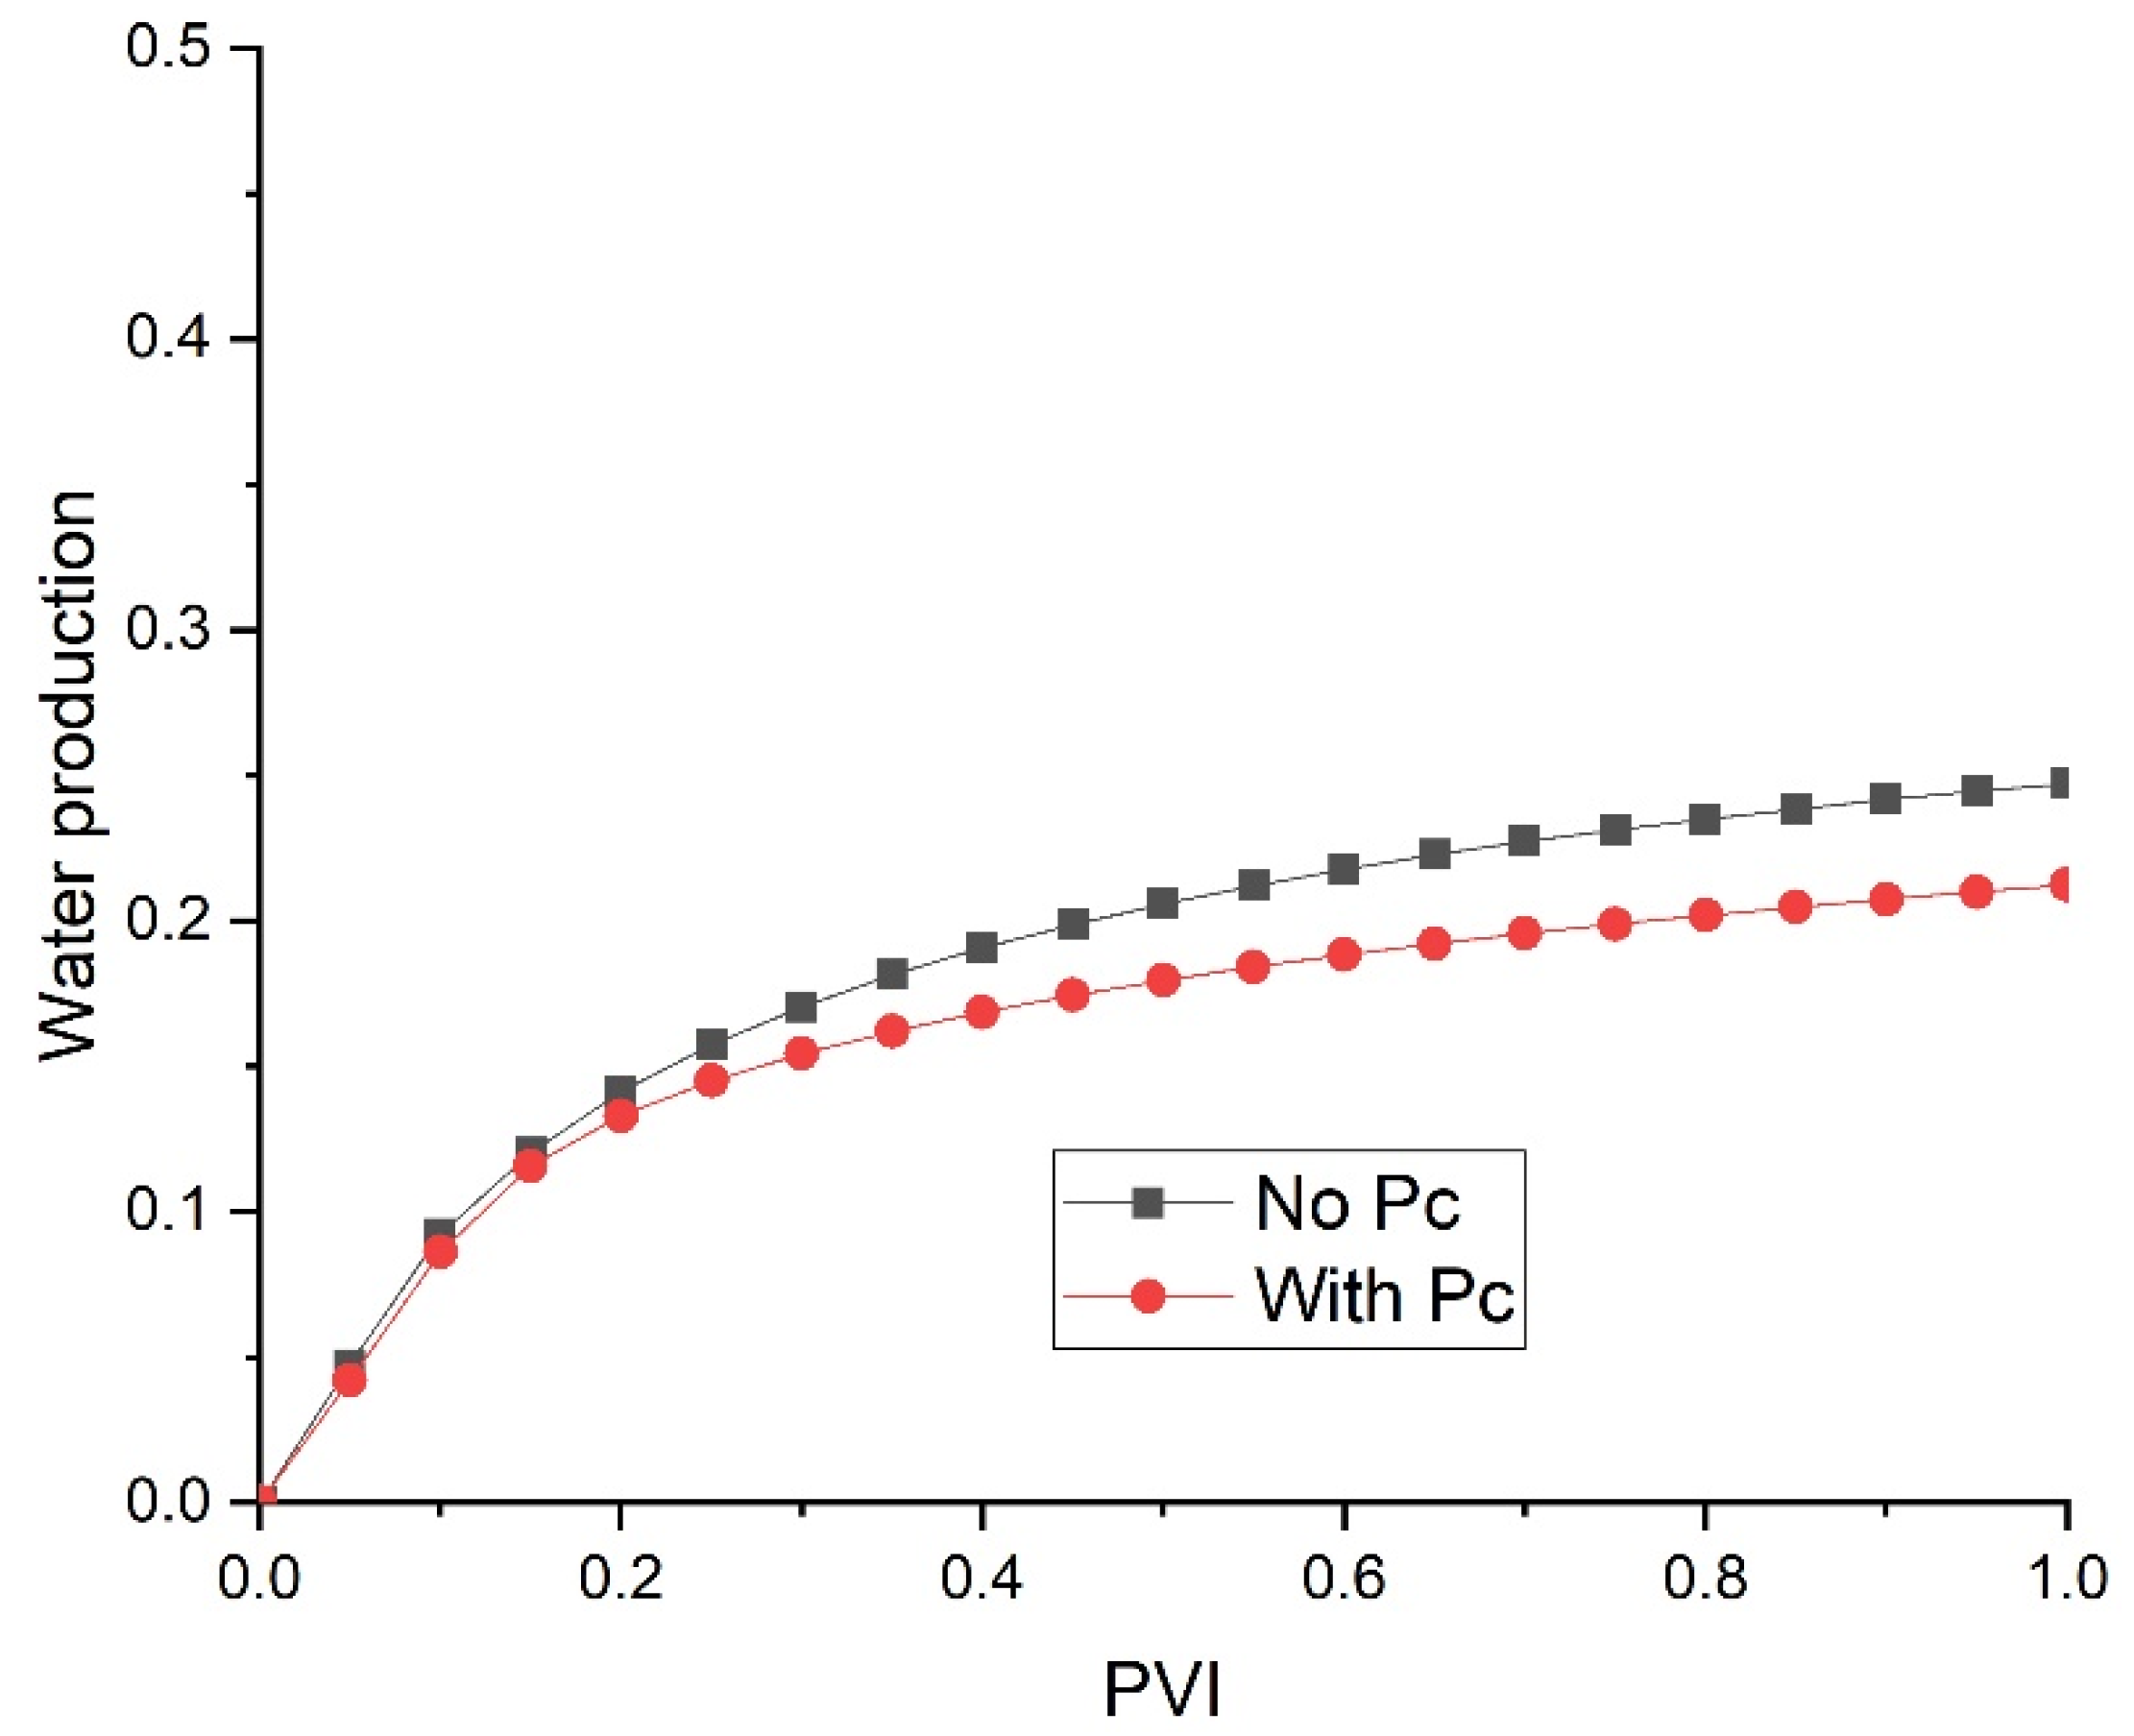
The water production plot (Figure 10) reveals a trend similar to that observed in the homogeneous core scenario. The low sweeping efficiency of CO2, when capillary pressure is introduced, negatively impacts water production.

2.5. Capillary Pressure in a Slim Core

This example utilizes the slim core from Example 3, with a thickness of 1 cm. The following two simulation cases are considered: one with capillary pressure and one without. Figure 11a–f display the water saturation at different pore volume injections (PVIs). Similar to the results with the 3.8 cm thick core, capillary pressure in the slim core delays the breakthrough. However, the impact on sweeping efficiency is more pronounced compared to the 3.8 cm thick core, as shown in Figure 12.

2.6. Viscosification in a Layered Core with Capillary Pressure

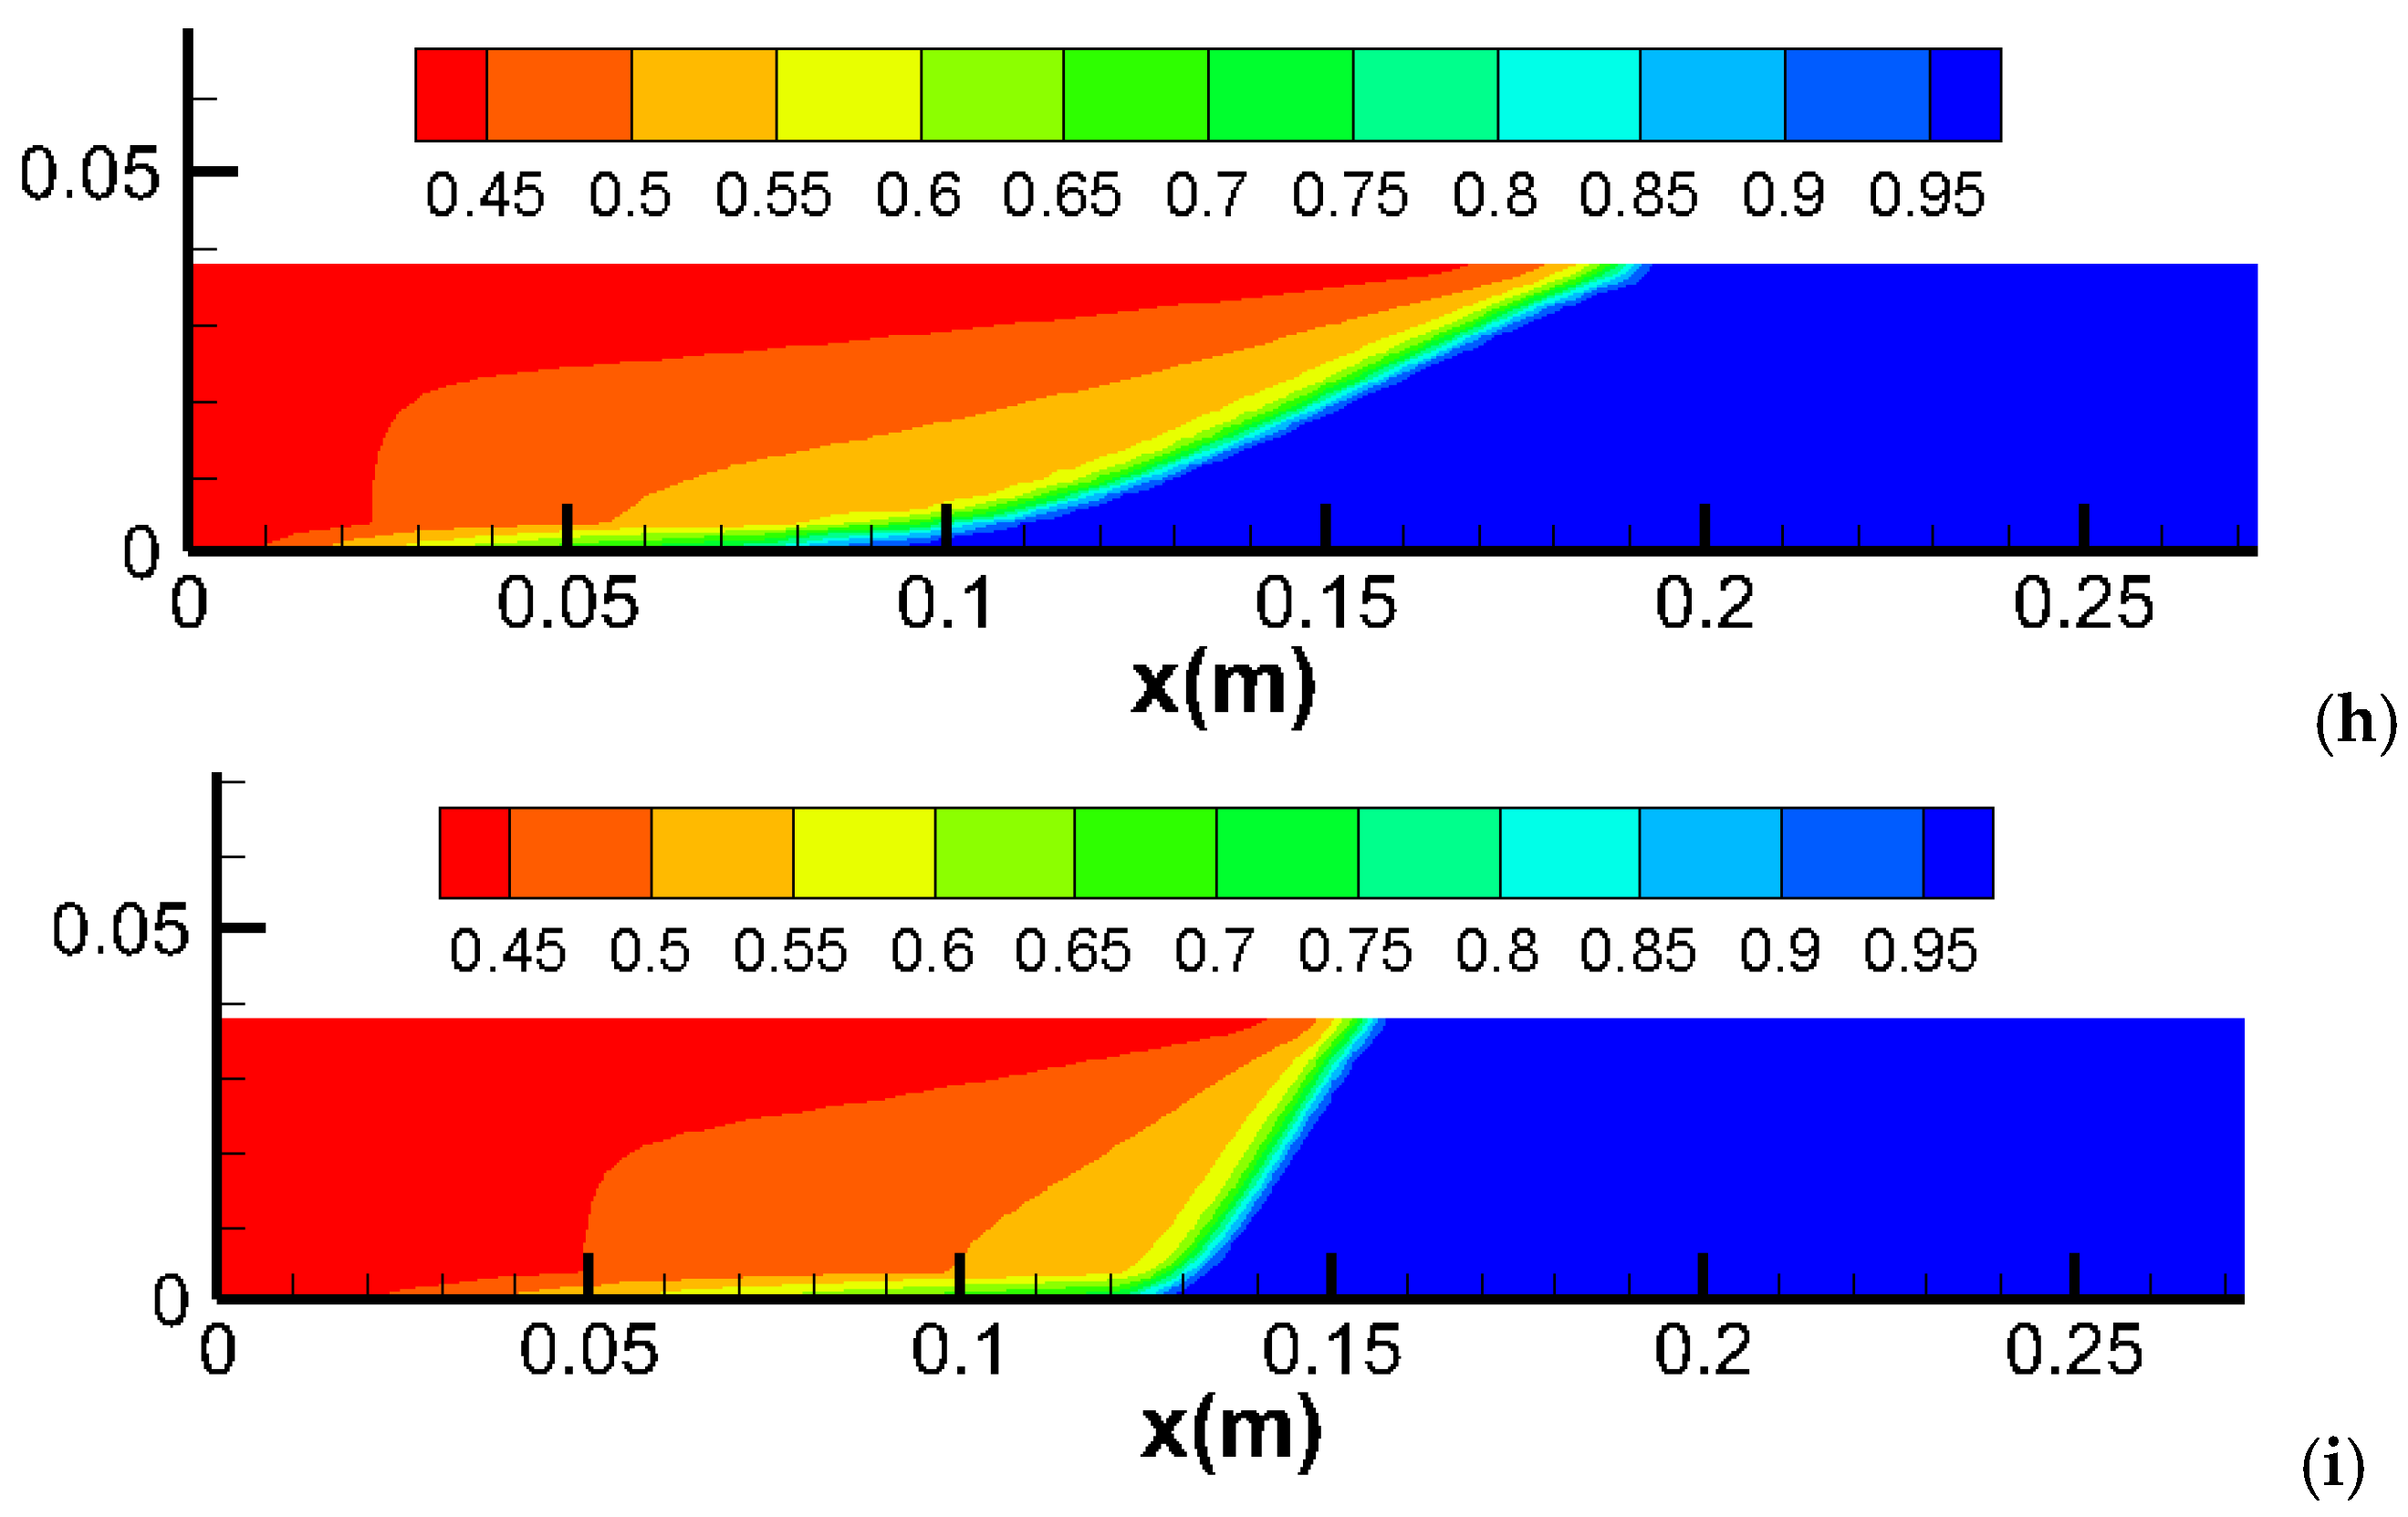
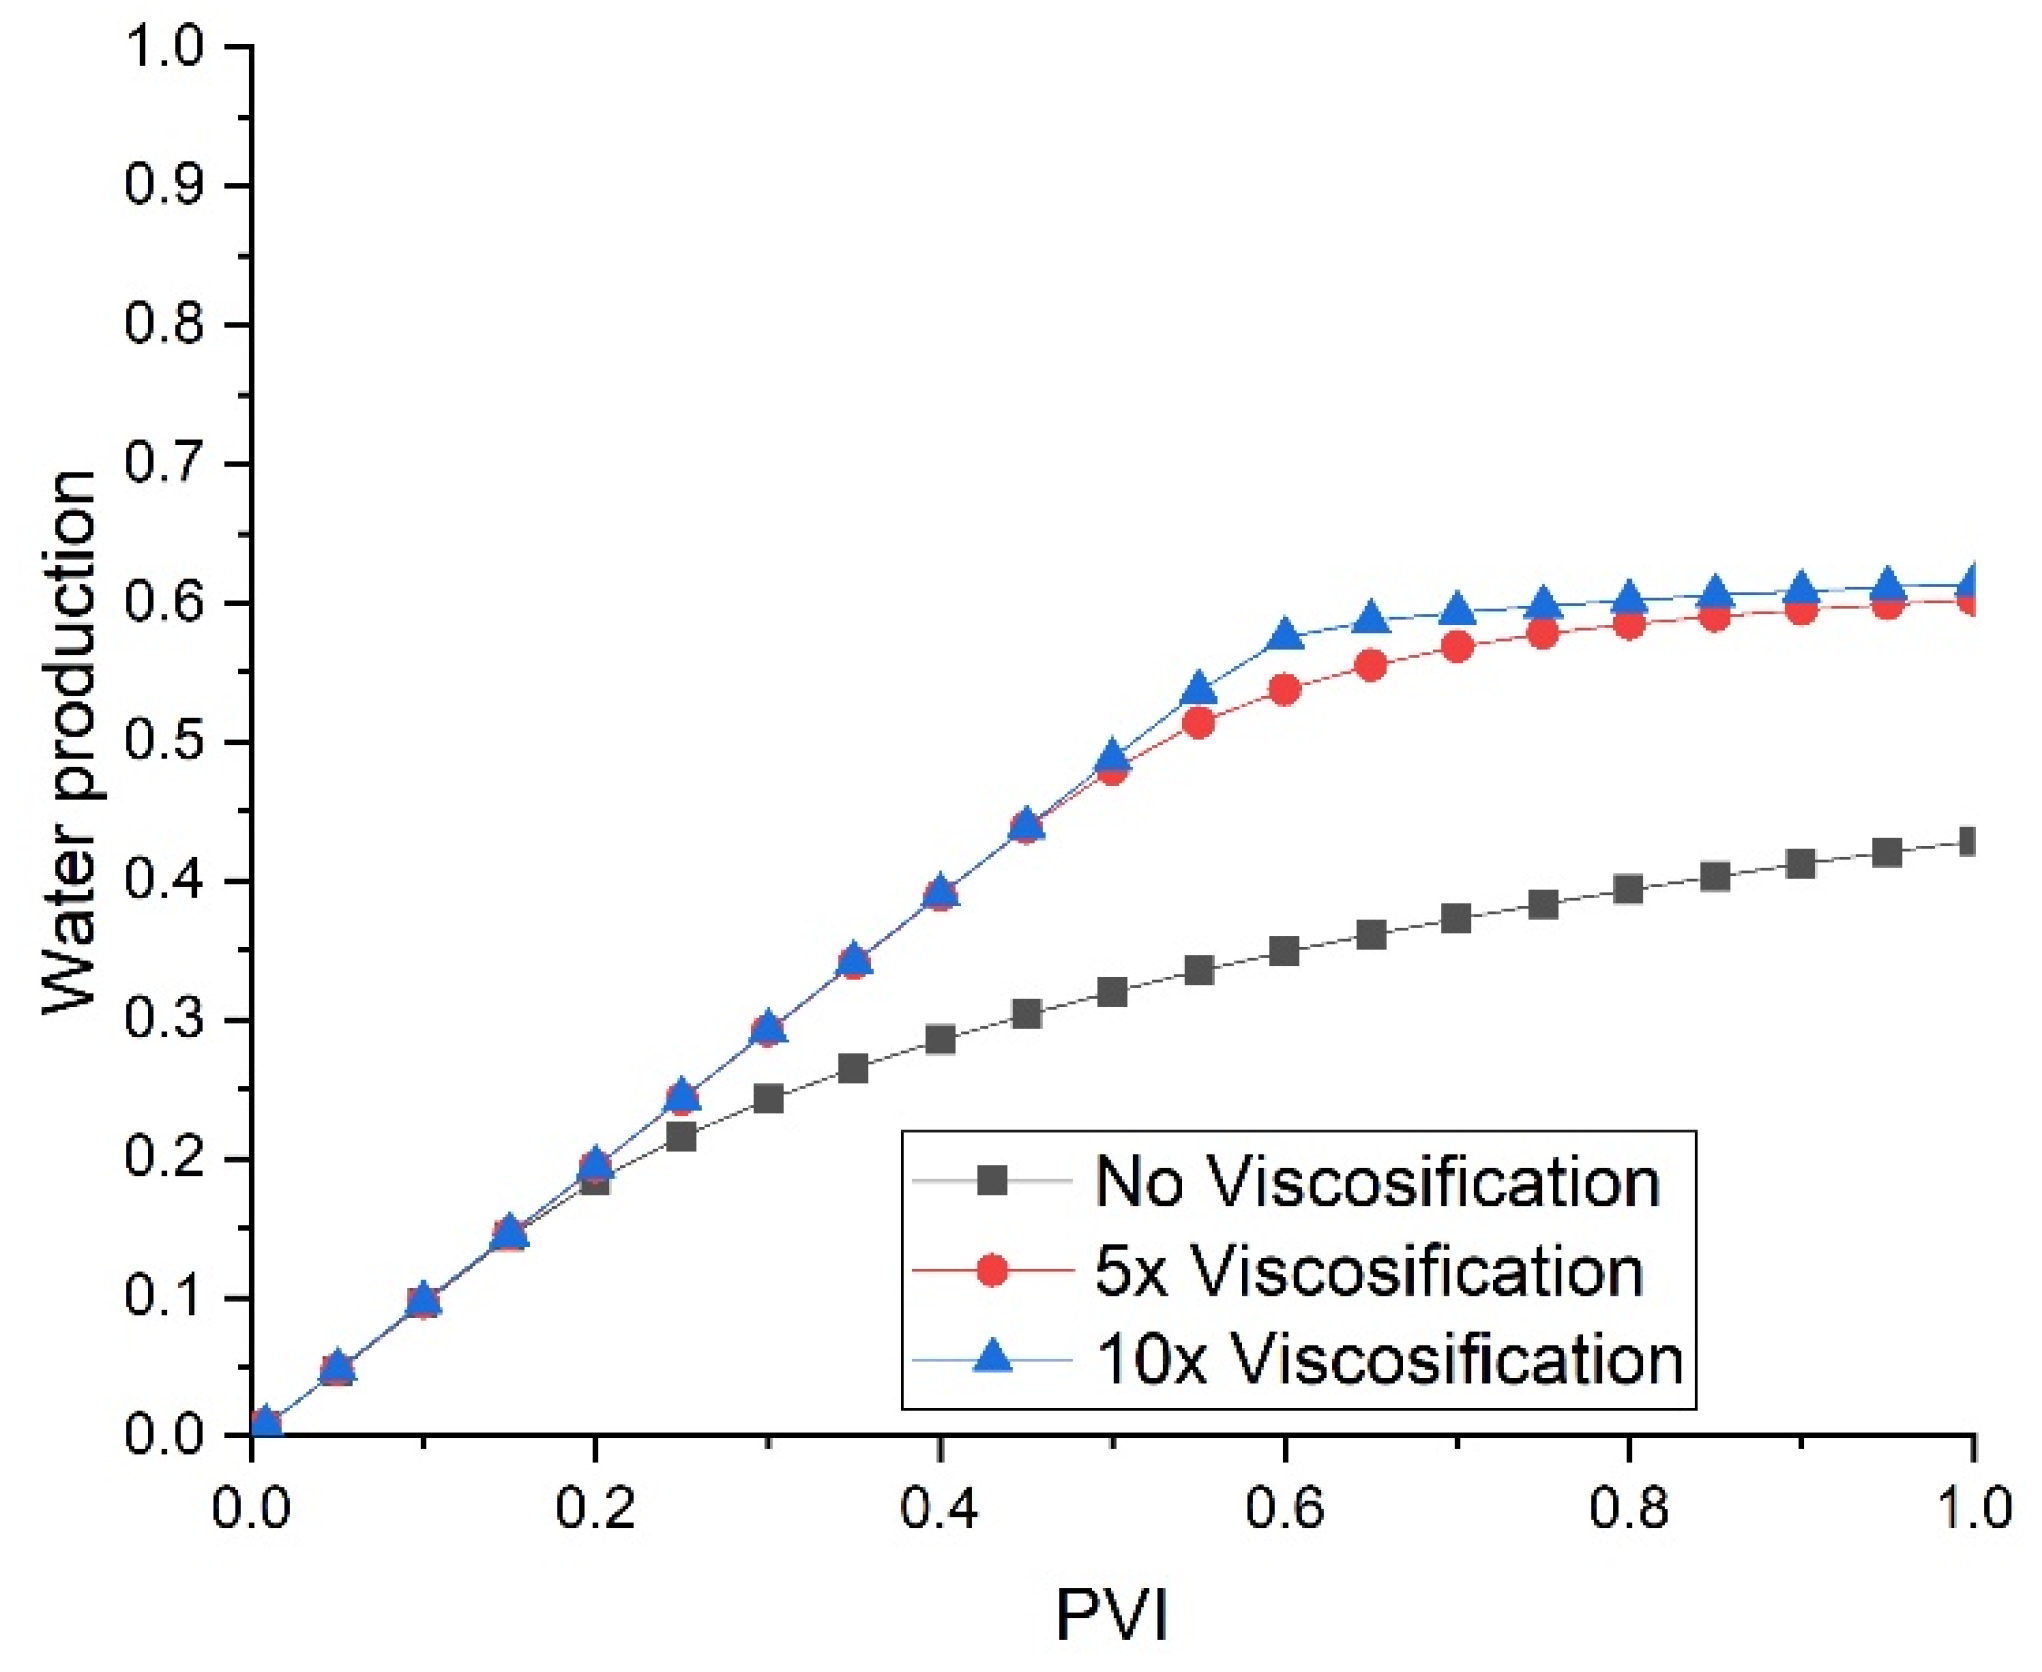
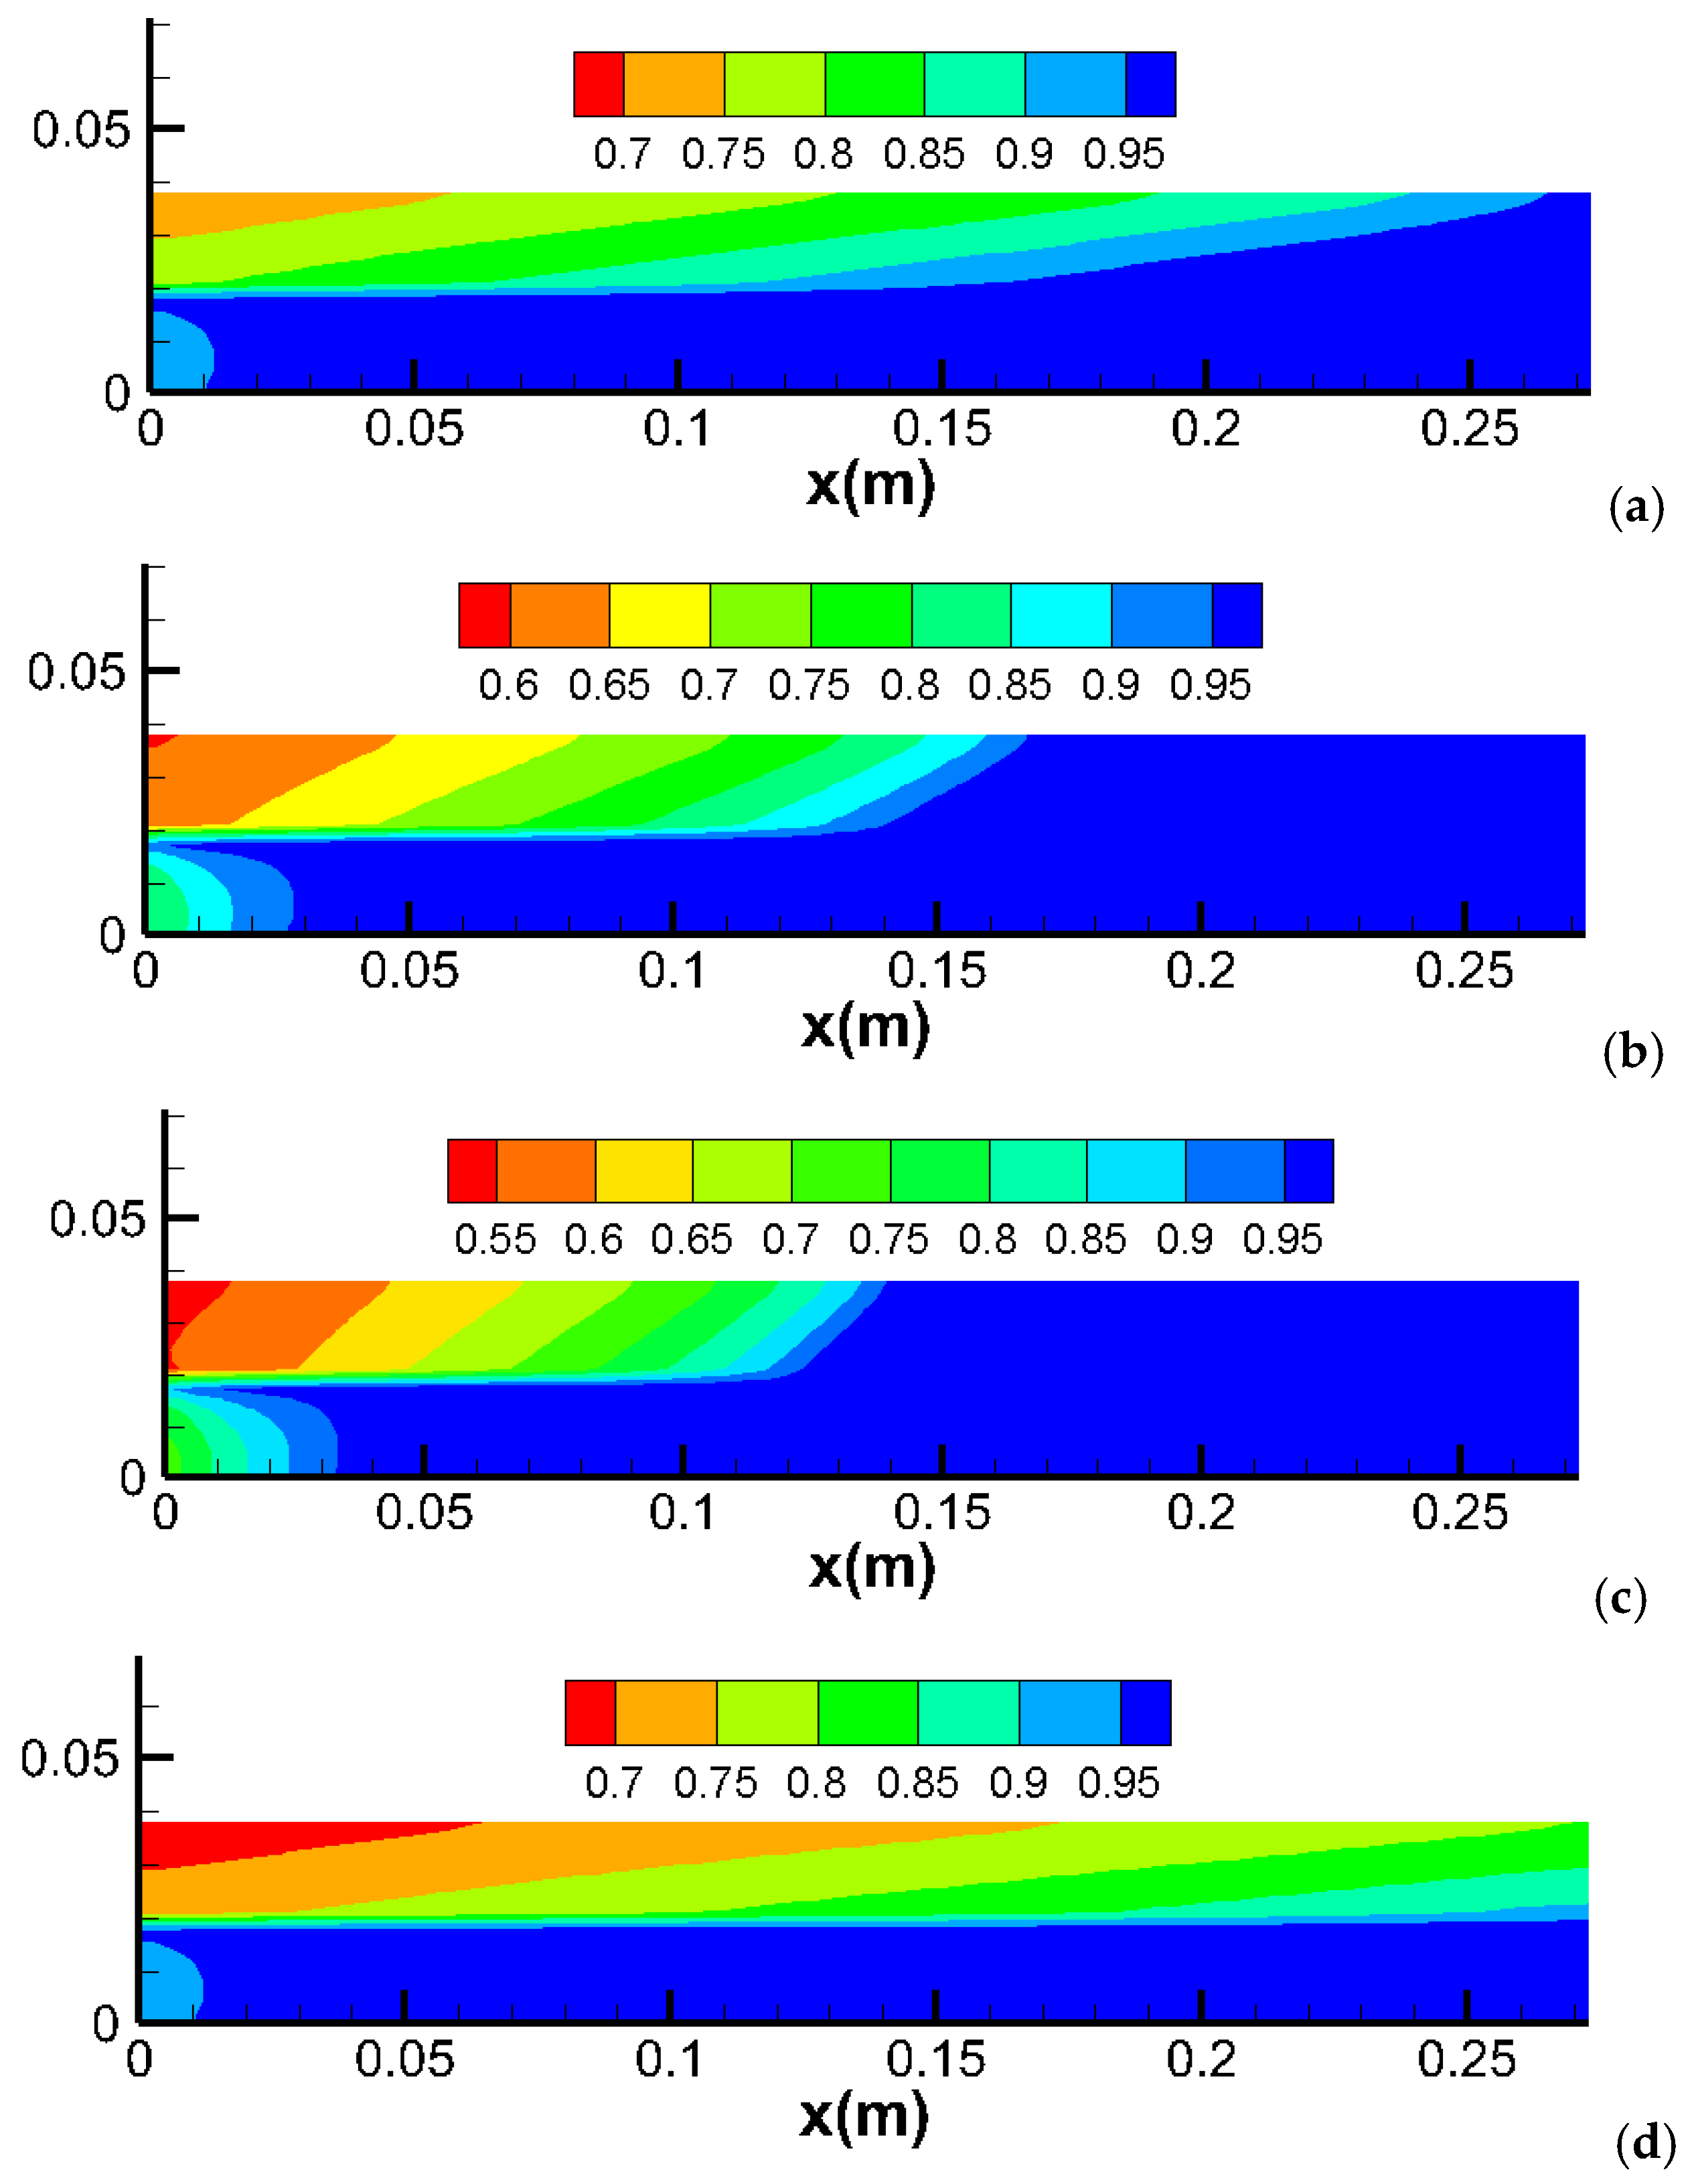
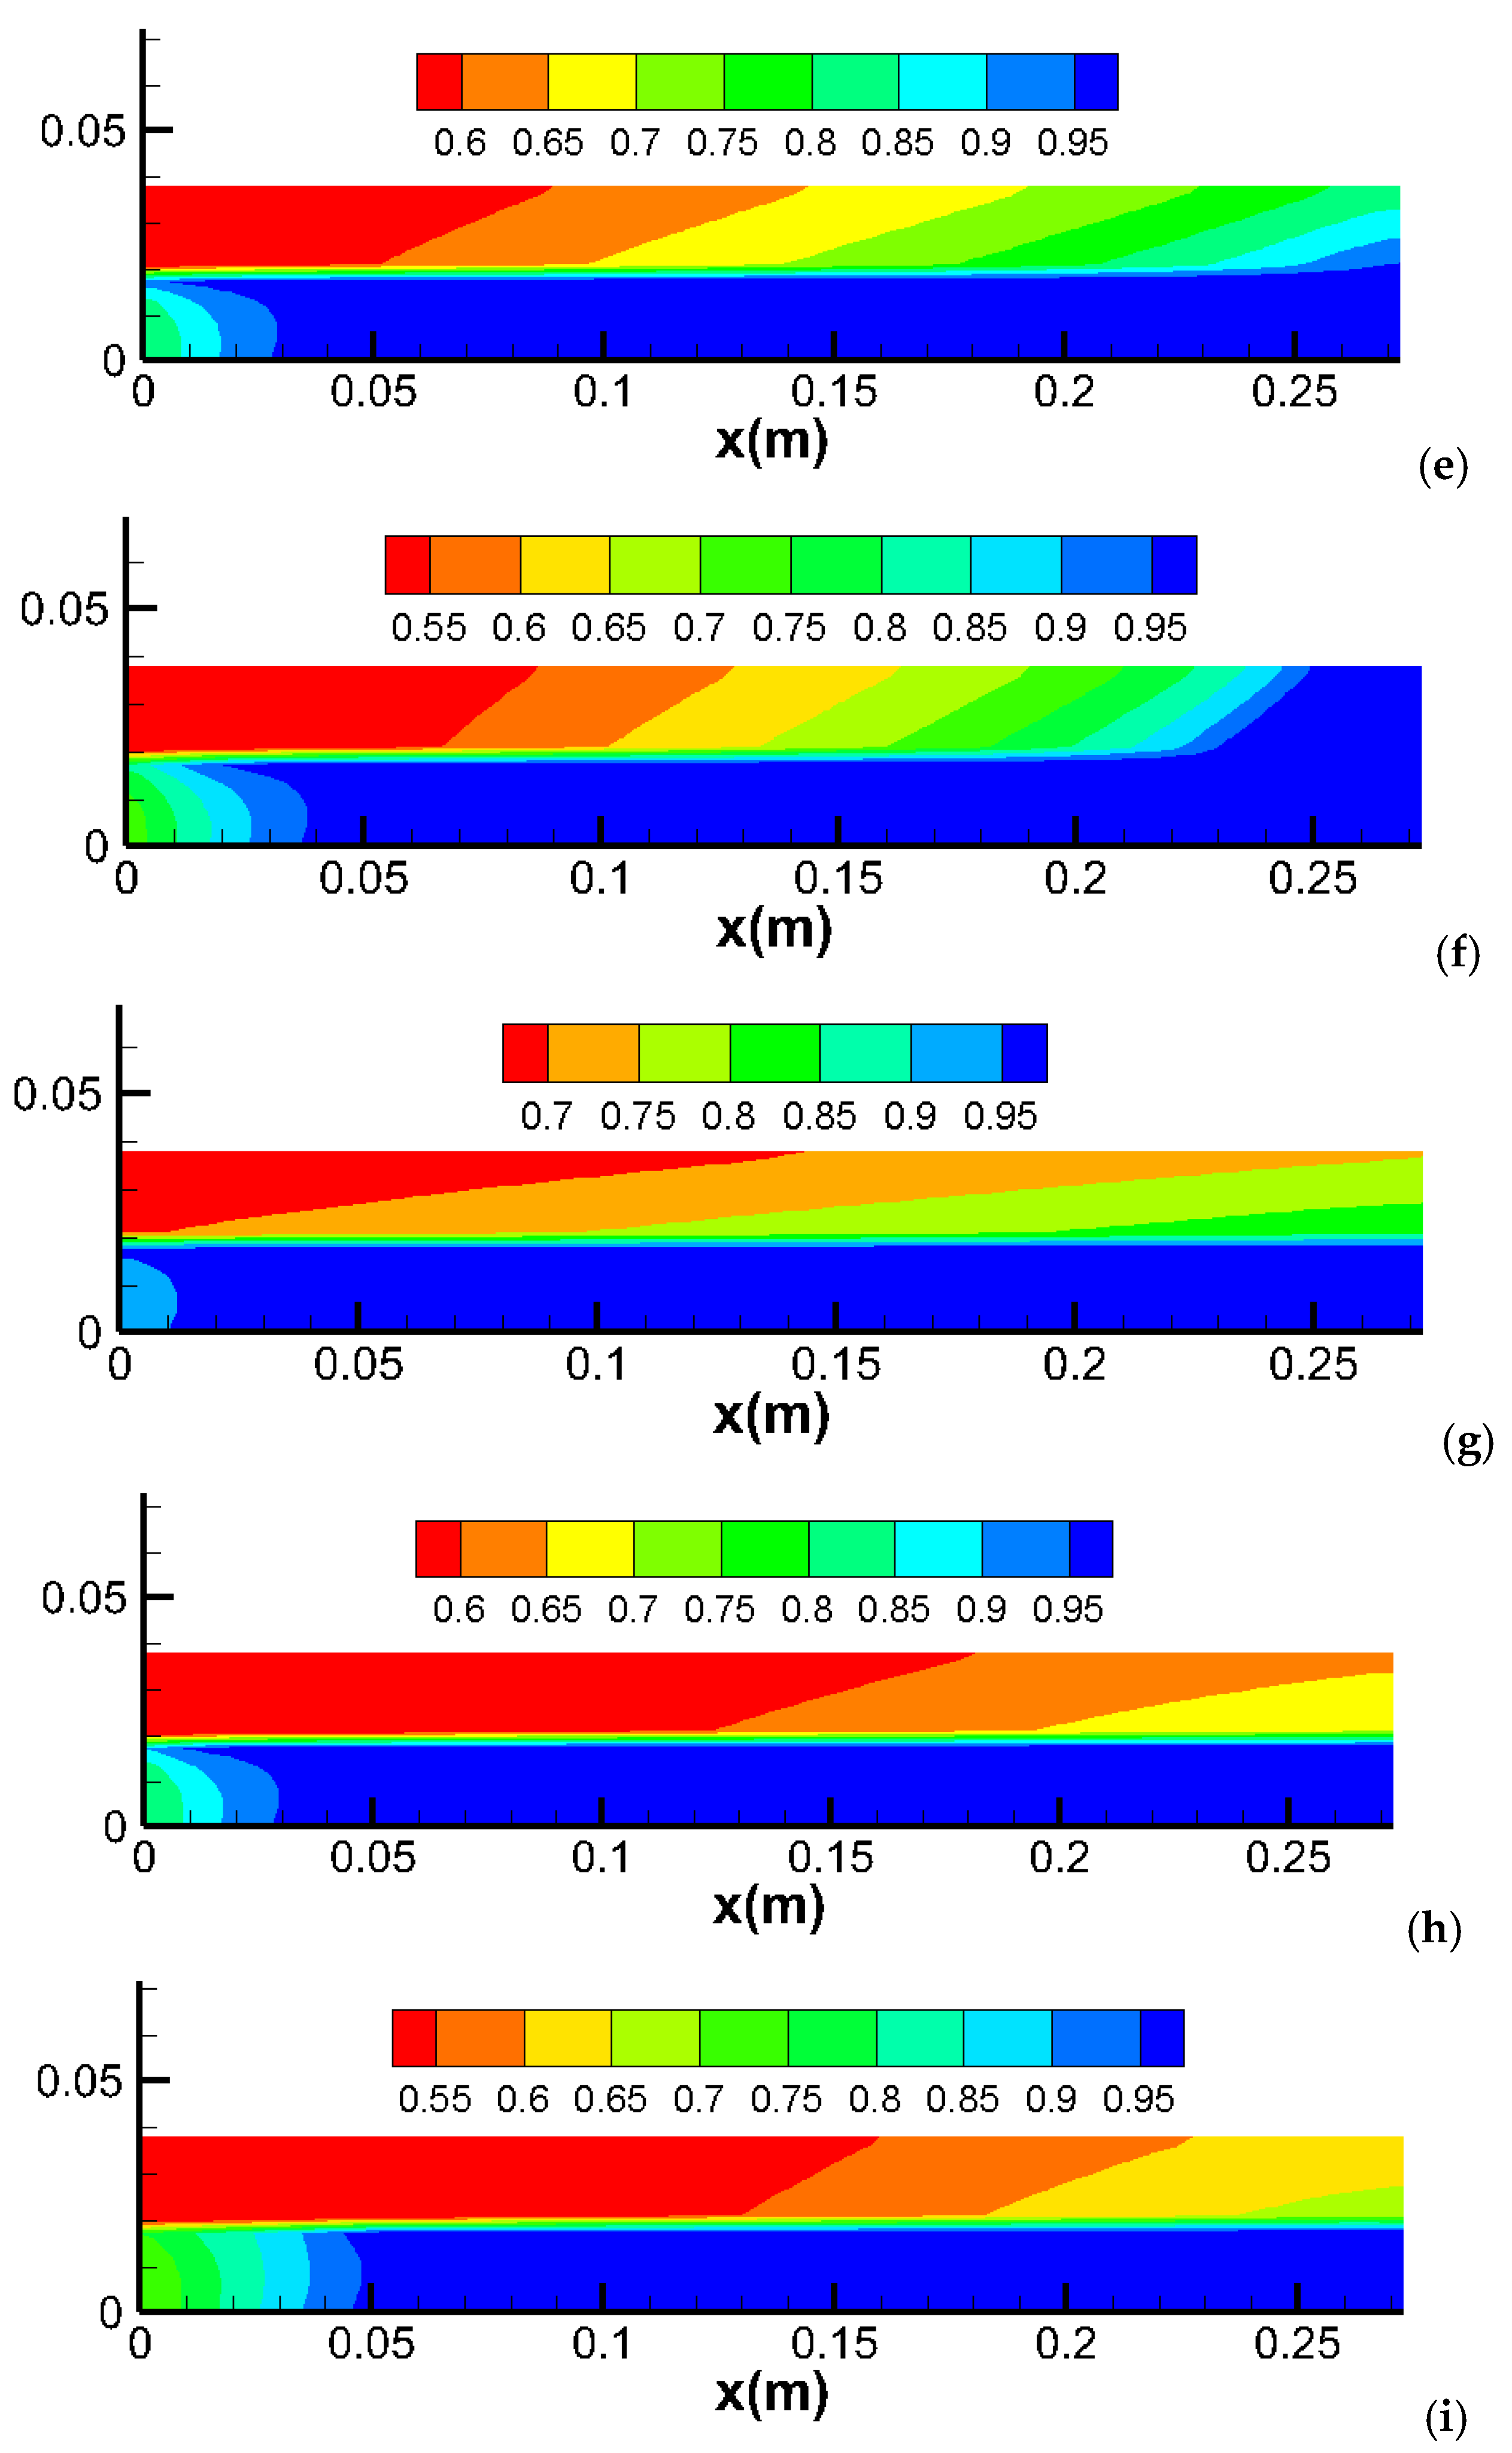
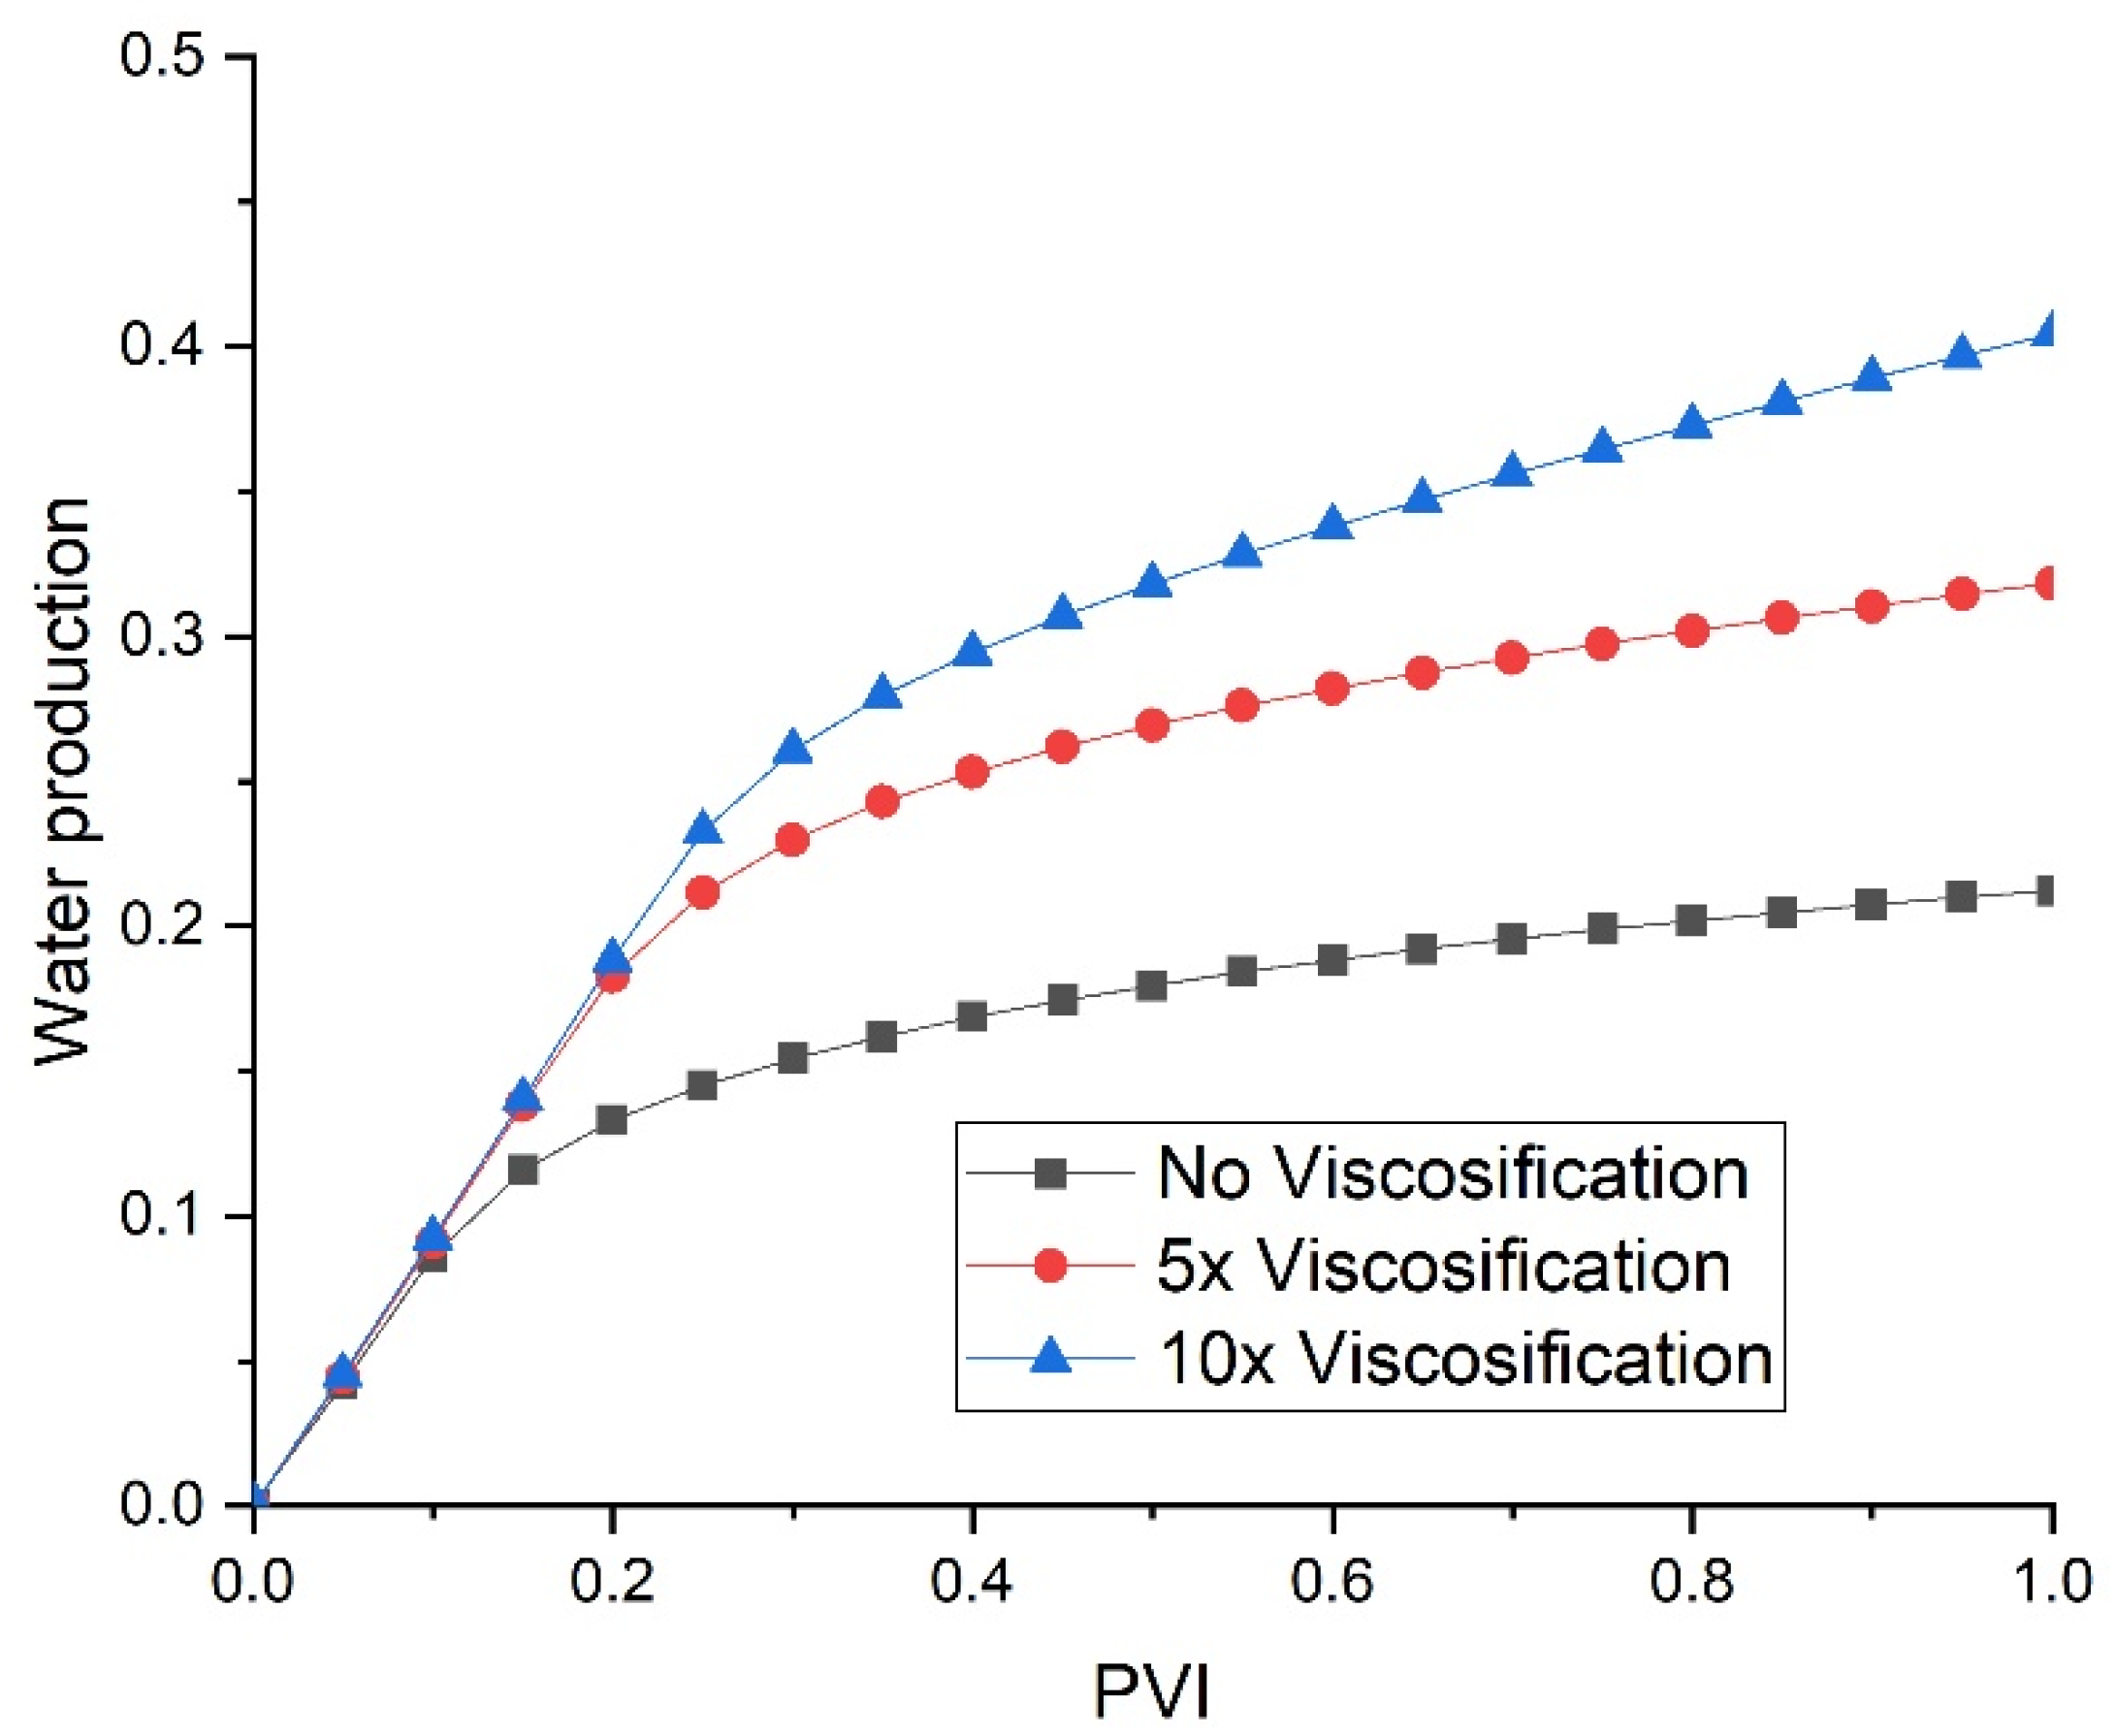
This example examines the effect of viscosification in a layered core with capillary pressure. Figure 13a–i illustrate the water saturation at different pore volume injections (PVIs) for the various viscosification levels. The results indicate an early breakthrough when viscosification is increased, which contrasts with the observations in the case without capillary pressure.
The early breakthrough observed with increased viscosification is a result of the interplay between capillary pressure and fluid viscosity in a layered core. In the presence of capillary pressure, the distribution of water saturation is influenced by the capillary forces acting within the porous medium. When viscosification is increased, the higher viscosity fluid tends to move more slowly through the core, leading to an earlier breakthrough of the less viscous phase. This behavior contrasts with the case without capillary pressure, where the fluid distribution is primarily governed by viscosity differences alone. The discrepancy noted in the results highlights the significant role of core length and capillary pressure in determining fluid flow behavior. Further investigation into these factors is warranted to fully understand their impact.
Figure 14 shows the water production at different viscosification levels.

3. Discussion

This section presents a discussion of the physical mechanisms behind the simulation results and their alignment with theoretical predictions, as follows:
Impact of CO2 Viscosity in Homogeneous Media:
o
Mechanism: Increasing the viscosity of CO2 enhances its ability to displace water by reducing the mobility ratio between the injected CO2 and the resident water. This leads to a more stable displacement front and improved sweep efficiency;
o
Simulation Results: The simulations show that increasing CO2 viscosity by a factor of 5 significantly enhances water production. However, further increasing the viscosity from 5 to 10 has minimal additional impact. This is consistent with the concept of diminishing returns, where beyond a certain point, further increases in viscosity do not proportionally improve displacement efficiency;
o
Alignment with Observations: These findings align with the experimental studies that have demonstrated improved sweep efficiency with increased CO2 viscosity, up to an optimal point beyond which the benefits plateau.
Consistency Across Core Sizes:
o
Mechanism: The effect of CO2 viscosification is expected to be consistent across different core sizes due to the uniform impact of viscosity on fluid flow dynamics;
o
Simulation Results: The effect of CO2 viscosification is consistent in both slim (1 cm) and thick (3.8 cm) cores. This indicates that the benefits of increased CO2 viscosity are not significantly influenced by the core thickness;
o
Alignment with Observations: This consistency is supported by theoretical predictions and experimental observations, which suggest that viscosity effects are largely independent of core size, provided the flow regime remains similar.
Capillary Pressure in Homogeneous Cores:
o
Mechanism: Capillary pressure influences the distribution and movement of fluids within the porous medium. High capillary pressure can delay the breakthrough of the injected phase and reduce overall sweep efficiency by trapping more of the resident phase;
o
Simulation Results: Introducing capillary pressure in a homogeneous core delays breakthrough and reduces CO2 sweeping efficiency, resulting in lower production. This effect is more pronounced in slim cores compared to thick cores, as capillary forces are more significant in smaller pore spaces;
o
Alignment with Observations: These results are consistent with theoretical predictions and experimental observations that highlight the role of capillary pressure in fluid displacement processes. Studies have shown that capillary pressure can significantly affect the efficiency of CO2 injection, particularly in fine-grained media.
Capillary Pressure in Heterogeneous Layered Cores:
o
Mechanism: In heterogeneous layered cores, capillary pressure affects fluid distribution differently due to variations in permeability and porosity. High permeability layers tend to dominate fluid flow, reducing the overall impact of capillary pressure;
o
Simulation Results: Capillary pressure has a similar effect in heterogeneous layered cores as in homogeneous cores. However, the difference in water production between the base case (no capillary pressure) and with capillary pressure is less significant in layered domains. This is because the high permeability layer predominantly produces the recovered water in both scenarios;
o
Alignment with Observations: These findings align with experimental and field studies that demonstrate the impact of reservoir heterogeneity on fluid flow and displacement efficiency. In layered systems, high permeability zones often control the flow dynamics, mitigating the effects of capillary pressure.

4. Conclusions

The study has reached the following conclusions:
Impact of CO2 Viscosity in Homogeneous Media: Increasing the viscosity of CO2 by a factor of 5 significantly affects water production. However, further increasing the viscosity from 5 to 10 has minimal additional impact;
Consistency Across Core Sizes: The effect of CO2 viscosification is consistent in both slim (1 cm) and thick (3.8 cm) cores;
Capillary Pressure in Homogeneous Cores: Introducing capillary pressure in a homogeneous core delays breakthrough and reduces CO2 sweeping efficiency, resulting in lower production. This effect is more pronounced in slim cores compared to thick cores;
Capillary Pressure in Heterogeneous Layered Cores: Capillary pressure has a similar effect in heterogeneous layered cores as in homogeneous cores. The difference in water production between the base case (no capillary pressure) and with capillary pressure is less significant in layered domains, as the high permeability layer predominantly produces the recovered water in both scenarios.
Limitations and Uncertainties
The limitations of this study are as follows:
Model Assumptions: The simulations assume idealized conditions, such as constant temperature and pressure, which may not fully capture the complexities of real reservoir environments. Future studies should consider variable conditions to better reflect field scenarios;
Scale of Study: The study is conducted on a lab-scale domain, which may not directly translate to field-scale applications. Scaling up the model and validating it with field data is necessary to ensure its applicability;
Heterogeneity Representation: The heterogeneous media in this study are represented by layered domains. More complex heterogeneity patterns, such as random or fractal distributions, should be explored to understand their impact on CO2 injection efficiency.
Implications for Future Research
The implications of this study’s findings for future research include the following:
Optimization of CO2 Viscosity: Further research is needed to identify the optimal CO2 viscosity for different reservoir conditions, considering the economic and operational constraints;
Capillary Pressure Effects: Investigating the role of capillary pressure in more diverse geological settings can provide deeper insights into its impact on CO2 injection strategies;
Field-Scale Validation: Conducting field-scale experiments and simulations will help validate the findings and refine the model for practical applications;
Advanced Heterogeneity Models: Developing and testing models that incorporate more realistic heterogeneity patterns will enhance the understanding of fluid flow dynamics in complex reservoirs.

Funding

This research received no external funding.

Data Availability Statement

Data is contained within the article.

Conflicts of Interest

The author declares no conflict of interest.

Appendix A

This appendix details the numerical model employed in the simulations. Additionally, it includes a verification of the model against the well-known Buckley–Leverett analytical solution.
Accurately approximating the flowlines and flux, along with minimizing the mesh dependency, are crucial for effective numerical schemes in modeling two-phase flow in heterogeneous media. The mixed finite element (MFE) method [28] achieves this level of accuracy.
Traditionally, the MFE method for elliptic and parabolic equations involves the simultaneous calculation of cell pressures and fluxes across numerical block interfaces, resulting in a large and indefinite linear system. In this work, the hybridized MFE method is utilized, which produces a symmetric, positive definite linear system with face pressures (traces of the pressure) as the primary unknowns. This method is algebraically equivalent to the conventional MFE but offers improved efficiency [28].
The Discontinuous Galerkin (DG) method is appealing due to its flexibility in handling unstructured domains with higher-order approximation functions. It aligns well with saturation discontinuity and ensures local mass conservation at the element level. Initially implemented for nonlinear scalar conservation laws by Chavent and Salzano [29], the DG method required very restrictive time steps for stability. Chavent and Cockburn [30] enhanced its stability by incorporating a slope limiter, building on van Leer’s work [31]. Cockburn and Shu further advanced the method by developing the Runge–Kutta Discontinuous Galerkin (RKDG) method [32], which integrates higher-order temporal schemes.
The DG method has since been applied to elliptic and parabolic equations [33], as well as to incompressible two-phase flow in porous media, where it is used to approximate both pressure and saturation equations.

Appendix A.1. Mixed Finite Element Discretization

The hybridized Mixed Finite Element (MFE) method utilizes the Raviart–Thomas space with various approximation orders. In this study, I employ the lowest-order Raviart–Thomas space (RT0), where the degrees of freedom include the cell potential average, the face potential average, and the fluxes across each cell’s faces.
The basis functions ( w E ) are linearly independent and satisfy the following properties:
. w E = 1 V w E . n E = 1 E   i f   E = E 0   o t h e r w i s e V : G r i d   V o l u m e ,   E : G r i d   i n t e r f a c e
The flow potential, ( φ α ), of phase ( α ) is defined as follows:
φ α = p α + ρ α g z
The velocity variable ( v α ) over a grid element (G) can be determined from the flux variables ( Q α , G , E ) across each element face as follows:
v α , G = E = 1 N u m b e r   o f   E d g e s Q α , G , E w G , E
The velocity is related to the flow potential as follows:
v α = K φ α
where K represents the mobility multiplied by the permeability tensor.
The MFE variational formulation is obtained by multiplying Equation (A4) by the RT0 basis functions ( w G , E ) and inverting the permeability tensor. Using Equation (A1), and integrating by parts over, we obtain the following:
w G , E K 1 v α , G = φ α . w E φ α w G , E n G , E = φ α , G φ α , E
where φ α , G and φ α , E are the phase potential averages on the center of grid G and the interface E of the corresponding grid.
Substituting Equation (A3) into the left-hand side of Equation (A5) yields the following:
E = 1 N u m b e r   o f   E d g e s Q α , G , E M G , E , E = φ α , G φ α , E
where M G , E , E is as follows:
M G , E , E = w G , E K 1 w G , E
With straightforward manipulations, Equation (A6) provides an explicit expression for the flux ( Q α , G , E ) in terms of the cell average potential and all face average potentials in (G), as follows:
Q α , G , E = σ G , E φ α , G E = 1 N u m b e r   o f   E d g e s τ G , E , E φ α , G , E
where σ and τ are constants, independent of the potential and flux variables.

Appendix A.2. Discontinuous Galekrin Discretization

The advective mass balance equation of the saturation of phase α ( S α ) could be written as follows:
S α t + . ( v α S α ) = F
where F is sink/source term.
The first-order discontinuous finite element approximation of the saturation is written in the following form:
S α , G = i = 1 N u m b e r   o f   n o d e s S α , G , i ψ G , i
where ψ is the first-order shape function and ψ is the saturation of phase α a in a grid cell G at node i. Through multiplying Equation (A9) by the same shape function and integrating by parts, we obtain the following equation:
i = 1 N u m b e r   o f   n o d e s d S α , G , i d t ψ G , i ψ G , j = i = 1 N u m b e r   o f   n o d e s ψ G , j v α ψ G , i S ^ α , G , E ψ G , i ψ G , j v α n G , E + ψ G , i F G
where S ^ α , G , E is the upstream value of the saturation at the grid interface E.

Appendix A.3. Model Verification

The numerical model is validated using established analytical solutions in a one-dimensional space. The first example addresses the Buckley–Leverett problem [34]. A 300 m long, one-dimensional horizontal homogeneous domain, initially saturated with oil, is examined. Water, acting as the wetting phase, is injected at a constant flow rate at one end to displace the oil towards the opposite end. The pressure at the production end is kept constant, and the capillary pressure effects are neglected. The specific data for this scenario are provided in Table A1. Figure A1 compares the analytical and numerical results, showing a good agreement that verifies the numerical model while using as few as 100 grids.
Table A1. Relevant data for the verification example.
ParameterValue
Length, width, and Height of the domain300 m, 1 m, 1 m
Porosity20%
Permeability1 mD
Viscosity ratio between the phases1
Density ratio between the phases1
Residual water saturation0
Residual oil saturation20%
Injection rate5 × 10−4 PoreVolume/Day.
Figure A1. Verification of the numerical model with analytical solution.
Water 16 03566 g0a1

References

  1. Hadlow, R.E. Update of Industry Experience with CO2 Injection. In Proceedings of the SPE Annual Technical Conference and Exhibition, Washington, DC, USA, 4–7 October 1992. [Google Scholar] [CrossRef]
  2. Alam, M.M.M.; Hassan, A.; Mahmoud, M.; Sibaweihi, N.; Patil, S. Dual Benefits of Enhanced Oil Recovery and CO2 Sequestration: The Impact of CO2 Injection Approach on Oil Recovery. Front. Energy Res. 2022, 10, 877212. [Google Scholar] [CrossRef]
  3. Ampomah, W.; Balch, R.S.; Grigg, R.B.; Cather, M.; Will, R.A.; Lee, S.Y. Optimization of CO2-EOR Process in Partially Depleted Oil Reservoirs. In Proceedings of the SPE Western Regional Meeting, Anchorage, AK, USA, 23–26 May 2016. [Google Scholar]
  4. Dai, Z.; Viswanathan, H.; Xiao, T.; Middleton, R.; Pan, F.; Ampomah, W.; Yang, C.; Zhou, Y.; Jia, W.; Lee, S.-Y.; et al. CO2 Sequestration and Enhanced Oil Recovery at Depleted Oil/Gas Reservoirs. Energ. Proced. 2017, 114, 6957–6967. [Google Scholar] [CrossRef]
  5. Khosrokhavar, R.; Elsinga, G.; Farajzadeh, R.; Bruining, H. Visualization and investigation of natural convection flow of CO2 in aqueous and oleic systems. J. Pet. Sci. Eng. 2014, 122, 230–239. [Google Scholar] [CrossRef]
  6. Both, J.; Gasda, S.; Aavatsmark, I.; Kaufmann, R. Gravity-driven convective mixing of CO2 in oil. In Proceedings of the Third Sustainable Earth Sciences Conference and Exhibition, Celle, Germany, 13–15 October 2015; pp. 1–5. [Google Scholar] [CrossRef]
  7. Wu, Z.; Huiqing, L.; Wang, X.; Zhang, Z. Emulsification and improved oil recovery with viscosity reducer during steam injection process for heavy oil. J. Ind. Eng. Chem. 2017, 61, 348–355. [Google Scholar] [CrossRef]
  8. Green, D.W.; Willhite, G.P. Enhanced Oil Recovery: Society of Petroleum Engineers Textbook; Series, V.6; SPE: Richardson, TX, USA, 1998. [Google Scholar]
  9. Torabi, F.; Jamaloei, B.Y.; Zarivnyy, O.; Paquin, B.A.; Rumpel, N.J.; Wilton, R.R. Effect of Oil Viscosity Permeability and Injection Rate on Performance of Waterflooding, CO2 Flooding and WAG Processes on Recovery of Heavy Oils. In Proceedings of the Canadian Unconventional Resources and International Petroleum Conference, Calgary, AB, Canada, 19–21 October 2010. [Google Scholar]
  10. Bond, D.C.; Holbrook, O.C. Gas Drive Oil Recovery Process. U.S. Patent 2,866,507, 30 December 1958. [Google Scholar]
  11. Fried, A.N. The Foam Drive Process for Increasing the Recovery of Oil; re. inv 5866; US Bureau of Mines: Washington, DC, USA, 1961. [Google Scholar]
  12. Yang, S.H.; Reed, R.L. Mobility Control Using CO2 Forms. In Proceedings of the SPE Annual Technical Conference and Exhibition, San Antonio, TX, USA, 8–11 October 1989. [Google Scholar]
  13. Khulman, M.I. Visualizing the Effect of Light Oil on CO2 Foams. J. Pet. Technol. 1990, 42, 902–908. [Google Scholar] [CrossRef]
  14. Manlowe, D.J.; Radke, C.J. A Pore-Level Investigation of Foam/Oil Interactions in Porous Media. Soc. Pet. Eng. 1990, 5, 495–502. [Google Scholar] [CrossRef]
  15. Nikolov, A.D.; Wasan, D.T.; Huang, D.W.; Edwards, D.A. The Effect of Oil on Foam Stability: Mechanisms and Implications for Oil Displacement by Foam in Porous media. In Proceedings of the 61st ATCE of SPE, New Orleans, LA, USA, 5 October 1986. [Google Scholar]
  16. Bernard, G.G.; Holm, L. Effect of Foam on Permeability of Porous Media to Gas. Soc. Pet. Eng. J. 1965, 4, 267. [Google Scholar] [CrossRef]
  17. Gallo, G.; Erdmann, E. Simulation of Viscosity Enhanced CO2 Nanofluid Alternating Gas in Light Oil Reservoirs. In Proceedings of the SPE Latin America and Caribbean Petroleum Engineering Conference, Buenos Aires, Argentina, 17–19 May 2017. [Google Scholar]
  18. Bae, J.H.; Irani, C.A. A Laboratory Investigation of Viscosified CO2. Process. Soc. Pet. Eng. 1993, 1, 166–171. [Google Scholar]
  19. Xu, J.; Enick, R.M. Thickening Carbon Dioxide with the Fluoroacrylate-Styrene Copolymer. In Proceedings of the SPE Annual Technical Conference and Exhibition, New Orleans, LA, USA, 30 September–3 October 2001. [Google Scholar]
  20. Huang, Z.; Xu, S.J.; Kilic, R.M. Enhancement of Viscosity of Carbon Dioxide Using Styrene/Fluoroacrylate Copolymers. Macromolecules 2000, 33, 5437–5442. [Google Scholar] [CrossRef]
  21. Zaberi, H.A.; Lee, J.J.; Enick, R.M.; Beckman, E.J.; Cummings, S.D.; Dailey, C.; Vasilache, M. An experimental feasibility study on the use of CO2-soluble polyfluoroacrylates for CO2 mobility and conformance control applications. J. Pet. Sci. Eng. 2020, 184, 106556. [Google Scholar] [CrossRef]
  22. Lemaire, P.C.; Alenzi, A.; Lee, J.J.; Beckman, E.J.; Enick, R.M. Thickening CO2 with Direct Thickeners, CO2-in-Oil Emulsions, or Nanoparticle Dispersions: Literature Review and Experimental Validation. Energy Fuels 2021, 35, 8510–8540. [Google Scholar] [CrossRef]
  23. Kilic, S.; Enick, R.M.; Beckman, E.J. Fluoroacrylate-Aromatic Acrylate Copolymers for Viscosity Enhancement of Carbon Dioxide. J. Supercrit. Fluids 2019, 146, 38–46. [Google Scholar] [CrossRef]
  24. CMG Software Package. Available online: https://www.cmgl.ca/solutions/software/builder/ (accessed on 29 October 2024).
  25. Younes, A.; Fahs, M.; Zidane, A.; Huggenberger, P.; Zechner, E. A new benchmark with high accurate solution for hot–cold fluids mixing. Heat Mass Transf. 2015, 51, 1321–1336. [Google Scholar] [CrossRef]
  26. Zidane, A. CO2 Viscosification for Mobility Alteration in Improved Oil Recovery and CO2 Sequestration. Water 2023, 15, 1730. [Google Scholar] [CrossRef]
  27. Al-Menhali, A.; Niu, B.; Krevor, S. Capillarity and wetting of carbon dioxide and brine during drainage in Berea sandstone at reservoir conditions. Water Resour. Res. 2015, 51, 7895–7914. [Google Scholar] [CrossRef]
  28. Brezzi, F.; Fortin, M. Mixed and Hybrid Finite Element Methods, Environmental Engineering; Springer: New York, NY, USA, 1991. [Google Scholar]
  29. Chavent, G.; Salzano, A. A finite-element method for the 1-D water flooding problem with gravity. J. Comput. Phys. 1982, 45, 307–344. [Google Scholar] [CrossRef]
  30. Chavent, G.; Cockburn, B. The local projection p0p1-discontinuous Galerkin finite element method for scalar conservation laws. ESAIM Math. Model. Numer. Anal. 1989, 23, 565–592. [Google Scholar] [CrossRef]
  31. van Leer, B. Towards the ultimate conservative scheme: II. J. Comput. Phys. 1974, 14, 361–376. [Google Scholar] [CrossRef]
  32. Cockburn, B.; Shu, C. TVB Runge-Kutta local projection discontinuous Galerkin finite element method for conservative laws II: General frame-work. Math. Comp. 1989, 52, 411–435. [Google Scholar]
  33. Cockburn, B.; Shu, C. The local discontinuous Galerkin finite element method for convection–diffusion systems. SIAM J. Numer. Anal. 1998, 35, 2440–2463. [Google Scholar] [CrossRef]
  34. Buckley, S.; Leverett, M. Mechanism of fluid displacement in sands. Trans. AIME 1942, 146, 187–196. [Google Scholar] [CrossRef]
Figure 1. Simulation domain and discretization grids: Example 1.
Water 16 03566 g001
Figure 2. Water saturation at 10% PVI; base case (a), 5× viscosification (b) and 10× viscosification (c). Water saturation at 20% PVI; base case (d), 5× viscosification (e) and 10× viscosification (f). Water saturation at 30% PVI; base case (g), 5× viscosification (h) and 10× viscosification (i).
Water 16 03566 g002aWater 16 03566 g002b
Figure 3. Water production for different viscosification cases.
Water 16 03566 g003
Figure 4. Water saturation at 10% PVI; base case (a), 5× viscosification (b) and 10× viscosification (c). Water saturation at 20% PVI; base case (d), 5× viscosification (e) and 10× viscosification (f). Water saturation at 30% PVI; base case (g), 5× viscosification (h) and 10× viscosification (i).
Water 16 03566 g004aWater 16 03566 g004bWater 16 03566 g004c
Figure 5. Water production for different viscosification cases.
Water 16 03566 g005
Figure 6. Water saturation at 10% PVI; with (a) and without (b) capillary pressure. Water saturation at 20% PVI; with (c) and without (d) capillary pressure. Water saturation at 30% PVI; with (e) and without (f) capillary pressure.
Water 16 03566 g006aWater 16 03566 g006b
Figure 7. Water production with and without capillary pressure.
Water 16 03566 g007
Figure 8. Heterogeneous core with two permeability layers.
Water 16 03566 g008
Figure 9. Water saturation at 10% PVI; with (a) and without (b) capillary pressure. Water saturation at 20% PVI; with (c) and without (d) capillary pressure. Water saturation at 30% PVI; with (e) and without (f) capillary pressure.
Water 16 03566 g009aWater 16 03566 g009b
Figure 10. Water production with and without capillary pressure.
Water 16 03566 g010
Figure 11. Water saturation at 10% PVI; with (a) and without (b) capillary pressure. Water saturation at 20% PVI; with (c) and without (d) capillary pressure. Water saturation at 30% PVI; with (e) and without (f) capillary pressure.
Water 16 03566 g011aWater 16 03566 g011b
Figure 12. Water production with and without capillary pressure.
Water 16 03566 g012
Figure 13. Water saturation at 10% PVI; base case (a), 5× viscosification (b) and 10× viscosification (c). Water saturation at 20% PVI; base case (d), 5× viscosification (e) and 10× viscosification (f). Water saturation at 30% PVI; base case (g), 5× viscosification (h) and 10× viscosification (i).
Water 16 03566 g013aWater 16 03566 g013b
Figure 14. Water production with different viscosification levels.
Water 16 03566 g014
Disclaimer/Publisher’s Note: The statements, opinions and data contained in all publications are solely those of the individual author(s) and contributor(s) and not of MDPI and/or the editor(s). MDPI and/or the editor(s) disclaim responsibility for any injury to people or property resulting from any ideas, methods, instructions or products referred to in the content.