
Evaluation and Prediction of Water Resources Carrying Capacity in Dongting Lake Area Based on County Unit and DWM-BP Neural Network Model


 and
and
Abstract
1. Introduction
2. Research Area
2.1. Regional Overview
2.1.1. Regional Scope
2.1.2. Regional Economic and Social Conditions
2.1.3. Biological Resources
2.1.4. Wetland Resources
2.2. Water Resources Condition
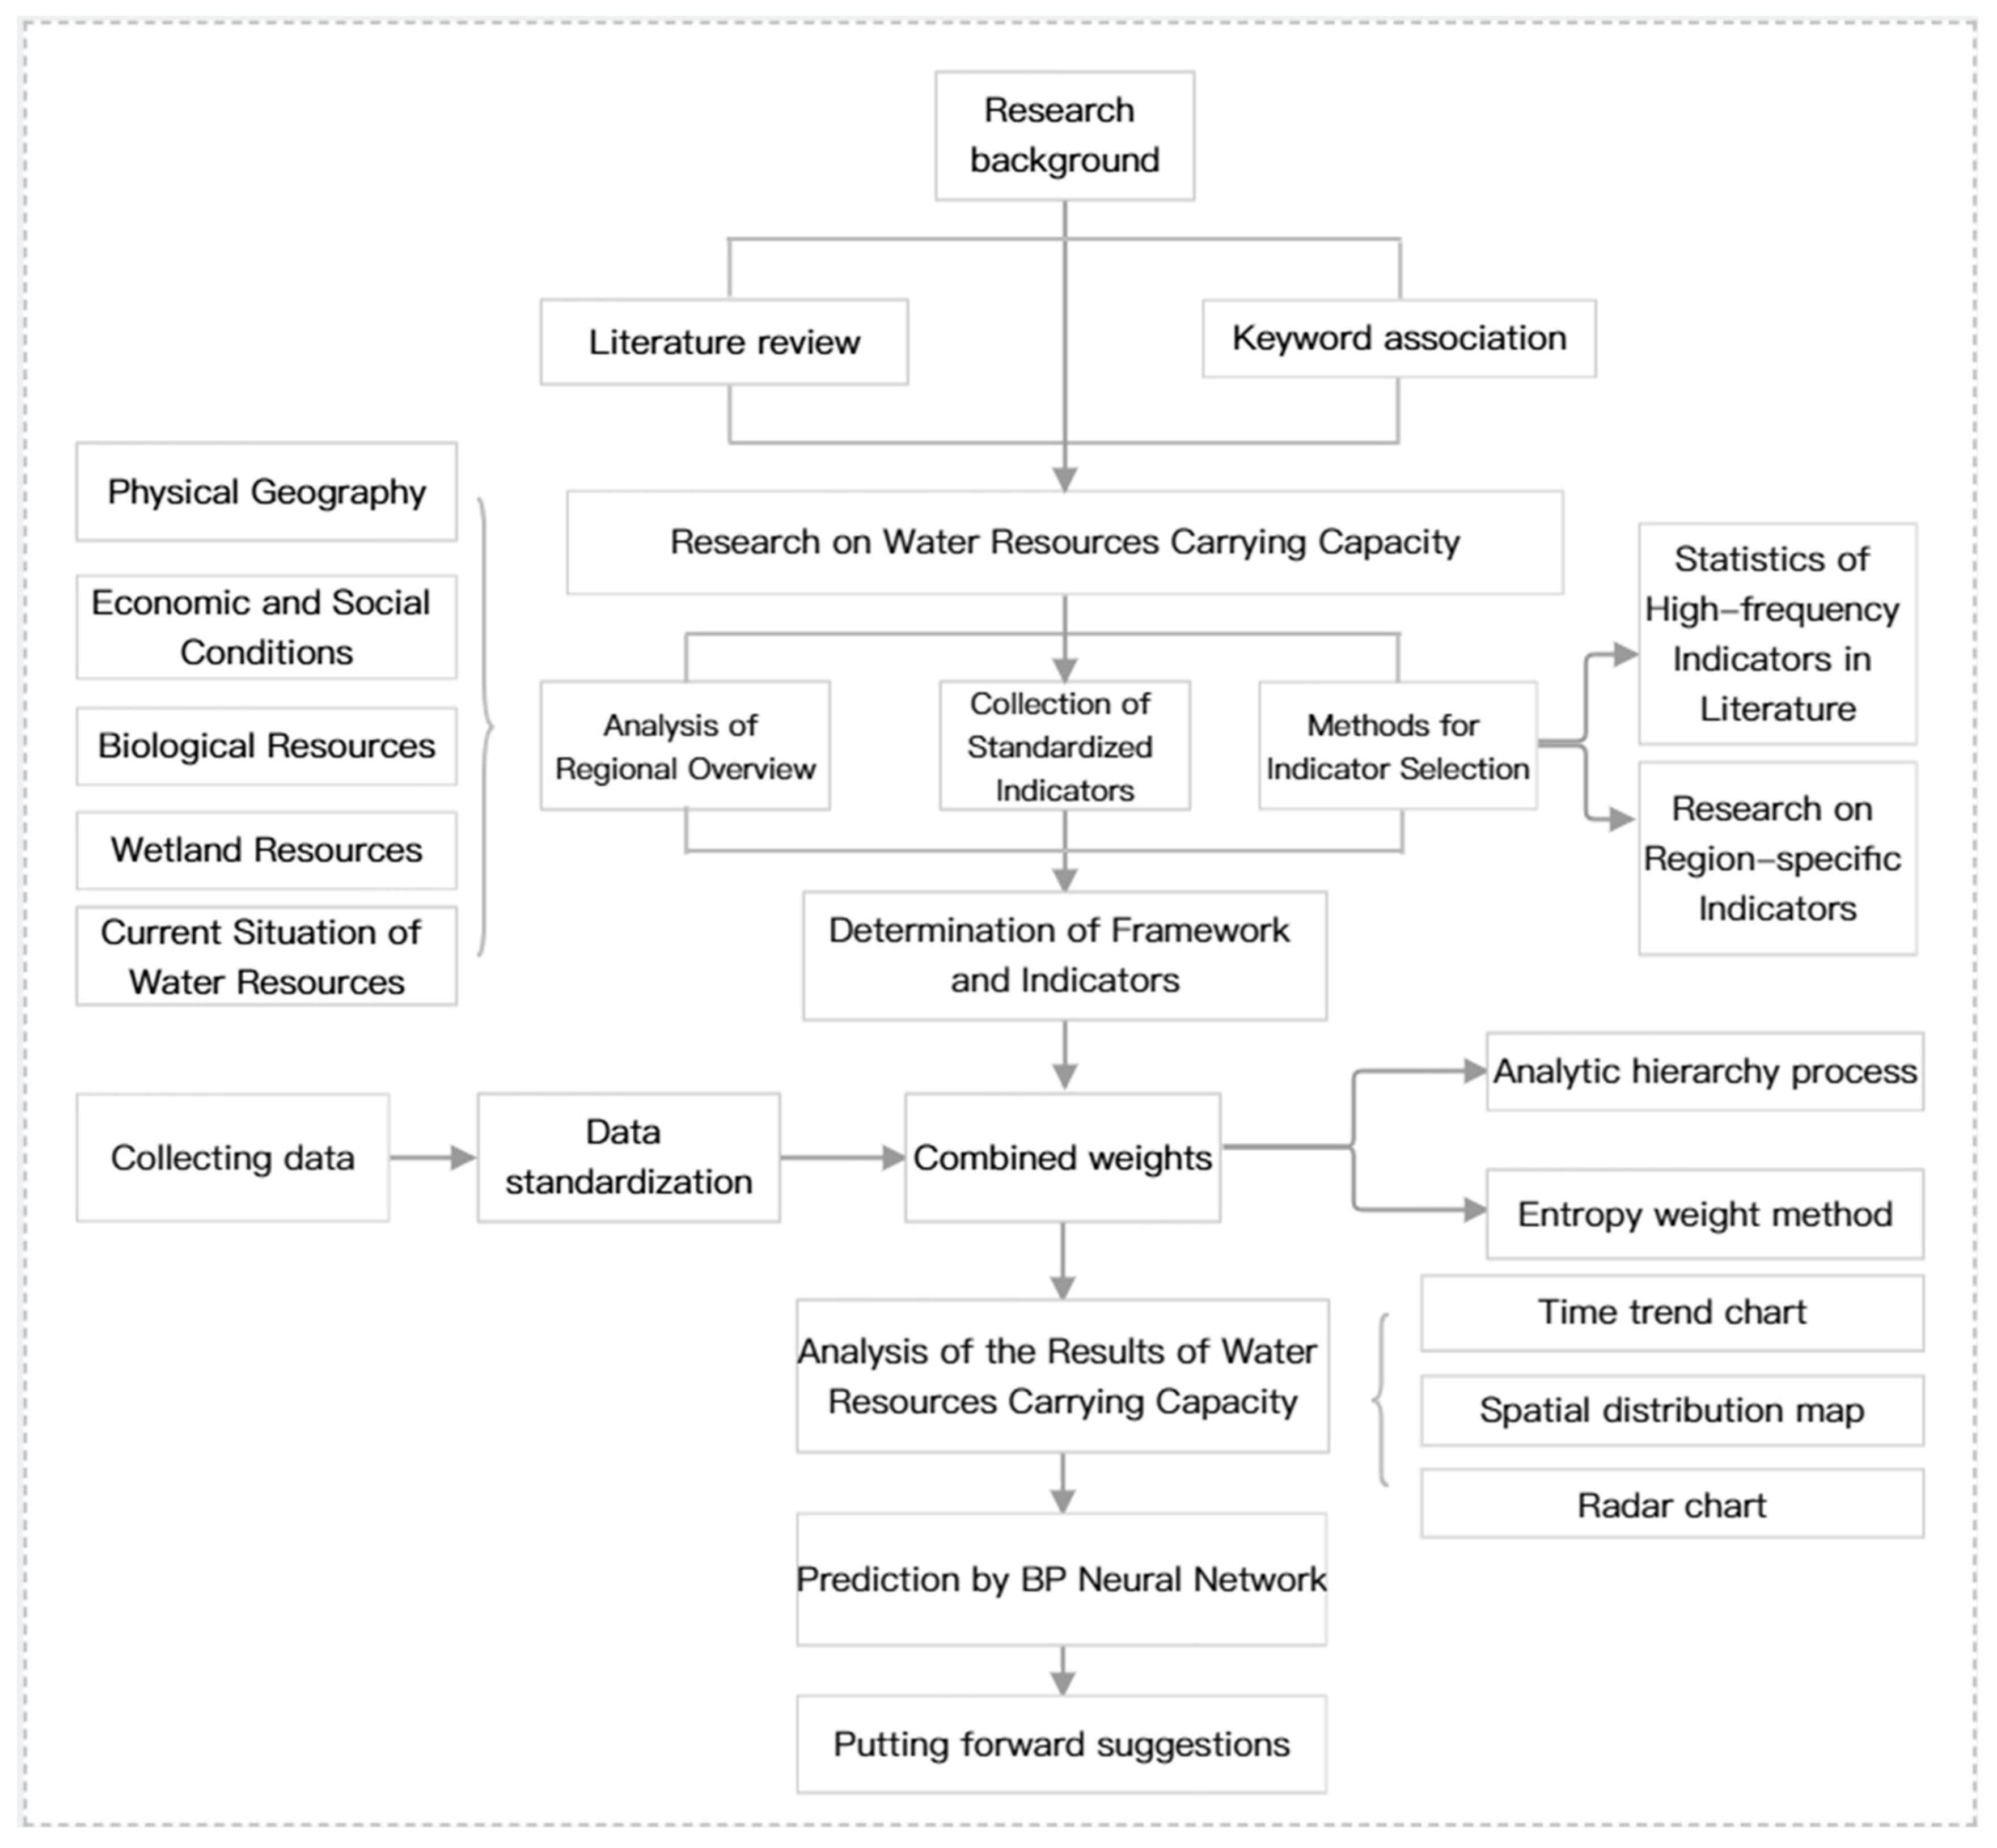
2.3. Research Flow Chart
3. Model Methods and Index Systems
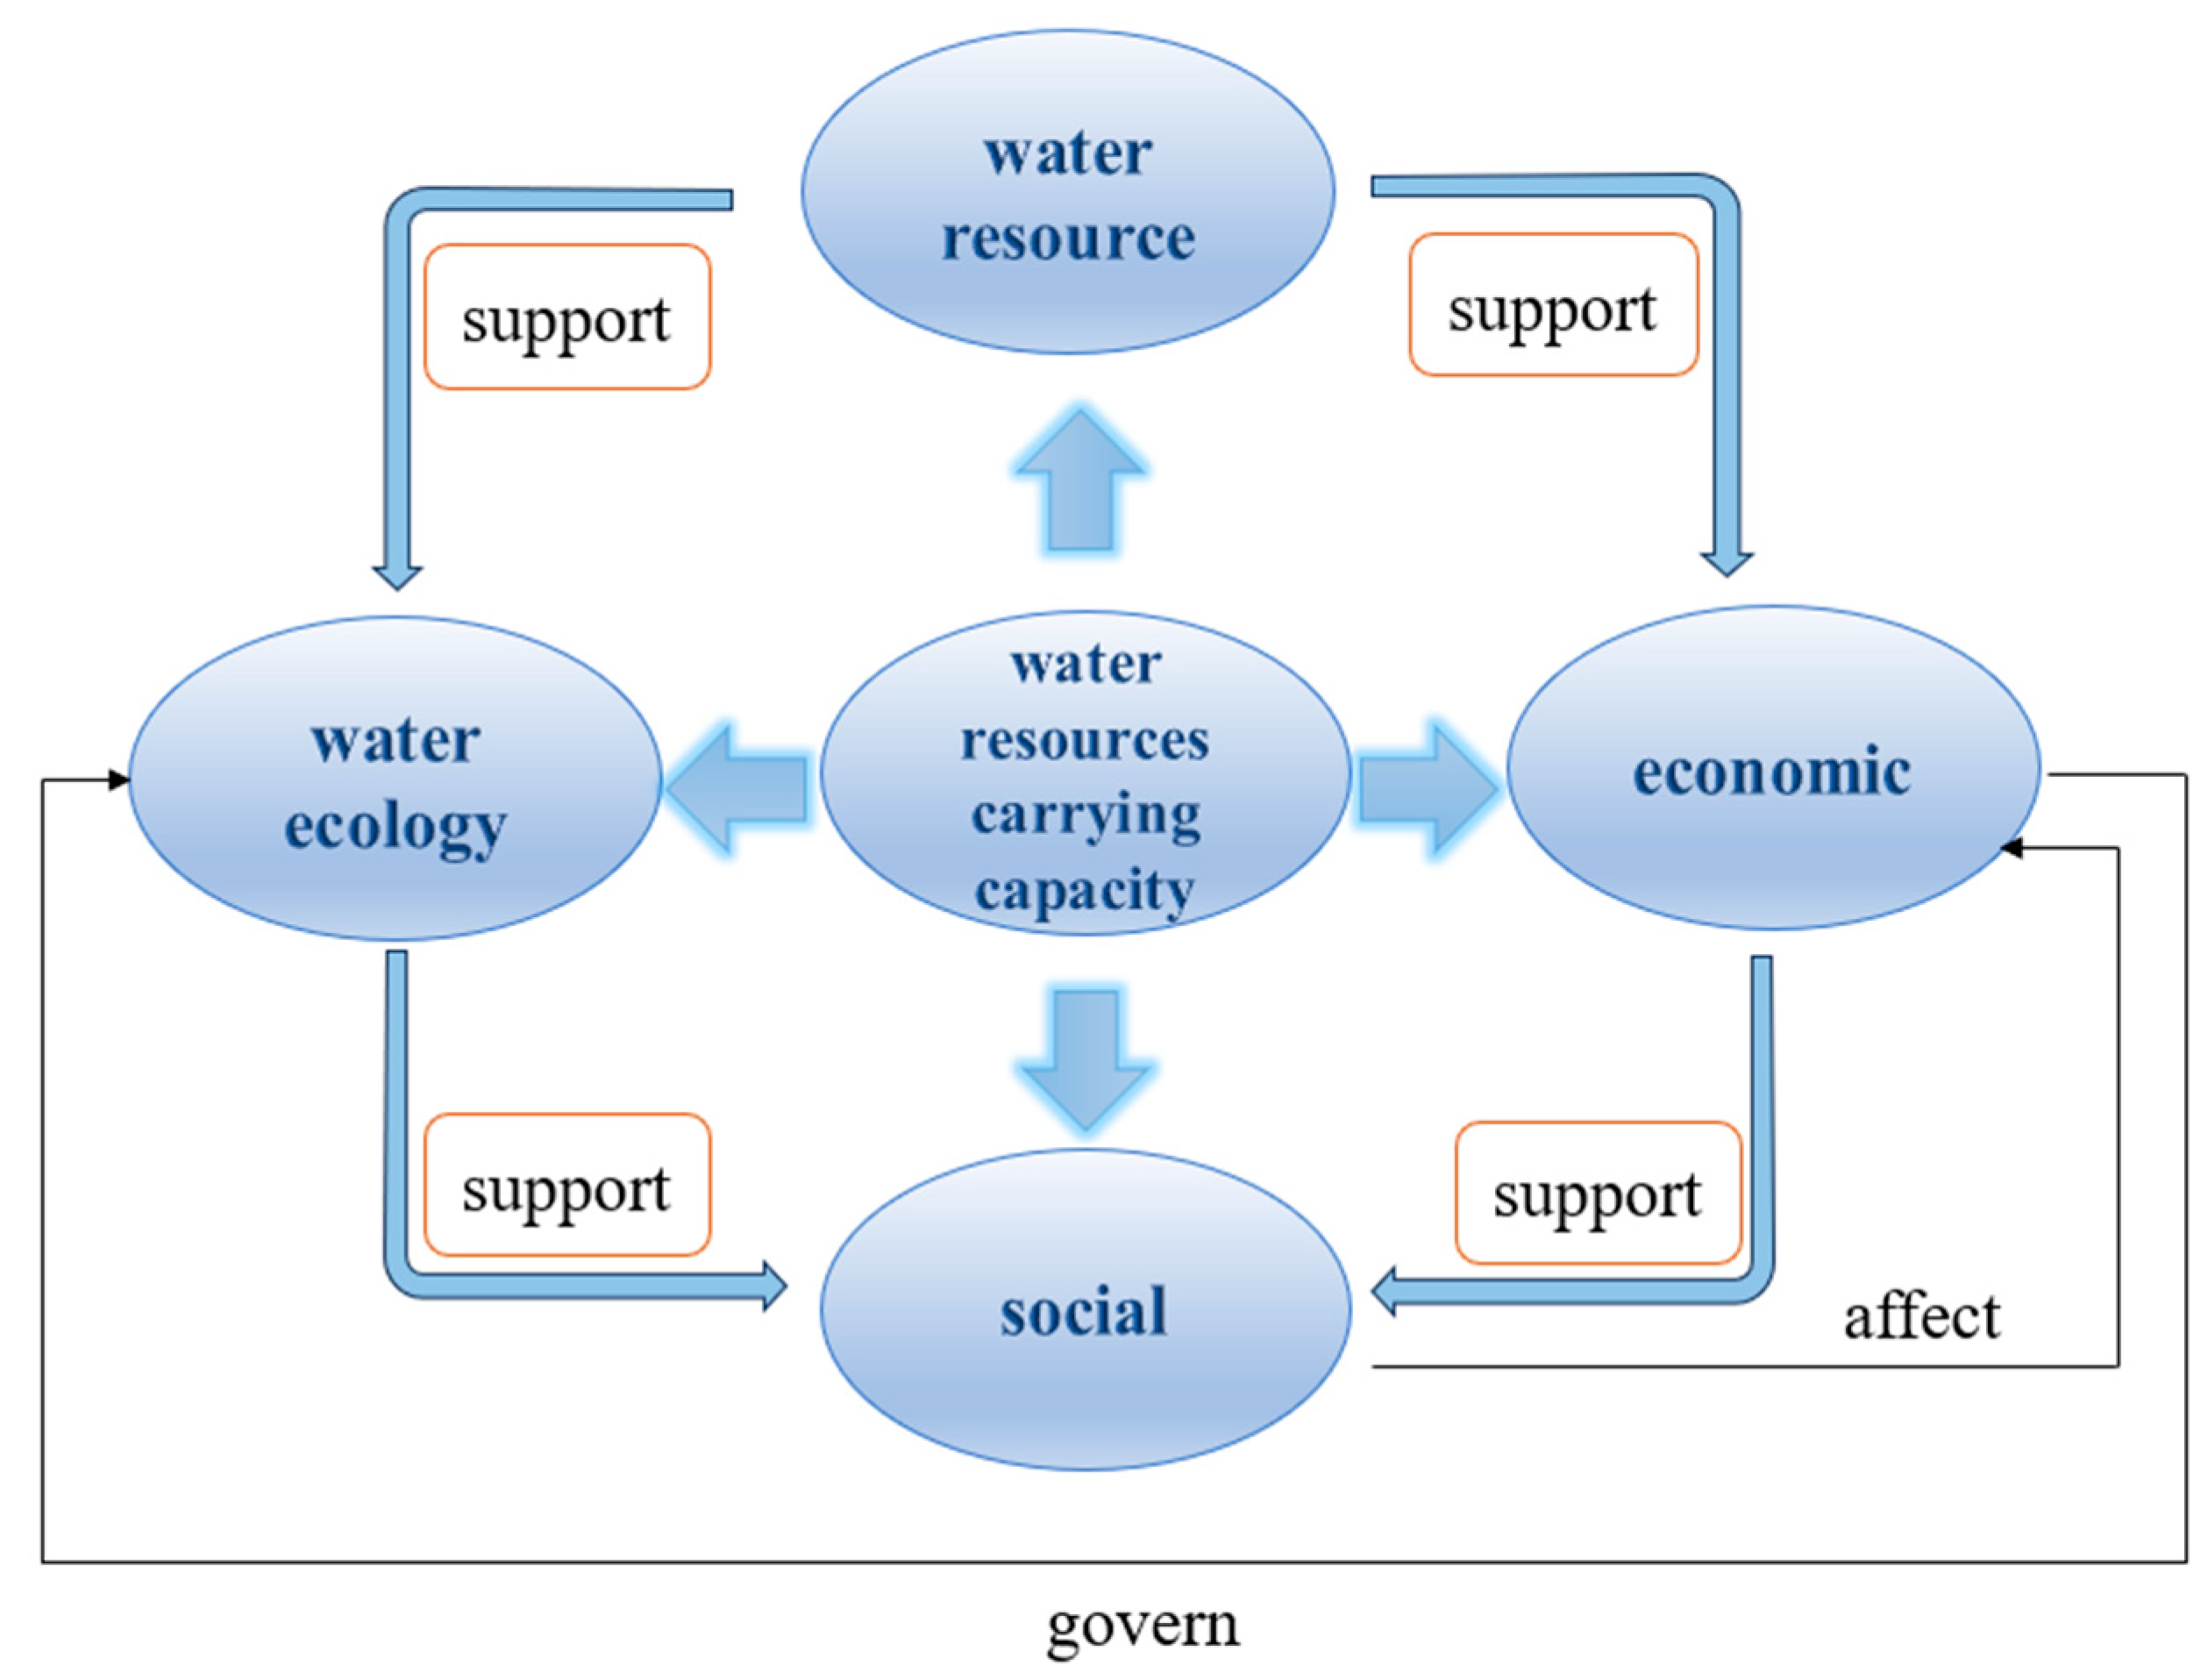
3.1. Model Construction
3.1.1. Target Layer and Criterion Layer
3.1.2. Index Layer
3.2. Screening of Index System
3.2.1. Construction and Selection of Candidate Indicator Library
3.2.2. Selection of Index System
- (1)
- Supporting the power of water resources (represented by A). Annual precipitation is the basic index that describes the statistical water resources and is denoted by A1. Per capita water use refers to the average amount of water used by a person in a given period of time and is expressed as A2. The water production coefficient is the total water resources of the Dongting Lake area divided by the total annual rainfall, represented by A3. The reservoir capacity index is an important background index of water resources in the Dongting Lake area, represented by A4. The length of the dam reflects the characteristics of the Dongting Lake area, expressed by A5. Effective irrigated area is an index that measures the degree of water utilization and stability of agricultural production in agricultural production units and regions, as represented by A6;
- (2)
- Economic support (represented by B). Per capita GDP is the most direct data to grasp the macro-economic status of the Dongting Lake area and is represented by B1. GDP growth rate is an important indicator of macro-economy, represented by B2. Water use for 10,000 yuan of GDP is represented by B3. Industrial and agricultural water production rates reflect the water use efficiency of industry and agriculture in the Dongting Lake eco-economic zone and are represented by B4 and B5, respectively. The output of aquatic products is the index of the comprehensive utilization of water resources in the study area, which can better reflect the economic value of lake water, represented by B6;
- (3)
- Social support (represented by C). Population density is an important index used to measure the population distribution in the Dongting Lake area, as represented by C1. The rate of natural increase is a composite indicator of the level and rate of natural population growth and is expressed as C2. The coefficient of Engel is an important basis for evaluating the living standard of the study area, represented by C3. The urbanization rate is an indicator used to evaluate the degree of urbanization, and it is expressed as C4. Domestic water consumption (including urban and rural domestic water consumption) is an important indicator of water utilization and is expressed as C5;
- (4)
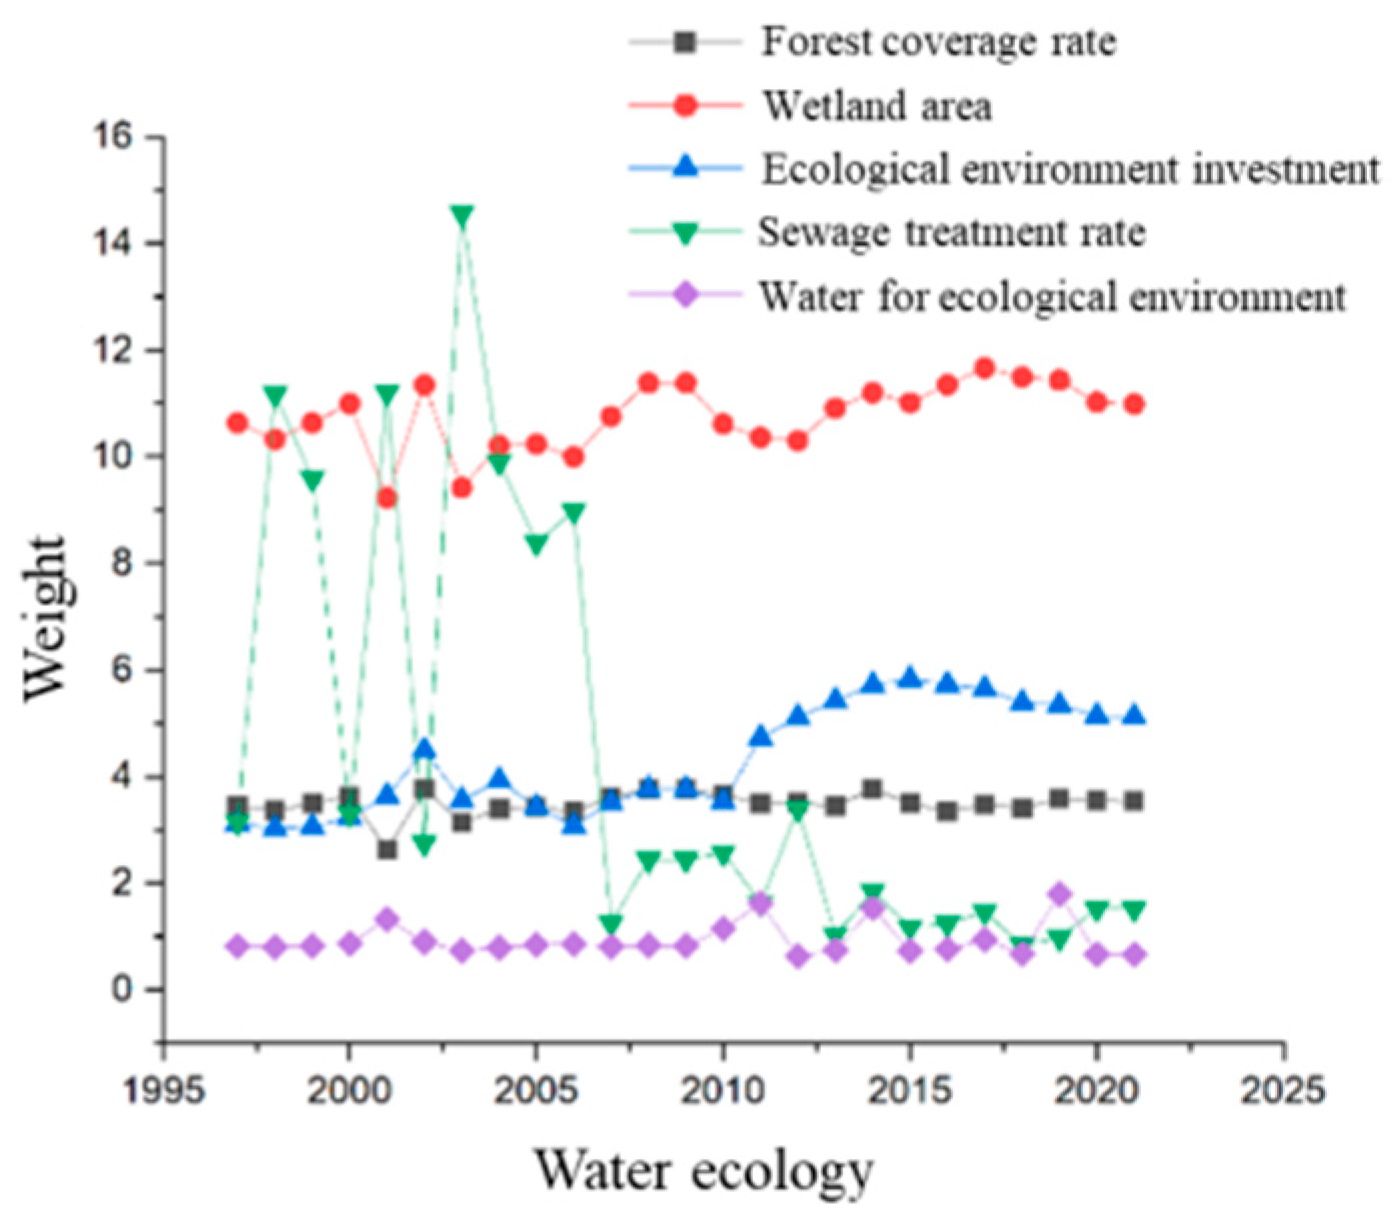
- Supporting force of water ecology (represented by D). The forest coverage rate is an important index reflecting the actual level of forest resources and forest land, represented by D1. The water area and marshland area are important indicators of the health of the water environment in the Dongting Lake area, represented by D2. The indicator of ecological environment input shows the promotion effect of economic development on the environment in the Dongting Lake area, represented by D3. The sewage treatment rate refers to the proportion of the treated domestic sewage and industrial wastewater in total sewage discharge, as represented by D4. Ecological water use refers to the urban environmental water used by man-made measures and partially replenished by rivers, lakes, and wetlands, and is denoted by D5.
3.3. Weight Determination Method
3.3.1. Analytic Hierarchy Process
3.3.2. Entropy Weight Method
- (1)
- Calculate the entropy Hj of the jth index:
- (2)
- Calculate the value of the difference coefficient Ej based on the entropy Hj.
- (3)
- Calculate the index weight Wj.
3.3.3. Weight Determination by DWM
3.4. BP Network Model for Risk Early Warning
3.4.1. BP Neural Network and Its Basic Principles
3.4.2. BP Neural Network Structure
3.5. Division of Risk Early Warning Intervals
4. Evaluation of Water Resources Carrying Capacity in Dongting Lake Area
4.1. Data Source
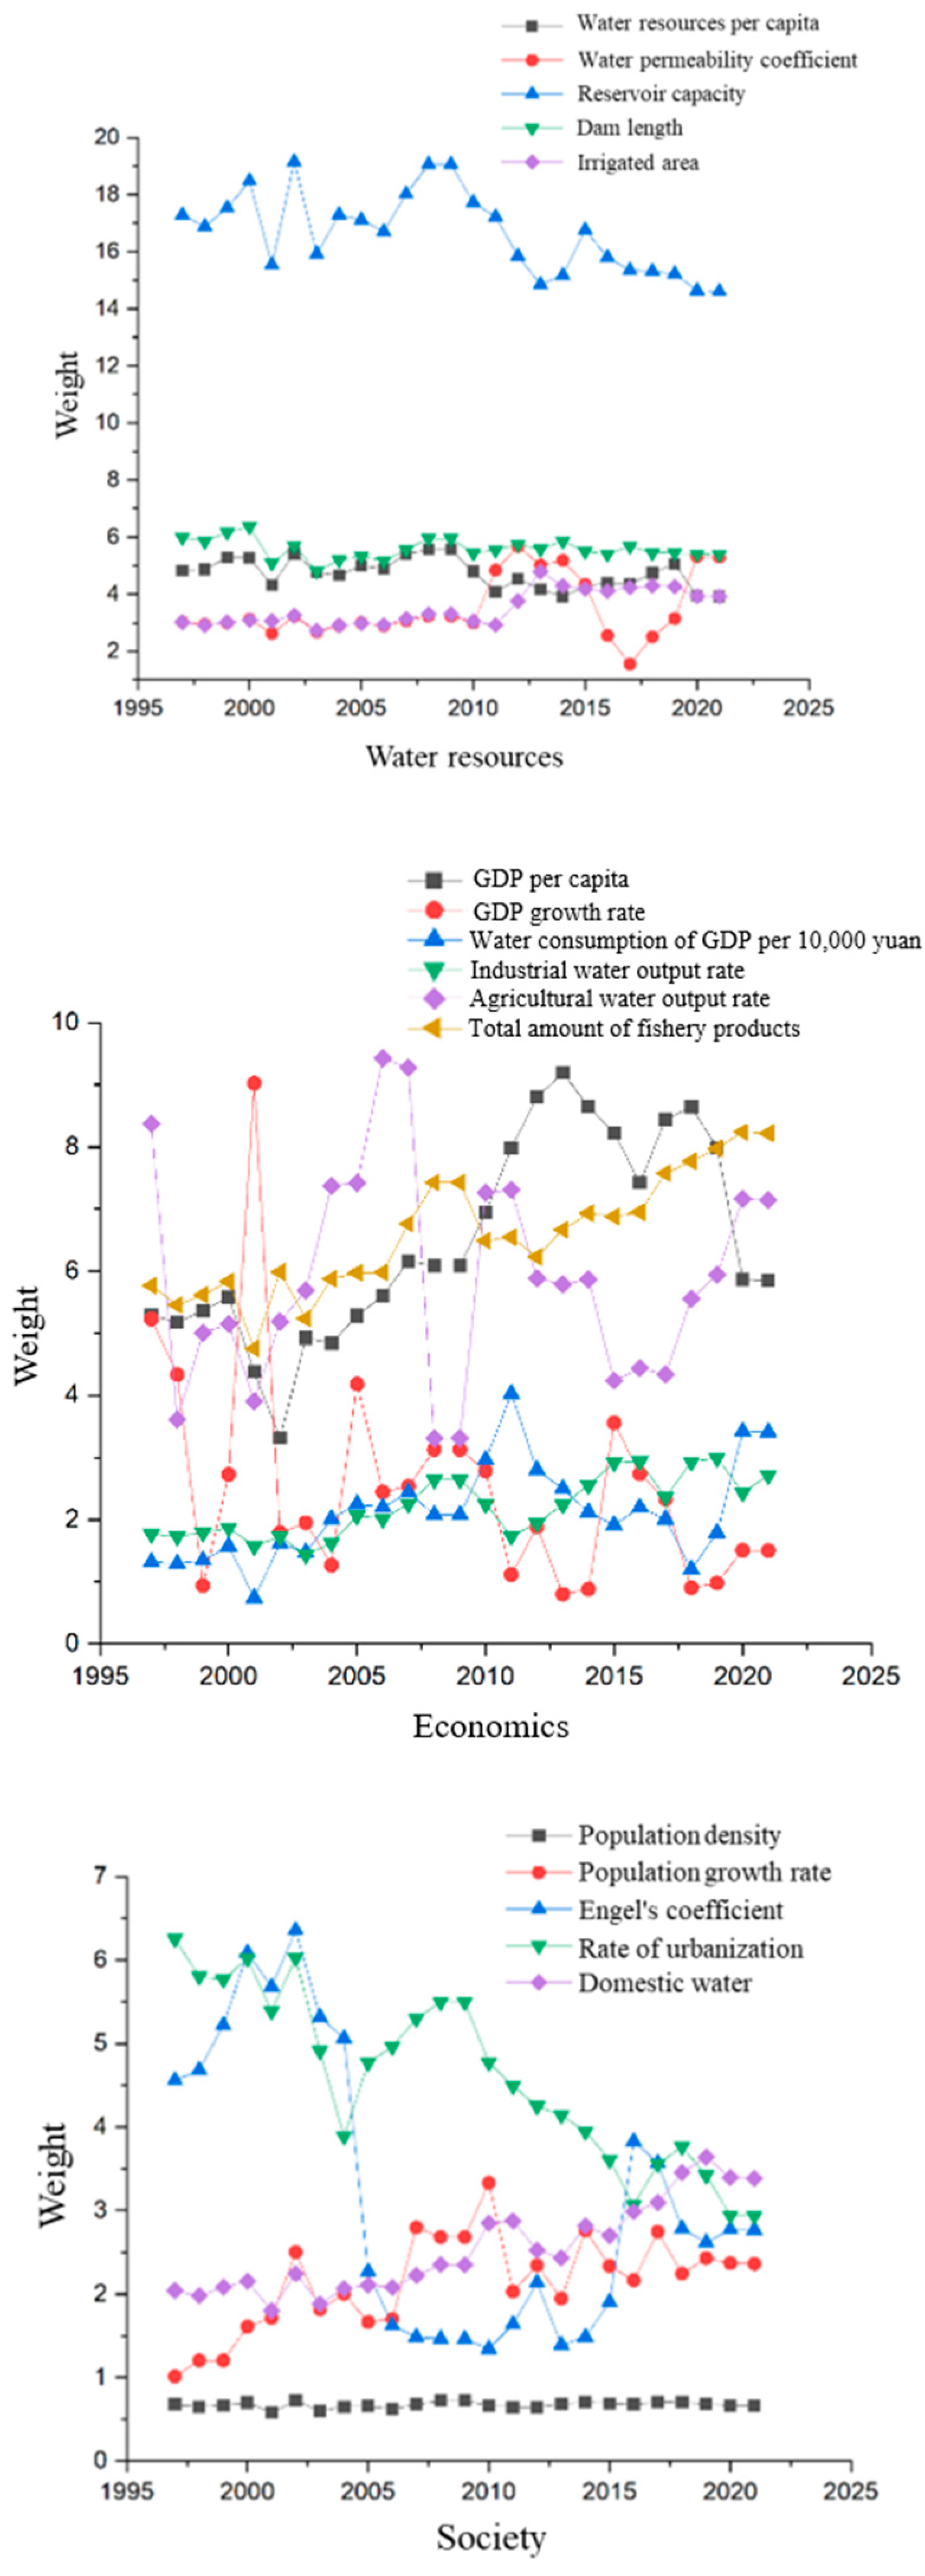
4.2. DWM Weight Calculation
4.2.1. AHP Weight
4.2.2. EWM Weight
4.2.3. DWM Wight
4.3. Calculation of Water Resources Carrying Capacity
5. Result Analysis
5.1. Analysis of Time Trend
5.1.1. Yueyang City
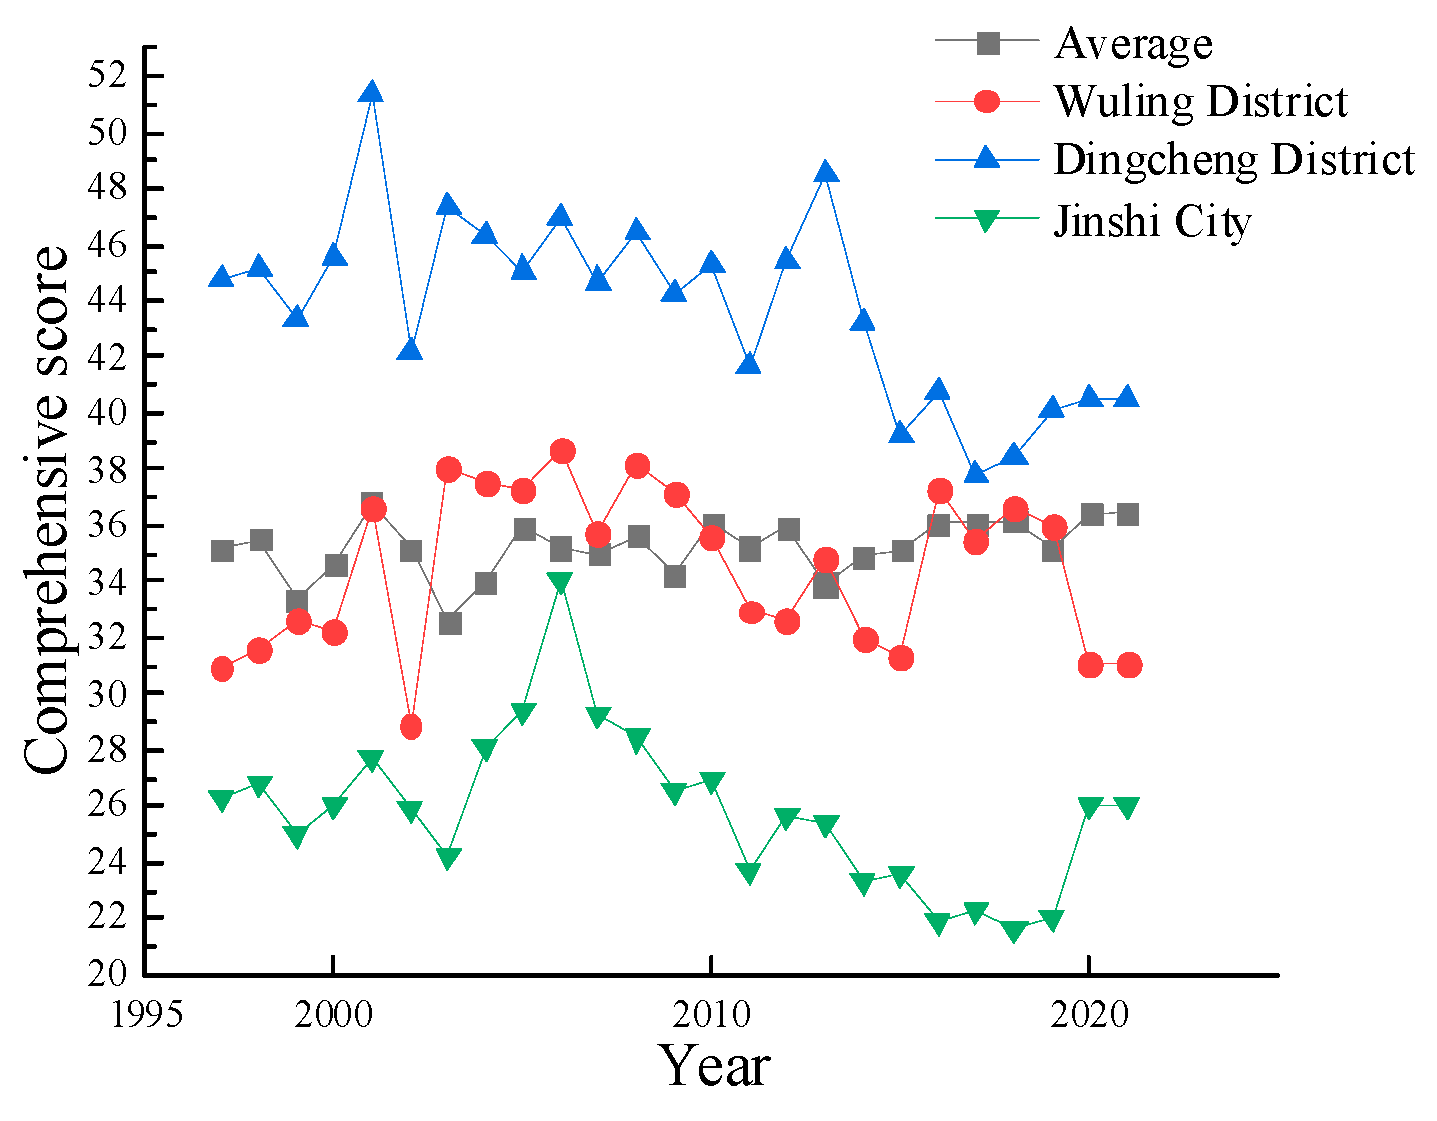
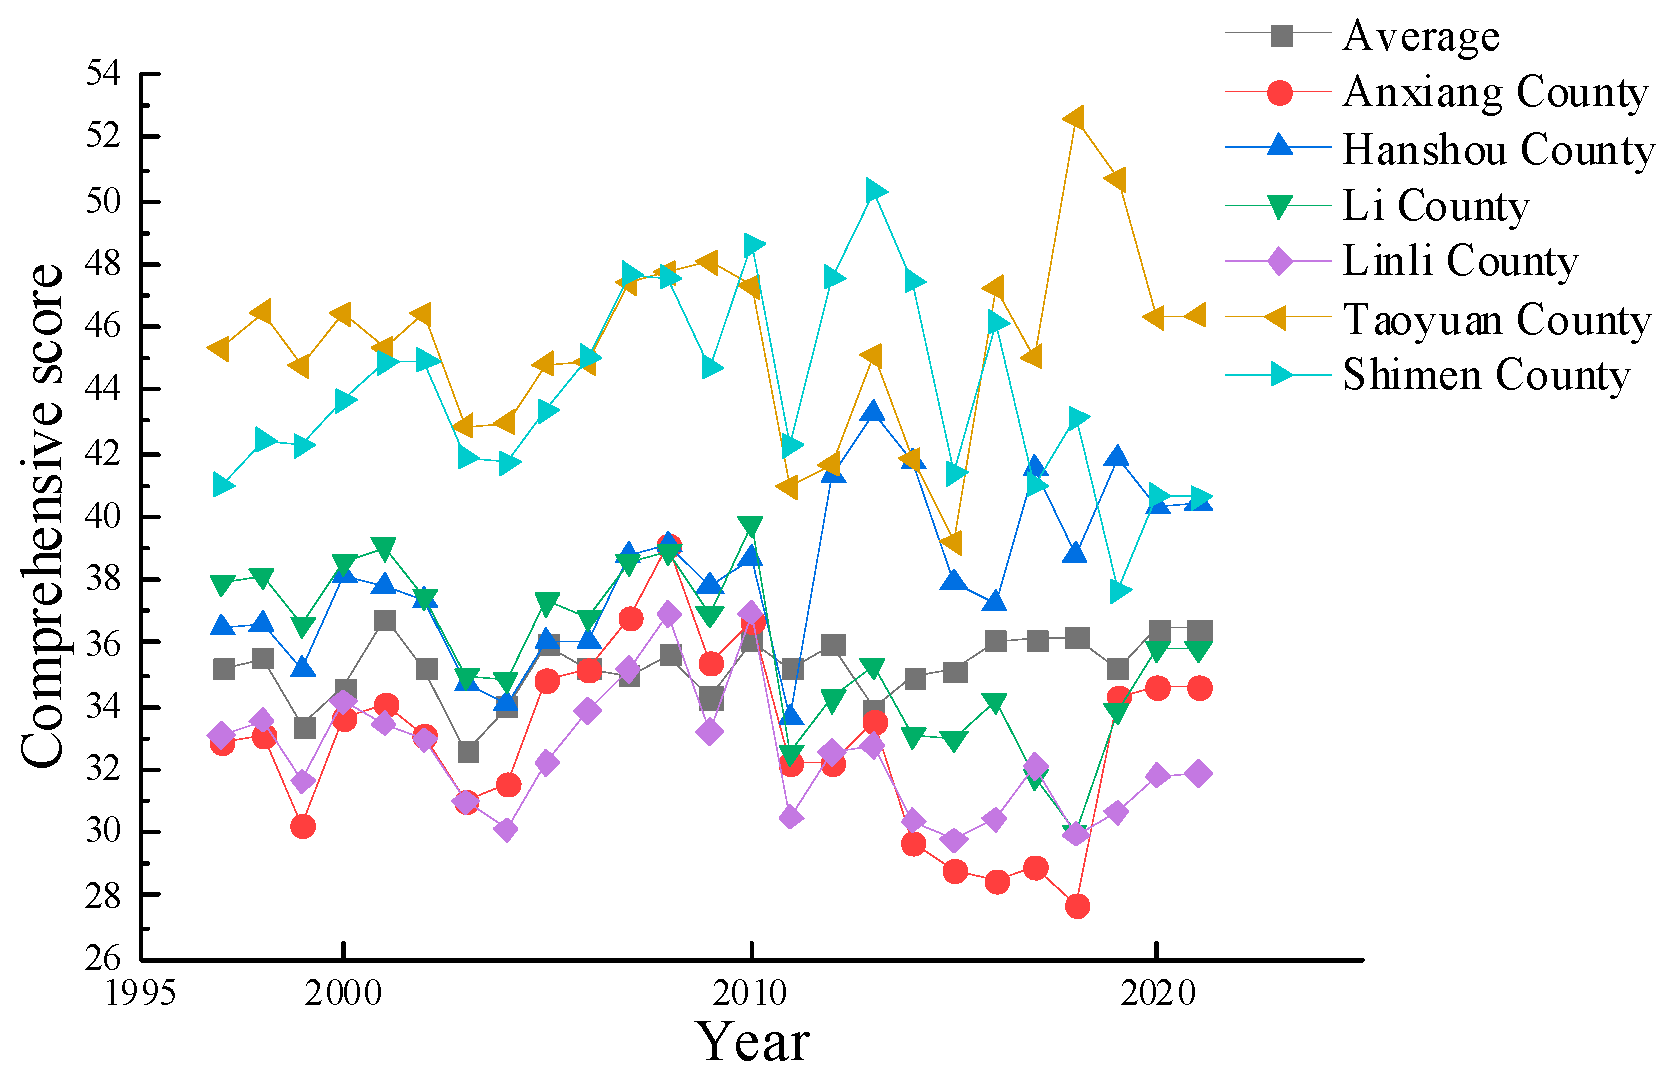
5.1.2. Changde City
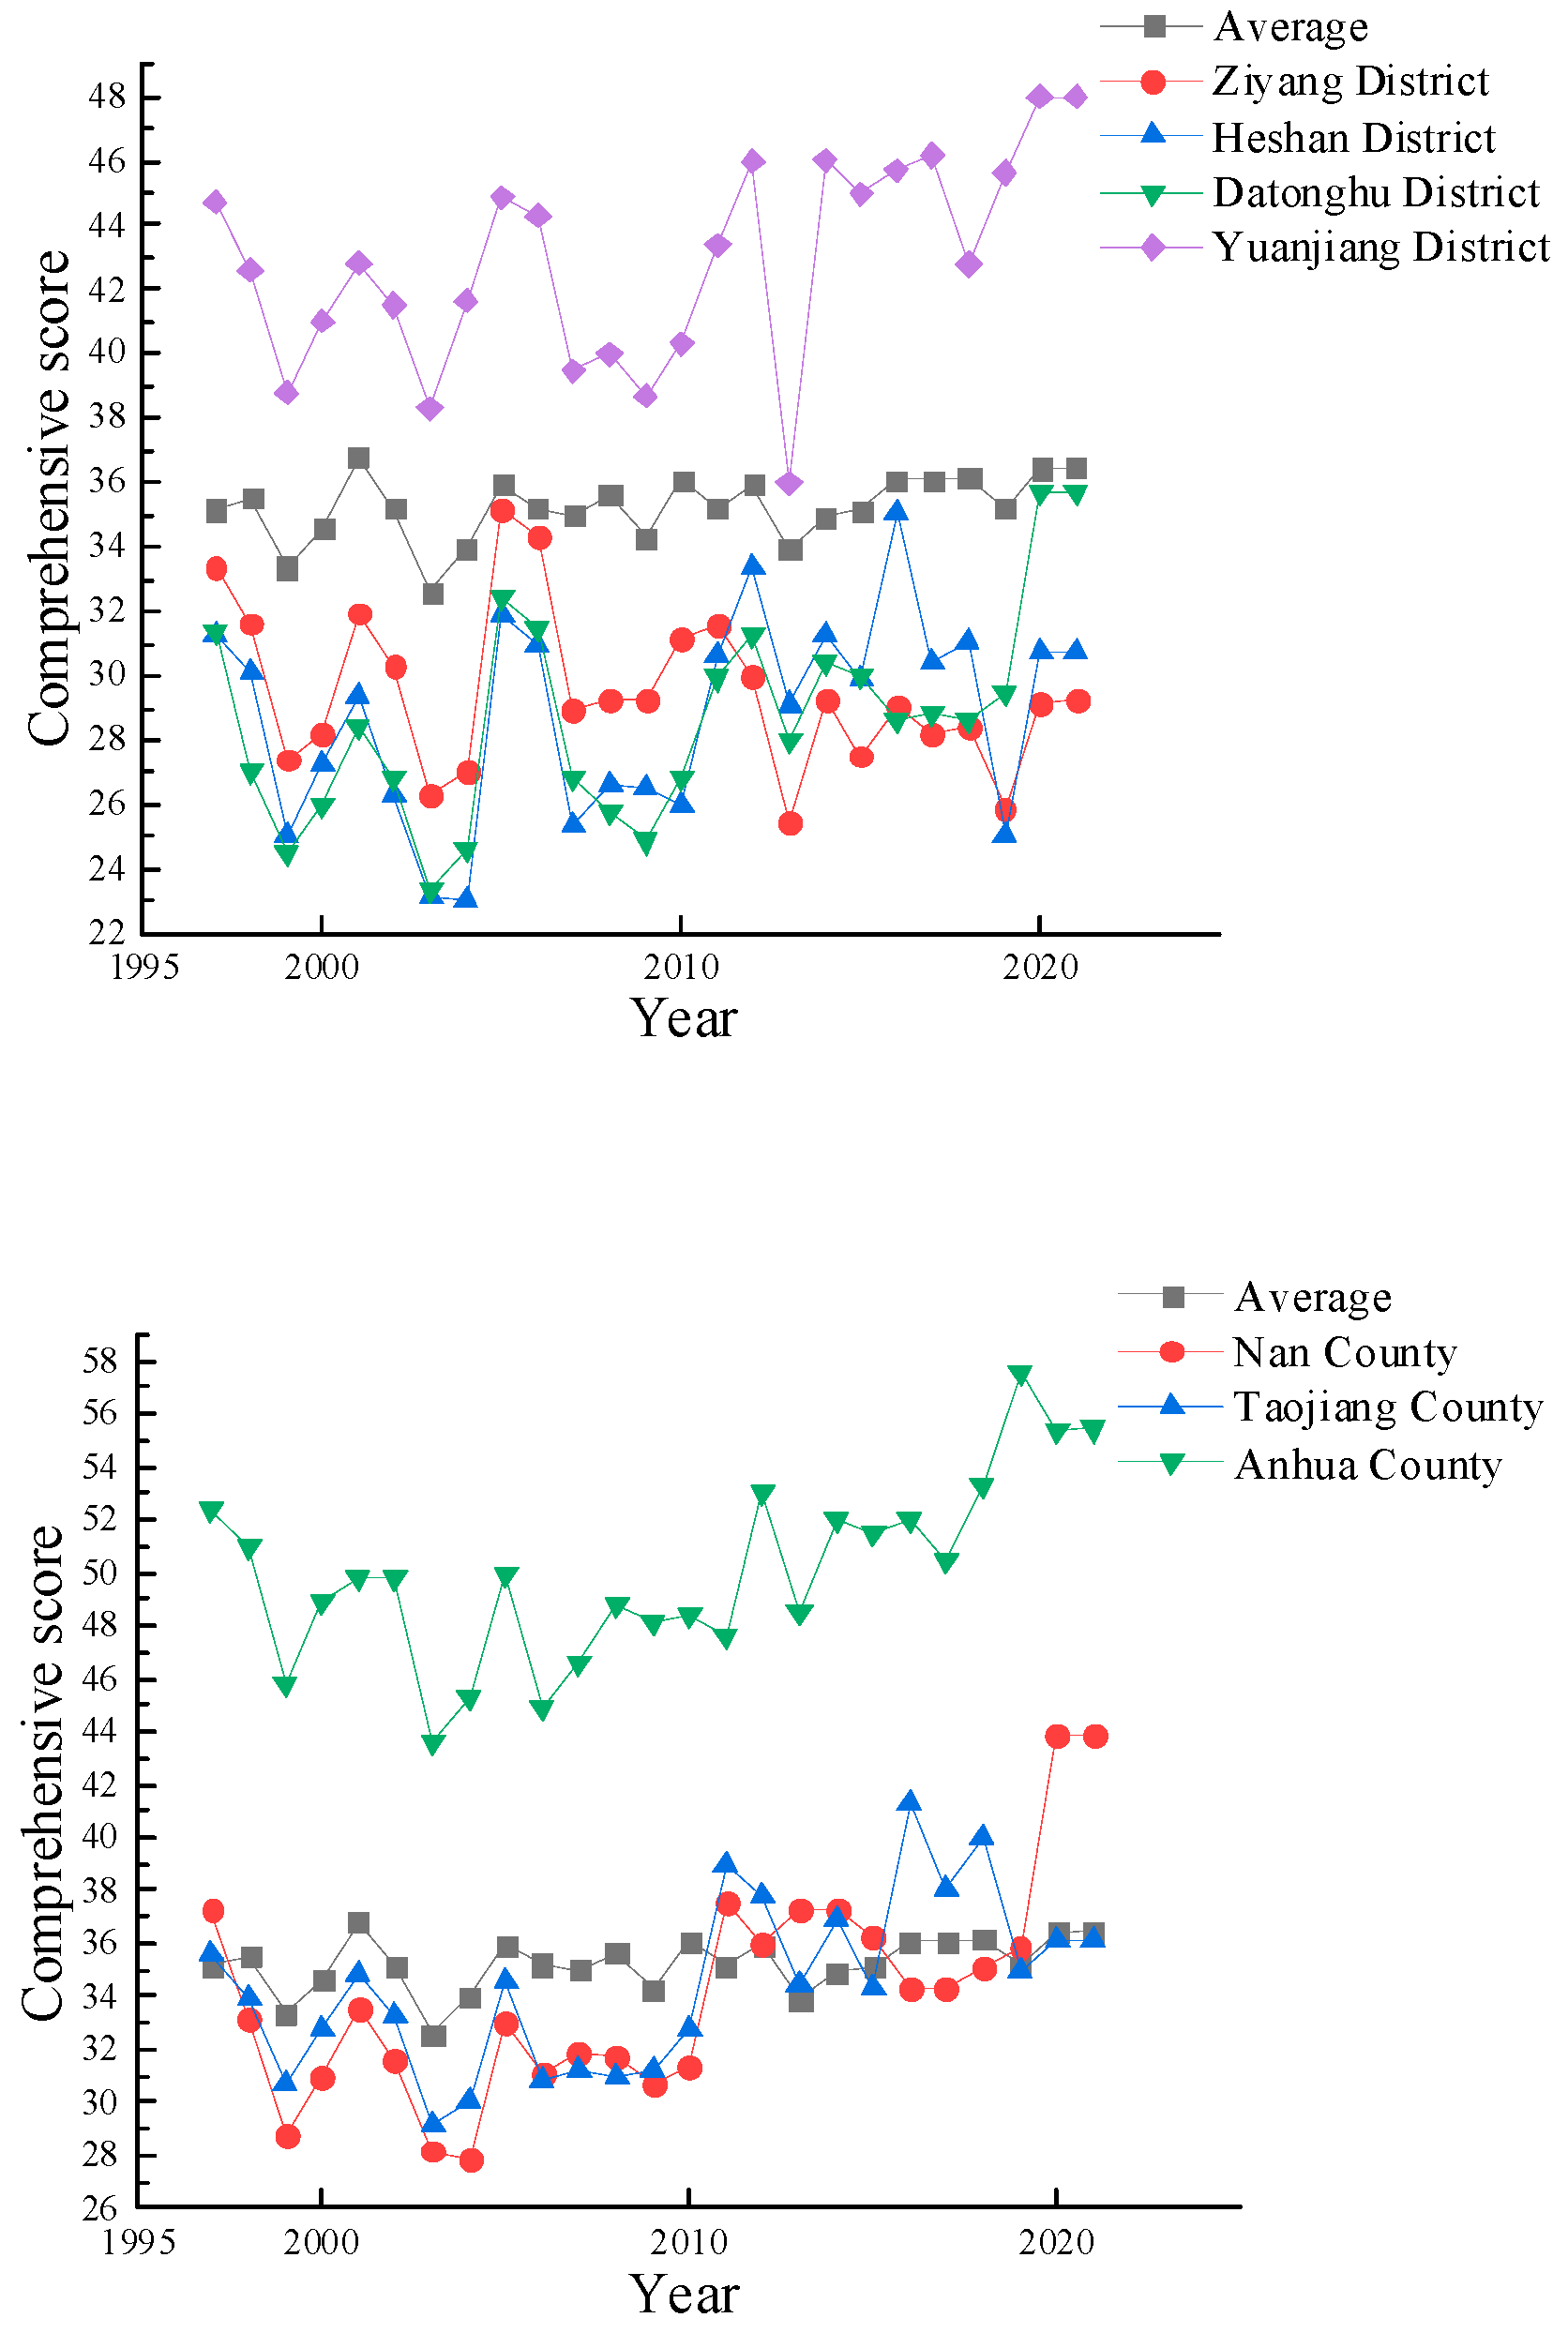
5.1.3. Yiyang City
5.1.4. Changsha (Wangcheng District)
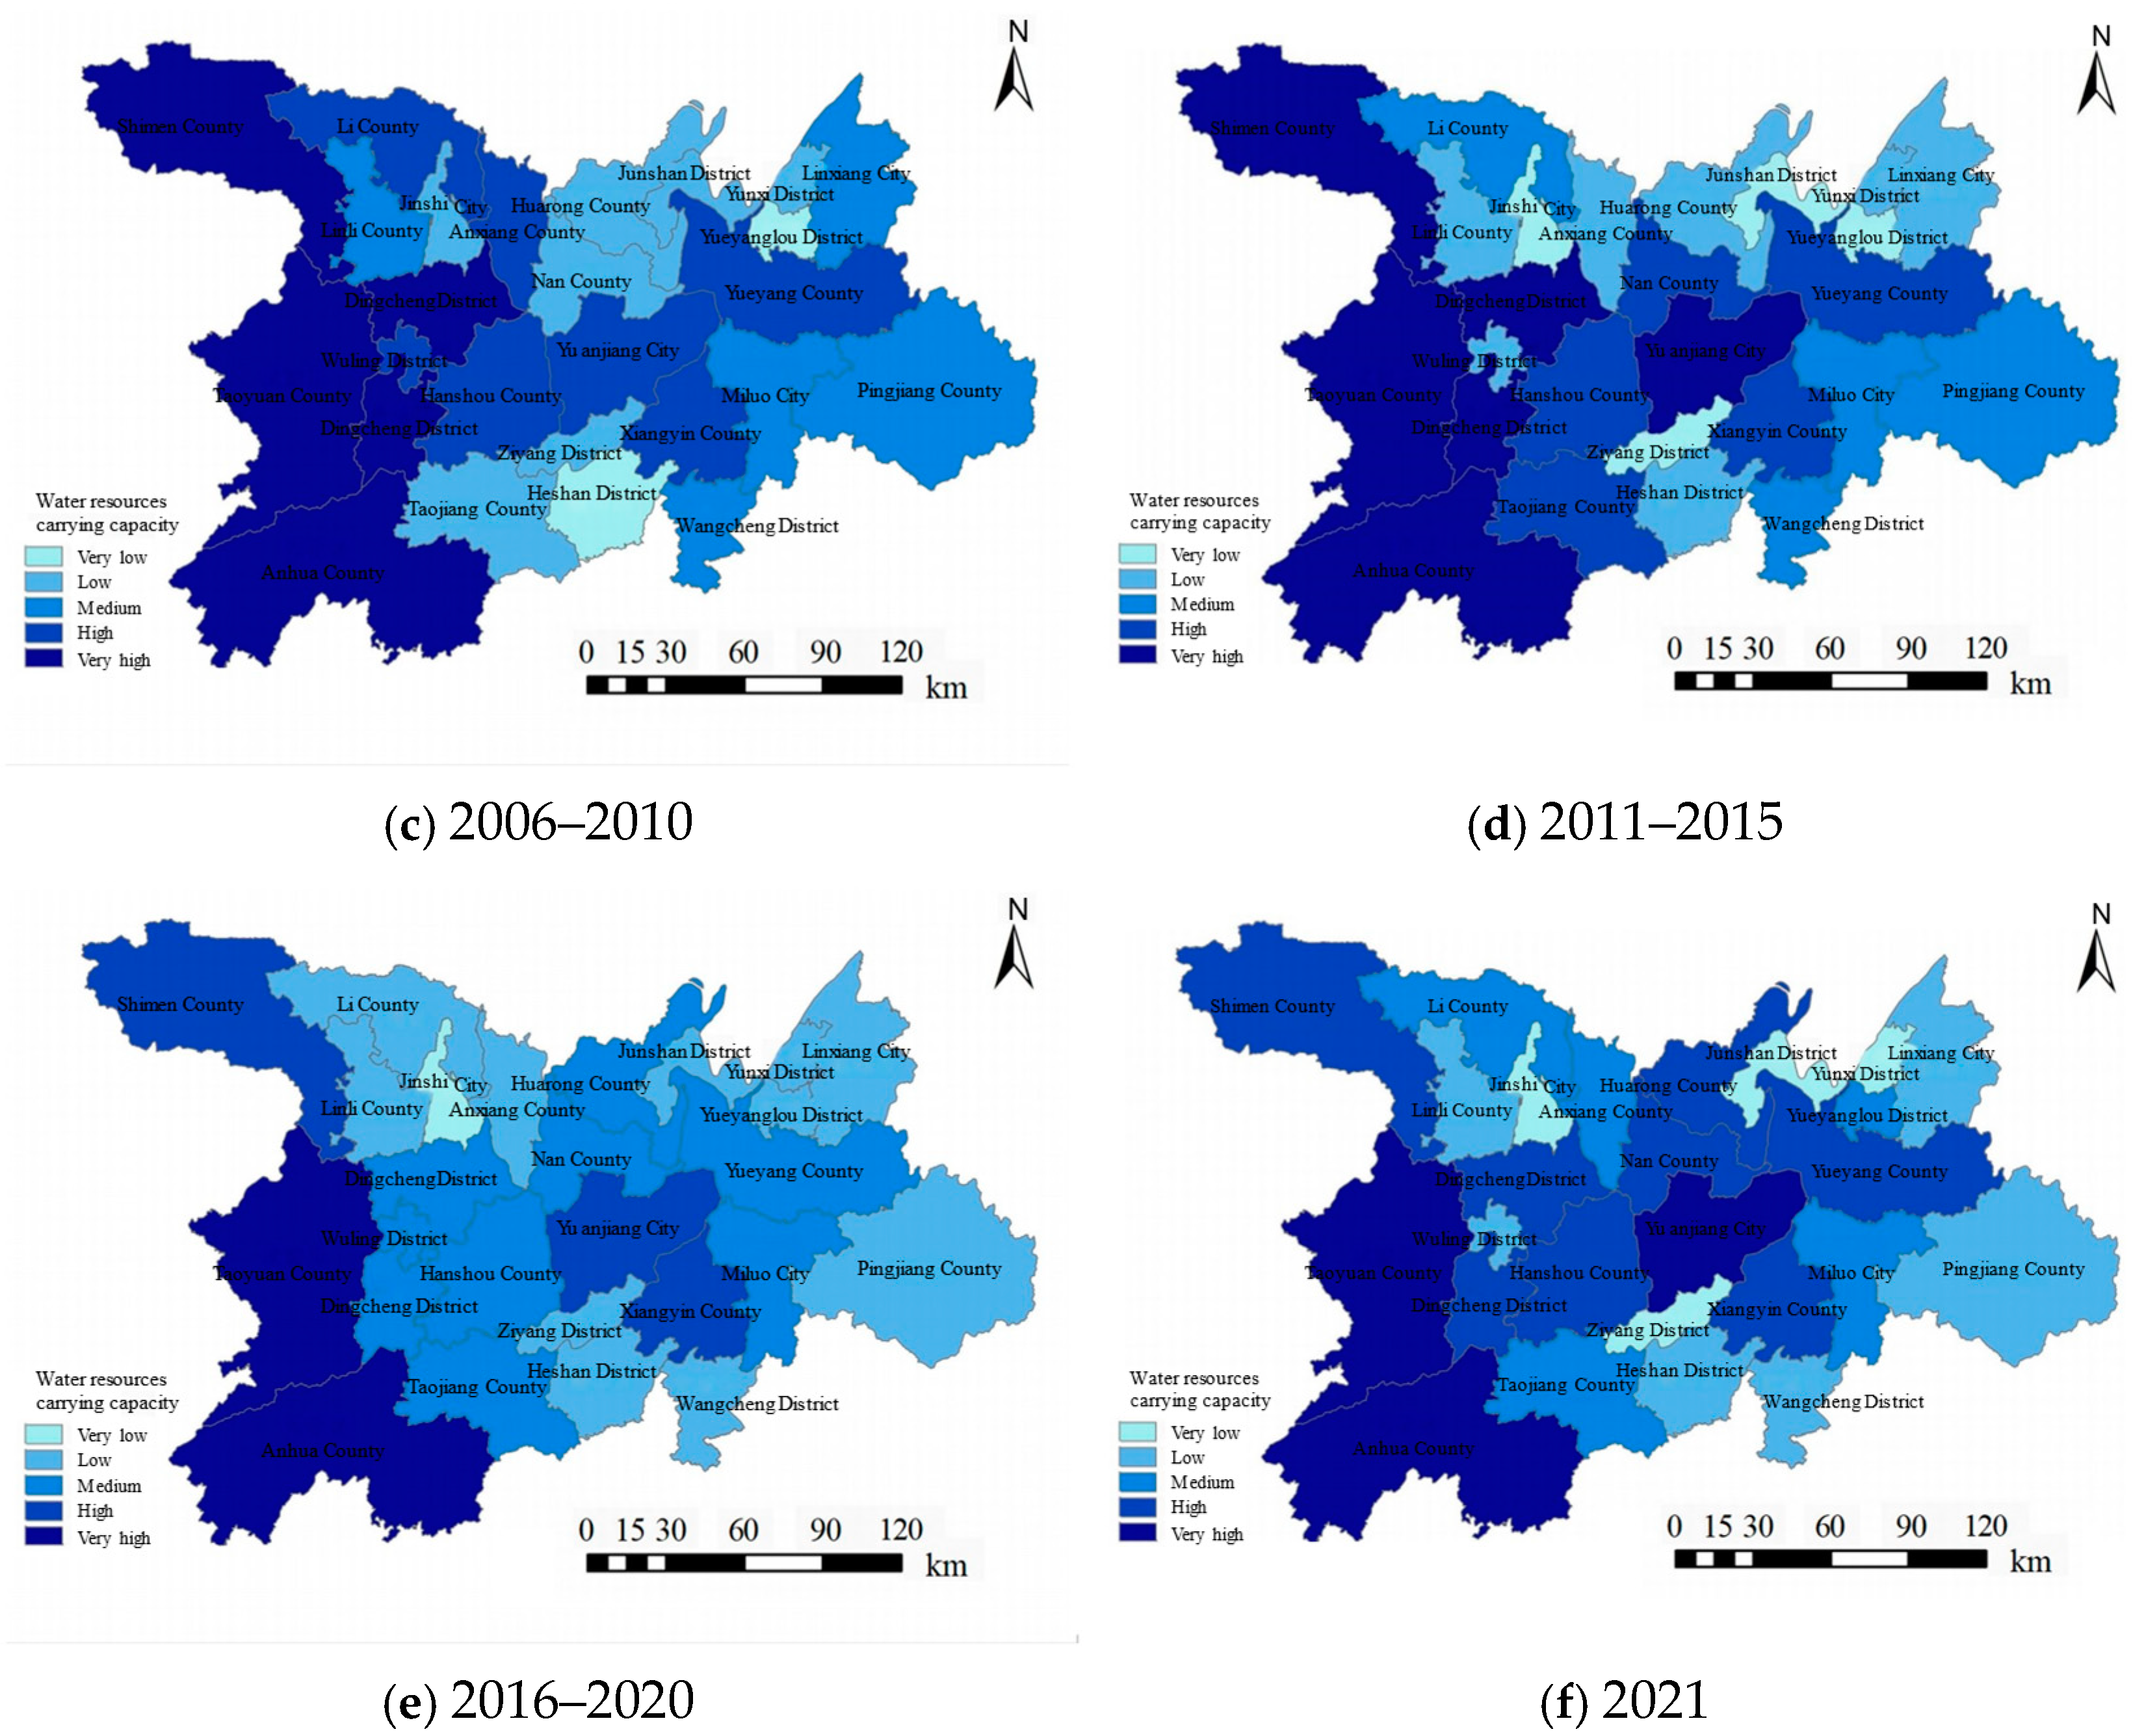
5.2. Spatial Evolution Analysis
5.3. Analysis of Superior and Inferior Indicators
5.3.1. Evaluation of Superior and Inferior Indicators
5.3.2. Comparison of Advantages and Disadvantages of Indicators of Each County
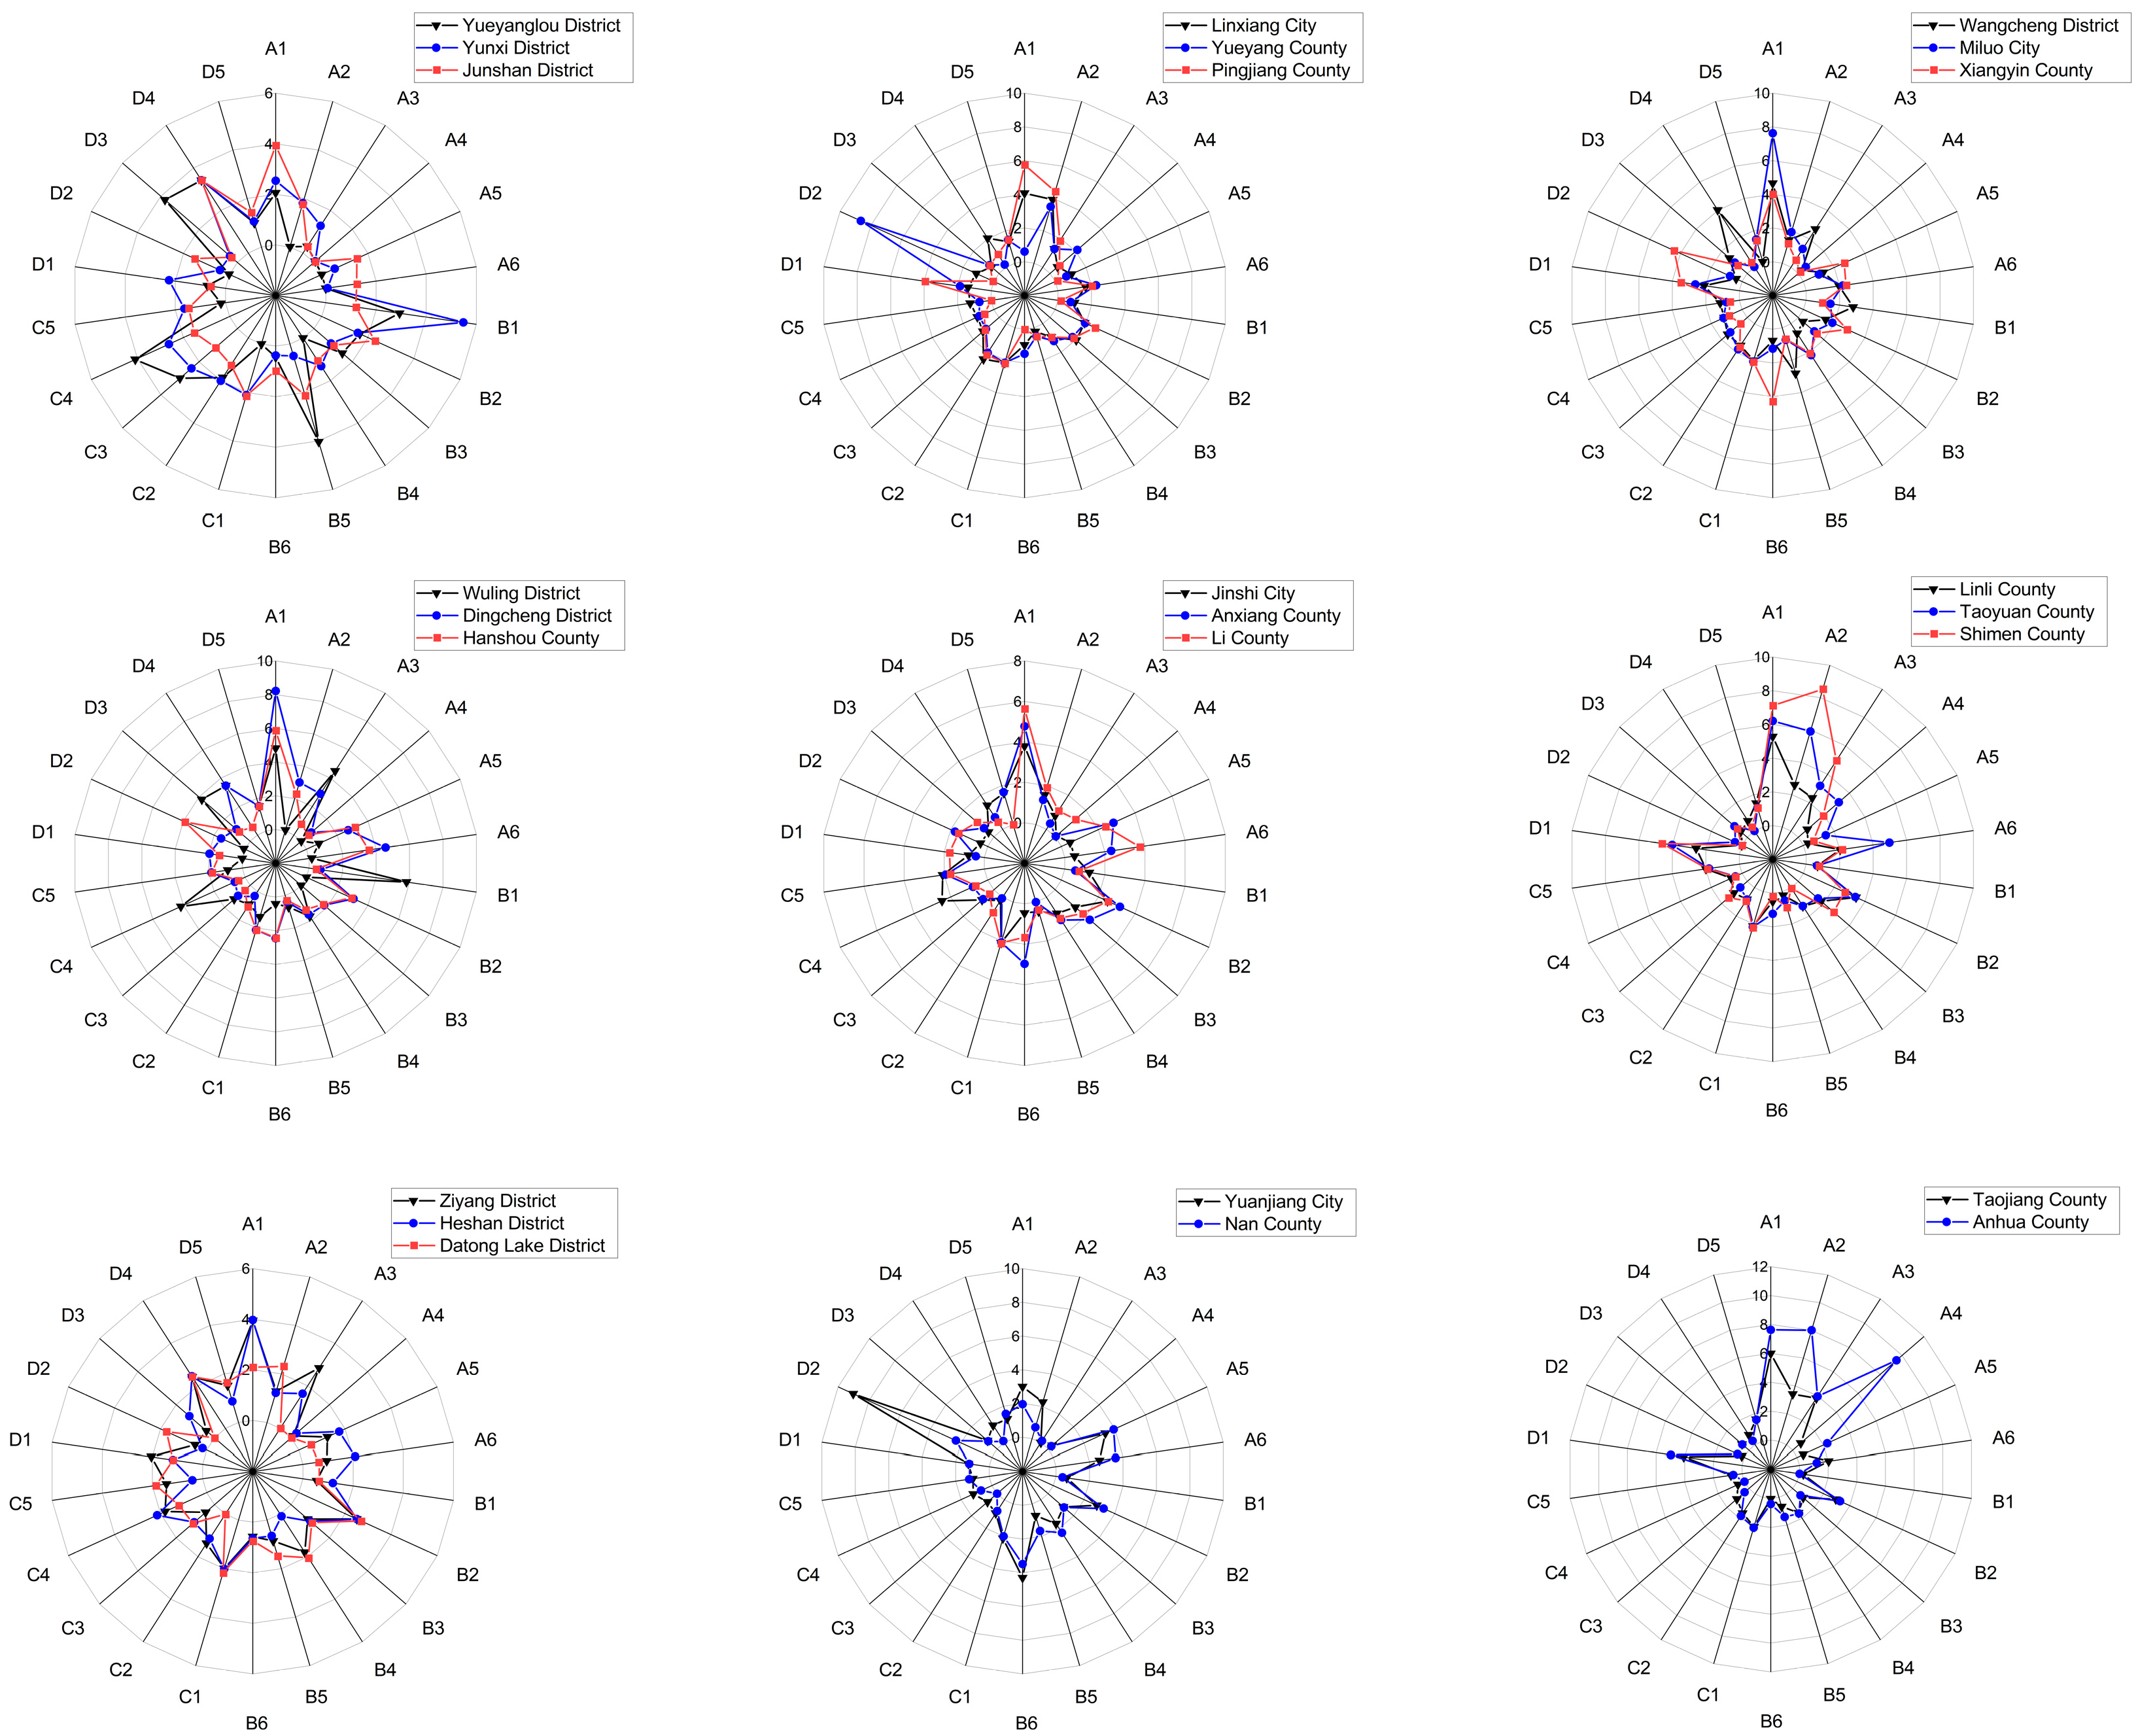
5.3.3. Indicator Radar Chart
5.4. Prediction of Water Resources Carrying Capacity
5.4.1. Verification of BP Neural Network Prediction Model
5.4.2. Prediction and Spatial Distribution of Water Resources Carrying Capacity
5.4.3. Early Warning of Water Resources Carrying Capacity
- (1)
- On the whole, the water resources carrying capacity of the Dongting Lake area fluctuates and then drops to a stable level, and the risk degree will still be in the state of “overloading”. From 2023 to 2025, the risk degree of water resources carrying capacity in the Dongting Lake area remains unchanged and slightly improves; that is, the predicted water resources carrying capacity of the research area increases. The evaluation value increases from the initial 0.3518 to the highest point of 0.3680 in 2001 and then gradually drops to the lowest point of 0.3429 in 2009. From 2010 to 2021, and in the prediction part, the carrying capacity is stable at about 0.362, which is slightly higher than the initial level. The overall risk is in an “overload” state. By 2025, its comprehensive evaluation value of water resources carrying capacity will slightly increase to 0.363, and the risk will be slightly improved. But there is no substantial change in the risk, and it will continue to be in an “overload” condition, with the signal light remaining an “orange light”;
- (2)
- The time series prediction scheme of the BP neural network toolbox in MATLAB (R2022a) is used in the prediction part. After testing, it is concluded that the prediction model is more accurate for the 4-year results. Therefore, the prediction results continued until 2025. From 1997 to 2025, the risk level of resource and environmental carrying capacity of most districts and counties in the Dongting Lake area will remain unchanged; the water resources carrying capacity of Xiangyin County, Hanshou County, and Nanxian County will recover from overload to critical during 2015–2020; and for Dingcheng district, which is in the critical range, it is predicted that its carrying capacity in the future will change from critical to overload.
6. Discussion
- (1)
- Natural growth rate refers to the ratio of the natural population growth within a unit of time in a year to the average total number of people in a year, usually expressed in per thousand. It is a comprehensive indicator used to explain the level and speed of natural population growth. Existing achievements define the natural population growth rate as a “negative indicator”. However, with the reality that, at least in China, the birth rate and the number of new births are significantly declining, this study takes the birth rate as a “positive indicator”;
- (2)
- Urbanization rate (also called urbanization ratio) is a measurement indicator of urbanization. Generally, demographic indicators are used, that is, the proportion of the urban population to the total population. C4 (urbanization rate) is a disadvantageous indicator. In terms of the social level of the Dongting Lake area, urbanization is a positive indicator for the evaluation of water resources carrying capacity, but it is a disadvantageous indicator in the three regions with the highest comprehensive carrying capacity. This shows that accelerating the urbanization rate to improve the water resources carrying capacity is not the optimal solution in the Dongting Lake area. This is consistent with the policy direction of implementing the rural revitalization strategy and developing industries according to local conditions;
- (3)
- The county-level unit is the most basic unit of China’s administrative division. It is the only administrative division setting unit that has never been changed since China had administrative units in history, which fully shows the importance of counties in China’s administrative management. This study evaluates and predicts the water resources carrying capacity based on 26 county-level units in the Dongting Lake Ecological Economic Zone. At present, no relevant literature and research results have been released. The entropy weight method is used to determine the objective weight, which is determined by the information entropy of each index data between county-level units. Therefore, compared with city-level units (such as Yueyang, Changde, and Yiyang cities), county-level units are more accurate in evaluation. At the same time, county-level units can better find specific plans and ways to improve water resources carrying capacity;
- (4)
- Weight determination is the most important factor affecting the evaluation results. Selecting a subjective and objective combination method for weighting has a certain rationality for the study of each unit in the research area. Most literatures generally use a single method. In this study, in line with the improvement of research goals and indicators, DWM is used to determine index weights, and the conclusion is more representative.
7. Conclusions
- (1)
- The water resource carrying capacity of the Dongting Lake area is stable and will remain stable for a long time in the future. The increase in water resource carrying capacity in various regions was mainly concentrated from 2015 to 2020, and the decline was mainly concentrated from 2000 to 2010, which is related to national policies to a certain extent;
- (2)
- The water resources carrying capacity is relatively high in the western and southern regions of the Dongting Lake area, while that in the eastern part is relatively low. The areas with the highest water resources carrying capacity are Anhua County, Shimen County, and Taoyuan County. The areas with the weakest carrying capacity are Jinshi City, Yueyanglou District, and Datonghu District;
- (3)
- In the comparison of county-level units, the water resources carrying capacity is significantly different. The numerical range is [0.217, 0.575]. The lowest carrying capacity value was Yueyanglou District in 2009, and the maximum value was Anhua County in 2019. In terms of the rate of change, Yueyanglou District has the largest increase in water resources carrying capacity, with an increase of 47.53%. Wangcheng District has the largest decline. During the evaluation period, it decreases by 22.03%;
- (4)
- Based on the regression analysis and prediction of the BP neural network, the water resources carrying capacity of the Dongting Lake area is generally in an overloaded state and inclined to a critical state. The overall trend is fluctuating down and then slightly up. The areas with higher water resources carrying capacity in the western part of Dongting Lake will continue to be maintained. The counties around Yuanjiang City and in the central part of the lake will change from overloaded to critical, and Dingcheng District will change from the original critical state to overload;
- (5)
- According to the calculation results of the comprehensive subjective and objective evaluation method, combined with the above analysis chart, coordinated efforts in multiple aspects are still required to improve the water resources carrying capacity of each county and district in the Dongting Lake area. The specific measures are as follows: The key to enhancing the carrying capacity of regional water resources lies in establishing the Dongting Lake big data platform to achieve resource coordination and information sharing. Through the transformation towards a green economy, support ecological agriculture and industrial clusters to promote employment among farmers and invigorate the county economy. Meanwhile, integrating into the Yangtze River Economic Belt, innovating governance models, promoting environmental marketization reforms, attracting social capital participation, and jointly enhancing the sustainable carrying capacity of water resources.
Author Contributions
Funding
Data Availability Statement
Conflicts of Interest
References
- Luo, Y.; Su, R. Environmental Impact of Waste Treatment and Synchronous Hydrogen Production: Based on Life Cycle Assessment Method. Toxics 2024, 12, 652. [Google Scholar] [CrossRef] [PubMed]
- Li, J. Global water shortage and food crisis. Ecol. Econ. 2021, 37, 5–8. [Google Scholar]
- Feng, Z.; Yang, Y.; Yan, H.; Pan, T.; Li, P. Research on resource and environmental carrying capacity in the past century: From theory to practice. Resour. Sci. 2017, 39, 379–395. [Google Scholar]
- Maltus, T.R. An Essay on the Principle of Population; Pickering & Chatto Publishers: London, UK, 1798. [Google Scholar]
- Falkenmark, M.; Lundqvst, J. Towards water security: Political determination and human adaptation crucial. Nat. Resour. Forum 1998, 21, 37–51. [Google Scholar] [CrossRef]
- Milano, M.; Ruelland, D.; Dezetter, A.; Fabre, J.; Ardoin-Bardin, S.; Servat, E. Modeling the current and future capacity of water resources to meet water demands in the Ebro basin. J. Hydrol. 2013, 500, 114–126. [Google Scholar] [CrossRef]
- Hui, Y.; Jiang, X.; Huang, Q.; Xue, X. Research on evaluation index system of water resources carrying capacity. Bull. Soil Water Conserv. 2001, 21, 30–34. [Google Scholar]
- Xu, Y. Comprehensive evaluation research on water resources carrying capacity in arid areas—Taking the Hotan River Basin in Xinjiang as an example. J. Nat. Resour. 1993, 8, 229–237. [Google Scholar]
- Xia, J.; Zhu, Y. Measurement of water resources security: Research and challenges of water resources carrying capacity. J. Nat. Resour. 2002, 17, 262–269. [Google Scholar]
- Hui, Y.; Jiang, X.; Huang, Q.; Xue, X. Research on dynamic simulation model of water resources carrying capacity system under binary mode. Geogr. Res. 2001, 20, 191–198. [Google Scholar]
- Li, L.; Fu, Q. Research on urban water resources carrying capacity by partial least squares regression model. Adv. Water Sci. 2005, 16, 822–825. [Google Scholar]
- Zhao, N. Empirical research on water resources carrying capacity and pressure status in Beijing. Urban Dev. Stud. 2009, 16, 142–146. [Google Scholar]
- Men, B.; Wang, Z.; Liang, C.; Fu, Q. Application of matter-element model in comprehensive evaluation of regional groundwater resources carrying capacity. J. Sichuan Univ. (Eng. Sci. Ed.) 2003, 35, 34–37. [Google Scholar]
- Tian, J.; Wang, X. Research on water resources carrying capacity in arid areas based on entropy weight fuzzy matter-element model—Taking Minqin County, Gansu Province as an example. J. Fudan Univ. (Nat. Sci. Ed.) 2013, 52, 86–93. [Google Scholar]
- Wang, S.; Hou, Y.; Zhang, X.; Ding, J. Comprehensive evaluation method of water resources carrying capacity in river basins. J. Hydraul. Eng. 2003, 34, 88–92. [Google Scholar]
- Wang, H.; Zhao, Y.; Zheng, Y. Evaluation of water resources carrying capacity of various regions in Yinchuan City by projection pursuit clustering model based on genetic algorithm. J. Ningxia Univ. (Nat. Sci. Ed.) 2009, 30, 408–410. [Google Scholar]
- Pan, X.; Xia, J.; Li, F.; Liu, H.; Ma, M.; Wang, C.; Li, R. Research on water resources carrying capacity in northern typical areas based on GIS—Taking Tongzhou District, Beijing as an example. J. Nat. Resour. 2007, 22, 664–671. [Google Scholar]
- Qu, Y.; Fan, S. Analysis and calculation of water resources carrying capacity in the Heihe River Basin and countermeasures. J. Desert Res. 2000, 20, 1–8. [Google Scholar]
- Xu, Z.; Cheng, G. Research on water resources carrying capacity in the middle reaches of the Heihe River Basin using multi-objective decision analysis technology. J. Lanzhou Univ. 2000, 36, 122–132. [Google Scholar]
- Zhu, Y.; Xia, J.; Tan, G. Research on the theory and method of water resources carrying capacity. Prog. Geogr. 2002, 21, 180–188. [Google Scholar]
- Jiang, X.; Huang, Q.; Hui, Y.; Xue, X. Research on water environment carrying capacity in Guanzhong area of Shaanxi Province. Acta Sci. Circumstantiae 2001, 21, 312–317. [Google Scholar]
- Wang, J.; Jiang, D.; Gu, D.; Qi, W.; Tang, Q. Prediction research on water resources carrying capacity of cities in arid areas based on SD model. Geogr. Territ. Res. 1999, 15, 19–23. [Google Scholar]
- Han, J.; Duan, W.; Li, B. Simulation and prediction of water resources carrying capacity of cities in arid areas based on SD model—Taking Baotou City as an example. J. Arid. Land Resour. Environ. 2005, 19, 188–191. [Google Scholar]
- Jia, R.; Jiang, X.; Xue, H.; Shen, B. Research on water resources carrying capacity model in water-deficient areas. J. Lanzhou Univ. 2000, 36, 114–121. [Google Scholar]
- Zhou, F.; Guo, H.; Liu, Y.; He, B. Evaluation method for sustainable development of water resources in lake basins in humid areas. J. Nat. Resour. 2007, 22, 290–301. [Google Scholar]
- Sun, C.; Li, N. Research on water resources carrying capacity under the development strategy of Liaoning coastal economic belt. J. Saf. Environ. 2010, 10, 127–131. [Google Scholar]
- Zhou, Y.; Su, X.; Zhou, Z. Evaluation of water resources load status based on the four-dimensional index system of “quantity-quality-domain-flow”—Taking the three cities in the Heihe River Basin as an example. Agric. Res. Arid. Areas 2019, 37, 215–223+231. [Google Scholar]
- Yu, H.; Li, L.; Li, J. Comprehensive evaluation of water resources carrying capacity of Beijing-Tianjin-Hebei region based on “quantity-quality-domain-flow”. Resour. Sci. 2020, 42, 358–371. [Google Scholar]
- Wang, H.; Wang, J.; Hu, P. The new connotation of water resources protection: Collaborative protection and restoration of “quantity-quality-domain-flow-ecology”. Water Resour. Prot. 2021, 37, 1–9. [Google Scholar]
- Sun, X.; Peng, A.; Hu, S.; Shi, Y.; Lu, L.; Bi, A. Dynamic Successive Assessment of Water Resource Carrying Capacity Based on System Dynamics Model and Variable Fuzzy Pattern Recognition Method. Water 2024, 16, 304. [Google Scholar] [CrossRef]
- Zhuang, D. Characteristics of wetland biological resources and ecosystem evaluation in Dongting Lake area. Trop. Geogr. 2000, 20, 261–264. [Google Scholar]
- Zhong, F.; Yan, H.; Li, L.; Jiang, R.; Yao, Y.; Deng, X. Structure and diversity of bird communities in Dongting Lake wetland. Chin. J. Ecol. 2007, 26, 1959–1968. [Google Scholar]
- Li, Y. Impact and Mechanism of Poplar Plantation on Understory Plant Diversity in Dongting Lake Wetland. Ph.D. Thesis, Hunan Agricultural University, Changsha, China, 2014. [Google Scholar]
- Deng, L.; Chen, D. Biodiversity protection and sustainable utilization of Dongting Lake wetland. For. Resour. Manag. 2002, 60–63. [Google Scholar] [CrossRef]
- Zhang, Y. Value Evaluation of Ecosystem Service Functions of Dongting Lake Wetland. Ph.D. Thesis, Central South University of Forestry and Technology, Changsha, China, 2007. [Google Scholar]
- Chen, K.; Li, J.; Li, Y.; Yu, C.; Liu, Y. Research on water resources carrying capacity of Shantou City based on RBF neural network model. Water Resour. Power 2012, 30, 31–33+28. [Google Scholar]
- Wang, J.; Hu, G.; Zhang, L. Evaluation and prediction of water resources carrying capacity in Beijing-Tianjin-Hebei region. China Rural. Water Hydropower 2022, 69–74. Available online: https://cqvip.com/doc/journal/941511661 (accessed on 1 November 2024).
- Xu, C.; Huang, J.; Man, Z. Research on water resources carrying capacity of Zhengzhou City based on SD-EF model. China Rural. Water Hydropower 2020, 9–14. Available online: https://cqvip.com/doc/journal/920785698 (accessed on 1 November 2024).
- Xue, Q.; Yang, K.; Cai, Y.; Yang, J. Research on prediction and regulation of water resources carrying capacity of Jiangsu Province based on BP neural network-system dynamics coupling model. Water Resour. Hydropower Eng. 2022, 53, 86–99, (In Chinese and English). [Google Scholar]
- Zuo, Q.; Zhang, Z.; Wu, B. Evaluation of water resources carrying capacity of nine provinces and regions in the Yellow River Basin based on combined weight TOPSIS model. Water Resour. Prot. 2020, 36, 1–7. [Google Scholar]
- Wang, J.; Geng, Y.; Zheng, X. Research on water resources carrying capacity evaluation based on PSR-MDS model—Taking Hebei Province as an example. Yangtze River 2021, 52, 81–86. [Google Scholar] [CrossRef]
- Jiao, L.; Wang, D. Research on water resources carrying capacity of Guilin City based on DPSIR model and water footprint theory. Sci. Soil Water Conserv. 2020, 18, 74–80. [Google Scholar]
- Yuan, R.; Wang, X. Comprehensive Evaluation and Analysis of Water Resources Carrying Capacity in Yangtze River Delta Based on Pythagoras-TOPSIS Method. Sci. Technol. Manag. Res. 2020, 40, 71–79. [Google Scholar]
- Guo, Q.; Wang, J.; Zhang, B. Comprehensive evaluation of regional water resources carrying capacity based on DPSIRM framework. J. Nat. Resour. 2017, 32, 484–493. [Google Scholar]
- Fan, Q. Evaluation of ecological environment in the Yangtze River Economic Belt under the gray correlation model. Stat. Decis. 2018, 34, 117–119. [Google Scholar]
- Zeng, Y. Evaluation Model and Interval Prediction of Water Resources Carrying Capacity in Yulin City. Ph.D. Thesis, Guangxi University, Nanning, China, 2022. [Google Scholar] [CrossRef]
- Sun, F. Analysis and Application of Water Resources Carrying Capacity. Ph.D. Thesis, Hohai University, Nanjing, China, 2006. [Google Scholar]
- Zhang, F.; Su, W.; Zhou, J. Urban ecological security evaluation based on entropy weight gray correlation analysis. Chin. J. Ecol. 2008, 27, 1249–1254. [Google Scholar]
- Wang, B.; Zhang, G.; Liu, G.; Yang, Q.; Yang, Y. Evaluation of ecological environment effects of comprehensive management of soil and water loss in hilly areas of the Loess Plateau. Trans. Chin. Soc. Agric. Eng. 2012, 28, 150–161. [Google Scholar]
- Hou, B.; Li, J.; Pan, N.; Liang, C. Application of improved entropy weight gray correlation model in comprehensive evaluation of wetland water quality. J. Saf. Environ. 2008, 8, 80–83. [Google Scholar]
- Chen, L.; Zhou, H. Evaluation of water resources carrying capacity of karst basins based on fuzzy comprehensive evaluation and principal component analysis. Saf. Environ. Eng. 2021, 28, 159–173. [Google Scholar]
- Tang, J.; Ding, W.; Li, W.; Liu, X. Evaluation and obstacle factors of water resources carrying capacity in the Yellow River Basin. Yellow River 2021, 43, 73–77. [Google Scholar]
- Tian, P.; Wang, J.; Hua, W.; Hao, F.; Huang, J.; Gong, Y. Spatio-temporal pattern and coupling coordination of water resources carrying capacity in urban agglomeration in the middle reaches of the Yangtze River. J. Lake Sci. 2021, 33, 1871–1884. [Google Scholar]
- Jin, J.; Shen, S.; Cui, Y.; Zhang, X.; He, P.; Ning, S. Application of semi-partial subtraction set pair potential in dynamic evaluation of water resources carrying capacity in Yellow River Irrigation District. J. Hydraul. Eng. 2021, 52, 507–520. [Google Scholar]
- Ding, C.; Hu, Y.; Wang, Z.; Zhao, N.; Dong, W.; Wang, L. Evaluation of water resources carrying capacity from the perspective of virtual water social cycle. J. Nat. Resour. 2021, 36, 356–371. [Google Scholar]
- Wang, J.; Yuan, X.; Chen, Y.; Fang, Y.; Zhai, T.; Song, Z. Evaluation method and practical application of resource and environmental carrying capacity for sustainable urban ecosystem management—Taking Yantai City as an example. J. Nat. Resour. 2020, 35, 2371–2384. [Google Scholar]
- Zhang, X.; Liu, X.; Zhang, G.; Wei, G.; Liu, F. Analysis of changes in water resources carrying capacity in Aksu River Basin, Xinjiang. Water Resour. Power 2020, 38, 44–47. [Google Scholar]
- Huang, C.; Geng, L.; Yan, B.; Bian, J.; Zhao, Y. Dynamic prediction and regulation of water resources carrying capacity—Taking the Yellow River Basin as an example. Adv. Water Sci. 2021, 32, 59–67. [Google Scholar]
- Li, S.; Zhao, H.; Wang, F.; Yang, D. Evaluation of water resources carrying capacity of Jiangsu Province based on AHP-TOPSIS model. Water Resour. Prot. 2021, 37, 20–25. [Google Scholar]
- Cui, D.; Chen, X.; Zeng, W. Long-term early warning research on water environment carrying capacity—Taking Kunming City as an example. China Environ. Sci. 2018, 38, 1174–1184. [Google Scholar]
- Lin, L.; Li, D.; Lin, Z. Evaluation of water resources carrying capacity in Kubuqi Desert area based on entropy weight-TOPSIS model. J. Cent. China Norm. Univ. (Nat. Sci.) 2020, 54, 640–648. [Google Scholar]
- Kang, J.; Wang, J.; Wang, S. Evaluation research on agricultural water resources carrying capacity in Haihe River Basin. Water Resour. Hydropower Eng. 2020, 51, 47–56. [Google Scholar]
- Hu, G.; Feng, H.; Ma, Y.; Zhou, X.; Feng, C.; Huang, L. Risk assessment and spatiotemporal distribution characteristics of nitrogen and phosphorus pollution in Dongting Lake Basin. Resour. Environ. Yangtze Basin 2023, 32, 162–171. [Google Scholar]
- Yang, H.; Sun, X.; Cheng, X.; Zhou, G.; Sun, G. Comprehensive evaluation of water resources carrying capacity of Weifang City based on VIKOR method. Acta Sci. Circumstantiae 2020, 40, 716–723. [Google Scholar]
- Li, Z.; Dong, Z.; Chen, M.; Lu, S. Evaluation of water resources carrying capacity of Hefei City based on fuzzy analysis method. Water Resour. Power 2020, 38, 43–46. [Google Scholar]
- Bian, J.; Song, X.; Geng, L.; Yan, B. Characteristic analysis and evaluation research of water resources carrying capacity in Taihu Lake Basin. Water Sav. Irrig. 2020, 73–78+83. Available online: https://cqvip.com/doc/journal/921528412 (accessed on 1 November 2024).
- Ye, F.; Jin, J.; Fang, G. Evaluation of water resources carrying capacity of Hefei City based on set pair analysis connection number. J. Water Resour. Water Eng. 2020, 31, 85–90. [Google Scholar]
- Liu, X.; Liu, L. Comprehensive evaluation research on water resources carrying capacity of Shaanxi Province based on principal component analysis. Math. Pract. Theory 2020, 50, 55–62. [Google Scholar]
- Sun, G.; Sun, X.; Huo, X.; Long, S. Evaluation of water resources carrying capacity based on three-way decision improved TOPSIS. Water Sav. Irrig. 2019, 77–81. Available online: https://cqvip.com/doc/journal/924476001 (accessed on 1 November 2024).
- Fei, X.; Li, J.; Li, L.; Wen, Q.; Zhang, L. Evaluation and driving force research of water resources carrying capacity in Dianchi Lake Basin. J. Irrig. Drain. 2019, 38, 109–116. [Google Scholar]
- Tian, P.; Zhang, Z.; Xu, X.; Yan, F.; Wu, Y.; Zhang, H.; Liu, M. Comprehensive evaluation of water resources carrying capacity of the Yangtze River Economic Belt based on variable weight TOPSIS model. J. Cent. China Norm. Univ. (Nat. Sci.) 2019, 53, 755–764. [Google Scholar]
- Zhang, Q.; Li, S.; Xia, H. Research on water resources carrying capacity of three northeastern provinces based on fuzzy comprehensive evaluation model. Bull. Soil Water Conserv. 2019, 39, 179–188+193. [Google Scholar]
- Liu, T.; Yang, X.; Zhao, K.; Xue, Q. Dynamic evaluation of water resources carrying capacity based on set pair analysis—Taking Sichuan Province as an example. Yangtze River 2019, 50, 94–100. [Google Scholar]
- Xu, Y.; Chen, J.; Xia, H.; Chu, L.; Zhang, X. Evaluation of water resources carrying capacity of Huai’an City based on DPSR-improved TOPSIS model. J. Water Resour. Water Eng. 2019, 30, 47–52+62. [Google Scholar]
- Fan, J.; Huang, J.; Yuan, M.; Zhang, X.; Tan, C. Evaluation of water resources carrying capacity of Pearl River Delta based on subsystem entropy weight model. J. Water Resour. Water Eng. 2019, 30, 100–105. [Google Scholar]
- Xia, H.; Chen, J.; Xu, Y.; Zhang, X.; Shi, Z. Research on water resources carrying capacity of Lianyungang City based on improved TOPSIS model. Water Sav. Irrig. 2019, 86–90+95. Available online: https://cqvip.com/doc/journal/915356069 (accessed on 1 November 2024).
- Huang, Z.; Guo, H. Comprehensive evaluation of resource and environmental carrying capacity of Zhengzhou City based on entropy weight TOPSIS model. Ecol. Econ. 2019, 35, 118–122+127. [Google Scholar]
- Xu, L.; Liu, Y.; He, Y.; Chen, Y.; Xu, F. Design and implementation of regional resource and environment carrying capacity evaluation information platform. Geomat. Spat. Inf. Technol. 2019, 42, 162–165+168. [Google Scholar]
- Yin, Y.; Cheng, S.; Ma, R.; Shen, Q.; Wang, Y.; Jiao, S.; Deng, S.; Tian, C. Discussion on the "double evaluation" model of county-level areas in hilly regions based on “locality” and “synergy”: Taking Chenxi County, Hunan Province as an example. Econ. Geogr. 2020, 40, 102–113. [Google Scholar]
- Shen, Y.; Gong, J.; Ye, J.; Wang, W.; Tao, R. Research on the delimitation of permanent basic farmland based on "double evaluation": Taking Huangshi City as an example. China Land Sci. 2021, 35, 27–36. [Google Scholar]
- Fu, X.; Yang, X.; Song, X. Evaluation of resource and environment carrying capacity of the Yangtze River Economic Belt based on DPSIR-TOPSIS model. J. Cent. South Univ. For. Technol. (Soc. Sci.) 2022, 16, 38–47. [Google Scholar]
- Liu, X.; Zhang, M.; Xu, J.; Guo, Y.; Duan, W.; Shen, Y. Research on water resources carrying capacity of Tarim River Basin based on system dynamics model. Arid. Land Geogr. 2021, 44, 1407–1416. [Google Scholar]


| Index | Amount | Remark |
|---|---|---|
| Long-term residents | 14,174,800 | Accounts for 21.3% of the province’s population |
| Population distribution | 7,776,900 (urban area) 6,397,900 (rural area) | Urbanization rate 54.9% |
| Population density | 306 person/km2 | Population density of the province: 315 person/km2 |
| GDP | 960.416 billion yuan | Per capita GDP is 67,755 yuan |
| Total output value of agriculture, forestry, animal husbandry, and fishing | 221.944 billion yuan | Accounts for 29.5% of the province |
| Grain output | 9,377,000 t | Accounts for 31% of the province |
| Category | Quantity | Dominant Species |
|---|---|---|
| Phytoplankton | 6 phyla, 42 genera | Green algae, diatoms |
| Aquatic vascular plants | 64 families, 280 species | Lotus, Carex |
| Meadow and marsh plants | 23 families, 172 species | Gramineae, Cyperaceae |
| Fishes | 11 orders, 23 families, 119 species | Cyprinidae, Cobitidae |
| Birds | 17 orders, 52 families, 279 species | Greater white-fronted goose, lesser white-fronted goose, ducks |
| Benthic animals | 75 species | Tanytarsus flavofasciatus |
| Amphibians and reptiles | 36 species | Bufo gargarizans, Trionyx sinensis |
| Mammals | 7 orders, 13 families, 30 species | Lepus sinensis, Oryctolagus cuniculus |
| Mollusks | 4 families, 47 species | Snails, mussels |
| Wetland Type | Area (10,000 Hectares) | Proportion (%) | |
|---|---|---|---|
| Lake wetland | Lake water body | 31.81 | 46.11 |
| Huzhou | 10.86 | 15.72 | |
| Low lake field | 16.99 | 24.63 | |
| Subtotal | 59.66 | 86.48 | |
| Riverine wetland | River water body | 6.3 | 9.13 |
| Benchland | 0.71 | 10.3 | |
| Low lake field | 2.32 | 3.36 | |
| Subtotal | 9.33 | 13.52 | |
| Total | 68.99 | 100 | |
| Name of Nature Reserve | Area (km2) | Establishment Year |
|---|---|---|
| East Dongting Lake in Yueyang City | 1900 | 1994 |
| South Dongting Lake in Yiyang City | 1680 | 1997 |
| Quyuan Wetland in Miluo City | 20 | 2000 |
| Jicheng Guanglu in Huarong County | 51 | 2001 |
| Hengling Lake in Xiangyin County | 430 | 2001–2020 |
| West Dongting Lake in Changde City | 357 | 2005 |
| Beimin Lake in Li County | 71 | 2005–2015 |
| Baota Lake in Yueyang County | 140 | 2008–2015 |
| Wanzi Lake in Yuanjiang City | 2170 | 2010 |
| Huanggai Lake in Linxiang City | 92 | 2010–2015 |
| Chongtian Lake in Changde City | 142 | 2013–2020 |
| Ye Lake in Linxiang City | 23 | 2015–2020 |
| River System | Main Flow Length (km) | Basin Span (km2) | Annual Flow (100 Million m3) |
|---|---|---|---|
| Xiang River | 875 | 98,623 | 682 |
| Zi River | 661 | 28,142 | 227 |
| Yuan River | 1133 | 89,163 | 653 |
| Li River | 288 | 18,496 | 149 |
| Start and End Years | Inflow of Water into the Lake (108 m3) | Outflow of Water from the Lake (108 m3) |
|---|---|---|
| 1956–1966 | 3080 | 3126 |
| 1967–1972 | 3006 | 2982 |
| 1973–1995 | 2667 | 2688 |
| 1996–2002 | 2810 | 2958 |
| 2003–2009 | 2067 | 2094 |
| 1956–2009 | 2765 | 2830 |
| Selected Indicators | Frequency | Proportion | Selected Indicators | Frequency | Proportion |
|---|---|---|---|---|---|
| Per capita water resources | 37 | 67.27% | Irrigation water consumption per mu | 11 | 20.00% |
| Per capita GDP | 34 | 61.82% | Reuse rate of industrial water | 10 | 18.18% |
| Water consumption per 10,000 yuan of GDP | 32 | 58.18% | Proportion of wastewater treatment in GDP | 11 | 20.00% |
| Habitat water consumption | 31 | 56.36% | Proportion of added value of tertiary industry | 9 | 16.36% |
| Population density | 26 | 47.27% | Domestic water consumption of urban residents | 9 | 16.36% |
| Utilization rate of water resources development | 26 | 47.27% | Water resources per unit area | 9 | 16.36% |
| Urbanization rate | 22 | 40.00% | Daily sewage treatment capacity | 9 | 16.36% |
| Forest coverage rate | 16 | 29.09% | Sewage treatment rate | 10 | 18.18% |
| Per capita daily domestic water consumption | 15 | 27.27% | Standard discharge rate of industrial wastewater | 7 | 12.73% |
| Annual precipitation | 20 | 36.36% | Surface water resources | 8 | 14.55% |
| Natural population growth rate | 15 | 27.27% | Groundwater resources | 9 | 16.36% |
| Compliance rate of water function zones | 13 | 23.64% | Land reclamation rate | 8 | 14.55% |
| Proportion of agricultural water use | 12 | 21.82% | Total population | 8 | 14.55% |
| Water yield coefficient | 15 | 27.27% | Annual growth rate of GDP | 7 | 12.73% |
| Water yield modulus | 12 | 21.82% | Green coverage rate of built-up areas | 7 | 12.73% |
| Effective irrigation rate of farmland | 13 | 23.64% | Afforestation area | 8 | 14.55% |
| Total urban sewage discharge | 11 | 20.00% | Grain yield per cubic meter of water | 8 | 14.55% |
| Proportion of domestic water use | 12 | 21.82% | Effective irrigated area per capita | 6 | 10.91% |
| Proportion of industrial wastewater discharge | 10 | 18.18% | Water-saving irrigation rate | 6 | 10.91% |
| Proportion of industrial water use | 9 | 16.36% | Sewage discharge per 10,000 yuan of GDP | 6 | 10.91% |
| Destination Layer | Criteria Layer | Index Level | Units | Indicator Direction |
|---|---|---|---|---|
| Water resources carrying capacity. | Water resources support capacity (A) | Annual precipitation (A1) | mm | + |
| Per capita water resources (A2) | m3 | + | ||
| Water yield coefficient (A3) | / | + | ||
| Reservoir capacity (A4) | 10,000 m3 | + | ||
| Dam length (A5) | km | + | ||
| Irrigation area (A6) | thousand hectare | + | ||
| Economic support capacity (B) | Per capita GDP (B1) | yuan | + | |
| GDP growth rate (B2) | B% | + | ||
| Industrial water consumption per 10,000 yuan (B3) | m3/10,000 yuan | − | ||
| Output of industrial water (B4) | yuan/m3 | + | ||
| Output of agricultural water (B5) | yuan/m3 | + | ||
| Total fishery products (B6) | t | + | ||
| Social support capacity (C) | Population density (C1) | person/km2 | − | |
| Natural growth rate (C2) | ‰ | + | ||
| Engel’s coefficient (C3) | / | − | ||
| Urbanization rate (C4) | C% | + | ||
| Domestic water (C5) | 10,000 m3 | − | ||
| Water ecological support capacity (D) | Forest coverage rate (D1) | % | + | |
| Wetland area (D2) | hectare | + | ||
| Investment in ecological environment (D3) | 10,000 yuan | + | ||
| Sewage treatment (D4) | % | + | ||
| Water for ecological environment (D5) | 10,000 m3 | − |
| Calculation Formula | Content | |
|---|---|---|
| 1 | Engel’s coefficient = Per capita food expenditure of urban residents/Per capita consumption expenditure × 100% | The proportion of total food expenditure in total personal consumption expenditure. |
| 2 | Output rate of agricultural water = Agricultural GDP/Agricultural water | Reflects the degree of development and utilization of water resources in agricultural production. |
| 3 | Output rate of industrial water = Industrial GDP/Industrial water | Reflects the degree of development and utilization of water resources in industrial production. |
| 4 | Per capita water resources = Total water resource/Total regional population | Per capita possession of water resources. |
| 5 | Water yield coefficient = Total water resources in a certain area/Total annual rainfall | Calculated from the water resources bulletins of each city. |
| 6 | Water for ecological environment = Urban environmental water + Partial water replenishment for rivers, lakes, and wetlands | Calculated from the water resources bulletins of each city. |
| Intensity of Importance | Definition | Explanation |
|---|---|---|
| 1 | Equal importance | Two activities contribute equally to the objective. |
| 3 | Weak importance | Experience and judgment slightly favor one activity over another. |
| 5 | Strong importance | Experience and judgment strongly favor one activity over another. |
| 7 | Very strong importance | One activity is favored very strongly over another. |
| 9 | Extreme importance | The evidence favoring one activity over another is of the highest possible order of affirmation. |
| 2, 4, 6, 8 | The median of the two adjacent judgments above | |
| reciprocal | If the judgment matrix of the comparison between factor i and factor j, then for the comparison between factor j and factor i, the judgment matrix aij = 1/aij. | |
| Carrying Capacity Level | Risk Warning Degree | Warning Interval | State | Early Warning Signal Identification |
|---|---|---|---|---|
| Low | Severe warning | (0, 0.2) | Dangerous | Red (R) |
| Relatively low | Heavy warning | (0.2, 0.4) | Unsafe | Orange (O) |
| Medium | Medium warning | (0.4, 0.6) | Relatively unsafe | Yellow (Y) |
| Relatively high | Light warning | (0.6, 0.8) | Relatively safe | Blue (B) |
| High | No warning | (0.8, 1] | Safe | Green (G) |
| 2000 | 2005 | 2010 | 2015 | 2020 | 2021 | Average | |
|---|---|---|---|---|---|---|---|
| A | 37.00 | 35.17 | 38.19 | 38.42 | 37.25 | 37.23 | 37.22 |
| B | 23.03 | 22.96 | 27.02 | 27.63 | 27.40 | 28.83 | 25.84 |
| C | 15.09 | 14.53 | 12.37 | 11.42 | 12.86 | 12.11 | 13.14 |
| D | 24.88 | 27.45 | 22.42 | 22.53 | 22.49 | 21.83 | 23.83 |
| Criteria Layer | Index Level | AHP Weight (%) | EWM Weight (%) | DWM Weight (%) |
|---|---|---|---|---|
| Water resources support capacity (A) | Annual precipitation (A1) | 13.16 | 3.27 | 8.22 |
| Per capita water resources (A2) | 12.3 | 4.72 | 8.51 | |
| Water yield coefficient (A3) | 6.41 | 3.49 | 4.95 | |
| Reservoir capacity (A4) | 2.27 | 16.66 | 9.47 | |
| Dam length (A5) | 2.27 | 5.58 | 3.93 | |
| Irrigation area (A6) | 6.45 | 3.49 | 4.97 | |
| Economic support capacity (B) | Per capita GDP (B1) | 5.14 | 6.48 | 5.81 |
| GDP growth rate (B2) | 4.28 | 2.55 | 3.42 | |
| Industrial water consumption per 10,000 yuan (B3) | 3.4 | 2.11 | 2.76 | |
| Output of industrial water (B4) | 2.4 | 2.2 | 2.3 | |
| Output of agricultural water (B5) | 2.14 | 5.92 | 4.03 | |
| Total fishery products (B6) | 2 | 6.58 | 4.29 | |
| Social support capacity (C) | Population density (C1) | 3.73 | 0.67 | 2.2 |
| Natural growth rate (C2) | 2.82 | 2.27 | 2.55 | |
| Engel’s coefficient (C3) | 2.82 | 3.13 | 2.98 | |
| Urbanization rate (C4) | 3.73 | 4.52 | 4.13 | |
| Domestic water (C5) | 1.62 | 2.54 | 2.08 | |
| Water ecological support capacity (D) | Forest coverage rate (D1) | 6.44 | 3.48 | 4.96 |
| Wetland area (D2) | 6.98 | 10.76 | 8.87 | |
| Investment in ecological environment (D3) | 3.22 | 4.33 | 3.78 | |
| Sewage treatment (D4) | 4.01 | 4.33 | 4.17 | |
| Water for ecological environment (D5) | 2.38 | 0.93 | 1.66 |
| Region | 1997–2000 | 2001–2005 | 2006–2010 | 2011–2015 | 2016–2020 | 2021 | Average | Ranking |
|---|---|---|---|---|---|---|---|---|
| Wangcheng District | 37.39 | 34.06 | 34.60 | 35.31 | 31.06 | 33.24 | 34.32 | 13 |
| Yueyanglou District | 27.36 | 26.84 | 25.51 | 28.09 | 33.48 | 35.08 | 28.56 | 25 |
| Yunxi District | 32.93 | 33.22 | 29.56 | 30.89 | 32.76 | 29.09 | 31.72 | 20 |
| Junshan District | 31.58 | 32.36 | 30.44 | 27.65 | 31.54 | 29.24 | 30.62 | 21 |
| Miluo City | 31.87 | 35.21 | 33.84 | 35.03 | 36.59 | 34.44 | 34.61 | 10 |
| Linxiang City | 29.79 | 34.68 | 33.13 | 31.57 | 33.19 | 32.19 | 32.57 | 18 |
| Yueyang County | 37.55 | 39.00 | 38.37 | 39.23 | 38.70 | 39.18 | 38.63 | 6 |
| Pingjiang County | 32.06 | 32.60 | 32.74 | 33.96 | 33.54 | 31.95 | 32.97 | 15 |
| Xiangyin County | 36.38 | 37.08 | 37.81 | 36.33 | 43.46 | 38.27 | 38.29 | 7 |
| Huarong County | 30.74 | 31.14 | 31.21 | 32.21 | 36.01 | 38.81 | 32.59 | 17 |
| Wuling District | 31.85 | 35.67 | 37.06 | 32.74 | 35.29 | 31.08 | 34.49 | 11 |
| Dingcheng District | 44.70 | 46.48 | 45.53 | 43.61 | 39.51 | 40.52 | 43.80 | 4 |
| Jinshi City | 26.05 | 27.10 | 29.06 | 24.33 | 22.81 | 26.05 | 25.87 | 26 |
| Anxiang County | 32.47 | 32.92 | 36.63 | 31.26 | 30.83 | 34.63 | 32.91 | 16 |
| Hanshou County | 36.60 | 36.00 | 38.08 | 39.57 | 39.94 | 40.40 | 38.19 | 8 |
| Li County | 37.80 | 36.72 | 38.20 | 33.65 | 33.11 | 35.81 | 35.81 | 9 |
| Linli County | 33.10 | 31.94 | 35.22 | 31.19 | 30.98 | 31.87 | 32.44 | 19 |
| Taoyuan County | 45.75 | 44.47 | 47.09 | 41.75 | 48.39 | 46.37 | 45.51 | 2 |
| Shimen County | 42.35 | 43.36 | 46.73 | 45.80 | 41.72 | 40.63 | 43.92 | 3 |
| Ziyang District | 30.15 | 30.16 | 30.60 | 28.75 | 28.15 | 29.26 | 29.53 | 22 |
| Heshan District | 28.43 | 26.75 | 27.07 | 30.85 | 30.48 | 30.74 | 28.81 | 23 |
| Yuanjiang City | 41.80 | 41.84 | 40.56 | 43.27 | 45.66 | 47.99 | 42.87 | 5 |
| Nan County | 32.53 | 30.83 | 31.36 | 36.83 | 36.66 | 43.88 | 34.10 | 14 |
| Datong Lake District | 27.26 | 27.15 | 27.16 | 29.95 | 30.24 | 35.68 | 28.69 | 24 |
| Taojiang County | 33.24 | 32.37 | 31.40 | 36.47 | 38.10 | 36.17 | 34.43 | 12 |
| Anhua County | 49.54 | 47.69 | 47.39 | 50.54 | 53.75 | 55.43 | 50.02 | 1 |
| Region | A1 | A2 | A3 | A4 | A5 | A6 | B1 | B2 | B3 | B4 | B5 | B6 | C1 | C2 | C3 | C4 | C5 | D1 | D2 | D3 | D4 | D5 |
|---|---|---|---|---|---|---|---|---|---|---|---|---|---|---|---|---|---|---|---|---|---|---|
| Yueyanglou District | 0 | 0 | 2 | 3 | 4 | 0 | 0 | 3 | 2 | 1 | 0 | 4 | 2 | 0 | 0 | 0 | 0 | 1 | 0 | 4 | 3 | 1 |
| Yunxi District | 0 | 2 | 2 | 2 | 3 | 2 | 0 | 5 | 2 | 1 | 1 | 0 | 3 | 2 | 1 | 0 | 1 | 2 | 0 | 0 | 3 | 1 |
| Junshan District | 1 | 2 | 1 | 1 | 2 | 1 | 1 | 1 | 2 | 1 | 1 | 2 | 4 | 2 | 0 | 0 | 2 | 1 | 2 | 0 | 3 | 1 |
| Linxiang City | 1 | 2 | 2 | 1 | 1 | 1 | 2 | 1 | 2 | 2 | 1 | 0 | 4 | 4 | 1 | 1 | 1 | 1 | 1 | 1 | 2 | 1 |
| Yueyang County | 1 | 2 | 2 | 1 | 1 | 1 | 2 | 1 | 2 | 2 | 1 | 1 | 1 | 3 | 1 | 2 | 1 | 2 | 9 | 1 | 0 | 1 |
| Pingjiang County | 0 | 2 | 2 | 1 | 1 | 0 | 2 | 0 | 3 | 2 | 1 | 1 | 6 | 4 | 2 | 1 | 0 | 4 | 0 | 1 | 1 | 1 |
| Huarong County | 4 | 2 | 1 | 1 | 1 | 1 | 3 | 1 | 2 | 1 | 1 | 1 | 0 | 1 | 1 | 0 | 3 | 1 | 2 | 1 | 1 | 1 |
| Wangcheng District | 1 | 2 | 2 | 2 | 1 | 1 | 2 | 3 | 1 | 0 | 1 | 3 | 5 | 1 | 3 | 0 | 1 | 2 | 0 | 1 | 4 | 0 |
| Miluo City | 1 | 2 | 2 | 1 | 1 | 1 | 2 | 1 | 2 | 1 | 2 | 1 | 8 | 2 | 1 | 1 | 1 | 3 | 1 | 1 | 0 | 1 |
| Xiangyin County | 4 | 2 | 2 | 1 | 1 | 1 | 2 | 1 | 3 | 1 | 2 | 1 | 4 | 1 | 1 | 0 | 3 | 3 | 4 | 1 | 0 | 1 |
| Wuling District | 0 | 1 | 1 | 1 | 4 | 1 | 0 | 6 | 0 | 0 | 2 | 1 | 5 | 0 | 5 | 0 | 1 | 0 | 0 | 4 | 3 | 2 |
| Dingcheng District | 2 | 2 | 0 | 1 | 1 | 2 | 5 | 1 | 3 | 2 | 2 | 0 | 8 | 3 | 3 | 1 | 3 | 2 | 2 | 1 | 3 | 2 |
| Hanshou County | 2 | 2 | 1 | 0 | 0 | 2 | 4 | 0 | 3 | 2 | 1 | 0 | 6 | 2 | 1 | 1 | 3 | 1 | 4 | 1 | 1 | 2 |
| Jinshi City | 0 | 2 | 0 | 1 | 2 | 2 | 0 | 1 | 2 | 1 | 1 | 0 | 4 | 2 | 1 | 0 | 0 | 1 | 0 | 0 | 1 | 2 |
| Anxiang County | 3 | 2 | 0 | 1 | 1 | 2 | 2 | 1 | 3 | 2 | 1 | 0 | 5 | 1 | 0 | 0 | 3 | 0 | 2 | 1 | 1 | 2 |
| Li County | 2 | 2 | 1 | 0 | 1 | 2 | 4 | 1 | 3 | 2 | 1 | 0 | 6 | 2 | 1 | 1 | 2 | 2 | 2 | 1 | 0 | 0 |
| Linli County | 0 | 2 | 1 | 1 | 1 | 2 | 2 | 1 | 3 | 2 | 1 | 0 | 5 | 3 | 2 | 1 | 0 | 3 | 0 | 1 | 1 | 1 |
| Taoyuan County | 1 | 2 | 1 | 1 | 0 | 2 | 5 | 1 | 3 | 2 | 1 | 1 | 6 | 6 | 3 | 3 | 1 | 4 | 0 | 1 | 0 | 1 |
| Shimen County | 0 | 2 | 1 | 1 | 0 | 2 | 2 | 1 | 3 | 3 | 0 | 1 | 7 | 9 | 5 | 2 | 1 | 5 | 0 | 1 | 0 | 1 |
| Ziyang District | 1 | 2 | 1 | 0 | 2 | 1 | 1 | 1 | 3 | 1 | 2 | 1 | 4 | 1 | 3 | 0 | 1 | 2 | 0 | 0 | 2 | 2 |
| Heshan District | 1 | 2 | 1 | 1 | 2 | 0 | 2 | 1 | 3 | 1 | 0 | 1 | 4 | 1 | 2 | 0 | 2 | 1 | 0 | 1 | 2 | 1 |
| Datong Lake District | 1 | 2 | 0 | 1 | 1 | 2 | 1 | 1 | 3 | 1 | 2 | 1 | 2 | 2 | 0 | 0 | 1 | 1 | 2 | 0 | 2 | 2 |
| Yuanjiang City | 4 | 2 | 1 | 1 | 1 | 1 | 3 | 1 | 3 | 1 | 2 | 1 | 3 | 2 | 0 | 0 | 3 | 1 | 9 | 1 | 1 | 1 |
| Nan County | 3 | 2 | 1 | 0 | 1 | 1 | 4 | 0 | 3 | 1 | 2 | 2 | 2 | 1 | 0 | 0 | 4 | 1 | 2 | 1 | 0 | 2 |
| Taojiang County | 0 | 2 | 2 | 1 | 0 | 1 | 2 | 0 | 3 | 1 | 2 | 1 | 6 | 3 | 4 | 1 | 0 | 4 | 0 | 1 | 1 | 2 |
| Anhua County | 0 | 2 | 2 | 0 | 0 | 1 | 1 | 0 | 3 | 1 | 2 | 1 | 8 | 8 | 4 | 9 | 2 | 5 | 1 | 1 | 0 | 2 |
| Advantage Index | Disadvantage Index | |||||||||||||||||||||
| Region | Advantage Index | Disadvantage Index |
|---|---|---|
| Yueyanglou District | B3, B5, C3, C4, D3 | A1, A2, A4, A5, A6, B2, B4, C1, C5, D1, D5 |
| Yunxi District | B3, C2, C3, C4 | A6, B2, B6, D3 |
| Junshan District | B5 | A3, A4, D1, D3 |
| Linxiang City | B3, C2 | B5 |
| Yueyang County | A4, C2, D2 | A1, D4 |
| Pingjiang County | A2, B3, C1, C2 | A5, B1, B6, C5, D2 |
| Huarong County | A5, B6 | A1, A2 |
| Wangcheng District | B1, B5, C3, D3, D4 | B2, B3, B4, D5 |
| Miluo City | A1, B4 | D4 |
| Xiangyin County | B4, B6, D2 | C5 |
| Wuling District | A3, B1, C4, D3, D4 | A2, A4, A6, B2, B3, C1, D1 |
| Dingcheng District | A1, A6, D4 | C2 |
| Hanshou County | A5, D2 | B5, C3, C4 |
| Jinshi City | C4, C5, D5 | A5, A6, C2, D3 |
| Anxiang County | B3, C5, D5 | A4, B5, C2, D1 |
| Li County | A6 | C3, D5 |
| Linli County | B2, C5 | A5, B5, D2 |
| Taoyuan County | A2, A4, A6, B2, C1, D1 | B4, C4 |
| Shimen County | A1, A2, A4, B3, C1, C3, C5, D6 | B4, B6, C4, D2 |
| Ziyang District | B3, C1 | |
| Heshan District | D3 | B4, C5, D5 |
| Datong Lake District | B4, D5 | A3, A4, C2, D3 |
| Yuanjiang City | A5, B5, D2 | A3 |
| Nan County | A5, A6, B2, B4, B5, B6 | A1, A2, A3, B1, C1, C3, D4 |
| Taojiang County | A3, D1, D5 | B1, B6 |
| Anhua County | A1, A2, A3, A4, C1, D1 | B1, B3, C3, C4 |
| Delay Order | MSE | RMSE | MAE | R2 |
|---|---|---|---|---|
| 1 | 0.81% | 9.03% | 8.52% | 0.936051433 |
| 2 | 0.56% | 7.51% | 7.16% | 0.945411948 |
| 3 | 0.35% | 5.91% | 5.50% | 0.973774306 |
| 4 | 0.27% | 5.22% | 3.64% | 0.975053576 |
| 5 | 0.30% | 5.50% | 5.01% | 0.902827385 |
| Yueyanglou District | Yunxi District | Junshan District | Miluo City | Linxiang City | Yueyang County | Pingjiang County | Xiangyin County | Huarong County | |
|---|---|---|---|---|---|---|---|---|---|
| 1997 | 0.2249 | 0.2821 | 0.2833 | 0.3136 | 0.2930 | 0.3813 | 0.3253 | 0.3687 | 0.3231 |
| 1998 | 0.3092 | 0.3656 | 0.3488 | 0.3272 | 0.3102 | 0.3731 | 0.3303 | 0.3634 | 0.3031 |
| 1999 | 0.2895 | 0.3505 | 0.3268 | 0.3104 | 0.2892 | 0.3675 | 0.3060 | 0.3626 | 0.2982 |
| 2000 | 0.2708 | 0.3191 | 0.3042 | 0.3237 | 0.2991 | 0.3801 | 0.3206 | 0.3603 | 0.3053 |
| 2001 | 0.3006 | 0.3731 | 0.3335 | 0.3634 | 0.3286 | 0.4091 | 0.3534 | 0.3865 | 0.3302 |
| 2002 | 0.2987 | 0.3630 | 0.3259 | 0.3654 | 0.3387 | 0.4012 | 0.3425 | 0.3982 | 0.3205 |
| 2003 | 0.2443 | 0.2998 | 0.3006 | 0.3235 | 0.3091 | 0.3875 | 0.3051 | 0.3535 | 0.2974 |
| 2004 | 0.2599 | 0.3236 | 0.3365 | 0.3644 | 0.3832 | 0.3738 | 0.3224 | 0.3532 | 0.3000 |
| 2005 | 0.2386 | 0.3015 | 0.3217 | 0.3437 | 0.3744 | 0.3782 | 0.3068 | 0.3625 | 0.3091 |
| 2006 | 0.2830 | 0.2944 | 0.2949 | 0.3162 | 0.3133 | 0.3584 | 0.2860 | 0.3515 | 0.2981 |
| 2007 | 0.2766 | 0.3008 | 0.3052 | 0.3197 | 0.3236 | 0.3809 | 0.3161 | 0.3809 | 0.3141 |
| 2008 | 0.2490 | 0.3078 | 0.3040 | 0.3291 | 0.3385 | 0.3894 | 0.3401 | 0.3846 | 0.3142 |
| 2009 | 0.2166 | 0.2784 | 0.2986 | 0.3423 | 0.3375 | 0.3861 | 0.3197 | 0.3754 | 0.2997 |
| 2010 | 0.2502 | 0.2967 | 0.3191 | 0.3846 | 0.3438 | 0.4037 | 0.3749 | 0.3981 | 0.3346 |
| 2011 | 0.3062 | 0.2828 | 0.3082 | 0.3915 | 0.3031 | 0.4211 | 0.3724 | 0.3489 | 0.3264 |
| 2012 | 0.2874 | 0.3116 | 0.2710 | 0.3466 | 0.3064 | 0.3964 | 0.3575 | 0.3929 | 0.3000 |
| 2013 | 0.2551 | 0.2833 | 0.2476 | 0.2714 | 0.2603 | 0.3618 | 0.3062 | 0.3278 | 0.3247 |
| 2014 | 0.2589 | 0.3107 | 0.2529 | 0.3456 | 0.3399 | 0.3563 | 0.3036 | 0.3513 | 0.3287 |
| 2015 | 0.2970 | 0.3561 | 0.3030 | 0.3964 | 0.3687 | 0.4257 | 0.3581 | 0.3958 | 0.3307 |
| 2016 | 0.3068 | 0.3350 | 0.3120 | 0.3867 | 0.3338 | 0.3753 | 0.3339 | 0.4493 | 0.3381 |
| 2017 | 0.3128 | 0.3440 | 0.3103 | 0.3947 | 0.3556 | 0.4090 | 0.3736 | 0.5093 | 0.3518 |
| 2018 | 0.3736 | 0.3884 | 0.3669 | 0.3614 | 0.3524 | 0.3650 | 0.3339 | 0.4314 | 0.3655 |
| 2019 | 0.3295 | 0.2802 | 0.2957 | 0.3431 | 0.2960 | 0.3941 | 0.3162 | 0.4005 | 0.3573 |
| 2020 | 0.3512 | 0.2905 | 0.2921 | 0.3436 | 0.3218 | 0.3916 | 0.3193 | 0.3823 | 0.3880 |
| 2021 | 0.3508 | 0.2909 | 0.2924 | 0.3444 | 0.3219 | 0.3918 | 0.3195 | 0.3827 | 0.3881 |
| 2022 | 0.3232 | 0.3027 | 0.2899 | 0.3644 | 0.3316 | 0.3920 | 0.3371 | 0.4135 | 0.3661 |
| 2023 | 0.3260 | 0.3015 | 0.2886 | 0.3658 | 0.3320 | 0.3924 | 0.3377 | 0.4159 | 0.3694 |
| 2024 | 0.3289 | 0.3002 | 0.2872 | 0.3672 | 0.3324 | 0.3928 | 0.3382 | 0.4184 | 0.3727 |
| 2025 | 0.3318 | 0.2989 | 0.2859 | 0.3685 | 0.3327 | 0.3933 | 0.3388 | 0.4208 | 0.3761 |
| Wuling District | Dingcheng District | Jinshi City | Anxiang County | Hanshou County | Li County | Linli County | Taoyuan County | Shimen County | |
| 1997 | 0.3097 | 0.4473 | 0.2636 | 0.3284 | 0.3648 | 0.3788 | 0.3308 | 0.4534 | 0.4103 |
| 1998 | 0.3158 | 0.4519 | 0.2678 | 0.3311 | 0.3661 | 0.3810 | 0.3356 | 0.4647 | 0.4242 |
| 1999 | 0.3262 | 0.4334 | 0.2502 | 0.3027 | 0.3516 | 0.3660 | 0.3161 | 0.4478 | 0.4225 |
| 2000 | 0.3223 | 0.4552 | 0.2603 | 0.3365 | 0.3813 | 0.3860 | 0.3416 | 0.4641 | 0.4370 |
| 2001 | 0.3664 | 0.5141 | 0.2776 | 0.3409 | 0.3782 | 0.3906 | 0.3345 | 0.4532 | 0.4490 |
| 2002 | 0.2894 | 0.4221 | 0.2595 | 0.3308 | 0.3735 | 0.3750 | 0.3294 | 0.4641 | 0.4496 |
| 2003 | 0.3803 | 0.4733 | 0.2428 | 0.3105 | 0.3471 | 0.3496 | 0.3098 | 0.4285 | 0.4187 |
| 2004 | 0.3749 | 0.4638 | 0.2810 | 0.3155 | 0.3404 | 0.3479 | 0.3010 | 0.4297 | 0.4171 |
| 2005 | 0.3727 | 0.4509 | 0.2942 | 0.3484 | 0.3607 | 0.3731 | 0.3223 | 0.4481 | 0.4336 |
| 2006 | 0.3870 | 0.4693 | 0.3404 | 0.3518 | 0.3603 | 0.3686 | 0.3387 | 0.4489 | 0.4507 |
| 2007 | 0.3576 | 0.4471 | 0.2933 | 0.3678 | 0.3877 | 0.3856 | 0.3518 | 0.4743 | 0.4767 |
| 2008 | 0.3814 | 0.4644 | 0.2844 | 0.3911 | 0.3915 | 0.3890 | 0.3692 | 0.4772 | 0.4756 |
| 2009 | 0.3710 | 0.4427 | 0.2654 | 0.3540 | 0.3779 | 0.3689 | 0.3319 | 0.4808 | 0.4471 |
| 2010 | 0.3562 | 0.4532 | 0.2697 | 0.3669 | 0.3864 | 0.3977 | 0.3695 | 0.4731 | 0.4863 |
| 2011 | 0.3296 | 0.4169 | 0.2377 | 0.3221 | 0.3363 | 0.3257 | 0.3050 | 0.4095 | 0.4227 |
| 2012 | 0.3259 | 0.4547 | 0.2562 | 0.3217 | 0.4133 | 0.3424 | 0.3253 | 0.4165 | 0.4758 |
| 2013 | 0.3480 | 0.4847 | 0.2540 | 0.3349 | 0.4323 | 0.3532 | 0.3277 | 0.4512 | 0.5029 |
| 2014 | 0.3202 | 0.4317 | 0.2333 | 0.2965 | 0.4174 | 0.3309 | 0.3039 | 0.4183 | 0.4749 |
| 2015 | 0.3133 | 0.3925 | 0.2355 | 0.2879 | 0.3792 | 0.3301 | 0.2976 | 0.3919 | 0.4138 |
| 2016 | 0.3729 | 0.4077 | 0.2189 | 0.2852 | 0.3726 | 0.3423 | 0.3041 | 0.4722 | 0.4613 |
| 2017 | 0.3549 | 0.3775 | 0.2234 | 0.2896 | 0.4148 | 0.3175 | 0.3211 | 0.4507 | 0.4101 |
| 2018 | 0.3662 | 0.3840 | 0.2170 | 0.2773 | 0.3873 | 0.2998 | 0.2993 | 0.5261 | 0.4312 |
| 2019 | 0.3602 | 0.4016 | 0.2210 | 0.3433 | 0.4188 | 0.3381 | 0.3065 | 0.5071 | 0.3767 |
| 2020 | 0.3104 | 0.4046 | 0.2603 | 0.3460 | 0.4037 | 0.3578 | 0.3182 | 0.4634 | 0.4068 |
| 2021 | 0.3108 | 0.4052 | 0.2605 | 0.3463 | 0.4040 | 0.3581 | 0.3187 | 0.4637 | 0.4063 |
| 2022 | 0.3432 | 0.3982 | 0.2343 | 0.3186 | 0.4111 | 0.3294 | 0.3113 | 0.4637 | 0.4317 |
| 2023 | 0.3429 | 0.3951 | 0.2325 | 0.3178 | 0.4134 | 0.3272 | 0.3103 | 0.4644 | 0.4310 |
| 2024 | 0.3427 | 0.3920 | 0.2306 | 0.3169 | 0.4157 | 0.3251 | 0.3093 | 0.4651 | 0.4303 |
| 2025 | 0.3424 | 0.3889 | 0.2287 | 0.3161 | 0.4180 | 0.3229 | 0.3083 | 0.4658 | 0.4296 |
| Ziyang District | Heshan District | Yuanjiang City | Nan County | Datong Lake District | Taojiang County | Anhua County | Wangcheng District | ||
| 1997 | 0.3336 | 0.3128 | 0.4474 | 0.3726 | 0.3142 | 0.3564 | 0.5238 | 0.4035 | |
| 1998 | 0.3163 | 0.3013 | 0.4261 | 0.3310 | 0.2707 | 0.3396 | 0.5100 | 0.3685 | |
| 1999 | 0.2741 | 0.2508 | 0.3880 | 0.2880 | 0.2452 | 0.3065 | 0.4586 | 0.3502 | |
| 2000 | 0.2821 | 0.2724 | 0.4103 | 0.3097 | 0.2603 | 0.3272 | 0.4892 | 0.3732 | |
| 2001 | 0.3195 | 0.2936 | 0.4283 | 0.3353 | 0.2839 | 0.3486 | 0.4983 | 0.3777 | |
| 2002 | 0.3033 | 0.2626 | 0.4152 | 0.3160 | 0.2689 | 0.3328 | 0.4976 | 0.3038 | |
| 2003 | 0.2629 | 0.2314 | 0.3831 | 0.2818 | 0.2338 | 0.2911 | 0.4362 | 0.2727 | |
| 2004 | 0.2701 | 0.2305 | 0.4166 | 0.2783 | 0.2465 | 0.3000 | 0.4531 | 0.3577 | |
| 2005 | 0.3522 | 0.3193 | 0.4486 | 0.3301 | 0.3242 | 0.3460 | 0.4991 | 0.3913 | |
| 2006 | 0.3430 | 0.3093 | 0.4430 | 0.3111 | 0.3152 | 0.3086 | 0.4495 | 0.3639 | |
| 2007 | 0.2898 | 0.2536 | 0.3947 | 0.3189 | 0.2680 | 0.3120 | 0.4663 | 0.3364 | |
| 2008 | 0.2928 | 0.2665 | 0.4002 | 0.3178 | 0.2581 | 0.3097 | 0.4883 | 0.3495 | |
| 2009 | 0.2925 | 0.2648 | 0.3870 | 0.3071 | 0.2488 | 0.3125 | 0.4810 | 0.3270 | |
| 2010 | 0.3118 | 0.2594 | 0.4031 | 0.3129 | 0.2680 | 0.3273 | 0.4844 | 0.3531 | |
| 2011 | 0.3155 | 0.3061 | 0.4338 | 0.3751 | 0.2995 | 0.3893 | 0.4765 | 0.3926 | |
| 2012 | 0.2999 | 0.3340 | 0.4600 | 0.3596 | 0.3130 | 0.3776 | 0.5308 | 0.3742 | |
| 2013 | 0.2546 | 0.2910 | 0.3598 | 0.3724 | 0.2800 | 0.3448 | 0.4847 | 0.3062 | |
| 2014 | 0.2926 | 0.3124 | 0.4601 | 0.3726 | 0.3045 | 0.3685 | 0.5198 | 0.3753 | |
| 2015 | 0.2751 | 0.2991 | 0.4496 | 0.3620 | 0.3005 | 0.3431 | 0.5150 | 0.3172 | |
| 2016 | 0.2900 | 0.3511 | 0.4572 | 0.3428 | 0.2862 | 0.4131 | 0.5206 | 0.3116 | |
| 2017 | 0.2825 | 0.3039 | 0.4615 | 0.3427 | 0.2880 | 0.3806 | 0.5044 | 0.3025 | |
| 2018 | 0.2846 | 0.3109 | 0.4278 | 0.3504 | 0.2862 | 0.4001 | 0.5331 | 0.2847 | |
| 2019 | 0.2587 | 0.2503 | 0.4565 | 0.3589 | 0.2948 | 0.3500 | 0.5750 | 0.3215 | |
| 2020 | 0.2915 | 0.3077 | 0.4798 | 0.4381 | 0.3567 | 0.3613 | 0.5542 | 0.3327 | |
| 2021 | 0.2926 | 0.3074 | 0.4799 | 0.4388 | 0.3568 | 0.3617 | 0.5543 | 0.3324 | |
| 2022 | 0.2821 | 0.3115 | 0.4611 | 0.4061 | 0.3217 | 0.3812 | 0.5430 | 0.3196 | |
| 2023 | 0.2812 | 0.3135 | 0.4638 | 0.4007 | 0.3246 | 0.3842 | 0.5466 | 0.3179 | |
| 2024 | 0.2802 | 0.3154 | 0.4665 | 0.4054 | 0.3275 | 0.3873 | 0.5502 | 0.3162 | |
| 2025 | 0.2793 | 0.3174 | 0.4692 | 0.4101 | 0.3305 | 0.3904 | 0.5539 | 0.3146 | |
| risk grade | Overloaded | Critical Carrying |
Disclaimer/Publisher’s Note: The statements, opinions and data contained in all publications are solely those of the individual author(s) and contributor(s) and not of MDPI and/or the editor(s). MDPI and/or the editor(s) disclaim responsibility for any injury to people or property resulting from any ideas, methods, instructions or products referred to in the content. |
© 2024 by the authors. Licensee MDPI, Basel, Switzerland. This article is an open access article distributed under the terms and conditions of the Creative Commons Attribution (CC BY) license (https://creativecommons.org/licenses/by/4.0/).
Share and Cite
Fu, Z.; Ding, X.; Guo, Y.; Chen, Y.; Li, M.; Hu, X.; Huang, J.; Zhao, X.; Fu, X.; Fang, Y. Evaluation and Prediction of Water Resources Carrying Capacity in Dongting Lake Area Based on County Unit and DWM-BP Neural Network Model. Water 2024, 16, 3480. https://doi.org/10.3390/w16233480
Fu Z, Ding X, Guo Y, Chen Y, Li M, Hu X, Huang J, Zhao X, Fu X, Fang Y. Evaluation and Prediction of Water Resources Carrying Capacity in Dongting Lake Area Based on County Unit and DWM-BP Neural Network Model. Water. 2024; 16(23):3480. https://doi.org/10.3390/w16233480
Chicago/Turabian StyleFu, Zeding, Xiang Ding, Yu Guo, Yonghua Chen, Meifang Li, Xinjiang Hu, Jing Huang, Xuhong Zhao, Xiaohua Fu, and Yingchun Fang. 2024. "Evaluation and Prediction of Water Resources Carrying Capacity in Dongting Lake Area Based on County Unit and DWM-BP Neural Network Model" Water 16, no. 23: 3480. https://doi.org/10.3390/w16233480
APA StyleFu, Z., Ding, X., Guo, Y., Chen, Y., Li, M., Hu, X., Huang, J., Zhao, X., Fu, X., & Fang, Y. (2024). Evaluation and Prediction of Water Resources Carrying Capacity in Dongting Lake Area Based on County Unit and DWM-BP Neural Network Model. Water, 16(23), 3480. https://doi.org/10.3390/w16233480