Article

Spatial-Temporal Characteristics and Driving Factors of Surface Water Quality in the Jing River Basin of the Loess Plateau

1
Institute of Hydroelectric Engineering, Xi’an University of Technology, Xi’an 710048, China
2
College of Geology and Environment, Xi’an University of Science and Technology, Xi’an 710054, China
3
Shaanxi Dongzhuang Water Control Project Construction Co., Ltd., Xi’an 710048, China
*
Author to whom correspondence should be addressed.
Water 2024, 16(22), 3326; https://doi.org/10.3390/w16223326
Submission received: 28 September 2024 / Revised: 9 November 2024 / Accepted: 14 November 2024 / Published: 19 November 2024

Abstract

:
Water quality safety in the water source constitutes a crucial guarantee for public health and the ecological environment. This study undertakes a comprehensive assessment of the water quality conditions within the Jing River Basin of the Loess Plateau, emphasizing the spatial and temporal characteristics, as well as the determinants influencing surface water quality in the Shaanxi section. We utilized data from seven monitoring stations collected between 2016 and 2022, employing an enhanced comprehensive Water Quality Index (WQI) method, redundancy analysis (RDA), and Spearman’s correlation analysis. The results show that the average annual WQI value of the water quality of the Shaanxi section of the Jing River increased from 68.01 in 2016 to 76.18 in 2022, and the river’s water quality has gradually improved, with a significant improvement beginning in 2018, and a series of water quality management policies implemented by Shaanxi Province is the primary reason for the improvement. The river’s water quality has deteriorated slightly in recent years, necessitating stricter supervision of the coal mining industry in the upper section. The river has an average WQI value of 73.70 and is rated as ‘good’. The main pollution indicators influencing the river’s water quality are CODMn, COD, BOD5, NH3-N, and TP. From the upstream to the downstream, the water quality of the river shows a pattern of increasing and then decreasing, among which S4 (Linjing Bridge in Taiping Town) and S5 (Jinghe Bridge) have the best water quality. The downstream part (S6, S7) of the Jing River near the Weihe River has poor water quality, which is mostly caused by nonpoint source contamination from livestock and poultry rearing, agricultural activities, and sewage discharge. Redundancy analysis revealed that the spatial scale of the 2500 m buffer zone best explained water quality changes, and the amount of bare land and arable land in land use categories was the key influencing factor of river water quality.

1. Introduction

During the Thirteenth Five-Year Plan period, China significantly enhanced its capacity for water environment management, leading to a steady improvement in management quality and a notable enhancement in the water quality of the main streams of key river basins. However, as the demand for water resources continues to rise, the water environments of these river basins are increasingly affected by human socioeconomic activities. A systematic assessment of river water quality is essential for understanding the spatial and temporal distribution of water pollution within watersheds, which is a fundamental requirement for effective watershed water environment management [1]. Risks to water bodies can be more accurately quantified using appropriate indicators and methodologies [2]. China’s water quality evaluation methods are relatively mature, with commonly applied techniques including single-factor evaluation methods [3], artificial neural network evaluation methods [4], water quality identification index methods [5], and the comprehensive Water Quality Index (WQI) method [6]. Among these, the WQI method effectively integrates multiple physical and chemical parameters into a single value that reflects water quality levels, thereby providing a holistic overview of water quality. The WQI has been widely used in the global water environment field, resulting in a variety of local branches and adaptive models. For example, the Canadian Council of Ministers of the Environment’s Water Quality Index (CCME-WQI), the National Sanitation Foundation’s Water Quality Index (NSFWQI), British Columbia’s Water Quality Index (BCWQI), and Oregon’s Water Quality Index (OWQI), among others [7,8,9,10].
Research on WQI has focused on the following directions. One prominent direction of focus is the development and refinement of models aimed at enhancing the accuracy and applicability of water quality assessments. For instance, Md Galal Uddin introduced an improved WQI model designed to render the methodology more objective and data-driven [11]. In another direction, the assessment of specific environmental impacts leverages WQI models for evaluating the quality of water bodies. Banda et al. proposed a three-layer neural network model to monitor long-term spatial and temporal variations in water quality within a South African river system [12]. Similarly, Mishra et al. employed artificial neural networks alongside WQI models to analyze the effects of urbanization on the water quality of urban lakes [13]. Currently, a burgeoning direction of research is uncertainty analysis, where scholars engage in both theoretical and experimental approaches to assess and predict uncertainties associated with WQI models [14]. It can be seen that the WQI method is highly representative and applicable.
As the primary tributary of the Wei River, the Jing River is of significant importance in the Guanzhong region of Shaanxi. Currently, the management of water resources in the Jing River faces numerous challenges. The uneven spatial and temporal distribution of precipitation, coupled with reduced runoff, has led to low natural utilization of water resources [15]. Furthermore, soil erosion and ecological degradation due to anthropogenic activities have exacerbated water shortages in the Jing River Basin. In 2018, the Dongzhuang Water Conservancy Hub Project was established along the main stream of the Jing River. The Dongzhuang Reservoir serves as a critical water source in Guanzhong, and its water quality directly affects the water safety of the downstream Jinghui Canal Irrigation District, Xixian New District, and Tongchuan New District. Therefore, studying the changes in water quality of the Jing River is essential for effective water resource management in the basin and to ensure safe water use downstream. Currently, research on the water quality of the Jing River predominantly focuses on environmental simulation and prediction. For instance, Wang Jucui et al. used a BP artificial neural network model to simulate nitrogen nutrient concentration changes in the Shaanxi section of the Jing River, validating the model’s applicability through measured data [16]. He Cuiling et al. developed a hydrodynamic water quality model for the Dongzhuang Reservoir based on MIKE11, analyzing the diffusion of CODMn under various sudden pollution scenarios [17]. In contrast, studies evaluating the water quality of the Jing River are relatively scarce, and existing methodologies require immediate optimization. For example, Yu Fang assessed the water quality of the Shaanxi section using single-factor evaluation and fuzzy comprehensive evaluation methods, while Xu Yajing et al. utilized comprehensive evaluation methods to analyze the water quality status in the Xianyang section [18,19]. Additionally, research on Jing River water quality is constrained by insufficient data. Wang Jucui et al. [20] examined the spatial and temporal distribution of water quality and pollutant sources in the Jing River using principal component and factor analysis; however, the limited number of monitored sections hinders an accurate spatial depiction of water quality. Therefore, attention should be paid to constructing a more comprehensive water quality evaluation system and strengthening data collection and analysis in order to fill the research gaps in the water quality of the Jing River.
As industrial point source pollution control in China continues to improve, attention has increasingly shifted toward addressing nonpoint source pollution, which has emerged as a major concern in water environment management [21]. Land use patterns play a pivotal role in shaping nonpoint source pollution dynamics and significantly influence river water quality [22]. Changes in land use can alter critical ecosystem processes, including the hydrological cycle and soil erosion, thereby affecting the transport of pollutants into water bodies [23]. Given the multi-scale characteristics of spatial data and inherent geographical differences, land use has become a key determinant in assessing river water quality [24]. Current research indicates that the relationship between land use and water quality varies across different spatial scales, resulting in ongoing uncertainty regarding the impacts of specific land use practices on water quality [25,26]. Furthermore, there is a notable lack of systematic studies examining the mechanisms and specific effects of land use dynamics in particular regions, such as the Jing River Basin. The Jing River Basin, situated in the heart of the Loess Plateau, faces significant challenges related to soil erosion. By integrating multi-scale spatial data, we can gain a deeper understanding of how land use influences water quality in this unique environment. Huang et al. identified land use as the primary source of pollution in the Jing River Basin, contributing as much as 66.79% to water quality degradation, thereby highlighting the urgent need for intervention [27]. Additionally, Wang et al. noted that various land use types within the watershed significantly impact the intensity of nonpoint source pollution, with cropland having the most substantial effect [28].
This study focuses on the Jing River section in Shaanxi Province and uses the Water Quality Index (WQI) comprehensive evaluation approach, which is based on seven water quality metrics collected from seven monitoring stations between 2016 and 2022. This study provides a complete assessment of the Jing River’s water quality status by integrating the WQI method, Mann–Kendall (M–K) trend test, and geographic information system (GIS), as well as detailing its regional and temporal dispersion. Given that previous research has shown that land use has a significant influence on water quality in the region, this project investigates the relationship between different land use types and water quality indicators at multiple spatial scales, filling a gap in the existing literature on the use of multi-scale modelling in the region. Furthermore, this study makes use of GIS’s spatial analysis capabilities to conduct a more in-depth examination of the unique mechanism of land use and its spatial layout on water quality. These findings aim to provide a scientific foundation for improving water quality, enhancing water environment management, and optimizing land use planning within the Shaanxi section of the Jing River Basin.

2. Materials and Methods
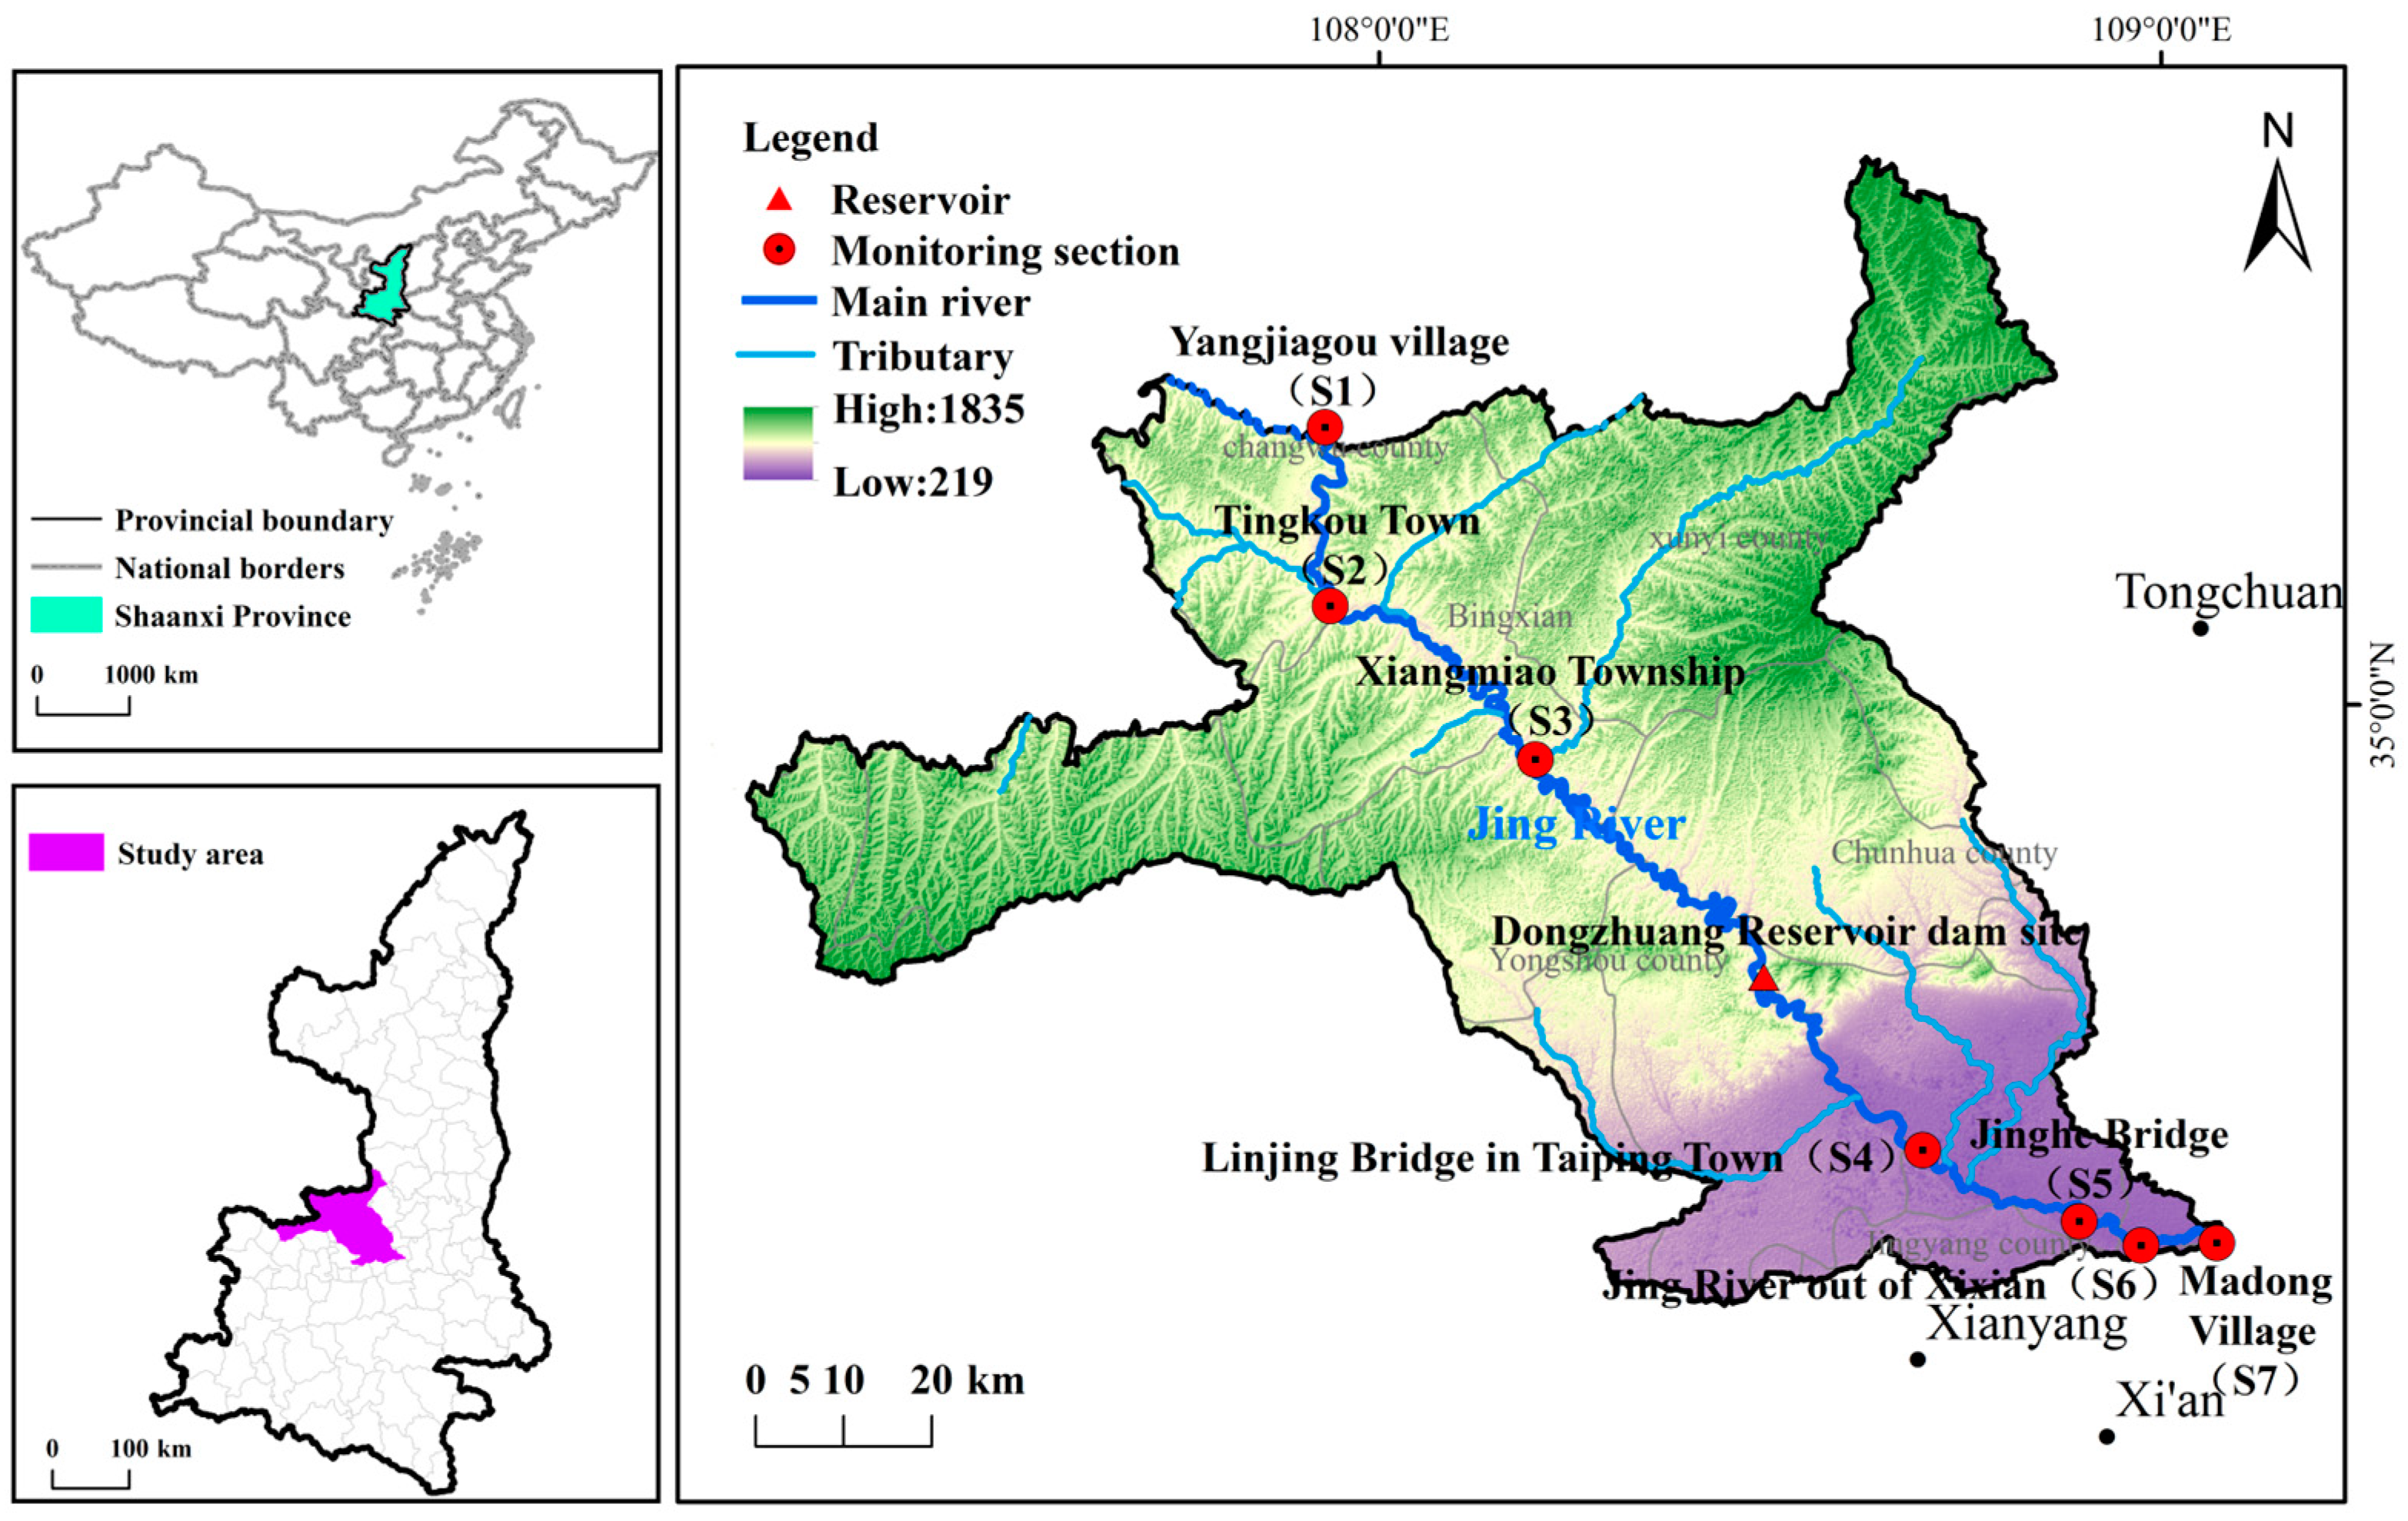
2.1. Study Area

The Jing River, originating from Old Longtan in Jingyuan County, Ningxia Hui Autonomous Region, flows in a northwest-to-southeast direction through the Ningxia, Gansu, and Shaanxi Provinces, spanning a total length of 455.1 km and encompassing a watershed area of 45,421 square kilometers [29]. In Shaanxi, the river extends for 266.5 km and drains a watershed of 9210 square kilometers, affecting several administrative divisions, including Baoji City, Xianyang City, Xi’an City, and Yulin City, which collectively comprise four cities, thirteen counties, and one district (See Figure 1). The Shaanxi section of the Jing River Basin traverses Changwu and Bin Counties and is situated within the coal-rich northern Weiwei black belt. The lower reaches include Liquan County and Jingyang County in Xianyang City, as well as Gaoling District in Xi’an City. This lower section features flat terrain and fertile land, coupled with a mild climate that provides optimal conditions for agriculture, making it a vital production area for commercial grains and cotton in Shaanxi Province. Additionally, the basin hosts 14 centralized drinking water sources, three nature reserves, and two significant wetlands, underscoring its ecological importance. Characterized by a continental monsoon climate, the basin receives annual rainfall ranging from 260 to 1076 mm, with a multi-year average of 499.1 mm. Rainfall patterns exhibit a gradual increase from north to south, and the flood season predominantly occurs from June to September.
The Jing River Dongzhuang Water Conservancy Hub Project is strategically situated 29 km upstream from the Zhangjiashan Hydrological Station, which marks the exit of the final canyon section of the Jing River. This project is one of 172 major water conservancy initiatives identified by the State Council, prioritized among 11 projects for commencement in 2016, and classified as a large-scale Type II water conservancy hub. The Dongzhuang Reservoir serves as a vital water source for urban and industrial needs in the Jinghui Canal Irrigation District, Tongchuan New District, Fuping County, and Xixian New District. Additionally, it plays a significant role in the flood control and sediment management system of the Weihe River and functions as a crucial tributary reservoir within the Yellow River’s water and sediment control framework, underscoring its strategic importance in the comprehensive management of both rivers.

2.2. Data and Processing

This study utilizes month-by-month monitoring data from seven water quality monitoring sections spanning from 2016 to 2022. The monitoring sections comprise two state-controlled locations in the mainstream of the Jing River (Jinghe Bridge S5 and Xiangmiao Township S3), three provincially controlled sections (Linjing Bridge S4 in Taiping Township, Jing River out of Xixian S6, and Madong Village S7), and two municipally controlled sections (Yangjiagou Village S1 and Tingkou Town S2).
This study evaluates water quality in the Jing River using key indicators, including the permanganate index (CODMn), dissolved oxygen (DO), chemical oxygen demand (COD), five-day biochemical oxygen demand (BOD5), ammonia nitrogen (NH3-N), total phosphorus (TP), and petroleum.
According to the “Surface Water Quality Monitoring Data Statistical Technical Provisions (for Trial Implementation)”, values below the detection limit are represented as half of the detection limit. The analysis incorporates monthly water quality data for these seven indicators collected over seven years, resulting in a total of 442 valid monthly observations. Additionally, 10-m resolution land use data from 2020, utilized for analyzing water quality drivers, was sourced from the National Glacial Tundra and Desert Science Data Center (http://www.ncdc.ac.cn, accessed on 20 November 2023).
Water quality standard limits and surface water quality monitoring methods are described in the Supplementary Materials.

2.3. Analysis Method

(1)
Water Quality Assessment Methods
This study employs an improved Water Quality Index (WQI) calculation method [30,31,32]. The specific formula is as follows:
W Q I = i = 1 n C i P i i = 1 n P i
In the formula, n represents the total number of water quality parameters; C i is the normalized value of the variable, classified into 11 levels from 0 to 100 based on the “Surface Water Environmental Quality Standards”, assigning values according to the concentration of the water quality parameters; P i denotes the relative weight of the variable, with a minimum value of 1 and a maximum of 4 [33,34]. The WQI value is calculated by weighing the scores of each indicator and is divided into five levels ranging from 0 to 100: poor (0 ≤ WQI ≤ 25), fair (25 < WQI ≤ 50), moderate (50 < WQI ≤ 70), good (70 < WQI ≤ 90), and excellent (WQI > 90). In this study, the WQI value is calculated using seven assessment indicators: CODMn, DO, COD, BOD5, NH3-N, TP, and oil-related substances. The weight values and normalized values of each water quality indicator can be found in the literature [2].
(2)
Mann–Kendall Trend Test
The M–K trend test is a non-parametric method suitable for use even in cases with missing data or anomalies. Additionally, the length of the sequence does not impact its applicability. This test is widely used in the analysis of hydrometeorological time series data, including assessments of water quality and runoff [3,35]. In this study, the M–K trend test was performed using MATLAB R2021b software to analyze the changing trends of various water quality factors.
(3)
Correlation Analysis
The association between land use types and water quality indicators was examined using Detrended Correspondence Analysis (DCA) and Redundancy Analysis (RDA). The findings were presented in a two-dimensional ordination map. The correlation between the Water Quality Index (WQI) values and water quality indicators was analyzed using Spearman’s method.

3. Results and Discussion

3.1. Analysis of Water Quality Variation

3.1.1. Temporal and Spatial Variation Characteristics of Water Quality

This study investigates water quality trends within the Shaanxi section of the Jing River by applying the Mann–Kendall (M–K) trend test to annual average values of six water quality indicators, excluding petroleum, which is solely used for calculating the Water Quality Index (WQI). Figure 2 illustrates the inter-annual variations in water quality from 2016 to 2022, as guided by the Environmental Quality Standards for Surface Water.
The analysis reveals a significant downward trend in all water quality indicators except dissolved oxygen (DO). This consistent improvement in water quality reflects effective management practices implemented during the study period. The CODMn indicator maintained Class II water but approached Class III levels in 2017, suggesting initial challenges in water quality management that year. Notably, DO consistently met Class I water, which is essential for supporting aquatic ecosystems. Indicators such as biochemical oxygen demand (BOD5) and total phosphorus (TP) transitioned from Class III to Class II beginning in 2018.
A spatial analysis across seven monitoring sections (see Figure 3) uncovers distinct trends, the red dotted line represents the trend change in water quality concentrations. BOD5 concentrations decreased from upstream to downstream, indicating effective natural remediation processes at work. Conversely, DO levels exhibited an initial increase followed by a decline, suggesting potential new pollution inputs in downstream areas that warrant investigation.
At the S1 cross-section (Yangjiagou Village), the average concentrations of COD, BOD5, and ammonia nitrogen (NH3-N) failed to meet Class III standards. This section is positioned downstream from the Gansu Changqingqiao Industrial Park, indicating a direct impact from industrial effluents. The high levels of these indicators highlight significant pollution stemming from mining activities and urban runoff, necessitating stricter regulatory measures on industrial emissions.
Moving downstream to the S7 cross-section (Madongcun), although it meets Class III standards, there is an observed increase in concentrations of CODMn, COD, NH3-N, and total phosphorus (TP) compared to S6. This indicates a concerning trend of declining water quality as the river approaches the Weihe River, highlighting the necessity for enhanced pollution control strategies in the Shaanxi section prior to the confluence. Furthermore, the significant increases in NH3-N and TP concentrations at the S6 section, relative to the smaller increases at the S7 section, suggest that S6 is a primary contributor to the elevated nutrient levels detected downstream. This finding emphasizes the critical need for targeted management strategies in the S5–S6 reaches. If left unaddressed, uncontrolled nutrient loading could lead to eutrophication, posing substantial risks to aquatic ecosystems and jeopardizing the safety of drinking water supplies.
Generally speaking, the S1 and S7 cross sections are situated in unique locations: S1 is the Jing River’s entry section into Shaanxi Province, and the water quality of that section directly impacts the Jing River’s water quality within Shaanxi, while S7 is the Jing River’s entry section into the Wei River; the two ends are extremely important for managing and protecting water quality. To address potential water environment issues, focused optimization methods must be implemented. For the S1 cross-section, the first step is to strengthen industrial wastewater treatment by establishing and improving centralized sewage treatment facilities in industrial parks; the second is to adjust the industrial structure by reducing the proportion of high-polluting industries and developing low-polluting, high value-added industries. For the S2 cross-section, the first step is to implement a combined point source and nonpoint source pollution control integrated program to lower the load of nutritional salts such as N and P. The second step is to strengthen sewage treatment. The ‘Upper Middle Yellow River Basin Water Pollution Prevention and Control Twelfth Five-Year Plan Outline’ identifies ammonia and nitrogen pollution control as the core, and the goal is to complete the transformation of the enterprise upgrading to improve the efficiency of ammonia and nitrogen removal in urban wastewater treatment plants. The nutrient salt concentration in the S6 section increased greatly, and the development of eutrophication preventive and control strategies can be learned from the Taihu Lake eutrophication management project application of pollutant reduction core technology [36].

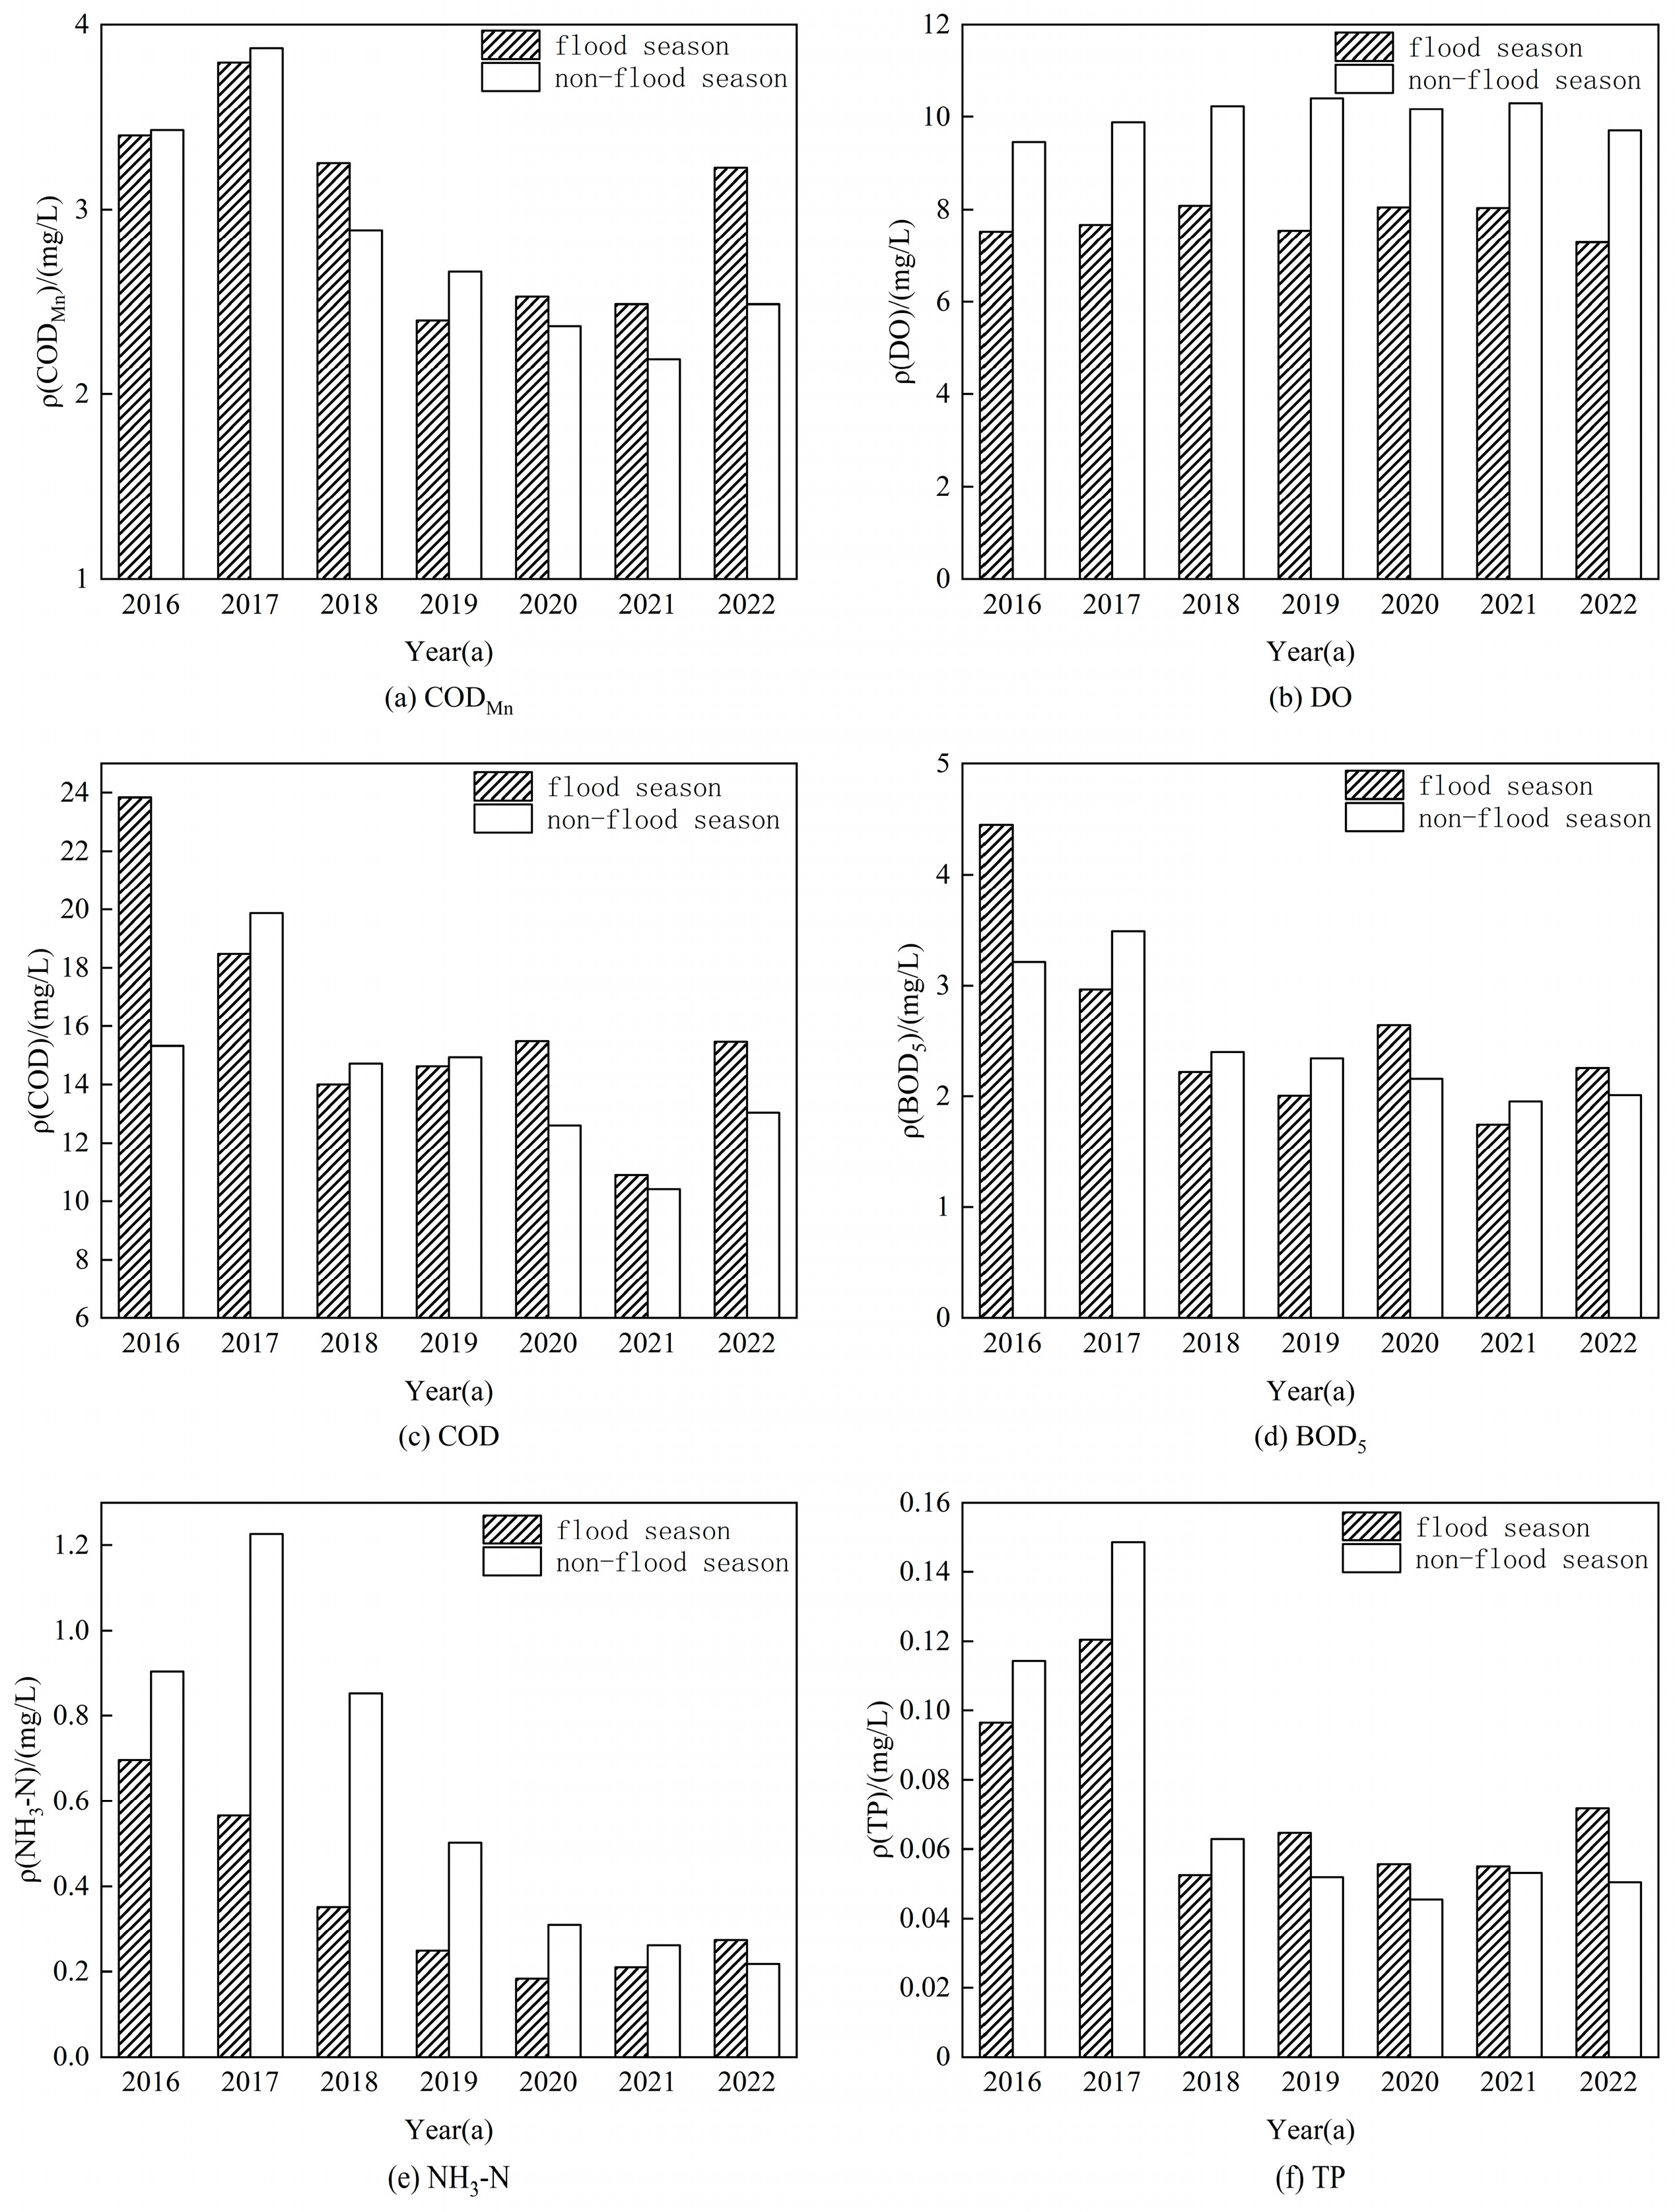
3.1.2. Variation Characteristics of Water Quality in Flood Season and Non-Flood Season

As illustrated in Figure 4, CODMn and COD concentrations are significantly higher during the flood season compared to the non-flood season. This increase is primarily due to elevated rainfall, which enhances surface runoff and the transport of pollutants into the river system, underscoring the cumulative impact of agricultural and urban sources. In contrast, dissolved oxygen (DO) levels are greater in the non-flood season. Higher temperatures during the flood season promote increased microbial metabolism, leading to enhanced oxygen consumption and lower DO levels [37]. This underscores the critical role of temperature in regulating aquatic oxygen dynamics, which is vital for ecosystem health.
The BOD5 levels exhibited no consistent pattern between flood and non-flood periods, primarily due to significant influences from urban settlements and industrial pollution sources along the Jing River. These fluctuations correlate closely with the loads of industrial and domestic sewage in the area [6]. The flood season, characterized by peak fertilizer application, facilitates the rapid influx of nitrogen and phosphorus into the river via surface runoff, which typically elevates ammonia-nitrogen levels [28]. However, this study observed that NH3-N concentrations were notably lower during the flood season compared to the non-flood season. This discrepancy can likely be attributed to dilution effects during flooding. Since 2019, total phosphorus (TP) concentrations in the flood season have typically exceeded those in the non-flood season, suggesting ongoing nutrient loading issues that warrant further investigation into agricultural runoff and its effects on water quality.
In summary, seasonal variability in water quality indicators is closely linked to climatic factors and human activities. Continuous monitoring and targeted management strategies are essential for addressing these fluctuations and promoting the sustainable development of the watershed ecosystem.

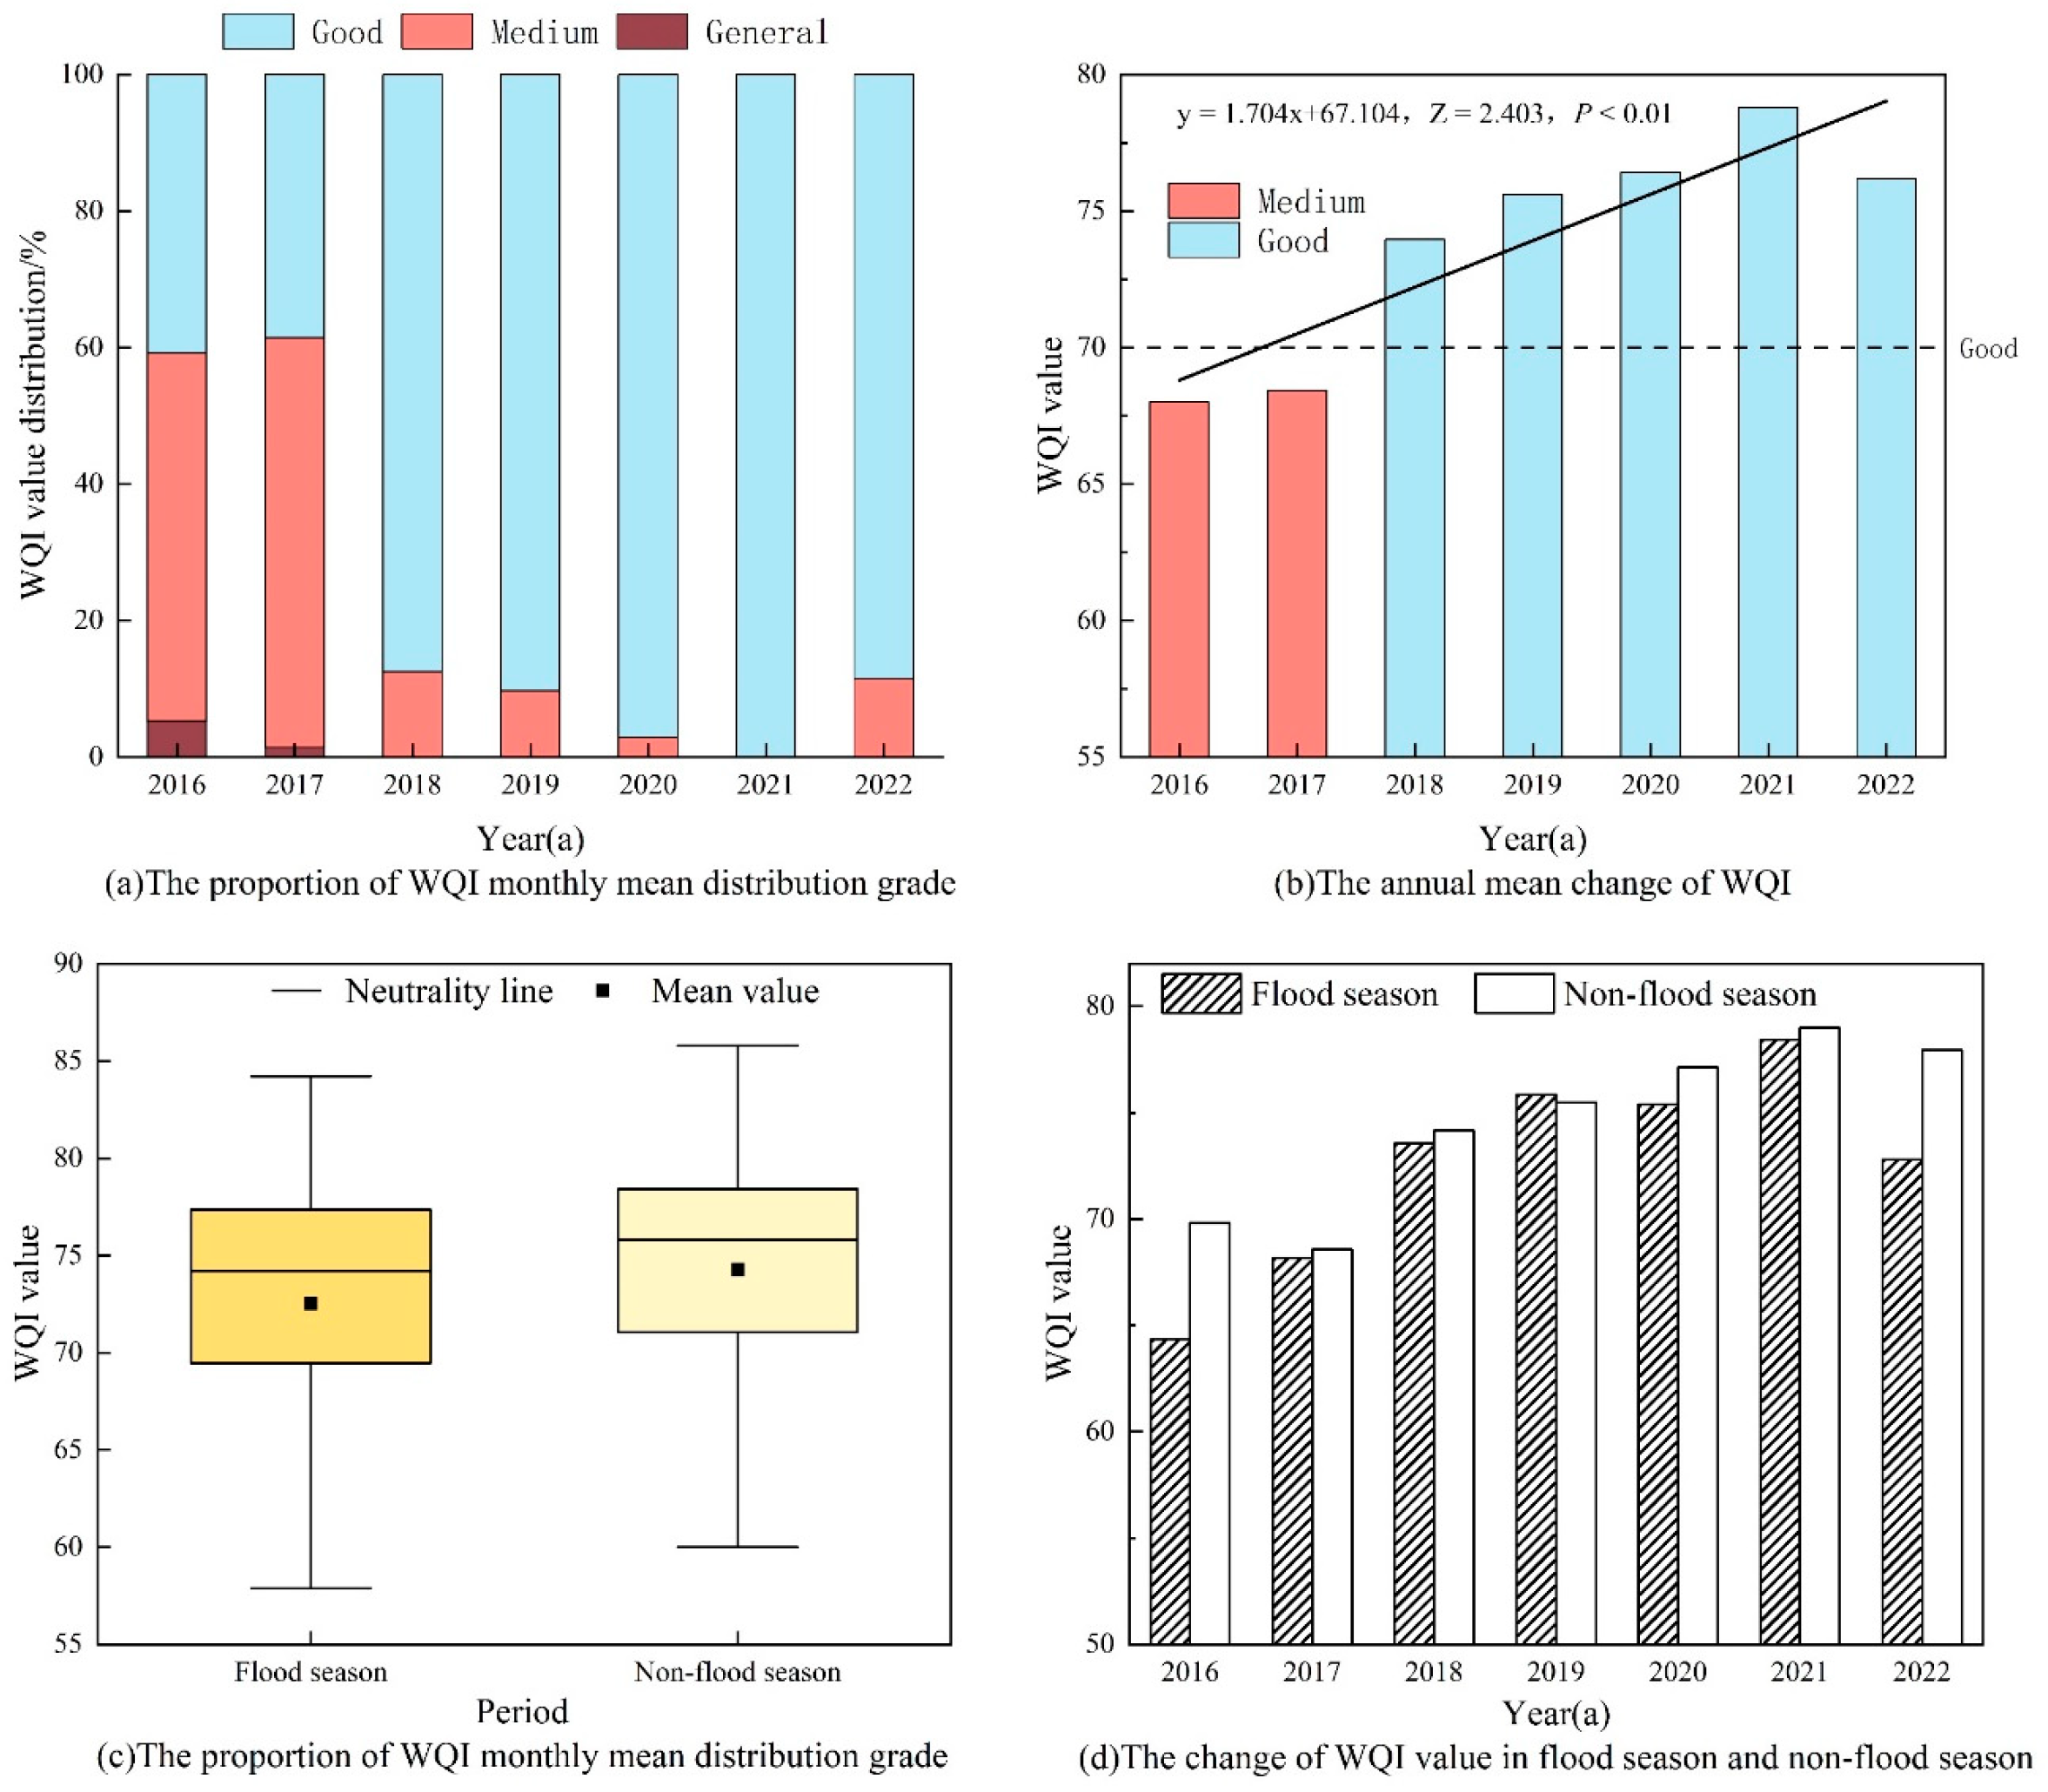
3.2. Water Quality Evaluation Based on WQI

3.2.1. Overall Water Quality

Table 1 presents the Water Quality Index (WQI) values for the Jing River, along with statistical findings for various indicators from 2016 to 2022. Over the past six years, WQI values ranged from 36.84 to 85.79 across monitoring sections. Water quality classifications included “poor” (0%), “fair” (1.13%), “moderate” (23.08%), and “good” (75.79%), with no sections rated as “excellent”. The predominant classifications were “good” and “moderate”, resulting in an overall average WQI of 73.70, indicative of “good” water quality.
The WQI values and seven water quality indicators underwent the Shapiro–Wilk normality test to assess their distribution. Results showed that, at the 0.05 significance level, all indicators except for dissolved oxygen (DO) (p = 0.125) did not conform to a normal distribution. Consequently, due to the non-parametric nature of the data, correlation analysis was conducted using Spearman’s coefficient method (see Table 2), allowing for an accurate assessment of relationships among variables despite violations of normality assumptions.
The correlation analysis revealed a strong relationship between CODMn, COD, BOD5, NH3-N, and TP with the WQI values, indicating that these five indicators are the most significant pollutants influencing the overall water quality of the Jing River.

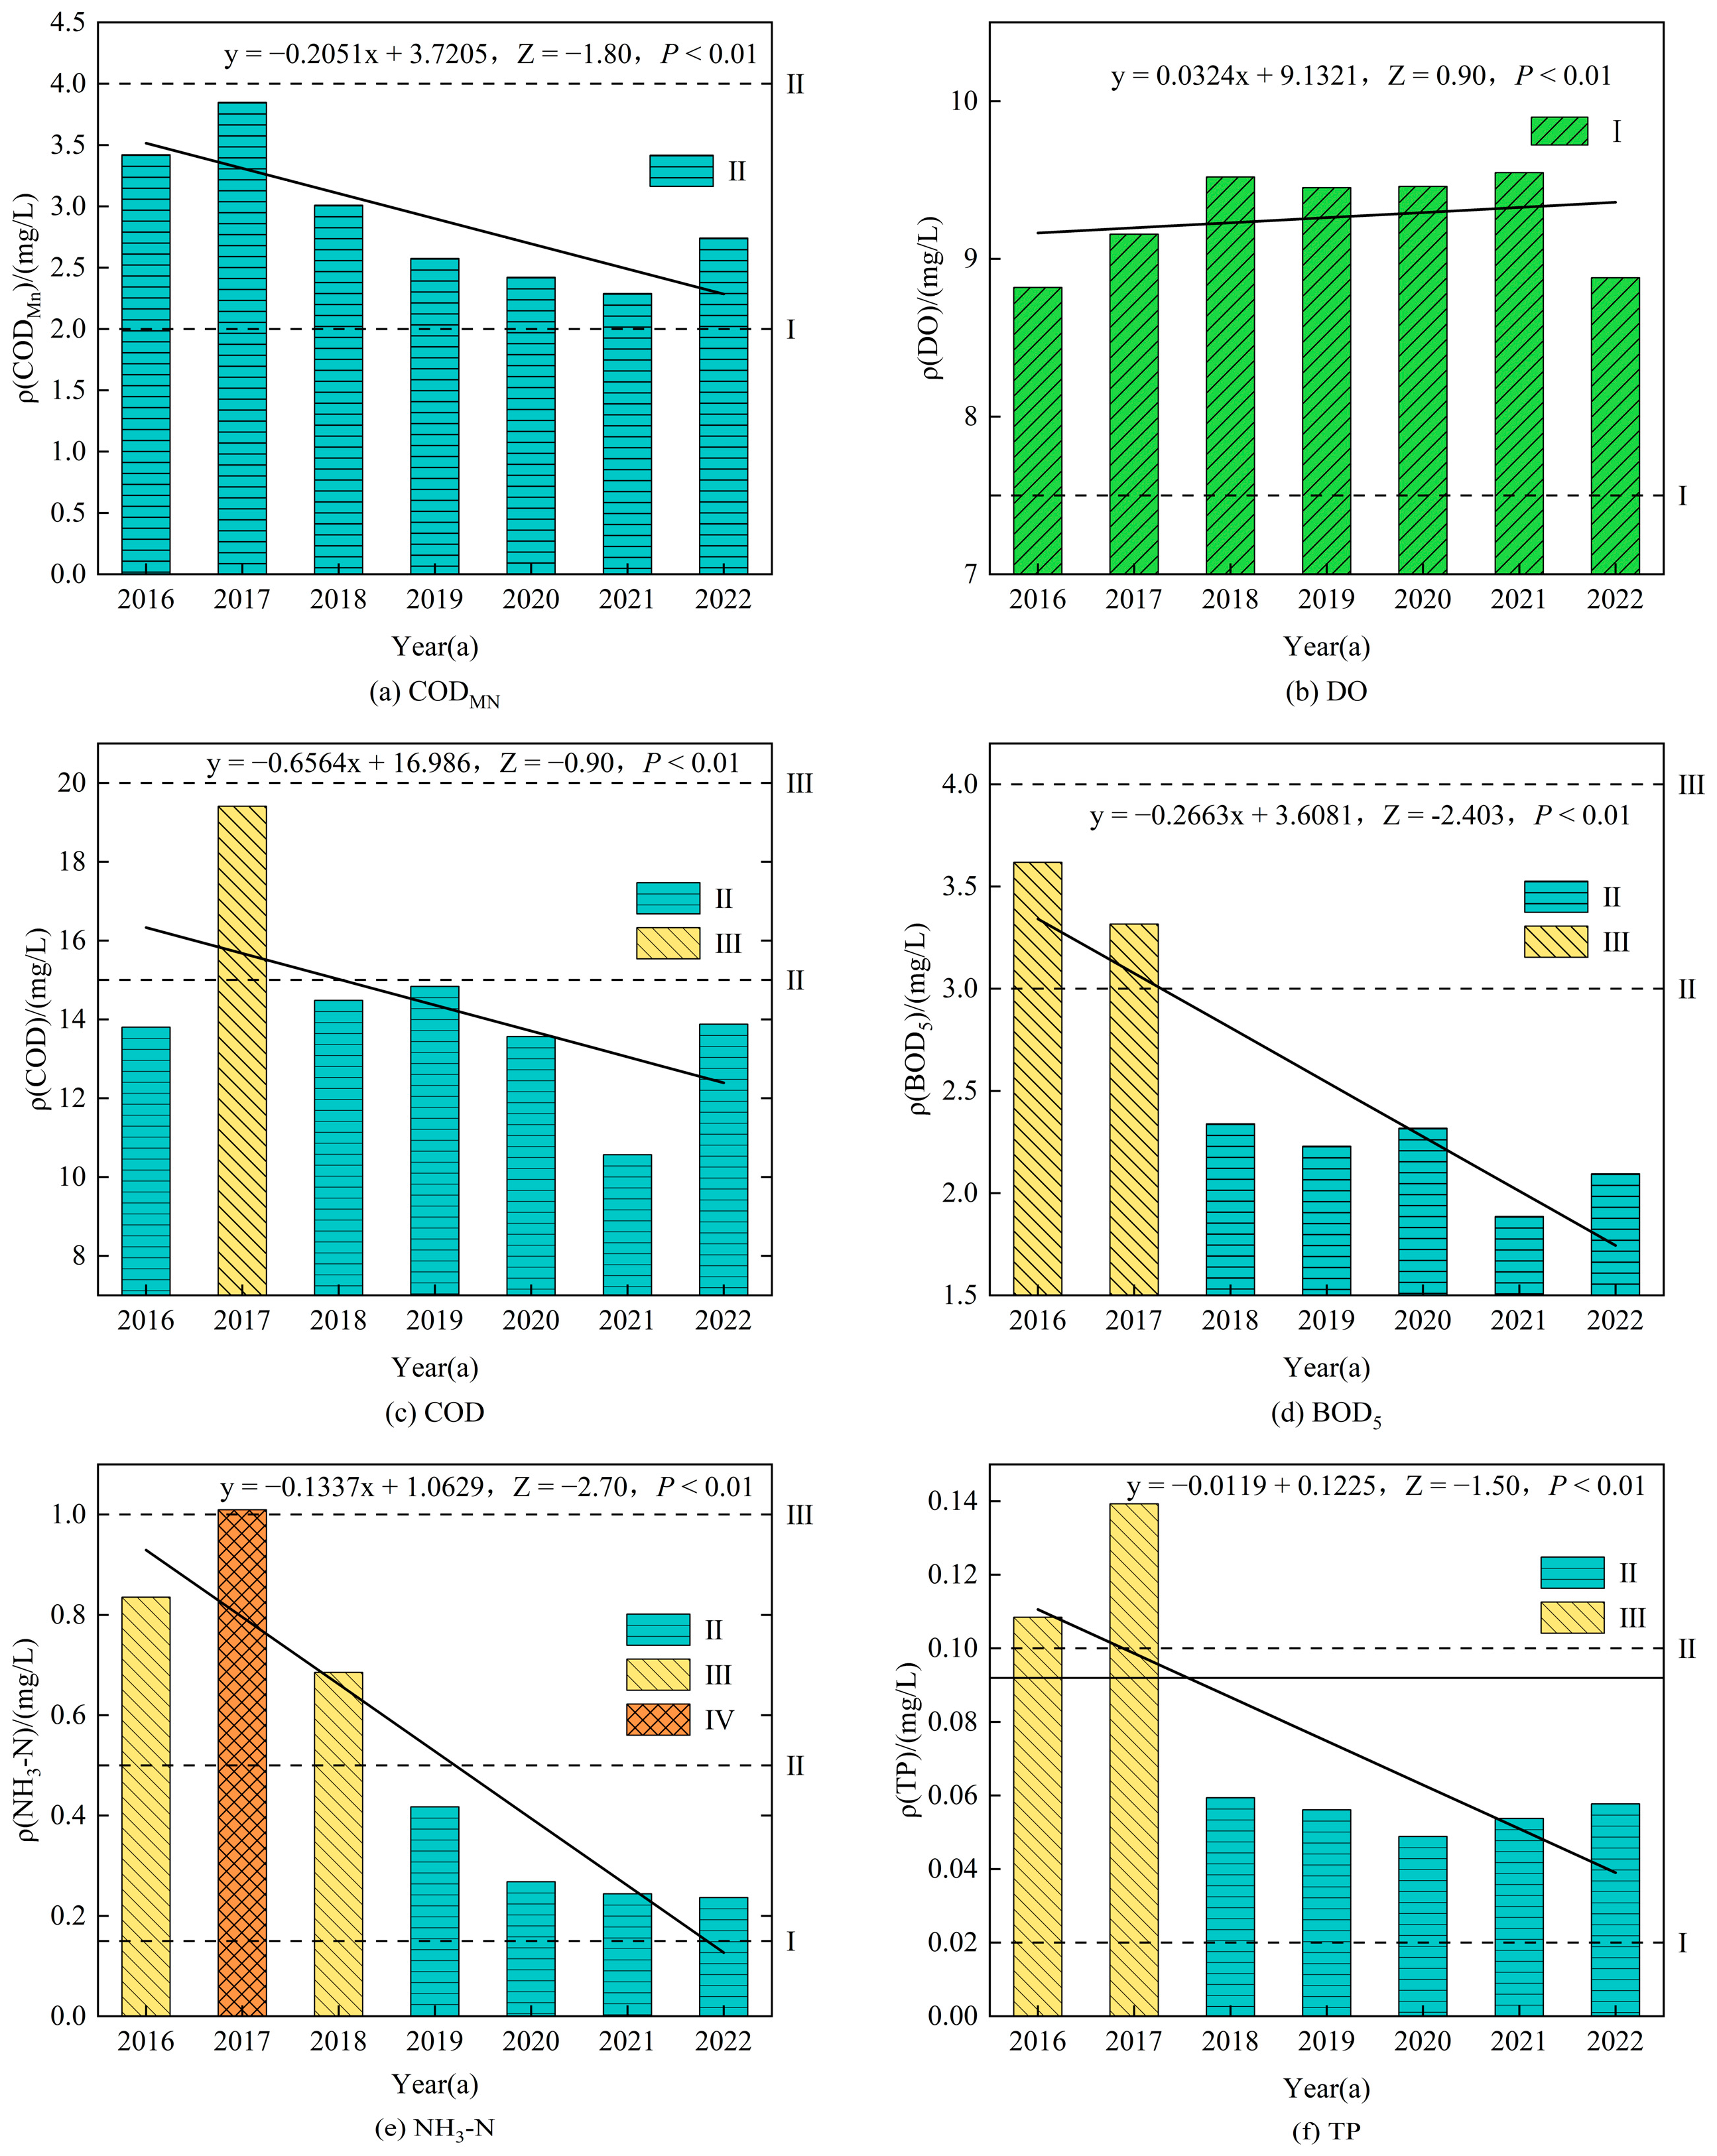
3.2.2. Interannual Variation Characteristics of Water Quality

The statistical results of the Water Quality Index (WQI) values from 2016 to 2022 are presented in Table 3. Throughout this seven-year period, the annual average WQI value exhibited an upward trend, with a minimum of 36.84 recorded in 2016 and a maximum of 85.79 observed in 2021. Correspondingly, the water quality assessment grades were categorized as “fair” in 2016 and “good” in 2021. A temporal analysis (see Figure 5a) revealed significant changes in the distribution of water quality assessment grades for the Jing River. Specifically, the proportion of “moderate” grades declined from 53.95% in 2016 to 11.43% in 2022, while the proportion of “good” grades rose dramatically from 40.79% to 88.57%. The decreasing trend in “moderate” water quality suggests a reduction in the frequency and intensity of pollution events over time, reflecting the effectiveness of environmental policies and practices. Notably, the percentage of “fair” water quality decreased to 0% starting in 2018, and “moderate” water quality was eliminated by 2021. This shift indicates a transition towards a more stable and healthier aquatic ecosystem. Although a slight improvement in water quality was noted in 2022, the overall trend indicates a consistent movement towards enhanced water quality in the Jing River. This positive trajectory underscores the importance of ongoing monitoring and adaptive management strategies to address emerging challenges, such as climate variability and anthropogenic pressures. Future research should focus on identifying the specific drivers of water quality changes, including seasonal variations and land-use impacts, to further refine management approaches and ensure the sustainability of water resources in the region.
To determine the trend of water quality changes in the river, changes in average yearly Water Quality Index (WQI) values were evaluated using the Mann–Kendall (M–K) trend test, as seen in Figure 5b. At a significance threshold of 0.05, the WQI values indicated a substantial upward trend (Z > 0) from 2016 to 2022, indicating that overall water quality improved significantly throughout this time period, with the increase becoming clear from 2018. The reason for this is that in 2018, Shaanxi Province published the Shaanxi Province Water Pollution Prevention and Control 2018 Annual Work Program, which remediated significantly polluting small businesses and enhanced livestock and poultry breeding pollution control. The Jing River Basin Water Environment Comprehensive Improvement Project and the Jing River Flood Control and Ecological Management Project, both launched in 2019, ensured that the Jing River’s water quality fulfilled the norms. In the same year, Jing River New City launched the “Three-Year Action Implementation Program for the Protection and Treatment of River and Lake Water Systems in Jing River New City (2019–2021)” to improve the Jing River’s water quality through the construction of wastewater treatment plants and urban pipeline network renovation, among other measures.
The analysis of the changes in water quality between flood and non-flood periods based on WQI values showed that the non-flood water quality WQI values were consistently higher than those of the flood period from 2016 to 2022, but the difference was minor (see Figure 5c). This small discrepancy could be attributed to increased runoff during the flood season, which may transfer more contaminants from agricultural and urban areas into the river system, thereby marginally lowering water quality. On the contrary, off-flood seasons often have lower surface runoff, resulting in lower diffuse pollution inputs and a minor increase in water quality.
The analysis of water quality changes between flood and non-flood periods based on the Water Quality Index values showed that from 2016 to 2022, the Water Quality Index values in the non-flood period were consistently higher than those in the flood period (see Figure 5c),which is consistent with the study of Geng et al. [6]. This small difference is due to the increase in runoff during flood season, which transfers more pollutants from agricultural and urban areas into the river system, and the water body’s self-purification capacity deteriorates, thus slightly decreasing the water quality. In contrast, surface runoff is typically lower during non-flood periods, which reduces the input of diffuse pollution, resulting in a slight increase in water quality.
Figure 5d shows that the average WQI values for both seasons increased significantly (Z > 0). Specifically, between 2016 and 2021, the average WQI climbed from 64.34 to 78.42 during the flood season, and from 69.81 to 78.99 during the non-flood season. However, the WQI values for the two seasons fell slightly in 2022 when compared to 2021, which is consistent with the temporal variations of specific water quality indicators and the trend of the yearly average WQI. The reason is that in the Jing River, several coal mining businesses operate upstream of the Shaanxi part, and the failure of wastewater treatment facilities, industrial wastewater discharge, and inadequate environmental management have polluted the water body. As a result, it is vital to improve the maintenance and management of wastewater treatment facilities, and the creation of a comprehensive water quality monitoring and early warning mechanism will be critical to preventing water quality degradation.

3.2.3. Spatial and Temporal Difference Characteristics of Water Quality

Based on the spatial variation characteristics analyzed using the Water Quality Index (WQI) and illustrated in Figure 6a, the overall mean WQI values of the seven assessed sections ranged from 64.15 to 76.72. These values correspond to water quality ratings of “moderate” and “good”, with section S1 (Yangjiagou Village) exhibiting the lowest WQI and section S5 (Jinghe Bridge) the highest. Notably, only section S1 had a WQI value below 70, classified as “moderate”, while the remaining sections were all rated as “good”. The higher water quality observed in the middle reaches, particularly at sections S4 (Linjin Bridge in Taiping Town) and S5 (Jinghe Bridge), where WQI values exceeded 76, indicates significant improvement downstream. Although sections S6 and S7 showed a slight decline in WQI values compared to S5, they still maintained the “good” rating.
Overall, the Water Quality Index values exhibit a rising and then falling trend from upstream to downstream. This pattern is consistent with the spatial variation results of individual water quality indicators. The significant improvement in water quality from Yangjiagou Village (S1) to Xiangmiao Township (S3) reflects the river’s self-purification capacity, likely due to natural attenuation processes and reduced pollutant inputs. Xiangmiao Township (S3) is situated within the Dongzhuang Reservoir, which functions as a sedimentation basin, further enhancing downstream water quality. Consequently, the section below the dam at Jinghe Bridge (S5) reached optimal water quality levels.
However, beyond Jinghe Bridge (S5), the area becomes densely populated with concentrated urban and industrial zones. This increased anthropogenic activity leads to a decline in water quality in sections S6 and S7. The influx of pollutants from urban runoff, industrial discharges, and agricultural activities in these areas likely contribute to the observed decrease in WQI values. This spatial pattern underscores the significant impact of land use on water quality and highlights the need for targeted management strategies in downstream regions to mitigate pollution and protect aquatic ecosystems.
The spatial variation in WQI values along the Jing River demonstrates the interplay between natural processes and anthropogenic influences on water quality. The initial improvement from S1 to S5 can be attributed to the river’s self-purification mechanisms, including dilution, sedimentation, and biodegradation within the Dongzhuang Reservoir. This reservoir acts as a crucial buffer, reducing contaminant loads and enhancing water quality downstream. The subsequent decline in water quality beyond S5 emphasizes the detrimental effects of urbanization and industrialization. The dense population and industrial activities introduce various pollutants that overwhelm the river’s natural assimilative capacity. These findings highlight the urgent need for implementing stringent pollution control measures, such as upgrading wastewater treatment facilities, enforcing stricter industrial discharge regulations, and promoting sustainable land-use practices.
Understanding the spatial distribution of water quality provides valuable insights for policymakers and environmental managers. By identifying critical areas with declining water quality, targeted interventions can be developed to address specific pollution sources. Continuous monitoring and comprehensive assessments are essential to evaluate the effectiveness of implemented strategies and to ensure the long-term sustainability of the Jing River’s ecosystem.
The annual Water Quality Index (WQI) values for each of the seven monitoring transects were plotted and are presented in Figure 6b–h. From a temporal perspective, the overall water quality of the river has shown a consistent improvement over the years. In 2016 and 2017, more than half of the sections had WQI values below 70, indicating “moderate” water quality. From 2018 onwards, the annual average WQI value for each section exceeded 70, elevating the water quality evaluation grade to “good.” Notably, the WQI value at the Jinghe Bridge (S5) section surpassed 80 in both 2021 and 2022, suggesting that environmental management efforts to control water pollution in Shaanxi Province have yielded significant results. The most significant improvement was observed at the Madong Village (S7) cross-section; however, a slight decline in water quality was noted in 2022, indicating the need for enhanced monitoring and management in this area. Strictly regulating the water quality at the Yangjiagou (S1) segment is also essential. According to multi-year average surface water resource data for the Jing River Basin, the inbound water volume is 1401.28 million cubic meters, while the province’s self-produced water volume is only 442.9 million cubic meters. This disparity indicates a heavy reliance on upstream transit flows, which constitute a significant proportion of the basin’s water resources. Additionally, the water function zoning of the upstream inbound water coincides with the control section where the Jing River enters the Weihe River. Consequently, the carrying capacity of the water environment in the provincial section of the Jing River Basin is greatly influenced by the quality of incoming upstream water. To achieve the objectives outlined in the water pollution prevention and control plan for the Shaanxi section of the Jing River Basin, it is imperative to strengthen regional collaborative management of the basin’s water environment with neighboring Gansu Province. Such cooperation would help ensure that upstream activities do not adversely affect downstream water quality, thereby supporting the sustainable management of the river basin’s water resources. The significant dependence on upstream water inflows from Gansu Province highlights the transboundary nature of water quality management in the Jing River Basin. The water quality of incoming flows directly affects the province’s ability to meet its environmental objectives. Therefore, fostering interprovincial cooperation is critical. Joint monitoring programs, data sharing, and coordinated pollution control strategies could enhance the effectiveness of water quality management across the entire basin. Analyzing from a spatial perspective, we discovered that the Jing River’s water quality improved and then deteriorated from upstream to downstream. This phenomenon is also evident in Li Haiyan’s research on habitat quality in the Weihe River Basin (Shaanxi region) [38].
Furthermore, water resource allocation in the Jing River Basin should be carefully planned. After the Dongzhuang Reservoir was completed, the average annual discharge flow downstream of the dam was reduced by more than half. If the reservoir’s water is over-exploited, it will jeopardize the biological flow in the Jing River’s lower reaches and have a direct impact on the goal of achieving category III water quality at the Jing River–Wei River confluence. It is suggested that the following measures be strengthened: protect the ecological flow safety through Dongzhuang Reservoir’s ecological flow release program; protect the water supply through cooperative dispatch with water supply area storage reservoirs; according to the Guiding Opinions on Accelerating the Construction of Ecologically Clean Small Watersheds, local governments are encouraged to mobilize funds through multiple channels, and county governments are encouraged to coordinate the use of relevant funds to construct clean small watersheds, in order to maintain the capacity to conserve water and improve soil and water management; implementing small watershed management projects to reduce soil erosion through slope irrigation and drainage water system regulation, gully management, bank protection, and other measures, and utilizing vegetation buffer zones and artificial wetland purification measures to control surface source pollution and improve the regional ecological environment.
In conclusion, the consistent improvement in the Jing River’s water quality over the study period is encouraging, demonstrating the positive impact of environmental management efforts in Shaanxi Province. However, challenges remain, particularly concerning the sustainable allocation of water resources and the influence of upstream water quality. Strengthening regional collaboration with Gansu Province and implementing systematic water resource planning are essential steps toward ensuring the long-term health of the Jing River Basin. Continued monitoring and adaptive management will be crucial in responding to future environmental changes and achieving the goals set forth in regional water pollution prevention and control plans.

3.3. Analysis of Water Quality Driving Factors

3.3.1. Correlation Analysis Results

The analysis revealed significant differences in the water quality indicators and WQI values among cross sections S5 (Jinghe Bridge), S6 (Jing River out of Xixian), and S7 (Madong Village), indicating systematic variations in water quality. Consequently, Spearman correlation analysis between WQI values and water quality indicators was conducted to identify the primary pollution sources affecting these sections
Notably, the section from Jinghe Bridge to Jing River out of Xixian features the Jingyang Jing River National Wetland Park. The presence of aquatic plants and microorganisms within this wetland plays a crucial role in nutrient removal, effectively mitigating levels of nitrogen and phosphorus, thereby enhancing the water quality relative to other sections. As illustrated in Figure 7a–c, both CODMn and COD demonstrated significant negative correlations with WQI in these sections, underscoring that the water quality is substantially influenced by common pollution sources related to these indicators. The study indicated that the COD loads primarily stem from livestock and agricultural activities, which are prevalent in the surrounding area [27,39]. To strike a balance between economic development and water quality protection, it is necessary to encourage the transformation of agricultural production methods and the adoption of eco-agricultural techniques, while also enforcing strict discharge standards for livestock and poultry farming. At section S5, a significant negative correlation was observed between BOD5 and WQI, reflecting a mild degree of organic matter pollution in the water. This suggests that while organic pollutants are present, they may not be at critical levels yet. In section S6, TP was negatively correlated with WQI, indicating potential eutrophication, which could pose risks to aquatic ecosystems if not monitored. Moreover, from section S6 to S7, NH3-N exhibited a significant negative correlation with WQI, highlighting the detrimental impact of ammonia nitrogen on water quality in this segment. The section is particularly vulnerable as it receives industrial, domestic, and agricultural wastewater from Jingyang County, Gaoling County, and Weicheng District. Despite its relatively short length, the limited attenuation time contributes to notable ammonia-nitrogen pollution, necessitating immediate intervention strategies to mitigate these effects. This analysis emphasizes the need for targeted pollution management strategies in these key sections to enhance overall water quality and protect the ecological integrity of the Jing River Basin.
The Jing River Basin’s ecological environment faces significant challenges due to accelerated urbanization, population growth, and expanding towns, leading to increased water demand and exacerbating existing scarcity. In 2022, per capita water consumption in Xianyang City was 217.6 cubic meters, notably below the national alert value of 500 cubic meters. Total water resources in the Jing River were estimated at 533 million cubic meters, with rainfall contributing 5.173 billion cubic meters, representing 4.21% and 6.85% of the Yellow River Basin’s totals, respectively. Annual runoff was recorded at 1.564 billion cubic meters, an 11% decrease from the previous year, underscoring the acute water scarcity characterized by uneven rainfall distribution and limited supply capacity.
Competition for water resources among industrial, agricultural, and urban sectors intensifies ecological water depletion, diminishing the self-purification capacity of water bodies and reducing the water environment’s carrying capacity. This scarcity, compounded by insufficient storage projects, highlights a critical supply-demand imbalance.
To promote sustainable development in the Jing River Basin, several measures are necessary. First, monitoring of agricultural and industrial pollution sources should be enhanced, alongside the promotion of cleaner production and ecological agriculture to reduce harmful substance input. Comprehensive basin management is essential, focusing on the construction of ecological buffer zones and wetlands to bolster self-purification and ecological functions. Additionally, strengthening scientific research and water resource monitoring, along with rational allocation mechanisms, is crucial. In light of severe water shortages, optimizing resource allocation and enhancing regulatory capacity are imperative. The Dongzhuang Reservoir, the sole control project on the Jing River’s main stem, is projected for completion by 2025 and is expected to alleviate local supply-demand conflicts. Scientific optimization of water allocation will facilitate a balance between diverse demands and supply capacities. Moreover, reinforcing water quality supervision and establishing a robust monitoring system are vital for ensuring sustainable water resource utilization.

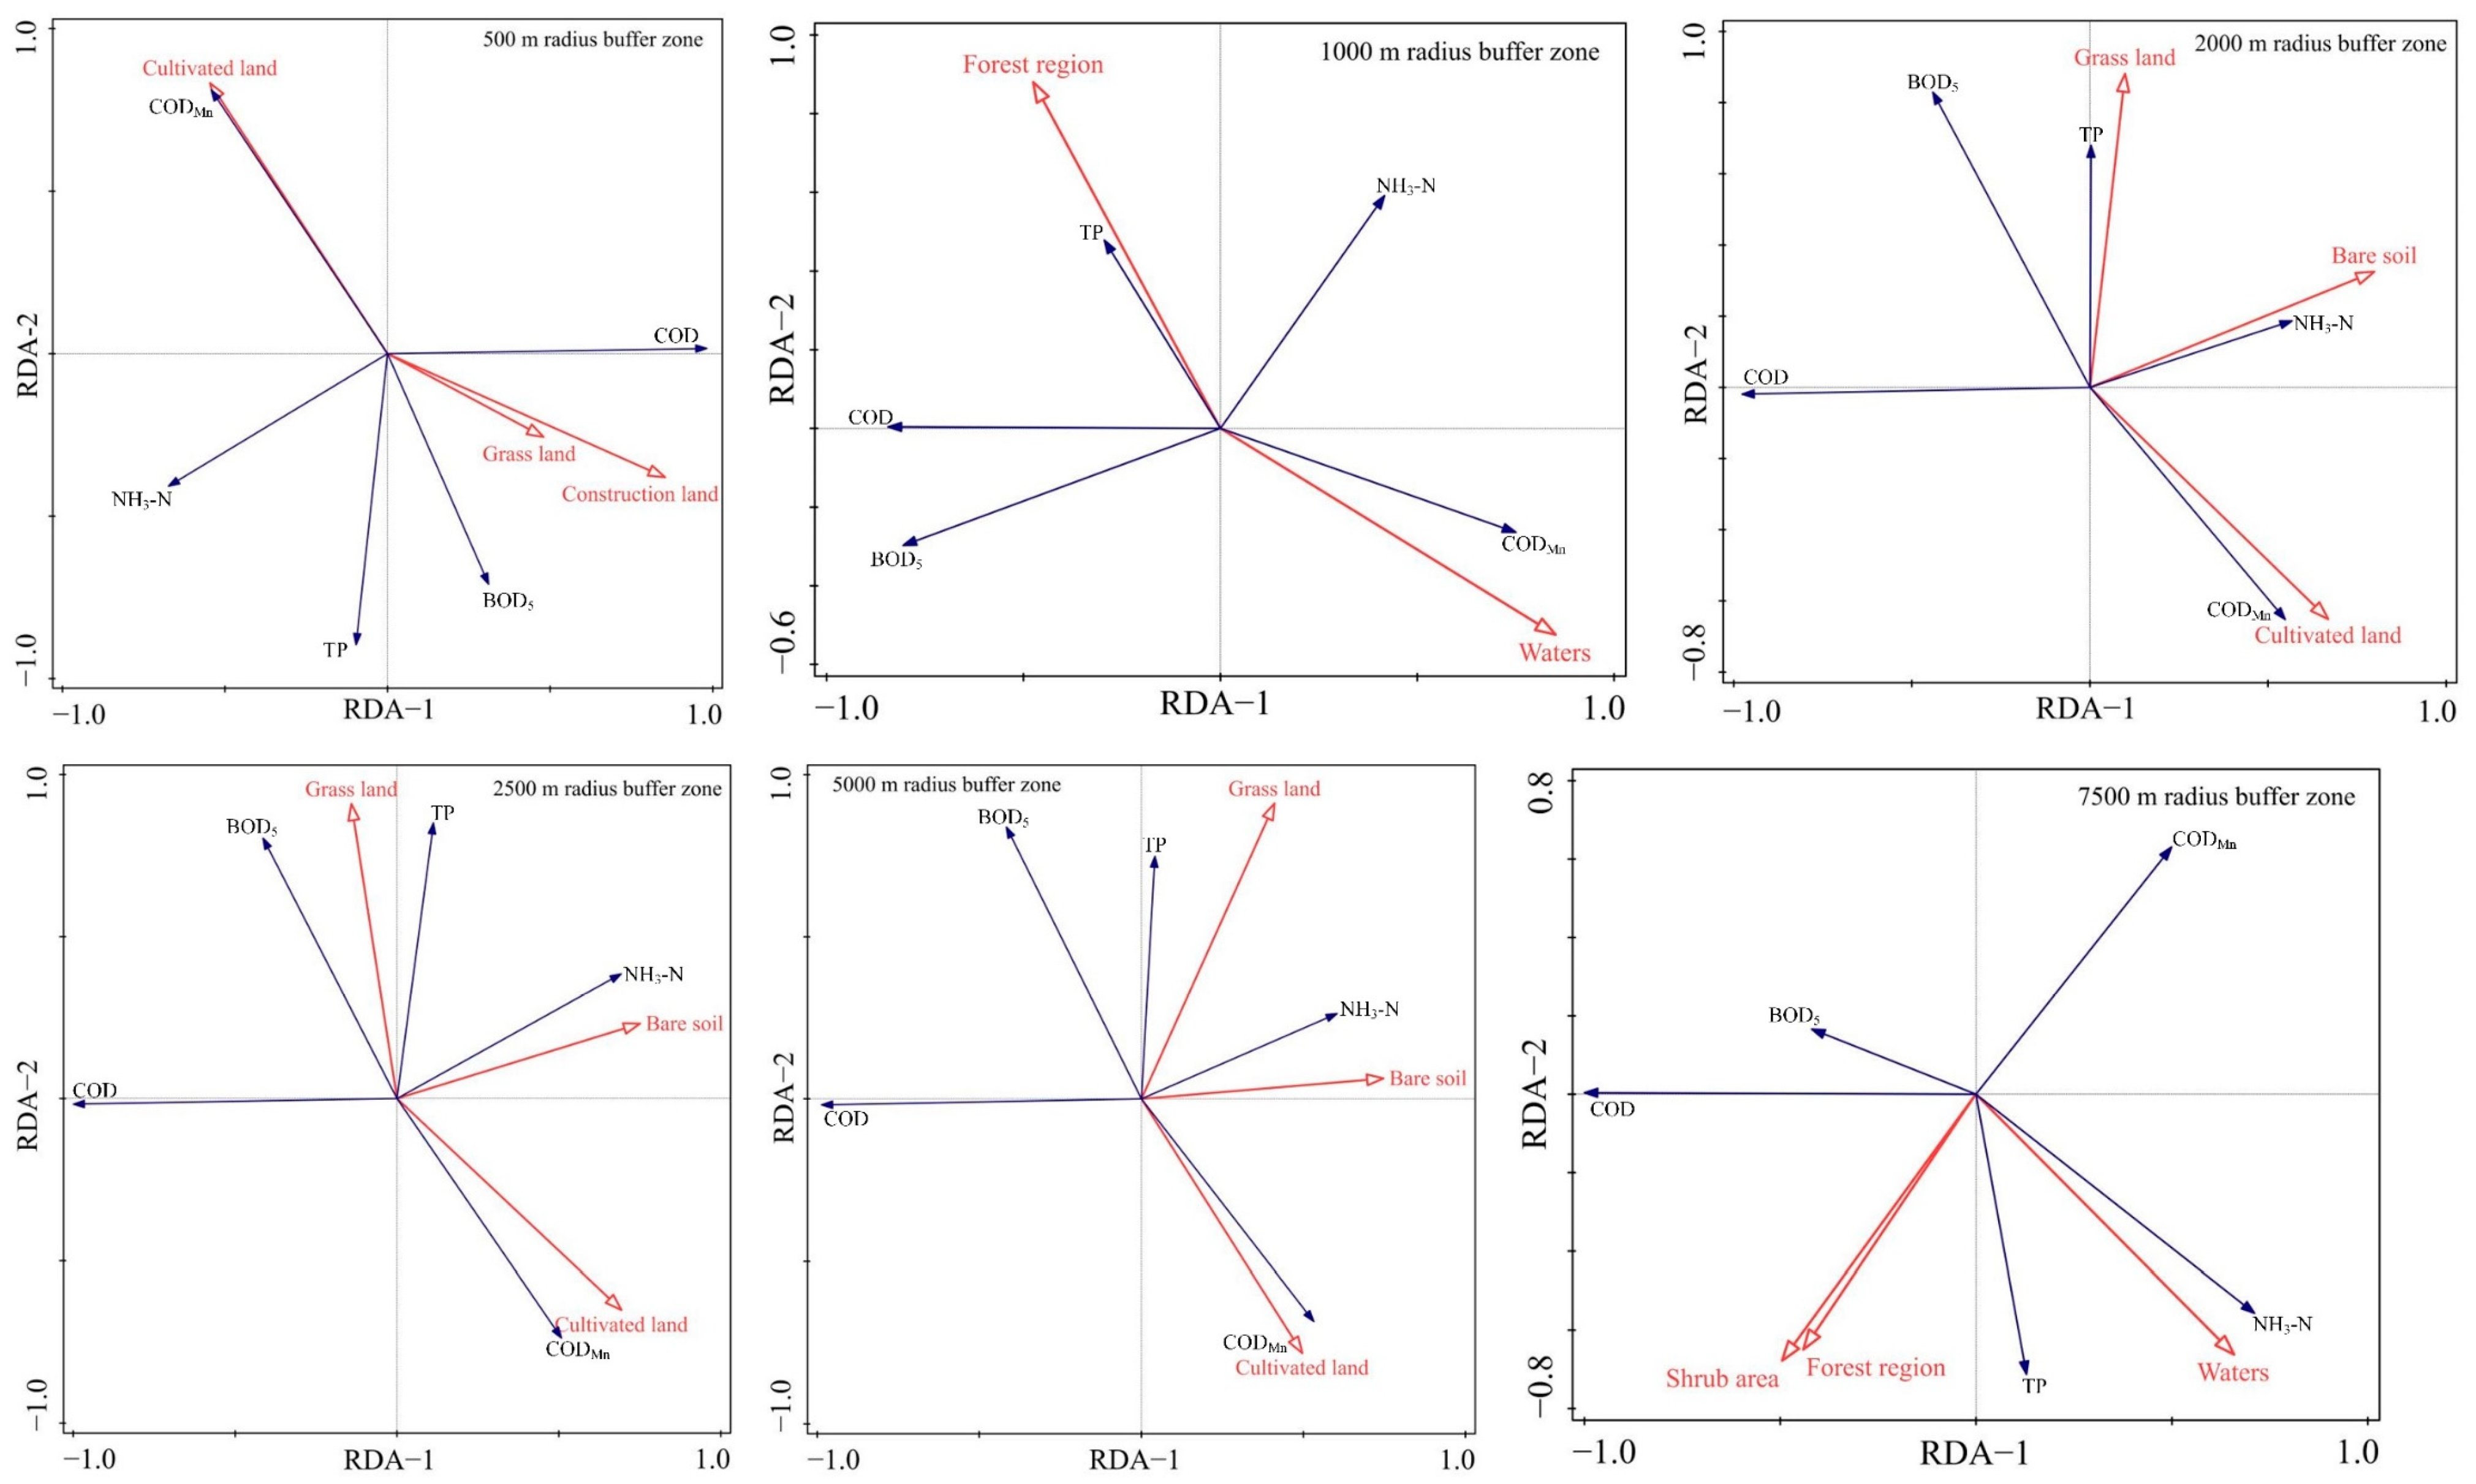
3.3.2. Redundancy Analysis Results

This paper focuses on analyzing the characteristics of land use types in the Jing River Basin and exploring their effects on water quality, which is of great significance for land use planning and management, as well as for the reduction of nonpoint source pollution in this basin. In this study, the spatial scale was divided into six buffer zones (500 m, 1000 m, 2000 m, 2500 m, 5000 m, and 7500 m). Using ArcGIS 10.8 software, circular buffer zones were established based on different radii centered on the monitoring stations to analyze the land use structure. Redundancy analysis (RDA) was conducted on the land use area and water quality parameters at varying radii.
Based on the 10-m resolution land use data of the Yellow River Basin in 2020, the area shares of land use types at different spatial scales were calculated (note that most waters in the S1 section were not analyzed as they were classified as construction land). The analysis indicated that land use types at each scale predominantly included construction land, cultivated land, and shrubs, with variations in the proportions of each type. The area of cultivated land increased with the buffer radius, ranging from 29.72% to 40.41%. The area of built-up land exhibited an initial increase followed by a decrease, reaching a maximum of 38.33% in the 1000-m buffer zone. The area of shrubs remained approximately constant at around 20%. Conversely, the area of water bodies significantly decreased from 19.56% to 4.69%, while the proportions of grassland and bare ground were both less than 1%.
The ability of land use to explain variability in water quality at different spatial scales was assessed through redundancy analysis, which aimed to identify the scales with the greatest impact on water quality (see Table 4). The results demonstrated that the explanatory power of land use patterns regarding water quality exhibited an increasing trend followed by a decrease as spatial scales expanded, corroborating findings from previous studies [40]. Specifically, the capacity of land use types to elucidate water quality was relatively low within buffer zones ranging from 500 to 2000 m, while a significant increase in this capacity was observed in buffer zones exceeding 2500 m. This observation aligns with the perspective of Edward Mao [33], which posits that land use patterns can more effectively clarify the complexity of water quality pollution sources at larger spatial scales.
Among the six selected scales, the 2500-m buffer zone was identified as having the most substantial effect on stream water quality, achieving an explanation rate of 97.6%. The types of land use exerting the greatest influence on water quality varied across different spatial scales. Within the 500-m buffer zone, built-up areas were determined to significantly affect water quality. This finding underscores the direct influence of urbanization on surrounding aquatic systems, where increased impervious surfaces contribute to runoff and pollutant loading. In the 1000-m buffer zone, the presence of water bodies was found to have the most pronounced impact, highlighting the importance of maintaining riparian buffers to enhance water quality. Furthermore, in the 2000- to 5000-m buffer zones, bare land emerged as the primary explanatory variable, accounting for between 52.4% and 59% of the variability in water quality. The susceptibility of bare ground to weathering and erosion, resulting from a lack of vegetation cover, was identified as a contributing factor to increased dissolved substances entering water bodies.
Despite its small percentage across all scales, the high explanatory rate of bare land underscores its importance in regulating water quality [41]. This suggests that even limited areas of bare ground can significantly compromise water quality by facilitating erosion and runoff. In contrast, while the explained rate of the impact of cultivated land on water quality is slightly smaller than that of bare land, it cannot be ignored because it covers a wider area at all levels. Cropland’s impacts on water quality also vary seasonally, with past research indicating that cropland has a stronger impact on water quality metrics during the rainy season than during other seasons [42]. Furthermore, cropland’s impact on water quality may be bidirectional, with the potential to either worsen nonpoint source pollution or provide some purification [43]. In conclusion, bare land and cultivated land have the greatest influence on the water quality of the Jing River, as established by previous graduate students in the Wuding and Yanhe River basins [44].
Consequently, the implementation of effective control measures on bare land and the scientific planning of agricultural (cultivated land) layouts are recommended to support the long-term management of water quality in the Jing River Basin. It is critical to adopt sustainable land use practices that mitigate nonpoint source pollution, including the establishment of vegetative buffers and the promotion of conservation tillage.
A two-dimensional ordination diagram was employed to illustrate the relationship between response variables and explanatory variables, thereby providing an intuitive representation of the explanatory capacity of land use types on water quality indicators at varying scales, as shown in Figure 8. The length of the arrows indicates the extent of influence that land use area exerts on water quality; additionally, the cosine value of the angle between the direction of the arrow and the concentration of water quality indicators reflects their correlation. A longer arrow corresponds to a larger cosine value, signifying a stronger correlation between land use and water quality indicators [45].
The degree to which land use types explained river water quality indicators varied across different buffer scales, with a maximum of three land use types identified per buffer. In the 500-m buffer zone, a consistent correlation was observed between construction land and grassland with water quality indicators, with construction land predominantly affecting COD concentration, corroborating findings by Wang Yishu et al. [46]. This suggests that urban development may lead to increased runoff, subsequently elevating pollutant levels. In the 1000-m buffer, water bodies were found to be significantly positively correlated with CODMn and significantly negatively correlated with NH3-N and TP, whereas the opposite correlation was observed in the 7500-m buffer.
Within the 2000 to 5000-m buffer zone, the land use types influencing water quality conditions included bare land, cultivated land, and grassland. Bare land exhibited a significant positive correlation with NH3-N and TP, while showing a significant negative correlation with COD. Conversely, cultivated land was significantly and positively correlated with CODMn, but negatively correlated with COD, BOD5, and TP. Grassland was significantly and positively correlated with BOD5, TP, and NH3-N, while negatively correlating with CODMn. In the 7500-m buffer zone, trees and shrub area demonstrated consistent correlations with water quality indicators, reinforcing the notion that forested areas contribute positively to water quality by enhancing filtration and reducing runoff.
Future research should focus on exploring the interactions between various land use types and their cumulative impacts on water quality across different temporal and spatial scales, facilitating more comprehensive water management frameworks.

4. Conclusions

This study systematically assessed the water quality of the Jing River in Shaanxi to identify influencing factors and spatial distribution characteristics of quality changes, offering valuable insights for the ecological protection and sustainable development of the Jing River Basin. The main findings are summarized as follows.
(1)
The water quality of the Jing River in Shaanxi province from 2016 to 2022 has shown an upward trend, gradually improving. The improvement became obvious in 2018, related to the series of water quality governance policies issued by Shaanxi Province. In 2022, the water quality slightly decreased, and it is necessary to strengthen the supervision of the coal mining industry upstream of the river and establish a comprehensive water quality monitoring and early warning mechanism.
(2)
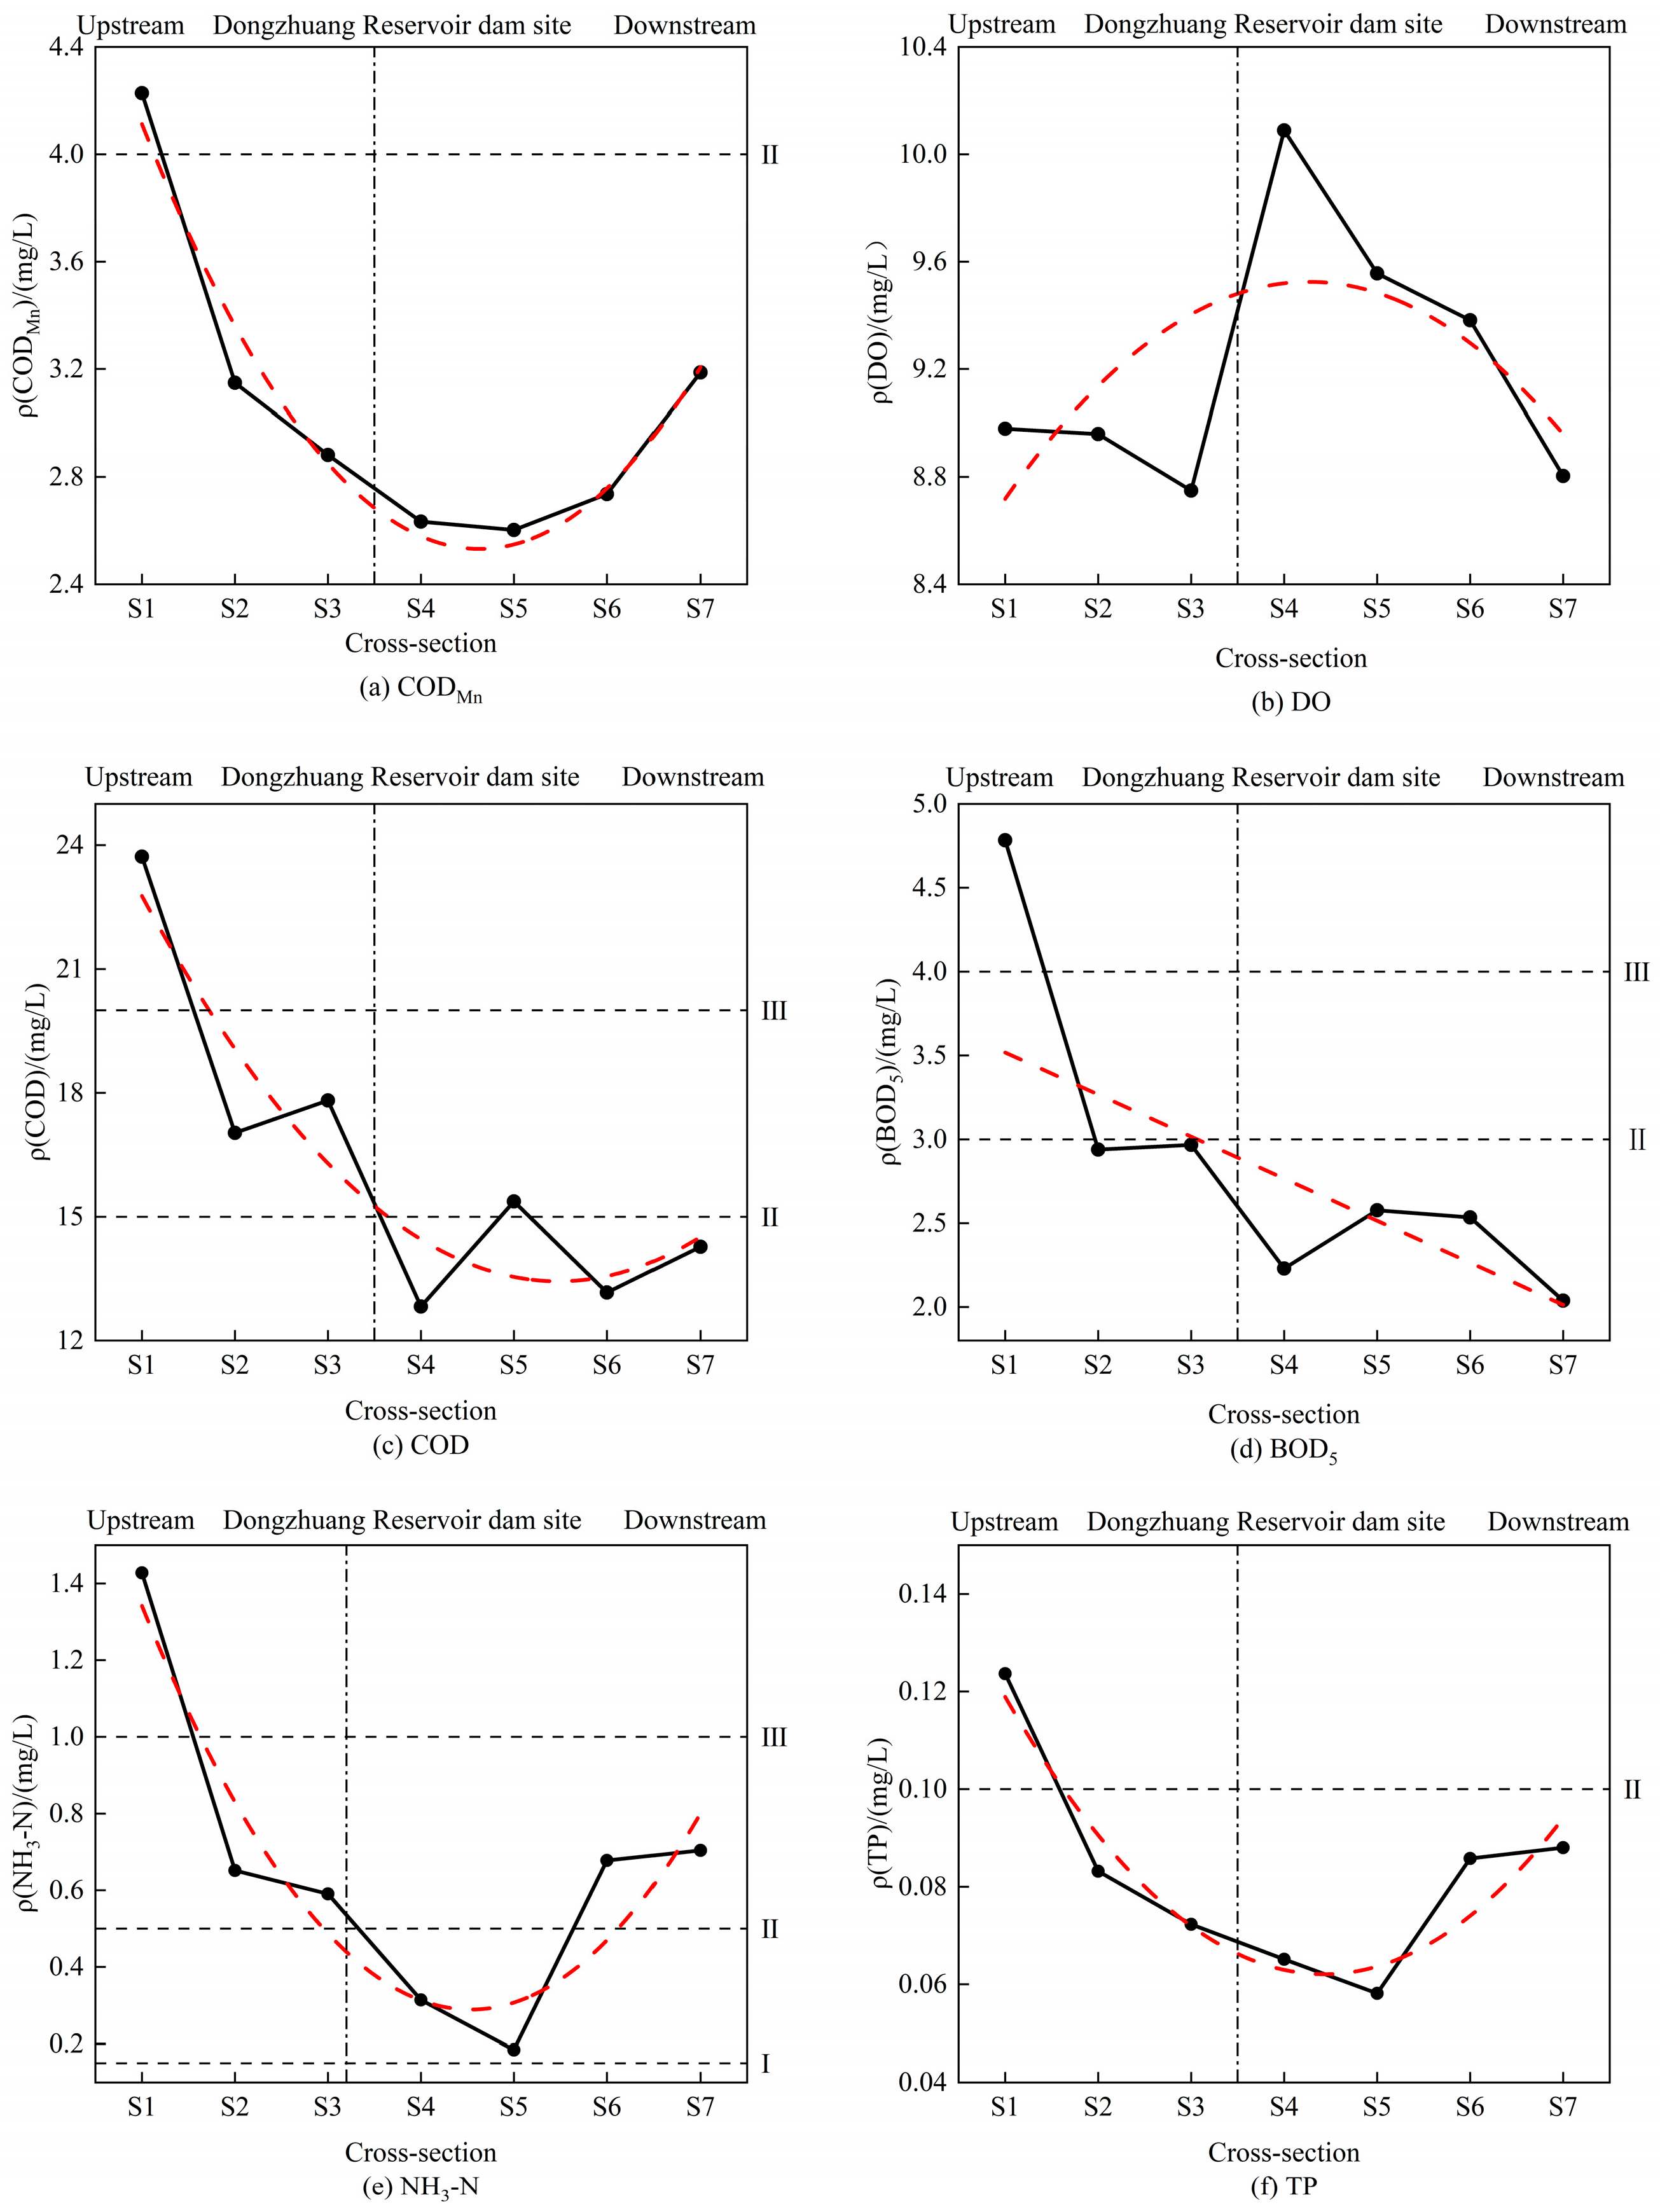
The water quality rating of the Jing River in Shaanxi province is “good”. The main pollutants affecting water quality changes are CODMn, COD, BOD5, NH3-N, and TP. The water quality of the river rises first and then drops from upstream to downstream. Among them, the water quality at S4 and S5 downstream sections is the best.
(3)
The water quality near the downstream section of the Jing River that is close to the Weihe River (S6 and S7) is poor, mainly affected by nonpoint source pollution from livestock farming, agricultural activities, and sewage discharge. The 2500-m buffer zone spatial scale has the best explanation effect on water quality changes, and the proportion of bare land and cultivated land in land use types is the main factor affecting river water quality.

Supplementary Materials

The following supporting information can be downloaded at: https://www.mdpi.com/article/10.3390/w16223326/s1, Table S1: Surface water environmental quality standards basic project standard limits (mg/L); Table S2: Methods for analyzing basic items of environmental quality standards for surface water.

Author Contributions

Investigation, M.L.; Writing—original draft, B.Z.; Writing—review & editing, J.L., B.Y., M.G., J.Z. and Z.L. All authors have read and agreed to the published version of the manuscript.

Funding

This study was funded by the Shaanxi Provincial Department of Education Project, grant number 23JY057; the National Natural Science Foundation of China, grant number 42277191.

Data Availability Statement

The data presented in this study are available on request from the corresponding author.

Conflicts of Interest

Author Meng Li was employed by the company Shaanxi Dongzhuang Water Control Project Construction Co., Ltd. The remaining authors declare that the research was conducted in the absence of any commercial or financial relationships that could be construed as a potential conflict of interest.

References

  1. Yang, L.; Song, J.; Song, B.; Wang, R.; Wang, X. Primary Pollutant Water Quality Identification Index Method and Its Application to Comprehensive Evaluation of River Water Quality. Environ. Sci. Technol. 2015, 38, 239–245. [Google Scholar]
  2. Hoque, Y.M.; Tripathi, S.; Hantush, M.M.; Govindaraju, R.S. Watershed reliability, resilience and vulnerability analysis under uncertainty using water quality data. J. Environ. Manag. 2012, 109, 101–112. [Google Scholar] [CrossRef] [PubMed]
  3. Guo, J.; Wang, C.; Huang, D.; Li, L.; Lian, H. Pollution characterization and water quality assessment of Dongting Lake. Environ. Chem. 2019, 38, 152–160. [Google Scholar]
  4. Chen, J.; Wu, C.; Li, S.; Wang, Y.; Gong, Y. Study on numerical simulation of water environment in Ba River basin. J. Northwest A F Univ. Nat. Sci. Ed. 2022, 50, 80–88. [Google Scholar]
  5. Fu, T.; Zou, Z.; Wang, X. Water quality assessment for Taizi River watershed in Liaoyang section based on multivariate statistical analysis and water quality identification index. Acta Sci. Circumst. 2014, 34, 473–480. [Google Scholar]
  6. Geng, J.; Wang, Y.; Hu, S.; Wei, Y.; Sun, F.; Yuan, P. WQI-Based Water Quality Assessment and Spatial-Temporal Change in Plain River Network Areas. Environ. Eng. 2023, 41, 187–193+209. [Google Scholar]
  7. Kaur, M.; Das, S.K.; Sarma, K. Water quality assessment of Tal Chhapar Wildlife Sanctuary using water quality index (CCME WQI). Acta Ecol. Sin. 2023, 43, 82–88. [Google Scholar] [CrossRef]
  8. Misaghi, F.; Delgosha, F.; Razzaghmanesh, M.; Myers, B. Introducing a water quality index for assessing water for irrigation purposes: A case study of the Ghezel Ozan River. Sci. Total Environ. 2017, 589, 107–116. [Google Scholar] [CrossRef]
  9. Kim, H.I.; Kim, D.; Mahdian, M.; Salamattalab, M.M.; Bateni, S.M.; Noori, R. Incorporation of water quality index models with machine learning-based techniques for real-time assessment of aquatic ecosystems. Environ. Pollut. 2024, 355, 124242. [Google Scholar] [CrossRef]
  10. Marselina, M.; Wibowo, F.; Mushfiroh, A. Water quality index assessment methods for surface water: A case study of the Citarum River in Indonesia. Heliyon 2022, 8, e09848. [Google Scholar] [CrossRef]
  11. Uddin, M.G.; Nash, S.; Rahman, A.; Olbert, A.I. A comprehensive method for improvement of water quality index (WQI) models for coastal water quality assessment. Water Res. 2022, 219, 118532. [Google Scholar] [CrossRef] [PubMed]
  12. Banda, T.D.; Kumarasamy, M. Artificial Neural Network (ANN)-Based Water Quality Index (WQI) for Assessing Spatiotemporal Trends in Surface Water Quality—A Case Study of South African River Basins. Water 2024, 16, 1485. [Google Scholar] [CrossRef]
  13. Mishra, M.; Singhal, A.; Srinivas, R. Effect of urbanization on the urban lake water quality by using water quality index (WQI). Mater. Today Proc. 2023. [Google Scholar] [CrossRef]
  14. Uddin, M.G.; Nash, S.; Rahman, A.; Olbert, A.I. A novel approach for estimating and predicting uncertainty in water quality index model using machine learning approaches. Water Res. 2023, 229, 119422. [Google Scholar] [CrossRef] [PubMed]
  15. Mao, Z. Discussion on Sustainable Development of Water Resources in Jinghe River Basin of Pingliang District. J. Water Resour. Water Eng. 2001, 12, 63–64. [Google Scholar]
  16. Wang, J.; Chen, S.; Wu, Y.; Hu, A. Simulation and Prediction of Water Quality Nitrogen based on ANN in Jinghe River, Shaanxi Province. Yellow River 2014, 36, 67–70+110. [Google Scholar]
  17. He, C.; Guo, Y.; Cai, D.; Liu, S.; Li, G. Temporal and Spatial Distribution of Organic Matter in Sudden Water Pollution Accident of Dongzhuang Reservoir. Pearl River 2023, 44, 117–123. [Google Scholar]
  18. Xu, Y.; Cui, L. Evaluation of Water Quality Status in the Jinghe-Xianyang Section from 2017 to 2019. Resour. Econ. Environ. Prot. 2020, 9, 14–16. [Google Scholar]
  19. Yu, F.; Song, J.; Yin, X.; Wu, W.; Chen, J. Water Pollution of the Jinghe River in Shaanxi Section. J. Beijing Norm. Univ. Nat. Sci. 2013, 49, 421–424. [Google Scholar]
  20. Wang, J.; Wu, Y.; Dang, B.; Xu, Z.; Hu, A.; Zhang, X. Spatial and Temporal Distribution of Surface Water Quality Using Multivariate Statistical Analysis in Jinghe River of Shaanxi Province, China. J. Nat. Resour. 2012, 27, 674–685. [Google Scholar]
  21. Yang, N.; Wang, X.; Li, J.; Zhang, T.; Feng, P. Response of nitrogen and phosphorus pollution load to different land use patterns in Taolinkou Reservoir basin. J. Water Resour. Water Eng. 2023, 34, 61. [Google Scholar]
  22. Qin, Y.; Xu, Y.; Li, H. SWAT model of non-point source pollution under different land use scenarios in the Heihe river basin. Acta Sci. Circumst. 2009, 29, 440–448. [Google Scholar]
  23. Xiang, S.; Pang, Y.; Dou, J.; Lu, X.; Xue, L.; Chu, Z. Impact of land use on the water quality of inflow river to Erhai Lake at different temporal and spatial scales. Acta Ecol. Sin. 2018, 38, 876–885. [Google Scholar]
  24. Mao, D.-H.; Zhou, Y.; Zhou, Y.-L. Analysis of Spatiotemporal Variation and Driving Factors of Water Quality in the Xiangjiang River Basin from 1990 to 2016. Huan Jing Ke Xue = Huanjing Kexue 2024, 45, 3953–3964. [Google Scholar] [PubMed]
  25. Jia, X.; Zhao, Q.; Hao, Y.; Zhang, X.; Lin, J.; Duan, P.; Zhang, Y.; Wang, S. Spatial Distribution Characteristics of Environmental Variables and Response to Land Use Patterns in Different Aquatic Ecological Functional Regions of Hun-Tai River Basin. Res. Environ. Sci. 2021, 34, 1542–1552. [Google Scholar]
  26. Dai, M.-J.; Zhang, B.; Du, Q.-Q.; Sun, J.-H.; Tian, L.; Wang, Y.-D. Effects of Land Use Types on Water Quality at Different Buffer Scales: Tianjin Section of the Haihe River Basin as an Example. Huan Jing Ke Xue = Huanjing Kexue 2024, 45, 1512–1524. [Google Scholar]
  27. Huang, K.; Li, H.; Li, J.; Xiao, H. Analysis of Agricultural Non-Point Source Pollution in the Jinghe River Basin. Yellow River 2021, 43, 106–111. [Google Scholar]
  28. Wang, Y. Identification of Critical Source Areas and Delineation of Management Subzones of Non-Point Source Pollution in Jing River Basin; Northwest A&F University: Xianyang, China, 2023. [Google Scholar]
  29. Zhang, Z.; Pan, W.; Sun, S.; Yan, K. Analysis of Jinghe River Water Ecological Management in Shaanxi Province. Shaanxi Water Resour. 2022, 4, 105–107. [Google Scholar]
  30. Pesce, S.F.; Wunderlin, D.A. Use of water quality indices to verify the impact of Córdoba City (Argentina) on Suquía River. Water Res. 2000, 34, 2915–2926. [Google Scholar] [CrossRef]
  31. Tang, Q.; Liu, B.; Wang, P.; Wang, Y.; Jiang, H.; Xie, Y.; Li, K. Application of improved WQI model in water quality assessment of typical watershed in the hilly area of central Sichuan Province: A case study in the upper reaches of Qiongjiang River Basin. J. Environ. Eng. Technol. 2022, 12, 615–623. [Google Scholar]
  32. Li, J.; Lian, Z.; Dou, M.; Chen, H.; Jia, R.; Li, G. Spatio-temporal distribution characteristics of water quality and influencing factors in Danjiang Reservoir area. South North Water Transf. Water Sci. Technol. 2023, 21, 181–189. [Google Scholar]
  33. Wu, Z.S.; Wang, X.L.; Chen, Y.W.; Cai, Y.J.; Deng, J.C. Assessing river water quality using water quality index in Lake Taihu Basin, China. Sci. Total Environ. 2018, 612, 914–922. [Google Scholar] [CrossRef] [PubMed]
  34. Li, Y.-Q.; Huang, T.-L.; Zhang, H.-H.; Wen, C.-C.; Yang, S.-Y.; Lin, Z.-S.; Gao, X. Succession Characteristics of Algae Functional Groups and Water Quality Assessment in a Drinking Water Reservoir. Huan Jing Ke Xue = Huanjing Kexue 2020, 41, 2158–2165. [Google Scholar] [PubMed]
  35. Ding, J.; Wei, Z. Analysis on Water Quality Trend in Shaanxi Section of Weihe River. J. Water Resour. Water Eng. 2010, 21, 141–144. [Google Scholar]
  36. Zheng, B. Research System Design for Eutrophication Control and Management of Taihu Lake during the 12th Five-Year Plan. Res. Environ. Sci. 2014, 27, 683–687. [Google Scholar]
  37. Xu, C.; Yu, X.; Xu, Z.; Xiong, J.; Chen, X. Study on the spatiotemporal pattern and regulating factors of dissolved oxygen in the main stream of Tanjiang River. Acta Sci. Circumst. 2024, 44, 222–230. [Google Scholar]
  38. Li, H.; Yang, T.; Liao, Y.; Qu, Y. Analysis of river habitat quality distribution patterns and driving forces in the Weihe River Basin (Shaanxi section). Ecol. Environ. Sci. 2024, 33, 1153–1162. [Google Scholar]
  39. Hongguang, C.; Yong, Y.U.E.; Shengtian, Y.; Fanghua, H.A.O.; Zhifeng, Y. An estimation and evaluation of non-point source (NPS) pollution in the Yellow River Basin. Acta Sci. Circumst. 2006, 26, 384–391. [Google Scholar]
  40. Yi, F.; Chen, M.; He, X.; Yu, C.; An, R. Effect of spatial scale on water quality in watershed land use analysis. China Environ. Sci. 2023, 43, 4280–4291. [Google Scholar]
  41. Chen, T.; Cui, D.; Yuan, Y.; Liu, J.; Huang, M.; Li, Y. Changes in water quality and land use structure in the green-belt area around Shanghai. J. East China Norm. Univ. Nat. Sci. 2021, 2021, 81–89. [Google Scholar]
  42. Gong, Y.X.; Ji, X.; Hong, X.C.; Cheng, S.S. Correlation Analysis of Landscape Structure and Water Quality in Suzhou National Wetland Park, China. Water 2021, 13, 2075. [Google Scholar] [CrossRef]
  43. Mi, Q.; Bian, Y.; Zhen, L.; Pang, D.; Wang, L.; Cheng, W.; Li, J. Impacts of Land Use Structure and Landscape Pattern on Water Quality in Lihe River. J. Hydroecol. 2024, 45, 78–85. [Google Scholar]
  44. Zhang, X.-d.; Han, X.; Sun, C.-S.; Zhang, J.-W.; Hu, J.-X.; Huang, Z.-Y.; Pan, B.-Z. Effects of Landscape Pattern on Water Quality at Different Spatial and Temporal Scales in Wuding River Basin and Yanhe River Basin. Huan Jing Ke Xue = Huanjing Kexue 2024, 45, 4540–4552. [Google Scholar] [PubMed]
  45. Guo, Y.; Li, S.; Liu, R.; Zhang, J. Relationship between landscape pattern and water quality of the multi-scale effects in the Yellow River Basin. J. Lake Sci. 2021, 33, 737–748. [Google Scholar]
  46. Wang, Y.; Wu, R.; Rong, N.; Wang, X.; Zhang, Y. Response relationship between water quality in the lower reaches of Xijiang River Basin and land use at different spatial scales. Water Resour. Prot. 2021, 37, 97–104. [Google Scholar]
Figure 1. Monitoring section of the Shaanxi section of the Jing River Basin.
Water 16 03326 g001
Figure 2. Annual average change of Water Quality Index and M–K trend test.
Water 16 03326 g002
Figure 3. Annual average value of Water Quality Index concentration in each section.
Water 16 03326 g003
Figure 4. Interannual variation of Water Quality Index concentration in flood season and non-flood season.
Water 16 03326 g004
Figure 5. WQI evaluation results.
Water 16 03326 g005
Figure 6. Spatial distribution of WQI: (a) Annual average WQI distribution; (bh) WQI distribution, 2016–2022.
Water 16 03326 g006
Figure 7. Spearman correlation analysis between Water Quality Index and WQI value. *: Significance p-value.
Water 16 03326 g007
Figure 8. Sorting diagram of redundancy analysis results in the Jing River Basin.
Water 16 03326 g008
Table 1. Statistical data of Water Quality Index and WQI value from 2016 to 2022.
IndexAverage ValueMedianStandard DeviationMinimum ValueMaximum Value
ρ(CODMn)/mg·L−12.912.701.230.5013.00
ρ(DO)/mg·L−19.279.241.932.3014.37
ρ(COD)/mg·L−115.2414.007.892.5080.00
ρ(BOD5)/mg·L−12.612.301.590.2515.70
ρ(NH3-N)/mg·L−10.550.330.640.013.96
ρ(TP)/mg·L−10.080.060.060.010.45
Concentration of petroleum/mg·L−10.020.010.030.000.31
WQI73.7075.266.6736.8485.79
Table 2. Correlation between water quality parameters and WQI value.
Water Quality IndexesCODMnDOCODBOD5NH3-NTPPetroleum
WQI−0.6970.258−0.700−0.628−0.653−0.540−0.459
Table 3. Statistical analysis of WQI values from 2016 to 2022.
Item2016201720182019202020212022
Average value68.0168.4473.9675.6176.5578.8076.18
Median68.9568.1674.2175.7976.8478.9576.32
Standard deviation8.346.853.993.313.632.694.82
Minimum value36.8447.8961.5867.3760.5371.0562.11
Maximum value80.5384.2182.1181.5882.6385.7984.21
Table 4. Variance interpretation rate and explanatory variables of each scale sorting axis based on redundancy analysis.
Buffering Radius
/m
ParameterFirst AxisSecondThird AxesFourth AxesInterpretation Ratio
/%
Explanatory Variable (Contribution Rate)
500E0.92290.02960.00270.044882.1Construction land (67.7) and Cultivated land (18.7)
EC96.6299.71100
PC0.98150.98440.57630
1000E0.7050.00550.28260.006842.1Waters (51.3) and Grassland (19.8)
EC99.22100
PC0.86240.745400
2000E0.91610.02880.00920.045981.6Bare soil (59) and Cultivated land (30.5)
EC96.0299.04100
PC0.97780.96690.95680
2500E0.95740.03080.00590.005997.6Bare soil (54.3) and Cultivated land (32.6)
EC96.3199.41100
PC0.99950.99890.79120
5000E0.9330.03030.00870.02888.8Bare soil (52.4) and Cultivated land (20.5)
EC95.9999.1100
PC0.98670.99120.93760
7500E0.95830.01110.00180.028788.5Waters (42.1) and Shrub area (20)
EC98.6699.81100
PC10.91210.3420
Disclaimer/Publisher’s Note: The statements, opinions and data contained in all publications are solely those of the individual author(s) and contributor(s) and not of MDPI and/or the editor(s). MDPI and/or the editor(s) disclaim responsibility for any injury to people or property resulting from any ideas, methods, instructions or products referred to in the content.

