Abstract
Bioplastics are designed to degrade at the end of their lifecycle, but effective management of their end-of-life phase and integration into existing organic waste management systems remain significant challenges. Some bioplastics decompose under anaerobic conditions, with the anaerobic digestion (AD) process being a potential solution for their disposal. AD is a promising technology for valorising organic wastes, enabling biomethane production, reducing carbon footprints, and promoting product circularity. This study focuses on evaluating the continuous co-digestion of bioplastics with mixed sludge from an urban wastewater treatment plant (WWTP). Polyhydroxybutyrate (PHB) was the selected bioplastic, as various studies have reported its high and rapid degradation under anaerobic mesophilic conditions. PHB’s biodegradability under typical WWTP anaerobic digestion conditions (35 °C, 20-day retention time) was assessed in batch tests and the results indicate that PHB degradation ranged from 68 to 75%, depending on particle size. To further explore the potential of AD for PHB valorisation, the feasibility of anaerobic co-digestion of PHB with WWTP sludge was tested on a continuous laboratory scale using two digesters: a conventional digester (CSTR) and an anaerobic membrane bioreactor (AnMBR). The results indicated complete degradation of PHB, which led to higher biomethanisation percentages in both digesters, rising from 58% to 70% in the AnMBR and from 44% to 72% in the CSTR. The notable increase observed in the CSTR was attributed to changes in microbial populations that improved sludge biodegradability.
1. Introduction
Plastics have become deeply ingrained in our daily lives due to their affordability. Global plastic production has been increasing rapidly, doubling every decade. In 2022, global plastic production reached 400.3 million tons, with projections suggesting it will double by 2040 [1]. However, this heavy reliance on fossil-based plastics, coupled with their insufficient recycling and inadequate end-of-life management, carries significant drawbacks, resulting in a clear global risk. Currently, only a small fraction of plastics are recycled (9%) or incinerated (12%), while the majority (79%) end up in landfills, polluting natural ecosystems and causing severe environmental problems [2]. To address this issue, the plastics sector has experienced a growing shift towards bioplastics, which are from renewable resources and offer a sustainable replacement for fossil-fuel-based plastics. However, biodegradable polymers are not designed to generally replace conventional plastics as they were specially developed to replace only certain products for technical and life-cycle reasons. Bioplastics have many diverse applications, ranging from food packaging and agricultural products to medical devices, textiles, and automotive components. Thanks to their biodegradability and reduced environmental impact, they offer a sustainable alternative to conventional plastics and help to reduce waste in key sectors [3,4].
Bioplastics are a range of commercial materials that are defined as “bio-based” when derived from natural sources and they can be considered “biodegradable” when microorganisms can convert their structural components (polymers and organic additives) mainly into carbon dioxide, water, new microbial biomass, mineral salts, and methane in the absence of oxygen. Given their reduced persistence in ecosystems, bioplastics have emerged as a potential alternative for mitigating plastic pollution and its harmful environmental effects, thereby fostering a transition towards a more sustainable future. In 2023, global biodegradable bioplastics production reached 2.18 million tonnes and is projected to surge to 7.43 million tonnes by 2028 [5]. Although these “new materials” show promising growth due to their environmentally-friendly reputation, several aspects still need to be addressed, such as end-of-life treatment systems and global integration with organic waste management systems, especially with selective biowaste collection [6].
Biodegradable bioplastics can be valorised through biological processes such as composting or anaerobic digestion (AD) at their end-of-life phase [7]. Composting of biodegradable bioplastics has been well-documented, and this has included analysis, assays, specification standards, as well as labels certifying the biodegradability of a product under different composting conditions [8]. However, compared to composting, only a few studies have been carried out to evaluate the application of AD for the treatment of bioplastics [7,9,10,11]. To date, research has mostly been conducted in batch tests, with little data being compiled on continuous systems at a laboratory or pilot scale [12,13,14]. For example, Cazaudehore et al. [12] reported that PHB was fully converted into methane (103%) in anaerobic co-digestion, whereas PLA was only partially converted (48%) and accumulated in the reactor. In contrast, Cucina et al. [13] found that PLA-based items degraded without chemical modifications, with the starch component of starch-based bags degrading quickly, while the polyester component required more time. Gadaleta et al. [14] also investigated the degradation of cellulose-based bioplastics, achieving a degradation range of 37–50% during anaerobic digestion.
However, AD is a widely employed industrial process for managing various types of waste such as residues from the agri-food industry, the organic fraction of municipal solid waste, or sludge from wastewater treatment plants (WWTPs), among others. This process offers significant advantages, such as energy recovery in the form of biogas, which can be used on-site for heat and electricity generation or injected into the grid post-upgrading. AD also produces a nutrient-rich digestate as a by-product that could be suitable for use as an organic soil amendment. AD, thus, plays a crucial role in circular waste management, especially in the processing of organic waste [15]. Incorporating highly biodegradable bioplastics into this context can yield substantial methane production [16], enriching the AD process by raising the substrate’s C/N ratio [6].
The various types of bioplastics on the market include polyhydroxy butyrate (PHB) and polylactic acid (PLA), which are widely studied polymers intended to partially substitute petroleum-based plastics [17,18,19]. In 2023, they accounted for 4.8% and 31.0% of global bioplastic production, respectively [5]. The PLA biodegradation rate is quite low under mesophilic AD (35–40 °C), to the point that very long digestion periods (280 days) are required to reach a biodegradation level between 29% and 66% in batch AD experiments [20]. On the other hand, PHB shows good potential to be rapidly converted into methane under mesophilic conditions [8,21]. The high biodegradability of PHB is supported by various studies and biodegradability analyses [21,22,23,24], so that a viable option for its end-of-life management scenario is to use it as a co-substrate in anaerobic digesters, which could enhance methane production for renewable energy, as suggested in a recent study [21].
This study evaluated the anaerobic co-digestion of PHB with waste sludge from a municipal WWTP. AD of waste sludge is widely practised in WWTPs and many operational digesters are deliberately oversized, allowing for the co-digestion of additional substrates with the sludge, resulting in energy recovery as biogas and nutrient-rich digestate for soil enhancement. Co-digestion will, thus, reduce WWTP’s carbon footprint and enable the circularity of bioplastic products. This work aimed to evaluate the anaerobic co-digestion of mixed sludge and PHB under mesophilic conditions in two continuous lab-scale reactors: one a continuous stirred-tank reactor (CSTR) and the other a membrane bioreactor (AnMBR). Implementing an ultrafiltration (UF) membrane in the anaerobic digester allows the decoupling of sludge and hydraulic retention times (SRT and HRT), favouring an increase in methane production and hydrolytic activity in the microbial community. For this, we worked with different PHB organic loading rates and evaluated their effects on anaerobic digestion.
2. Materials and Methods
2.1. Substrates
2.1.1. Bioplastic
PHB was the bioplastic used and it is important to highlight that this PHB was polyhydroxybutyrate-co-3-hydroxyvalerate (PHBV), a derivative of PHB (see properties in Table 1). It has been argued that PHBV with a 3% 3-hydroxyvalerate content has similar crystallinity to PHB and, thus, may have similar biodegradation behaviour [19].

Table 1.
PHBV (Y1000P) characterisation: data provided by helianPolymers.
Before the lab-scale experiments, the bioplastics were micronized into 400–250 µm pieces by a cryogenic grinder and a mesh of the required pore size.
2.1.2. Waste Sludge
Mixed sludge (a mixture of primary and secondary sludge) from a conventional urban WWTP was used as co-substrate together with PHB, and its characteristics are shown in Table 2. This sludge was used as feed for both digesters in the different operational periods (without PHB and with PHB). The VFA and pH values (Table 2) indicate that the fermentation process had started before the addition of the anaerobic digesters.

Table 2.
Mixed sludge characterisation.
2.2. Laboratory-Scale Experiments
2.2.1. Biochemical Methane Potential Tests
The biochemical methane potential (BMP) test assesses the suitability of the substrate for further use in AD. The BMP parameter shows the maximum amount of biogas that can be recovered from a substrate, in this case, expressed per unit COD.
BMP tests were carried out using the Automatic Methane Potential Test System (model: AMPTS II), supplied by BPC Instruments AB (Mobilvägen, Sweden), which was also used to assess the PHB substrate’s potential for biomethane production. Its theoretical methane production (BMPth) was calculated by the stoichiometric formula (C4H6O2)n.
PHB’s methane potential was tested in various particle sizes to determine whether the size of the bioplastic affects the final percentage of biodegradability achieved. For this, PHB was micronized to particle sizes of 500 µm and 45 µm.
The BMPs of all samples were determined by a method reported by the manufacturer. Briefly, 400 mL of inoculum was added in a 500 mL bottle (substrate to inoculum ratio 2:1 on COD basis) and then the bottle was sealed with hermetic caps, flushed with gaseous N2, and incubated at 35 °C. Control blanks were prepared using 400 mL of inoculum. Sludge from an anaerobic digester operated under mesophilic conditions was used as inoculum. The biomethane production of the blank control was subtracted from the biomethane production of all the batches to determine the BMPs. BMP tests were carried out for more than 20 days because this is the typical value of sludge retention time in anaerobic digesters of WWTPs.
2.2.2. Lab-Scale Anaerobic Digestion Reactors
This study evaluated the effect of co-digesting PHB with mixed sludge in two different configurations of anaerobic reactors (CSTR and AnMBR).
Figure 1 illustrates the setup of the laboratory-scale anaerobic digesters. Both reactors comprised a 14-litre cylindrical methacrylate tank, with 8 litres allocated for sludge and the remaining volume for biogas. To maintain mesophilic conditions, a Lauda Alpha RA8 thermostatic bath circulated hot water through pipes surrounding the digesters, insulated to prevent heat loss. The biogas produced in each reactor was recirculated by an EAD HX10 blower for stirring, sludge homogenization, and enhancing the stripping of the dissolved biogas. Daily biogas production was measured using an MGC 10 milligas counter (Ritter), standardized to standard conditions (1 atm, 0 °C). The hermetic seal systems prevented gas leakage, with continuous monitoring of headspace pressure using an Endress & Hauser (Reinach, Switzerland) pressure sensor and electrodes for pH/T and redox potential measurement (Consort). The difference between CSTR and AnMBR is that the latter included an external hollow-fibre UF membrane module (PURON Koch membrane systems, 0.03 µm pore size and 0.42 m2 surface area). This membrane, which retains microorganisms while allowing effluent extraction, operated in three stages: filtration, backwashing, and relaxation.
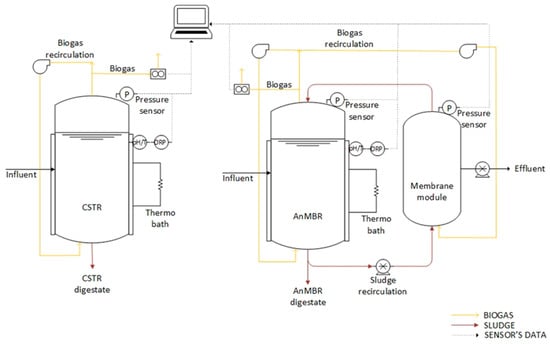
Figure 1.
Arrangement of the anaerobic digestion systems, showcasing the CSTR on the left and the AnMBR on the right.
2.2.3. Operating Conditions
Both reactors were operated for a total of 433 days. The HRT, SRT, and temperature of both digesters were maintained during the whole experiment (see Table 3). The operation of the digesters was divided into three periods according to the amount of PHB added to the anaerobic digesters. In the first one, no PHB was added and the lab-scale digesters were fed with mixed sludge from an urban WWTP. This first period lasted 126 days. In period 2, PHB was added to the mixed sludge (influent PHB concentration was 2 g/L). This second period lasted 161 days. Finally, PHB concentration was increased to 10 g/L in period 3. This third period lasted 148 days. The organic load rate (OLR) (both total and that of PHB) for each operating period is given in Table 4.

Table 3.
Operational conditions.

Table 4.
Influent OLR (g DQO·L−1·d−1).
2.3. Analytical Methods
2.3.1. Assessing Anaerobic Digestion Performance
To evaluate the efficiency of the biological process, weekly analyses were conducted on samples obtained from both reactors, the AnMBR effluent and the feed sludge. Each measurement was performed in duplicate following the Standard Methods (APHA, Washington, DC, USA, [29]). Parameters analysed included total and soluble chemical oxygen demand (T-COD and S-COD, respectively), total solids (TS), volatile solids (VS), total suspended solids (TSS), and volatile suspended solids (VSS). Volatile fatty acids (VFA) and alkalinity (ALK) were also analysed according to the method proposed by Moosbrugger et al. [30]. The composition of the biogas produced in each digester was analysed three times weekly and methane content was determined by a gas chromatograph equipped with a flame ionisation detector (CG-FID, Agilent Technologies, Santa Clara, CA, USA). The methane production results were recorded under standard temperature and pressure conditions (1 atm and 0 °C).
Based on the experimental data, the performance of the anaerobic digesters was evaluated by conducting COD balances and determining the percentage of biomethanisation to obtain information on the COD removal capacity and methane yield. The latter refers to the amount of methane produced per unit of substrate fed into an anaerobic digestion system.
At steady state, the influent COD (CODinf) should equal the sum of the following terms:
Here, CODmet represents the COD converted to methane (including the dissolved methane), CODw represents wasted COD (including undegraded influent COD and biomass produced), and CODeff denotes COD in the permeate. The COD consumed by sulphate-reducing bacteria in the study was negligible due to the high influent COD/SO4 ratio and, thus, was not factored into the equation.
Percentage biomethanisation and methane yield were calculated using the following equations:
where CH4~V represents the volume of methane produced (biogas methane plus dissolved methane in the effluent) in litres of methane.
2.3.2. PHB Determination
Using this protocol, PHB concentration is measured alongside that of other microplastics and another microliter. The term “microliter” refers to the collection of microparticles retained in the sludge and water, of which more than 80% are microplastics [31,32].
To determine the PHB concentration in the influent and the wasted sludge, it is necessary to follow these steps:
- Organic matter oxidation: Use hydrogen peroxide (Scharlau, 30%), catalysed by the Fenton reagent, in oven-dried sludge [33].
- Separation of PHB by density: Add 1.80 g/mL sodium iodide (Scharlau) until saturation and then the mixture is allowed to sit for 12 h to facilitate separation.
- Filtration through grids to retain the PHB: Filter the supernatant fraction through stainless steel filters with mesh sizes of 500, 104, and 41 μm. These filters are then stored in Petri dishes for subsequent characterization.
Once extracted, the PHB is quantified using gravimetric analysis (Mettler Toledo, XP205, Columbus, OH, USA). From this quantification, the concentration of PHB in the streams of each digester is determined, except for the effluent from the AnMBR. As the membrane has a pore size of 0.3 µm, all the particles larger than this size will remain in the sludge. It is also important to note that as the method does not measure particles less than 41 µm, no particles would be detected in this stream.
Samples of the particles retained by the medium mesh (104 μm) were collected for analysis by µ-FTIR to distinguish genuine PHB particles from other microparticles (microplastics and other microliter) that can be extracted with the PHB during the experimental procedure. The mixed sludge used was from an urban WWTP and, therefore, contained retained microparticles such as microliter (inorganic and organic materials such as metals, wood, rubber, glass, and paper) and microplastics (synthetic polymer fragments).
The stainless steel filter was analysed by a µ-FTIR Perkin Elmer Spotlight 400 equipped with an MCT detector and an array of 16 micro-detectors with a 25 µm resolution, covering the range from 4000 to 700 cm−1. Spectra were collected in 15 scans and a spectral resolution of 16 cm−1. The data were analysed on siMPle software (1.0.0) developed by Alborg University (Aalborg, Denmark) and the Alfred Wegener Institute (Bremerhaven, Germany) [33,34,35]. This software uses an algorithm to compare the IR spectra of each pixel in the map against a reference database, generating a score between 0 and 1. The standard criterion for identification was a score of ≥0.75.
The percentage of PHB biodegradation is calculated from experimental data, considering the concentration of PHB in both influent and digested sludge from the lab-scale digesters.
2.3.3. Analysis of Microbial Diversity
Analysis of the bacterial population involved amplicon sequencing, targeting the 16S rRNA gene. Samples were procured from reactors during the steady state of each study period to extract nucleic material and sequence the 16S rRNA gene. These samples represent biological replicates of the microbial community in the mesophilic reactors as they coincide with a stability phase characterized by minimal fluctuations (below 10%) in COD, TS, and biogas production.
Pellets obtained from 1 mL of digested samples were stored in 2 mL cryotubes at −20 °C until nucleic acid extraction took place. DNA extraction from 0.5 g of biomass used the E.Z.N.A. DNA Extraction Kit for Soil (Omega Biotek, Norcross, GA, USA), following the manufacturer’s instructions. Extracted DNA was quantified using a Qubit 2.0 fluorometric dsDNA assay (Thermo Scientific, Waltham, MA, USA), with a negative control of sterilized, nuclease-free deionized water included. For bacteria and archaea analysis, amplicon sequencing targeting the 16S rRNA gene was conducted. Libraries were prepared using primers designed for the v3-4 hypervariable region (341F 5′-CCTACGGGNGGCWGCAG-3′ and 806R 5′-GGACTACNVGGGTWTCTAAT-3′) by Klindworth et al. [36]. Sequencing was performed on a MiSeq sequencer (Illumina, San Diego, CA, USA) at FISABIO (Valencia, Spain) in a 2 × 300 bp paired-end run.
According to the data processing, the raw sequences generated by Illumina underwent processing using the MiSeq_SOP pipeline and were analysed using open-source mothur software v.1.48 [37]. Taxonomy was assigned according to the v138.1 release of the SILVA database.
3. Results and Discussion
3.1. BMP Tests
The cumulative methane production curves are obtained from the BMP tests. The methane yield and the percentage of substrate (PHB) degradation were obtained from these curves to determine whether PHB degradation is compatible with the typical operating conditions of an anaerobic digester and whether its valorisation is feasible.
Figure 2 shows the volume of CH4 accumulated in the bottles containing PHB as substrate. The average value of the methane production from PHB degradation after 25 days of operation was 0.66 ± 0.02 NLCH4 for PHB500 and 0.60 ± 0.02 NLCH4 for PHB45. Therefore, the particle size of PHB slightly affects the volume of methane produced. In the figure, it can be seen that the cumulative methane production curves show a latency phase (lag time) during the early days of the BMP test. This time lag is characteristic of bioplastic biodegradability tests when applying an inoculum with a microbiological population not adapted to the presence of bioplastics as a substrate [23].
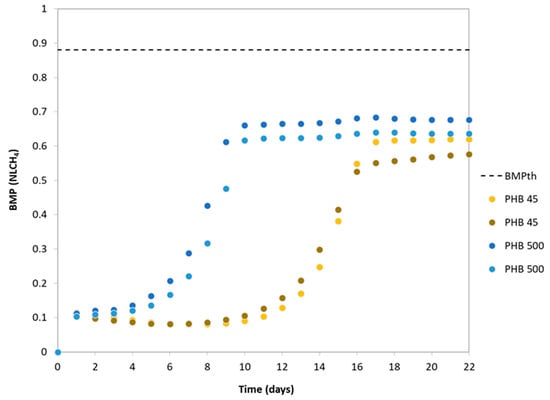
Figure 2.
Cumulative methane production curves for PHB for different particle sizes. BMPth: 0.88 NLCH4.
During the experimental period, PHB500 reached maximum methane production on day 13, while PHB45 did so on day 19. The results obtained suggest that the 500 µm PHB exhibits a shorter lag time than the 45 µm PHB (8 days vs. 14 days). The smaller PHB (45 µm) was expected to degrade faster due to the smaller particles having a higher surface area to volume ratio, which makes it easier for microorganisms to access degradable materials and accelerates biodegradation [23], whereas larger particles (500 µm) have a smaller relative surface area available to microorganisms, which slows down the degradation rate. However, the results show the opposite effect, which indicates that this difference could be linked to the additives used to synthesise PHB. Due to the micronized pellets (500 and 45 microns) being derived from an original granulate in which the additives are not uniformly distributed, the concentration of additives typically ranges from 0.001% to 50% of the weight (w/w) of the final product [38]. It is conceivable that the smaller PHB size (45 microns) possesses a higher proportion of additives per gram in contrast to the larger PHB size (500 microns), potentially affecting degradation time. This disparity in the additive-to-surface area ratio could impact the duration of the depolymerization (specific name for plastics degradation). Plastics depolymerisation is the process by which polymers (the long chains of molecules that make up plastics) are broken down into smaller fragments or monomers. This process can occur by various mechanisms, such as hydrolysis. Depolymerisation is a crucial step in plastics degradation as it facilitates their conversion into simpler usable compounds. Many studies [39,40], have highlighted how these additives affect plastics degradation time (including bioplastics), owing to the extended period required for the hydrolysis of more complex compounds and their conversion into substrates that can eventually be transformed into methane.
The percentage of PHB biodegradability was calculated from the theoretical BMP and the average value of the experimental data (Figure 2). On the 22nd day of the experiment, a significant portion of the PHB was already degraded. The PHB45 reached a degradation rate of 68%, while PHB500 achieved a degradation rate of 75%. Given these results, biodegradation in anaerobic digesters under mesophilic conditions is a good option for PHB valorisation. The data obtained indicated that in anaerobic conditions at 35 °C and 25 days of retention time, PHB can degrade by around 68–75%, depending on its particle size.
The BMP test, thus, confirmed that the PHB degradation time is compatible with typical WWTP anaerobic digestion conditions (35 °C, 20-day retention time) and that it can achieve high biodegradability rates.
The next phase of the study evaluated co-digestion of PHB with WWTP sludge in continuous anaerobic lab-scale digesters.
3.2. Anaerobic Digester Performance
AD performance was evaluated during the entire period by monitoring the methane production, COD, TSS, and VSS concentration parameters in both reactors.
The evolution time of the methane production in both digesters is shown in Figure 3, with the steady state of each operational period shaded in blue.
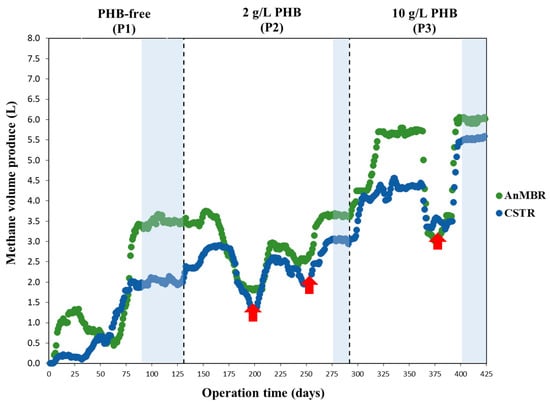
Figure 3.
Daily methane volume produced during the operation (P1: PHB-free period to P3: 10 g PHB·L−1 anaerobic co-digestion) of both AnMBR and CSTR digesters. Red arrows indicate periods of reduced CH4 production due to falling pH from VFA accumulation.
As can be seen, in the PHB-free period (P1), the steady state was achieved at day 79 in the CSTR and day 85 in the AnMBR. The latter digester took slightly longer to reach stability due to the accumulation of VFAs between days 29 and 63, which led to a reduction in methane production. Once the VFAs were consumed in the AnMBR, methane production increased until a steady state was achieved (see Figure 3). During the periods when PHB was used (P2 and P3), reaching a steady state took longer (>100 days) due to the microbial community adapting to the new substrate. This adaptation phase is particularly sensitive to disturbances, which can reduce methane production. From days 163 to 197, 230 to 249, and 363 to 367 (red arrows in Figure 3), CH4 production fell in both digesters due to a drop in pH caused by VFA accumulation. During these periods, calcium carbonate (CaCO3) was added to raise the pH and prevent system acidification. Once the VFAs were consumed, methane production in both digesters increased until a steady state was achieved.
It is important to emphasise the significant increase in methane production in both digesters as the influent’s organic load was raised in the different operational periods (periods 1 to 3 in Figure 3). As shown, the AnMBR had consistently higher methane production than the CSTR, although this disparity diminished over the PHB operational periods (P2 and P3).
Figure 4 shows the characterization of the digestates from the CSTR and AnMBR. As expected, the AnMBR had higher concentrations of TSS and T-COD than the CSTR throughout the experimental periods. Implementing a filtration system allows decoupling of the HRT from the SRT and, therefore, increases SRT in the reactor, favouring a higher solids and organic matter retention win in the system. During filtration, particles smaller than the membrane pore size (0.03 µm) permeate the effluent, while the larger particles are retained by the membrane.
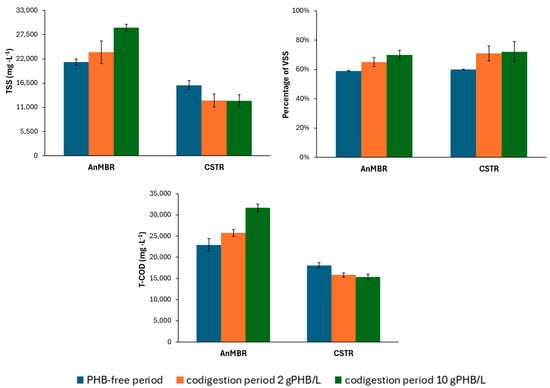
Figure 4.
Characterisation of CSTR and AnMBR digestates throughout the operational periods.
This process, thus, leads to higher concentrations of organic matter and solids in the reactor. As the organic load rose over the experimental periods, the concentration of TSS and T-COD in the AnMBR increased significantly (P1: 21,260 mg TSS·L−1 and 22,910 mg COD·L−1 vs. P3: 29,050 mg TSS·L−1 and 31,663 mg COD·L−1). However, this trend did not happen in the CSTR. In fact, there was a slight drop in TSS and COD concentration when comparing P1 to P3, with TSS and COD values dropping from 16,020 mg TSS·L−1 and 18,083 mg COD·L−1 to 12,500 mg TSS·L−1 and 15,315 mg COD·L−1, respectively. This pattern can be explained by the different behaviour of each reactor. All the biodegradable material in the AnMBR was already degraded during the first period, so that the higher organic load produced greater biomass growth, which, in turn, led to higher TSS and T-COD concentrations. In contrast, although there was additional biomass growth in the CSTR, TSS and T-COD declined due to better mixed sludge biodegradability.
As can be seen in Figure 4, the percentage of VSS in both digesters rose with the influent load. The percentage of VSS in the influent sludge was also higher due to adding PHB. In the first operational period (PHB-free), the AnMBR had a VSS percentage of 59%, while the CSTR recorded 60%. In the final period, (influent PHB concentration 10 gPHB·L−1), the AnMBR reached 70% and the CSTR 72%. This indicates that the PHB co-digestion raised the bacterial population in both digesters and promoted the development of microorganisms capable of degrading this substrate, a hypothesis supported by the microbial population results (see Section 3.5).
In the PHB-free period, VSS removal in the CSTR was 33%, while in the AnMBR it was 57%. In contrast, during the PHB co-digestion period, VSS removal increased to 78% in the CSTR and to 74% in the AnMBR. These results align with previous findings, e.g., Cazaudehore et al. [12] reported 80% VSS removal when co-digesting PHB with biowaste.
Table 5 gives the average steady-state values of the daily methane flow rate and biogas methane content. The AnMBR was more efficient than the CSTR in terms of organic matter removal in P1 and P2. In P1, methane production stabilised at approximately 2.01 L·d−1 in the CSTR and 3.52 L·d−1 in the AnMBR (Table 5). During co-digestion with 2 g·L−1 of PHB (P2), steady-state methane production in the AnMBR showed no significant changes (3.57 L·d−1), while CSTR methane production rose to 2.96 L·d−1.
In P3, methane production increased similarly in both digesters (CSTR: 5.67 L·d−1 vs. AnMBR: 5.99 L·d−1), indicating that raising the PHB feed content (10 g·L−1) enhanced methane production in both digesters, with the CSTR showing the greatest improvement. Following the addition of 10 g·L−1 (P3), the CSTR achieved an increase in methane production of 3.66 L·d−1, while the AnMBR production rose by 2.47 L·d−1.

Table 5.
Methane production of the digesters during the operational periods (Mean ± Standard Deviation).
Table 5.
Methane production of the digesters during the operational periods (Mean ± Standard Deviation).
| % CH4 in Biogas | VCH4 (L·d−1) | ||
|---|---|---|---|
| CSTR | P1 | 65 ± 1 | 2.01 ± 0.06 |
| P2 | 65 ± 0.2 | 2.96 ± 0.11 | |
| P3 | 60 ± 0.1 | 5.67± 0.05 | |
| AnMBR | P1 | 66 ± 1 | 3.52 ± 0.09 |
| P2 | 67 ± 0.2 | 3.57 ± 0.16 | |
| P3 | 65 ± 0.1 | 5.99 ± 0.14 |
We, therefore, determined that PHB biodegradability in both lab-scale digesters was close to 100%. Although the highest biodegradability achieved in batch tests was 75%, it should be noted that these tests were conducted with an inoculum that had not been adapted to the substrate (PHB). In continuous operation, the microbial communities in the digesters adapted to the new substrate, which enabled the digesters to reach a significantly higher PHB biodegradability rate (100%). This was evident not only from the higher methane production in both digesters (see Table 5) but also from the measurements taken to determine the PHB concentrations in both the digesters’ influent and digestate streams (Section 3.3).
According to previous studies, Cazaudehore et al. [12] estimated that PHB was completely converted to methane while Benn and Zitomer [41] and Venkiteshwaran et al. [21] found a high level of PHB conversion to methane of between 79% and 98% in co-digestion with synthetic municipal primary sludge under mesophilic conditions. On the other hand, García-Depraect et al. [23] found that the average PHB and PHBV carbon recovery ranged from 97.2% to 100.7%, suggesting that the PHB and PHBV formulations used were completely biodegraded under anaerobic conditions.
3.3. PHB Removal Efficiency
The presence of PHB in samples of both mixed sludge feed and digested sludge in both the CSTR and the AnMBR was analysed periodically. As stated previously stated, the values collected refer to the microparticles (microlitter) retained in the filters, which were not all PHB or other microplastics, but also included non-plastic particles such as glass, natural fibres, and recalcitrant organic matter. Most of the microlitter (ML) found in the sewage sludge consisted of microplastics [31].
Table 6 shows the concentration of ML (including PHB) found both in the mixed sludge (feed) and digesters in the different study periods. It is important to note that the PHB used to dope the mixed sludge was detected after the measurements, thus, validating the method used. The ML concentration in the influent increased from 348.2 ± 124.4 mg·L−1 in the first period to 2609.2 ± 324.4 mg·L−1 in the second period, and then to 10,896.0 ± 993.7 mg·L−1 in the third period, detecting the PHB added to the influent in the last two periods. The ML concentration in relation to the added PHB in the influent is, thus, negligible in the second and third periods, indicating that almost all the ML detected was PHB.

Table 6.
ML concentration in the influent, CSTR and AnMBR digestates, along with the corresponding ML removal percentage (mean ± standard deviation value) during the operational periods studied.
The results show a higher ML concentration in the mixed sludge feed than in the sludge after digestion in both the CSTR and AnMBR in all the periods studied.
Focusing on the first period of operation, as shown in Table 6, when the influent was not doped with PHB, the CSTR presented a higher ML concentration than the AnMBR (131.2 ± 23.7 mg·L−1 vs. 82.6 ± 25.4 mg·L−1), so that the AnMBR showed greater ML removal efficiency than the CSTR (88.1% vs. 62.4%). However, when the influent was doped with 2 g PHB·L−1, the ML removal efficiency increased to approximately 98% in both digesters. In this period, the ML concentration in the AnMBR and CSTR digestates was 55.0 ± 7.3 mg·L−1 and 58.5 ± 7.4 mg·L−1, respectively, lower values than during the first operational period. The ML concentration decreased by 33.7% in the AnMBR and by 55.3% in the CSTR, despite the increase in the influent ML concentration due to the added PHB (2609.2 ± 324.4 mg·L−1 vs. 348.2 ± 124.4 mg·L−1). This suggests that anaerobic PHB co-digestion at 2g·L−1 in the influent improves the degradation of a fraction of the ML present in the feed sludge, which was not degraded in the initial period when only mixed sludge was used. As can be seen in Table 6, the PHB was completely degraded.
In the third operational period, the influent PHB concentration was increased to 10 g·L−1 and the ML concentration rose to 530.0 ± 76.4 mg·L−1 in the AnMBR and 74.7 ± 9.4 mg·L−1 in the CSTR. This increase, which was much more significant in the AnMBR, indicates ML accumulation (specifically PHB) in the digesters. Despite this, the ML removal efficiency reached in the AnMBR was 97.6% and in the CSTR 99.3%, showing that PHB is almost completely degraded (close to 100%) in the AD process at a concentration of 10 g·L−1 and that both configurations effectively degrade PHB.
The most abundant ML particle size range in the mixed sludge was 500–104 µm and the PHB particles added in this sludge were primarily in the 400–250 µm size range (see Section 2.1.1). The highest ML concentration in the influent, thus, consisted of particles larger than 104 µm and smaller than 500 µm, as can be seen in Table 6. It is important to note that in the third period the concentration of particles larger than 500 µm also increased significantly, which may be attributed to the formation of clusters or aggregates of PHB particles. PHB is a highly viscous bioplastic and tends to form clusters of smaller particles.
The presence of PHB was determined by FTIR. Figure 5 gives the relative abundance of the different plastic types detected in the influent CSTR and AnMBR digestates.
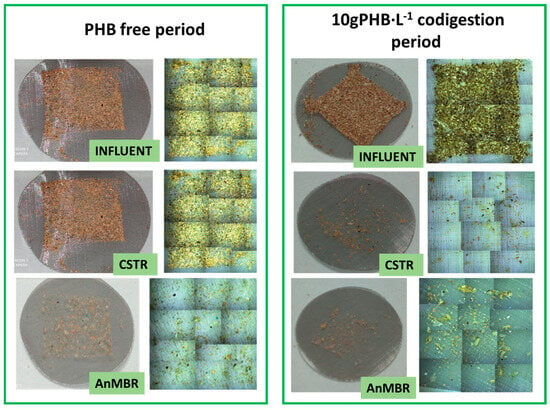
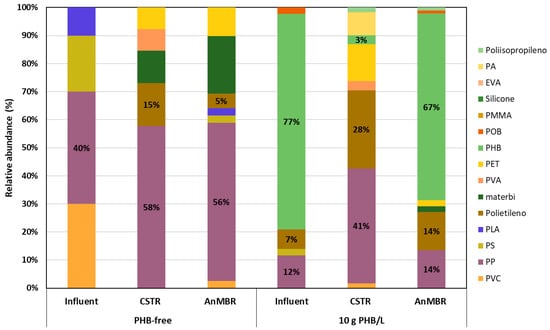
Figure 5.
Images of the 104-micron filter of each sample and the relative abundance of different types of polymers detected by µ-FTIR.
As can be seen in Figure 5, PHB was not detected in any of the samples studied in the first operational period. In this period, the most important plastics were polypropylene (PP) (40%) and polyvinyl chloride (PVC) (30%) in the feed sludge, while PP was the most abundant in the digested samples, reaching 58% in the CSTR and 56% in the AnMBR.
During periods of PHB-doped influent, this polymer accounted for approximately 76% of the total plastics detected in this stream (Figure 5), confirming that most of the plastics present were derived from the added PHB.
In the second operational period, PP was the most abundant plastic in the digested samples, with a relative abundance of 73% in the CSTR and 60% in the AnMBR, while PHB was not detected. However, in the third operational period, PHB accounted for 67% and 3% of the total plastics in the AnMBR and CSTR digestates, respectively. PHB was the most abundant plastic in the AnMBR, while PP was the most abundant in the CSTR, with a relative abundance of 73%. Comparing both periods, it appears that not all of the PHB in the AnMBR was degraded as effectively as with 2 g PHB·L−1.
3.4. COD Mass Balance
Figure 6 shows the COD balance of both digesters in the PHB-free period (P1) and co-digestion period at 10 g·L−1 of PHB (P3). In the latter period, the added PHB accounts for 31% of the total influent organic load.
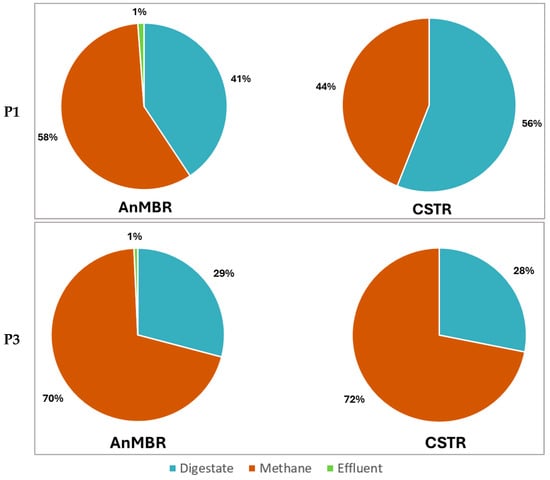
Figure 6.
COD balance of both digesters in the PHB-free period (P1) and co-digestion period 10 g·L−1 PHB (P3). In this latter period, PHB formed 31% of the total COD influent.
As can be seen in Figure 6, more methane was evacuated from the AnMBR in the PHB-free period (P1) than from the CSTR (P1: 58% vs. 44%). However, in the co-digestion period (P3), similar biomethanization occurred in both digesters (70% vs. 72%).
The data obtained show that including the membrane in the system provides greater organic matter removal efficiency (P1). With the addition of PHB to the mixed sludge, methane production in the AnMBR increased from 58% (P1) to 70% (P3), while the CSTR also showed an improvement, with methane production rising from 44% (P1) to 72% (P3). This increased biomethanization significantly reduced the percentage of organic matter withdrawn with the wasted sludge, and this was below 31% in both reactors in the last period.
The biomethanisation in the CSTR increased after the addition of PHB. The results indicate that adding PHB could favour the hydrolysis and subsequent degradation of different organic compounds present in the mixed sludge. Considering that the PHB was completely converted into methane (see Table 6), the percentage of mixed sludge biomethanisation in the PHB-free (P1) and co-digestion periods (P3) was calculated (see Figure 7).
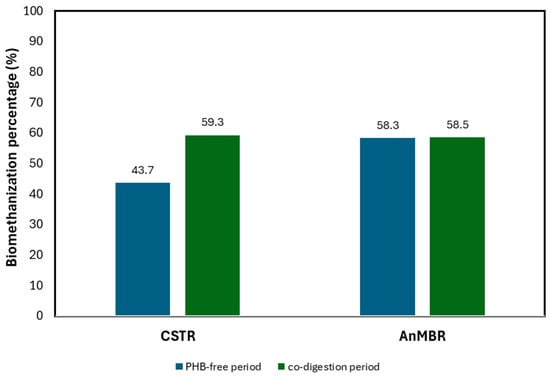
Figure 7.
Effect of PHB on the biomethanisation of mixed sludge.
As shown in Figure 7, the biomethanisation percentage of mixed sludge in the CSTR increased by 15.6% during the co-digestion period compared to the PHB-free period, reaching 59.3%. This value is closely aligned with the biomethanisation rates achieved in the AnMBR, which were 59.3% in the PHB-free period and 58.5% in the co-digestion period.
It can be seen that PHB enhanced the biodegradability of mixed sludge significantly in the CSTR, while the AnMBR showed no significant changes. This could be because 40 days (SRT of the AnMBR) were enough to degrade all the readily biodegradable organic matter, meaning that adding PHB to the AnMBR does not improve mixed sludge degradation. On the other hand, in the CSTR operated at 20 days of TRC, not all the biodegradable organic matter was degraded, while the added PHB enhanced degradation.
3.5. Effect of PHB Co-Digestion on Microbial Population
Regarding the archaeal domain, Figure 8 gives the relative abundance of the genera developed in the digesters across all the periods studied:
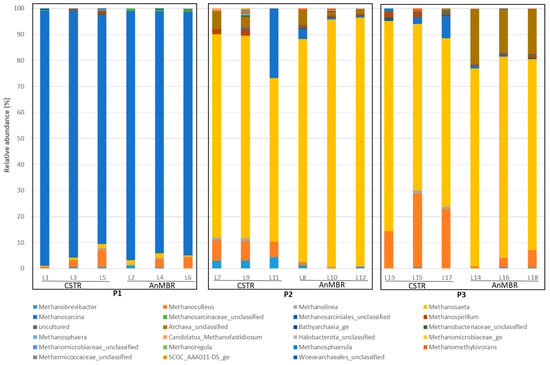
Figure 8.
Percentage of archaeal communities in terms of genus.
During the first operating period (P1), the most predominant archaea genus in both digesters was Methanosarcina, with a relative abundance of approximately 94% (Figure 8). However, after the valorisation of PHB alongside sewage sludge (P2 and P3 in Figure 8), the dominance shifted from the Methanosarcina genus to Methanosaeta in both digesters.
In the second period (P2), Methanosaeta had a relative abundance of 79% in the CSTR and 92% in the AnMBR, in line with levels reported in previous studies [21,24,42]. These two genera have significantly different metabolisms and substrate preferences. Methanosarcina is more versatile and is able to use a wide range of substrates, including methyl compounds, acetate, and carbon dioxide/hydrogen. In contrast, Methanosaeta specialises in using acetate as its main substrate. In the presence of acetate, Methanosaeta holds a competitive advantage over Methanosarcina due to its high affinity for this substrate [21]. During PHB valorisation, the acetate generated by PHB degradation probably degrades faster than that generated by Methanosaeta, thereby promoting its growth. In contrast, Methanosarcina, which may rely on other substrates such as methyl compounds, is at a disadvantage.
In the third period (P3), the relative abundance of the Methanosaeta genus fell to 64% in the CSTR and 76% in the AnMBR due to the increase in other archaeal genera. As shown in Figure 9, the CSTR had a significant increase in the relative abundance of the Methanoculleus genus (hydrogenotrophic bacteria) compared to the second period (22%), whereas in the AnMBR this genus was not as favoured, showed a maximum increase of 7%. Other archaea (likely related to methanogenesis) showed a notable increase in their relative abundance in the AnMBR, reaching 17%. Although these new genera were favoured by the increased concentrations of PHB, the predominance of acetoclastic methanogens (Methanosaeta) suggests that methane production was mainly produced by the acetoclastic pathway and that other methanogens played a secondary role.
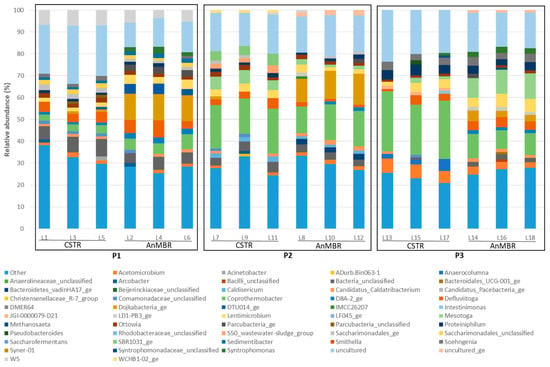
Figure 9.
Relative abundance of genera in the bacterial communities. Those with an abundance below 1% are represented as “Others”.
The increase in PHB in the influent (P3) enhanced the availability of acetate, which favours the growth of Methanoculleus in the CSTR. Methanoculleus was identified as the hydrogenotrophic partner of mesophilic acetate-oxidising bacteria, forming an important syntrophic relationship in ammonia-rich biogas processes [43,44].
Figure 9 shows the relative abundance of the bacterial community in terms of genus throughout the study periods:
As shown in Figure 9, the diversity and relative abundance of the bacterial population genera changed in response to PHB co-digestion in both digesters.
In the initial operating period (P1), the CSTR and AnMBR exhibited Simpson index values of genera to 0.94 ± 0.01 and 0.95 ± 0.01, respectively. However, in the final period (P3), the CSTR experienced a decrease in the Simpson index value to 0.89 ± 0.01, while that of the AnMBR was 0.95 ± 0.01. A drop in the Simpson index from 0.94 to 0.89 in the CSTR reflects an increase in community diversity, suggesting that the community became more balanced, with less dominance by any single species and a more even distribution of the individuals among the various species.
Table 7 shows the bacterial genera with a considerably increased relative abundance due to the effect of PHB co-digestion.
Acetomicrobium and Coprothermobacter (acetogenic genera) markedly increased their relative abundance after the addition of PHB, which can probably be attributed to their strong affinity for sugars and VFAs, compounds released by PHB degradation. The abundance of Coprothermobacter rose in the CSTR from 3.3% with free PHB to 25.7% with 10 g PHB·L−1, while in the AnMBR it rose from 5.6% to 11.2% under the same conditions. The abundance of Acetomicrobiums rose from 1.8% with free PHB to 6.0% with 10 g PHB·L−1 in the CSTR, and from 1.4% to 3.3% in the AnMBR (see Figure 9). The significant increase in these genera in the CSTR confirms the rise in methane production in the third period (P3) (Section 3.2). The higher relative abundance of Acetomicrobium and Coprothermobacter enhanced the availability of acetate and other intermediates such as H₂ and CO₂, which can be used by methanogenic archaea (e.g., Methanosaeta and Methanoculleus) for methane synthesis. This supports the hypothesis that the increased methane production is associated with these microbial shifts.
Another two bacterial genera, Mesotoga and Proteiniphilum, increased after the addition of PHB. Proteiniphilum and Mesotoga act as acetate oxidisers in the microbial community, while Methanoculleus serves as the hydrogenotrophic partner for these bacteria. This process produces H₂, which Methanoculleus uses for methanogenesis [43,44,45]. In the CSTR, Proteiniphilum was more abundant, whereas in the AnMBR, Mesotoga predominated. The symbiotic relationship in the CSTR between Methanoculleus and Proteiniphilum indicates that increased methane production is due to a combination of two methanogenic pathways: acetoclastic methanogenesis facilitated by Methanosaeta, as the main route and, in second place, hydrogenotrophic methanogenesis driven by Methanoculleus and Proteiniphilum. However, the interaction between Methanoculleus and Mesotoga in the AnMBR is less effective due to the lower abundance of Methanoculleus.

Table 7.
Bacterial genera that increased after the PHB co-digestion.
Table 7.
Bacterial genera that increased after the PHB co-digestion.
| Genus | Phylum | Level Increase AnMBR | Level Increase CSTR | Metabolic Pathway | Ref |
|---|---|---|---|---|---|
| Acetomicrobium | Synergistetes | 133% | 241% | hydrolytic ferment glucose to acetate, H2 and CO2 | [46] |
| Coprothermobacter | Coprothermobacteraeota | 98% | 687% | strong protease activity to degrade proteins and peptides, fermentative and VFA degrading bacteria | [47] |
| Lentimicrobium | Bacteroidetes | 44% | 66% | hydrolytic acid-producing | [48] |
| Mesotoga | Thermotogae | 10% | 2% | acetate oxidizers | [49] |
| Proteiniphilum | Bacteroidetes | 143% | 275% | acetate oxidizers | [50] |
| Soehngenia | Firmicutes | 94% | 83% | hydrolytic | [51] |
From the results obtained, it can be confirmed that the bacterial population of both digesters underwent modifications after PHB valorisation alongside urban WWTP sewage sludge. The addition of PHB as a co-substrate led to specialisation of the microbiota developed in both digesters. Successful methane production was due to the homogenous establishment of syntrophic associations between acetogens (Acetomicrobium and Coprothermobacter), acetate oxidizers (Mesotoga and Proteiniphilum) and acetoclastic methanogens (Methanosaeta), and hydrogenotrophic partner of mesophilic acetate-oxidising bacteria (Methanoculleus). Figure 10 shows the mechanisms of PHB degradation following the methanogenesis phases.

Figure 10.
PHB degradation mechanisms.
Thongbunrod and Chaiprasert [52] identified a well-defined anaerobic microbial consortium effective for high levels of rice straw degradation and methane production. This consortium comprises anaerobic bacteria, predominantly Proteiniphilum and Mesotoga, along with hydrogenotrophic and acetoclastic methanogens like Methanoculleus and Methanosaeta. The conversion of rice straw into sugars and VFA such as acetate, propionate, and butyrate subsequently lead to biogas production. Notably, the relationship between the presence of these bacterial genera and archaea in both conditions—in which both rice straw [52] and PHB (present study) serve as co-substrates—lies in the fact that PHB can be produced from rice straw through biotechnological processes that harness the compounds released from the straw (sugars and VFA), which are then converted into PHB by the bacteria.
To sum up, the microbial shifts after the addition of PHB indicate that this bioplastic enhances the relative abundance of key microorganisms, including Proteiniphilum, Mesotoga, Coprothermobacter, and Acetomicrobium, leading to a significant increase in methane production. The higher relative abundance of Coprothermobacter, Acetomicrobium, Proteiniphilum, and Methanoculleus in the CSTR led to a higher methane production rate than in the AnMBR, in which these bacterial genera were less favoured, presenting lower relative abundances than those in the CSTR. These findings highlight the role of PHB in enhancing the performance of the AD process in the CSTR by promoting the availability of acetate to both acetolactic (Methanosaeta) and hydrogenotrophic (Methanoculleus) methanogenic pathways and underscores PHB’s potential to improve methanogenesis through metabolic routes and promote more efficient methane synthesis.
4. Conclusions
In this study, we found that PHB valorisation enhances methane production and favours the development of microorganisms that use acetate as the main substrate in their metabolic pathways. These findings have significant implications for the practical application of biogas production from PHB plastic waste in anaerobic WWTP digesters. The main conclusions that can be drawn from this study can be summarised as follows:
- PHB is highly biodegradable in anaerobic digesters under mesophilic conditions; 75% degradation was achieved in batch tests using a non-adapted inoculum. However, under continuous operation with an inoculum adapted to PHB, complete degradation was attained, resulting in full conversion to methane. Gravimetric measurements and FTIR identification confirmed the complete degradation of PHB in anaerobic digestion.
- The AnMBR presented higher efficiencies than the CSTR in removing organic matter when PHB was not added because of the higher SRT, which favours hydrolytic bacterial activity.
- Adding PHB to mixed sludge increased methane production in both reactors. In the AnMBR, biomethanisation increased by 12% (from 58% without PHB to 70%), while the CSTR showed a more significant rise of 28% (from 44% without PHB to 72%) after supplementation with 10 g PHB·L−1.
- PHB’s addition to the CSTR significantly enhanced mixed sludge biodegradability, but no enhancement was found in the AnMBR due to all the easily biodegradable organic matter being degraded after 40 days.
- PHB favoured the growth of microorganisms that used acetate in their metabolic pathways. The Mesotoga and Proteiniphilum acetate-oxidizing bacteria increased in their relative abundance after PHB valorisation, while Methanosaeta (acetoclastic methanogens) was dominant among the archaeal methanogens.
- The increase in methane production in the CSTR was associated with the increase in the relative abundance of acetogenic bacteria (Acetomicrobium and Coprothermobacter) and the acetate-oxidizing bacteria (Proteiniphilum), promoting syntrophic associations with acetoclastic (Methanosaeta) and hydrogenotrophic (Methanoculleus) methanogens.
- However, in the AnMBR, Methanosaeta and another unidentified methanogenic archaeon were mainly responsible for methane production as the Methanoculleus genus was not favoured.
- Further research is required to ascertain whether toxic intermediate metabolites are generated during the bioplastic’s degradation. The key focus should be on studying non-intentionally added substances (NIAS) to enhance our understanding of the compounds produced during the anaerobic breakdown of bioplastics and their potential environmental impact.
- Upcoming future research will relate to the implementation of a pilot-scale AnMBR system in the sludge line. It is necessary to conduct a prior economic study to assess whether the observed increase in methane over that produced by the CSTR without the use of PHB offsets the associated costs.
Author Contributions
Conceptualization, M.L., J.S. and N.M.; methodology, M.L. and J.F.F.; software, M.L., J.F.F. and L.B.; validation, L.B., J.S. and N.M.; formal analysis, M.L.; investigation, M.L.; resources, M.L.; data curation, M.L. and L.B.; writing—original draft preparation, M.L.; writing—review and editing, J.S. and N.M.; visualization, M.L.; supervision, J.S. and N.M.; project administration, J.S. and N.M.; funding acquisition, J.S. and N.M. All authors have read and agreed to the published version of the manuscript.
Funding
This research was funded by Agència Valenciana de la Innovació grant number INNEST/2021/168 and INNEST/2021/150.
Data Availability Statement
The original contributions presented in the study are included in the article. Further inquiries can be directed to the corresponding author.
Conflicts of Interest
The authors declare that the research was conducted in the absence of any commercial or financial relationships that could be construed as a potential conflict of interest.
References
- Plastics Europe. The Circular Economy for Plastics—A European Analysis. 2024. Available online: https://plasticseurope.org/knowledge-hub/the-circular-economy-for-plastics-a-european-analysis-2024/ (accessed on 1 November 2024).
- Geyer, R.; Jambeck, J.R.; Law, K.L. Production, use, and fate of all plastics ever made. Sci. Adv. 2017, 3, e1700782. [Google Scholar] [CrossRef] [PubMed]
- Hoque, M.E.; Rayhan, A.M.; Shaily, S.I. Natural fiber-based green composites: Processing, properties and biomedical applications. Appl. Sci. Eng. Prog. 2021, 14, 689–718. [Google Scholar] [CrossRef]
- Kumar Thiagamani, S.M.; Krishnasamy, S.; Siengchin, S. Challenges of biodegradable polymers: An environmental perspective. Appl. Sci. Eng. Prog. 2019, 12, 149. [Google Scholar] [CrossRef]
- European Bioplastics. Bioplastics Market Development Update. 2023. Available online: http://www.european-bioplastics.org/news/publica- (accessed on 1 November 2024).
- Abraham, A.; Park, H.; Choi, O.; Sang, B.I. Anaerobic co-digestion of bioplastics as a sustainable mode of waste management with improved energy production—A review. Bioresour. Technol. 2021, 322, 124537. [Google Scholar] [CrossRef]
- Bátori, V.; Åkesson, D.; Zamani, A.; Taherzadeh, M.J.; Sárvári Horváth, I. Anaerobic degradation of bioplastics: A review. Waste Manag. 2018, 80, 406–413. [Google Scholar] [CrossRef]
- Narancic, T.; Verstichel, S.; Chaganti, S.R.; Morales-Gamez, L.; Kenny, S.T.; De Wilde, B.; Padamati, R.B.; O’Connor, K.E. Biodegradable Plastic Blends Create New Possibilities for End-of-Life Management of Plastics but They Are Not a Panacea for Plastic Pollution. Environ. Sci. Technol. 2018, 52, 10441–10452. [Google Scholar] [CrossRef]
- Ali, S.S.; Abdelkarim, E.A.; Elsamahy, T.; Al-Tohamy, R.; Li, F.; Kornaros, M.; Zuorro, A.; Zhu, D.; Sun, J. Bioplastic production in terms of life cycle assessment: A state-of-the-art review. Environ. Sci. Ecotechnol. 2023, 15, 100254. [Google Scholar] [CrossRef] [PubMed]
- Cazaudehore, G.; Guyoneaud, R.; Lallement, A.; Gassie, C.; Monlau, F. Biochemical methane potential and active microbial communities during anaerobic digestion of biodegradable plastics at different inoculum-substrate ratios. J. Environ. Manag. 2022, 324, 116369. [Google Scholar] [CrossRef] [PubMed]
- Vardar, S.; Demirel, B.; Onay, T.T. Degradability of bioplastics in anaerobic digestion systems and their effects on biogas production: A review. Rev. Environ. Sci. Biotechnol. 2022, 21, 205–223. [Google Scholar] [CrossRef]
- Cazaudehore, G.; Guyoneaud, R.; Lallement, A.; Souquet, P.; Gassie, C.; Sambusiti, C.; Grassl, B.; Jiménez-Lamana, J.; Cauzzi, P.; Monlau, F. Simulation of biowastes and biodegradable plastics co-digestion in semi-continuous reactors: Performances and agronomic evaluation. Bioresour. Technol. 2023, 369, 128313. [Google Scholar] [CrossRef]
- Cucina, M.; Carlet, L.; De Nisi, P.; Somensi, C.A.; Giordano, A.; Adani, F. Degradation of biodegradable bioplastics under thermophilic anaerobic digestion: A full-scale approach. J. Clean. Prod. 2022, 368, 133232. [Google Scholar] [CrossRef]
- Gadaleta, G.; De Gisi, S.; Chong, Z.K.; Heerenklage, J.; Notarnicola, M.; Kuchta, K.; Cafiero, L.; Oliviero, M.; Sorrentino, A.; Picuno, C. Degradation of thermoplastic cellulose acetate-based bioplastics by full-scale experimentation of industrial anaerobic digestion and composting. Chem. Eng. J. 2023, 462, 142301. [Google Scholar] [CrossRef]
- Briassoulis, D.; Pikasi, A.; Hiskakis, M. Organic recycling of post-consumer/industrial bio-based plastics through industrial aerobic composting and anaerobic digestion—Techno-economic sustainability criteria and indicators. Polym. Degrad. Stab. 2021, 190, 109642. [Google Scholar] [CrossRef]
- Gadaleta, G.; De Gisi, S.; Picuno, C.; Heerenklage, J.; Kuchta, K.; Sorrentino, A.; Notarnicola, M.; Oliviero, M. Assessment of methane production, disintegration, and biodegradation potential of bioplastic waste in anaerobic digestion systems. J. Environ. Chem. Eng. 2024, 12, 111658. [Google Scholar] [CrossRef]
- Flury, M.; Narayan, R. Biodegradable plastic as an integral part of the solution to plastic waste pollution of the environment. Curr. Opin. Green. Sustain. Chem. 2021, 30, 100490. [Google Scholar] [CrossRef]
- Álvarez-Méndez, S.J.; Ramos-Suárez, J.L.; Ritter, A.; González, J.M.; Pérez, A.C. Anaerobic digestion of commercial PLA and PBAT biodegradable plastic bags: Potential biogas production and 1 H NMR and ATR-FTIR assessed biodegradation. Heliyon 2023, 9, e16691. [Google Scholar] [CrossRef] [PubMed]
- Meereboer, K.W.; Misra, M.; Mohanty, A.K. Review of recent advances in the biodegradability of polyhydroxyalkanoate (PHA) bioplastics and their composites. Green. Chem. 2020, 22, 5519–5558. [Google Scholar] [CrossRef]
- Bernat, K.; Kulikowska, D.; Wojnowska-Baryła, I.; Zaborowska, M.; Pasieczna-Patkowska, S. Thermophilic and mesophilic biogas production from PLA-based materials: Possibilities and limitations. Waste Manag. 2021, 119, 295–305. [Google Scholar] [CrossRef]
- Venkiteshwaran, K.; Benn, N.; Seyedi, S.; Zitomer, D. Methane yield and lag correlate with bacterial community shift following bioplastic anaerobic co-digestion. Bioresour. Technol. Rep. 2019, 7, 100198. [Google Scholar] [CrossRef]
- Cazaudehore, G.; Guyoneaud, R.; Evon, P.; Martin-Closas, L.; Pelacho, A.M.; Raynaud, C.; Monlau, F. Can anaerobic digestion be a suitable end-of-life scenario for biodegradable plastics? A critical review of the current situation, hurdles, and challenges. Biotechnol. Adv. 2022, 56, 107916. [Google Scholar] [CrossRef]
- García-Depraect, O.; Lebrero, R.; Rodriguez-Vega, S.; Bordel, S.; Santos-Beneit, F.; Martínez-Mendoza, L.J.; Aragão Börner, R.; Börner, T.; Muñoz, R. Biodegradation of bioplastics under aerobic and anaerobic aqueous conditions: Kinetics, carbon fate and particle size effect. Bioresour. Technol. 2022, 344, 126265. [Google Scholar] [CrossRef]
- Zhang, L.; Tsui, T.H.; Fu, J.; Dai, Y.; Tong, Y.W. Valorization of poly-β-hydroxybutyrate (PHB)-based bioplastic waste in anaerobic digesters of food waste for bioenergy generation: Reactor performance, microbial community analysis, and bioplastic biodegradation. Carbon Neutrality 2022, 1, 8. [Google Scholar] [CrossRef]
- UNE-EN ISO 15512:2020; Plastics. Determination of Water Content. Technical Comitee CTN 53 Plastics and rubber the Secretariat of which is held by ANAIP: Madrid, Spain, 2020.
- UNE-EN ISO 1183-2:2019; Plastics. Methods for Determining the Density of Non-Cellular Plastics Part 2: Density Gradient Column Method. Technical Comitee CTN 53 Plastics and rubber the Secretariat of which is held by ANAIP: Madrid, Spain, 2019.
- UNE-EN ISO 1133-1:2023; Plastics Determination of the Melt Mass-Flow Rate (MFR) and Melt Volume-Flow Rate (MVR) of Thermoplastics Part 1: Standard Method. Technical Comitee CTN 53 Plastics and rubber the Secretariat of which is held by ANAIP: Madrid, Spain, 2023.
- UNE-EN ISO 13885-3:2022; Gel permeation Chromatography (GPC) Part 3: Water as Eluent. Technical Comitee CTN 48 Paints and varnishes the Secratariat of wich is held by ASEFAPI: Madrid, Spain, 2022.
- APHA. Standard Methods for the Examination of Water and Wastewater, 24th ed.; American Public Health Association, American Water Works Association, and Water Environment Federation: Washington, DC, USA, 2022. [Google Scholar]
- Moosbrugger, R.E.; Wentzel, M.C.; Loewenthal, R.E.; Ekama, G.A.; Marais, G.V. Alkalinity measurement: Part 3-A 5-pH point titration method to determine the carbonate and scfa weak acid bases in aqueous-solution containing also known concentrations of other weak acid bases. Water SA 1993, 19, 29–40. [Google Scholar]
- Egea-Corbacho, A.; Martín-García, A.P.; Franco, A.A.; Quiroga, J.M.; Andreasen, R.R.; Jørgensen, M.K.; Christensen, M.L. Occurrence, identification and removal of microplastics in a wastewater treatment plant compared to an advanced MBR technology: Full-scale pilot plant. J. Environ. Chem. Eng. 2023, 11, 109644. [Google Scholar] [CrossRef]
- OSPAR Commission. Regional Action Plan for Prevention and Management of Marine Litter in the North-East Atlantic; OSPAR Commission: London, UK, 2014. [Google Scholar]
- ProductionPrimpke, S.; Cross, R.K.; Mintenig, S.M.; Simon, M.; Vianello, A.; Gerdts, G.; Vollertsen, J. Toward the Systematic Identification of Microplastics in the Environment: Evaluation of a New Independent Software Tool (siMPle) for Spectroscopic Analysis. Appl. Spectrosc. 2020, 74, 1127–1138. [Google Scholar] [CrossRef]
- Cabernard, L.; Roscher, L.; Lorenz, C.; Gerdts, G.; Primpke, S. Comparison of Raman and Fourier Transform Infrared Spectroscopy for the Quantification of Microplastics in the Aquatic Environment. Environ. Sci. Technol. 2018, 52, 13279–13288. [Google Scholar] [CrossRef] [PubMed]
- Liu, F.; Olesen, K.B.; Borregaard, A.R.; Vollertsen, J. Microplastics in urban and highway stormwater retention ponds. Sci. Total Environ. 2019, 671, 992–1000. [Google Scholar] [CrossRef]
- Klindworth, A.; Pruesse, E.; Schweer, T.; Peplies, J.; Quast, C.; Horn, M.; Glöckner, F.O. Evaluation of general 16S ribosomal RNA gene PCR primers for classical and next-generation sequencing-based diversity studies. Nucleic Acids Res. 2013, 41, e1. [Google Scholar] [CrossRef]
- Schloss, P.D.; Westcott, S.L.; Ryabin, T.; Hall, J.R.; Hartmann, M.; Hollister, E.B.; Lesniewski, R.A.; Oakley, B.B.; Parks, D.H.; Robinson, C.J.; et al. Introducing mothur: Open-source, platform-independent, community-supported software for describing and comparing microbial communities. Appl. Environ. Microbiol. 2009, 75, 7537–7541. [Google Scholar] [CrossRef]
- Costa, J.P.; da Avellan, A.; Mouneyrac, C.; Duarte, A.; Rocha-Santos, T. Plastic additives and microplastics as emerging contaminants: Mechanisms and analytical assessment. TrAC Trends Anal. Chem. 2023, 158, 116898. [Google Scholar] [CrossRef]
- Hahladakis, J.N.; Velis, C.A.; Weber, R.; Iacovidou, E.; Purnell, P. An overview of chemical additives presents in plastics: Migration, release, fate and environmental impact during their use, disposal and recycling. J. Hazard. Mater. 2018, 344, 179–199. [Google Scholar] [CrossRef] [PubMed]
- Maddela, N.R.; Kakarla, D.; Venkateswarlu, K.; Megharaj, M. Additives of plastics: Entry into the environment and potential risks to human and ecological health. J. Environ. Manag. 2023, 348, 119364. [Google Scholar] [CrossRef] [PubMed]
- Benn, N.; Zitomer, D. Pretreatment and anaerobic co-digestion of selected PHB and PLA bioplastics. Front. Environ. Sci. 2018, 5, 93. [Google Scholar] [CrossRef]
- Cazaudehore, G.; Monlau, F.; Gassie, C.; Lallement, A.; Guyoneaud, R. Active microbial communities during biodegradation of biodegradable plastics by mesophilic and thermophilic anaerobic digestion. J. Hazard. Mater. 2023, 443, 130208. [Google Scholar] [CrossRef]
- Chen, S.C.; Weng, C.Y.; Lai, M.C.; Tamaki, H.; Narihiro, T. Comparative genomic analyses reveal trehalose synthase genes as the signature in genus Methanoculleus. Mar. Genom. 2019, 47, 100673. [Google Scholar] [CrossRef]
- Manzoor, S.; Schnürer, A.; Bongcam-Rudloff, E.; Müller, B. Complete genome sequence of Methanoculleus bourgensis strain MAB1, the syntrophic partner of mesophilic acetate-oxidising bacteria (SAOB). Stand. Genom. Sci. 2016, 11, 80. [Google Scholar] [CrossRef]
- Wu, Z.; Nguyen, D.; Lam, T.Y.C.; Zhuang, H.; Shrestha, S.; Raskin, L.; Khanal, S.K.; Lee, P. Synergistic association between cytochrome bd-encoded Proteiniphilum and reactive oxygen species (ROS)-scavenging methanogens in microaerobic-anaerobic digestion of lignocellulosic biomass. Water Res. 2021, 190, 116721. [Google Scholar] [CrossRef]
- Soutschek, E.; Winter, J.; Schindler, F.; Kandler, O. Acetomicrobium flavidum, gen. nov.; sp. nov.; a thermophilic, anaerobic bacterium from sewage sludge, forming acetate, CO2 and H2 from Glucose. Syst. Appl. Microbiol. 1984, 5, 377–390. [Google Scholar] [CrossRef]
- Ho, D.; Jensen, P.; Gutierrez-Zamora, M.L.; Beckmann, S.; Manefield, M.; Batstone, D. High-rate, high temperature acetotrophic methanogenesis governed by a three population consortium in anaerobic bioreactors. PLoS ONE 2016, 11, e0159760. [Google Scholar] [CrossRef]
- Dong, N.; Zeng, Z.; Russenberger, M.; Zhou, L.; Zhuang, W.Q. Investigating cake layer development and functional genes in formate- and acetate-driven heterotrophic denitrifying AnMBRs. Chem. Eng. J. 2024, 485, 149623. [Google Scholar] [CrossRef]
- Ben Hania, W.; Fadhlaoui, K.; Brochier-Armanet, C.; Persillon, C.; Postec, A.; Hamdi, M.; Dolla, A.; Ollivier, B.; Fardeau, M.-L.; Le Mer, J.; et al. Draft genome sequence of Mesotoga strain PhosAC3, a mesophilic member of the bacterial order Thermotogales, isolated from a digestor treating phosphogypsum in Tunisia. Stand. Genom. Sci. 2015, 10, 12. [Google Scholar] [CrossRef] [PubMed]
- Feng, G.; Zeng, Y.; Wang, H.Z.; Chen, Y.T.; Tang, Y.Q. Proteiniphilum and Methanothrix harundinacea became dominant acetate utilizers in a methanogenic reactor operated under strong ammonia stress. Front. Microbiol. 2023, 13, 1098814. [Google Scholar] [CrossRef] [PubMed]
- Ma, K.; Han, X.; Li, Q.; Kong, Y.; Liu, Q.; Yan, X.; Luo, Y.; Li, X.; Wen, H.; Cao, Z. Improved anaerobic sludge fermentation mediated by a tryptophan-degrading consortium: Effectiveness assessment and mechanism deciphering. J. Environ. Manag. 2024, 350, 119623. [Google Scholar] [CrossRef] [PubMed]
- Thongbunrod, N.; Chaiprasert, P. Anaerobic microbial cocktail of lignocellulolytic fungi and bacteria with methanogens for boosting methane production from unpretreated rice straw. Bioprocess Biosyst. Eng. 2023, 46, 251–264. [Google Scholar] [CrossRef]
Disclaimer/Publisher’s Note: The statements, opinions and data contained in all publications are solely those of the individual author(s) and contributor(s) and not of MDPI and/or the editor(s). MDPI and/or the editor(s) disclaim responsibility for any injury to people or property resulting from any ideas, methods, instructions or products referred to in the content. |
© 2024 by the authors. Licensee MDPI, Basel, Switzerland. This article is an open access article distributed under the terms and conditions of the Creative Commons Attribution (CC BY) license (https://creativecommons.org/licenses/by/4.0/).