1. Introduction
Drought is a climatic event that has a probability of occurring in almost all parts of the world, such as high- and low-rainfall areas, and it is mostly related to a reduction in the amount of precipitation received over an extended period [
1,
2,
3,
4]. Compared with other disasters, drought is characterized by various impacts and a high frequency of occurrence and persists for a long extended period, which profoundly impacts human society and the environment [
5,
6,
7,
8,
9,
10,
11]. Droughts can be categorized into four types based on different components of the water cycle: meteorological, agricultural, hydrological, and socioeconomic droughts [
12,
13]. These four types of droughts are influenced by various factors such as the amount of precipitation, soil moisture, and runoff when lower than average over an extended period. Meteorological drought is a crucial driver of various types of droughts. Precipitation is a critical environmental influence that plays a significant role in the occurrence and evolution of drought, with its spatial and temporal distribution affecting the prevalence of drought [
14,
15]. Global climate warming will accelerate hydrological cycles, consequently leading to changes in the balance of water supply and demand, as well as shifts in wet and dry conditions. This is further emphasized by the latest assessment report from the Intergovernmental Panel on Climate Change (IPCC) [
16], which predicts that climates will continue to become warmer and drier until the end of the 21st century [
17]. Thus, understanding the spatiotemporal characteristics of meteorological drought has implications for ecological and water resource security, especially in arid and semi-arid regions [
18,
19,
20].
The drought index is a key parameter used to analyze the occurrence of drought, and it is an effective metric for monitoring and quantitatively assessing drought [
2,
10,
21]. The World Meteorological Organization defines a drought index as “an index which is related to some of the cumulative effects of a prolonged and abnormal moisture deficiency” [
22]. To this end, several indices have been developed to quantify drought, including the Precipitation Percentage Index (P), the Palmer Drought Severity Index (PDSI), the Relative Humidity Index, the Standardized Precipitation Index (SPI), and the Standardized Precipitation Evapotranspiration Index (SPEI) [
23]. The Precipitation Percentage Index is determined by calculating the percentage difference between the precipitation during a specific period and the average climatic precipitation for that same period in previous years, relative to the average climatic precipitation for that time of year. This method is easy to calculate and can be applied across various time scales [
24]. The Palmer Drought Severity Index (PDSI) is based on the principle of soil moisture balance. It comprehensively takes into account the effects of water deficit and duration on the severity of drought, as well as the moisture content in both the upper and lower layers of soil. However, it has high data requirements, and some parameters must be estimated empirically [
25]. The Relative Humidity Index refers to the ratio of the difference between precipitation and potential evapotranspiration during a specific period to the potential evapotranspiration for the same period. This index serves as a drought detection tool based on soil moisture balance, reflecting the balanced conditions characteristic of the crop growing season [
26]. The humidity and aridity indices are defined as the ratio of precipitation to evapotranspiration capacity, reflecting the state of water balance. This index takes into account the influence of surface energy on evapotranspiration capacity, thereby minimizing the potential uncertainties associated with using an excessive number of parameters for evapotranspiration assessment [
27]. The Standardized Precipitation Index (SPI) calculates cumulative probability using a probability density function, further standardizing this probability to classify drought levels. The SPI mainly reflects the meteorological drought caused by precipitation changes in the region and can to some extent reveal the dry and wet characteristics of the climate. It exhibits stable computational characteristics and is relatively simple to calculate [
28]. The Standardized Precipitation Evapotranspiration Index (SPEI) is derived from the SPI and incorporates the influence of potential evapotranspiration. This index is constructed using two key variables: precipitation and potential evapotranspiration [
29].
Among these, the SPI exhibits some advantages including stability, simplicity in calculation, ease of data accessibility, and variability in temporal scales. Moreover, the index does not involve specific drought mechanisms and can effectively reflect drought conditions at different temporal scales in different regions, making it the most widely used meteorological drought index in scientific research and practical applications [
2,
12,
30]. In [
31], the applicability of four commonly used drought indices was evaluated using data from 207 national meteorological stations in northeast China covering 54 years, revealing that the indices generally showed consistent trends in drought duration and intensity. Further, [
32] investigated drought characteristics in China over 52 years using the SPI, revealing a drought-prone belt that extends spatially from northeast to southwest China, although significant variability was observed for drought over different time scales due to climatic differences among regions. In addition, ref. [
33] examined the variation in droughts and floods at different time scales using the SPI and meteorological data over nearly 55 years from 29 Yunnan Province stations, revealing an increased drought intensity across various time scales. Further, an analysis of the SPI for the middle and lower reaches of the Yangtze River revealed that spatial patterns of drought in the region varied across temporal scales [
34].
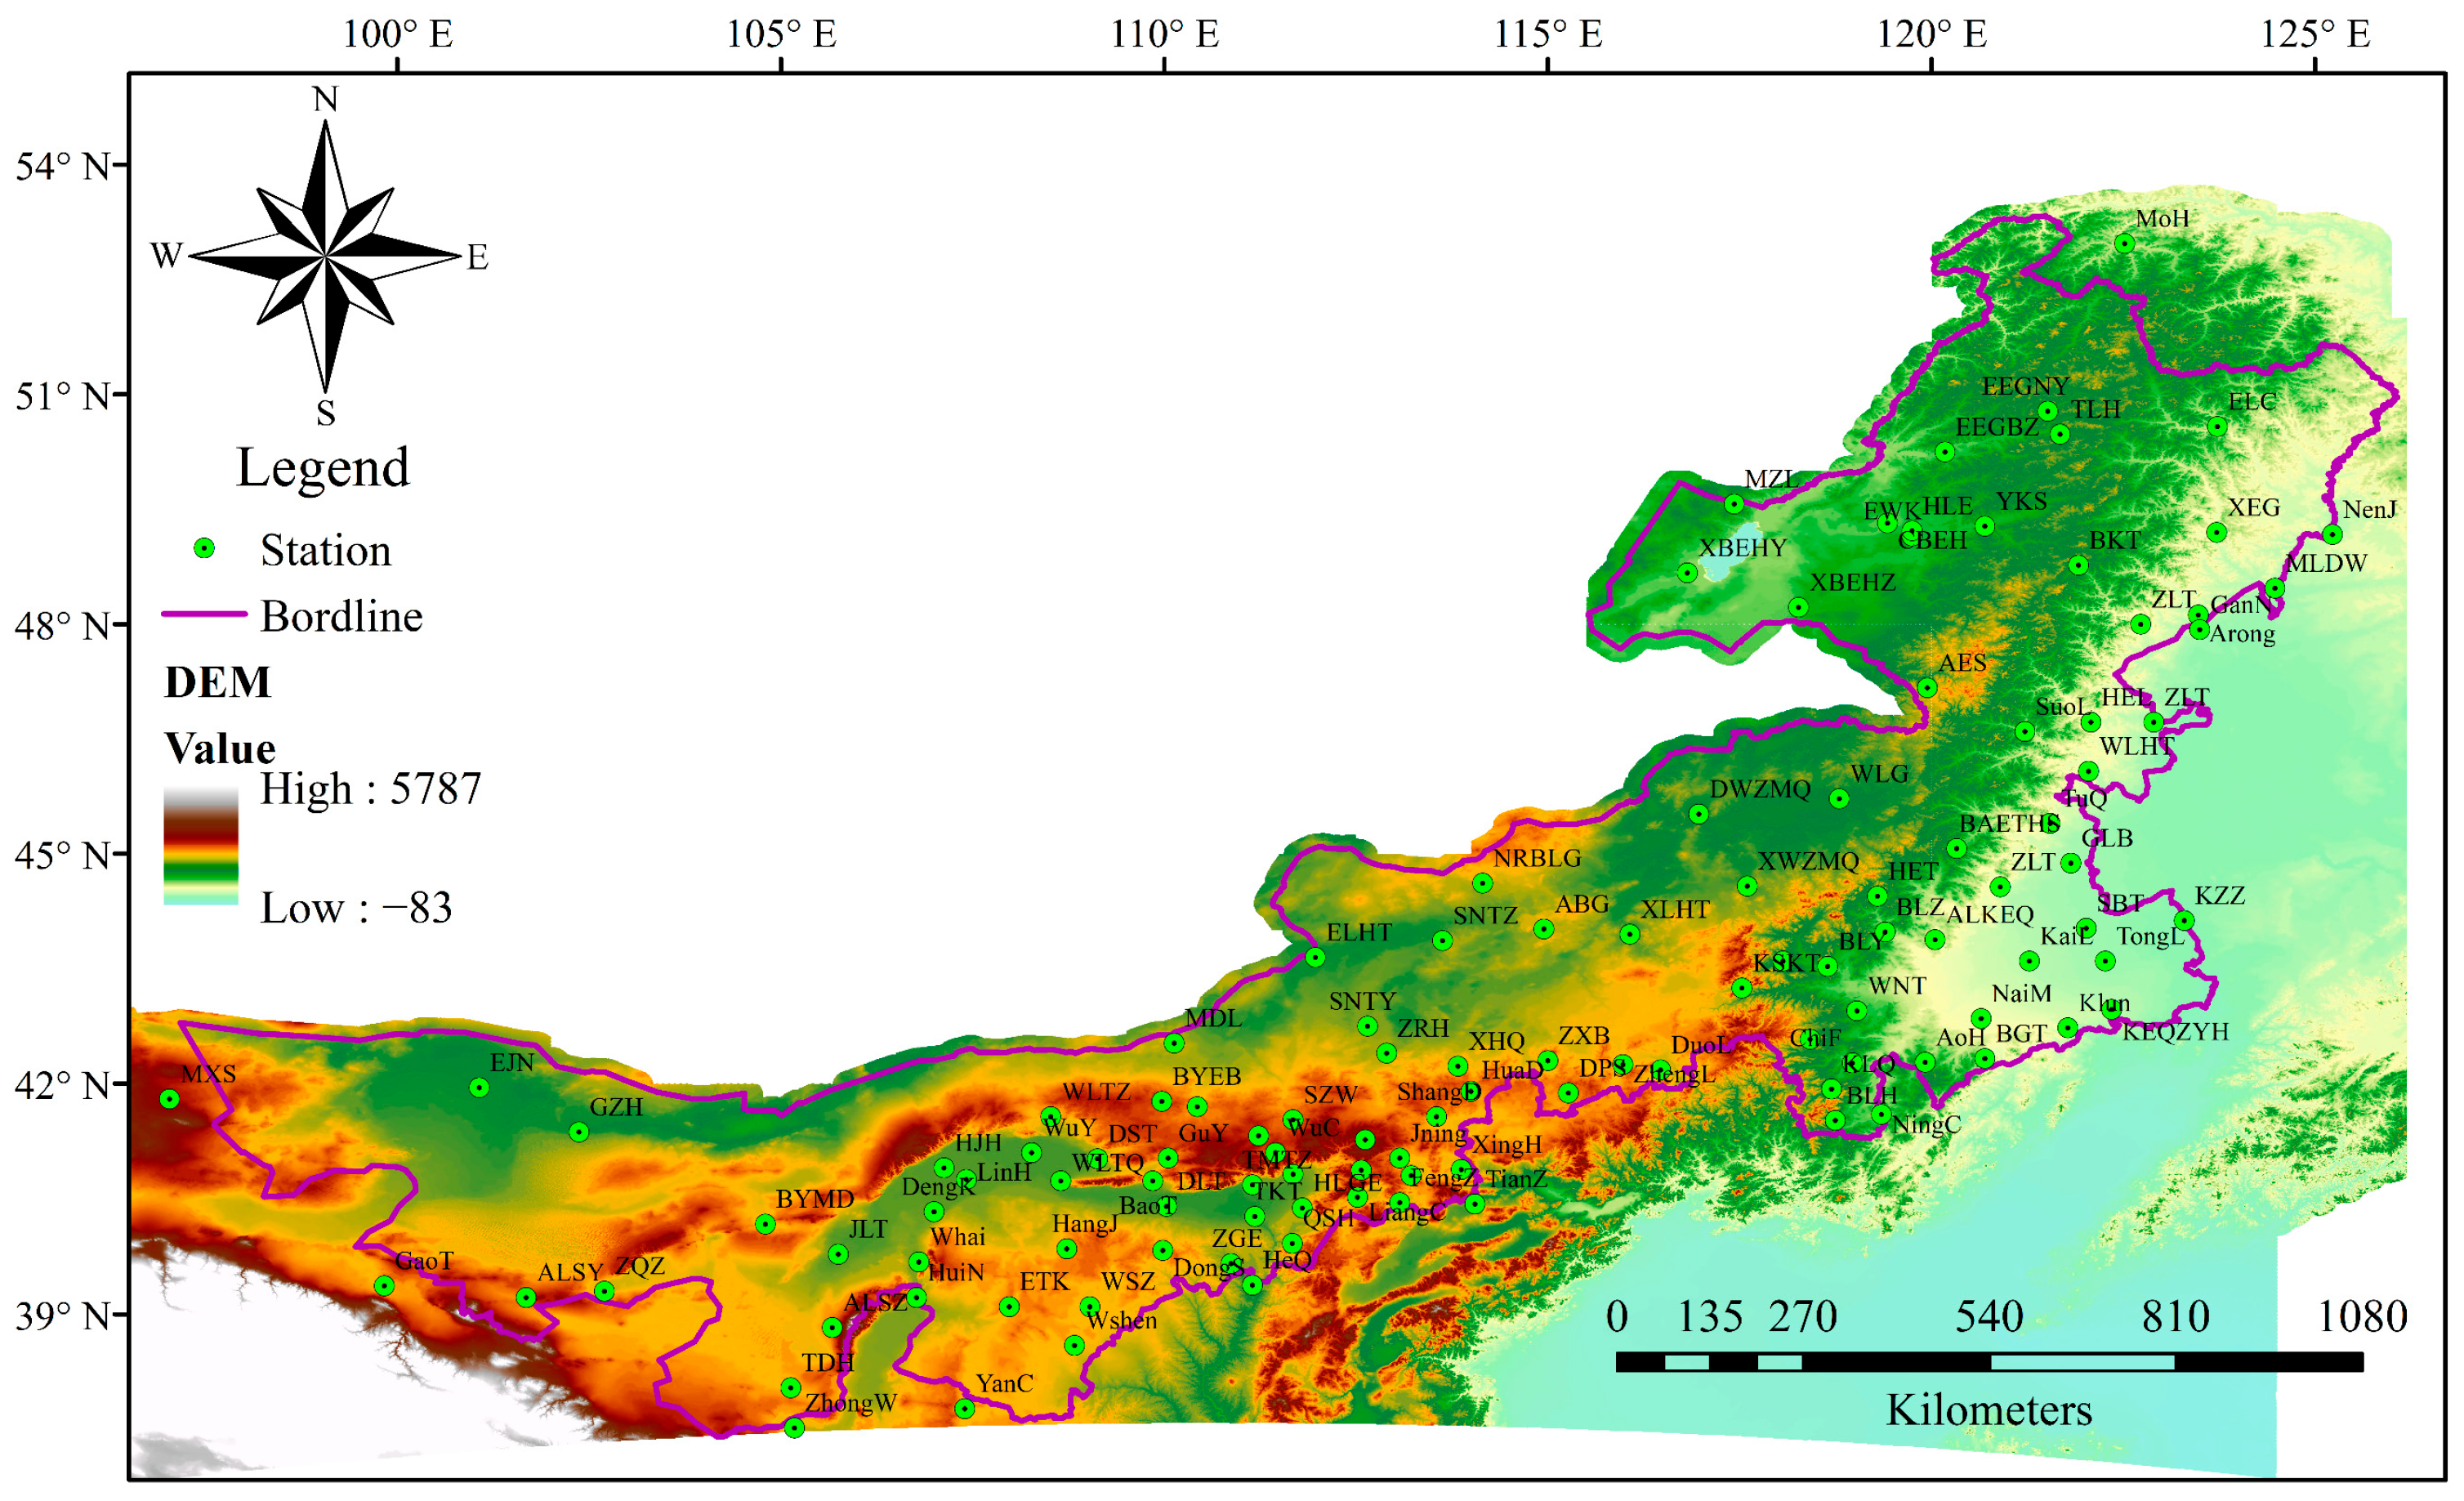
The Inner Mongolia region is located at central and high latitudes in China, where it is situated in the transitional zone from a monsoon to a continental climate. The influence of the westerly circulation and the East Asian summer monsoon extends across the entire territory of Inner Mongolia, with the boundary between the two traversing the region. This dynamic results in considerable variations in geographical and climatic conditions throughout Inner Mongolia. Specifically, the northeastern Daxing’anling region experiences the wettest climate, while the western region is the driest. This creates a climate gradient that transitions from arid to semi-arid, to semi-humid, and finally to humid conditions from west to east. The region is a crucial agricultural and pastoral crossover zone in China. To effectively mitigate the losses incurred from regional droughts and floods and to safeguard the vital ecological security defense line in northern Inner Mongolia, it is essential to study the distribution patterns and evolution of dryness and wetness in the region under climate change [
35]. In this study, the characteristics of drought in the Inner Mongolia region were investigated using the Standardized Precipitation Index with monthly and annual scales. This study aimed to explore the correlation between drought variation and precipitation of different grades and rain days, thereby assessing the impact of drought variation on the different grades of precipitation and rain days. In this sense, this study brings a new perspective to drought research by addressing drought vulnerability with respect to setting some critical rainfall conditions, and it provides a deeper understanding of the impact of precipitation on drought. Overall, the objective of this study was to provide a scientific basis for understanding regional drought characteristics and implementing effective drought prevention measures in response to climate change, particularly with regard to precipitation.
3. Results
3.1. Spatiotemporal Variation in the SPI
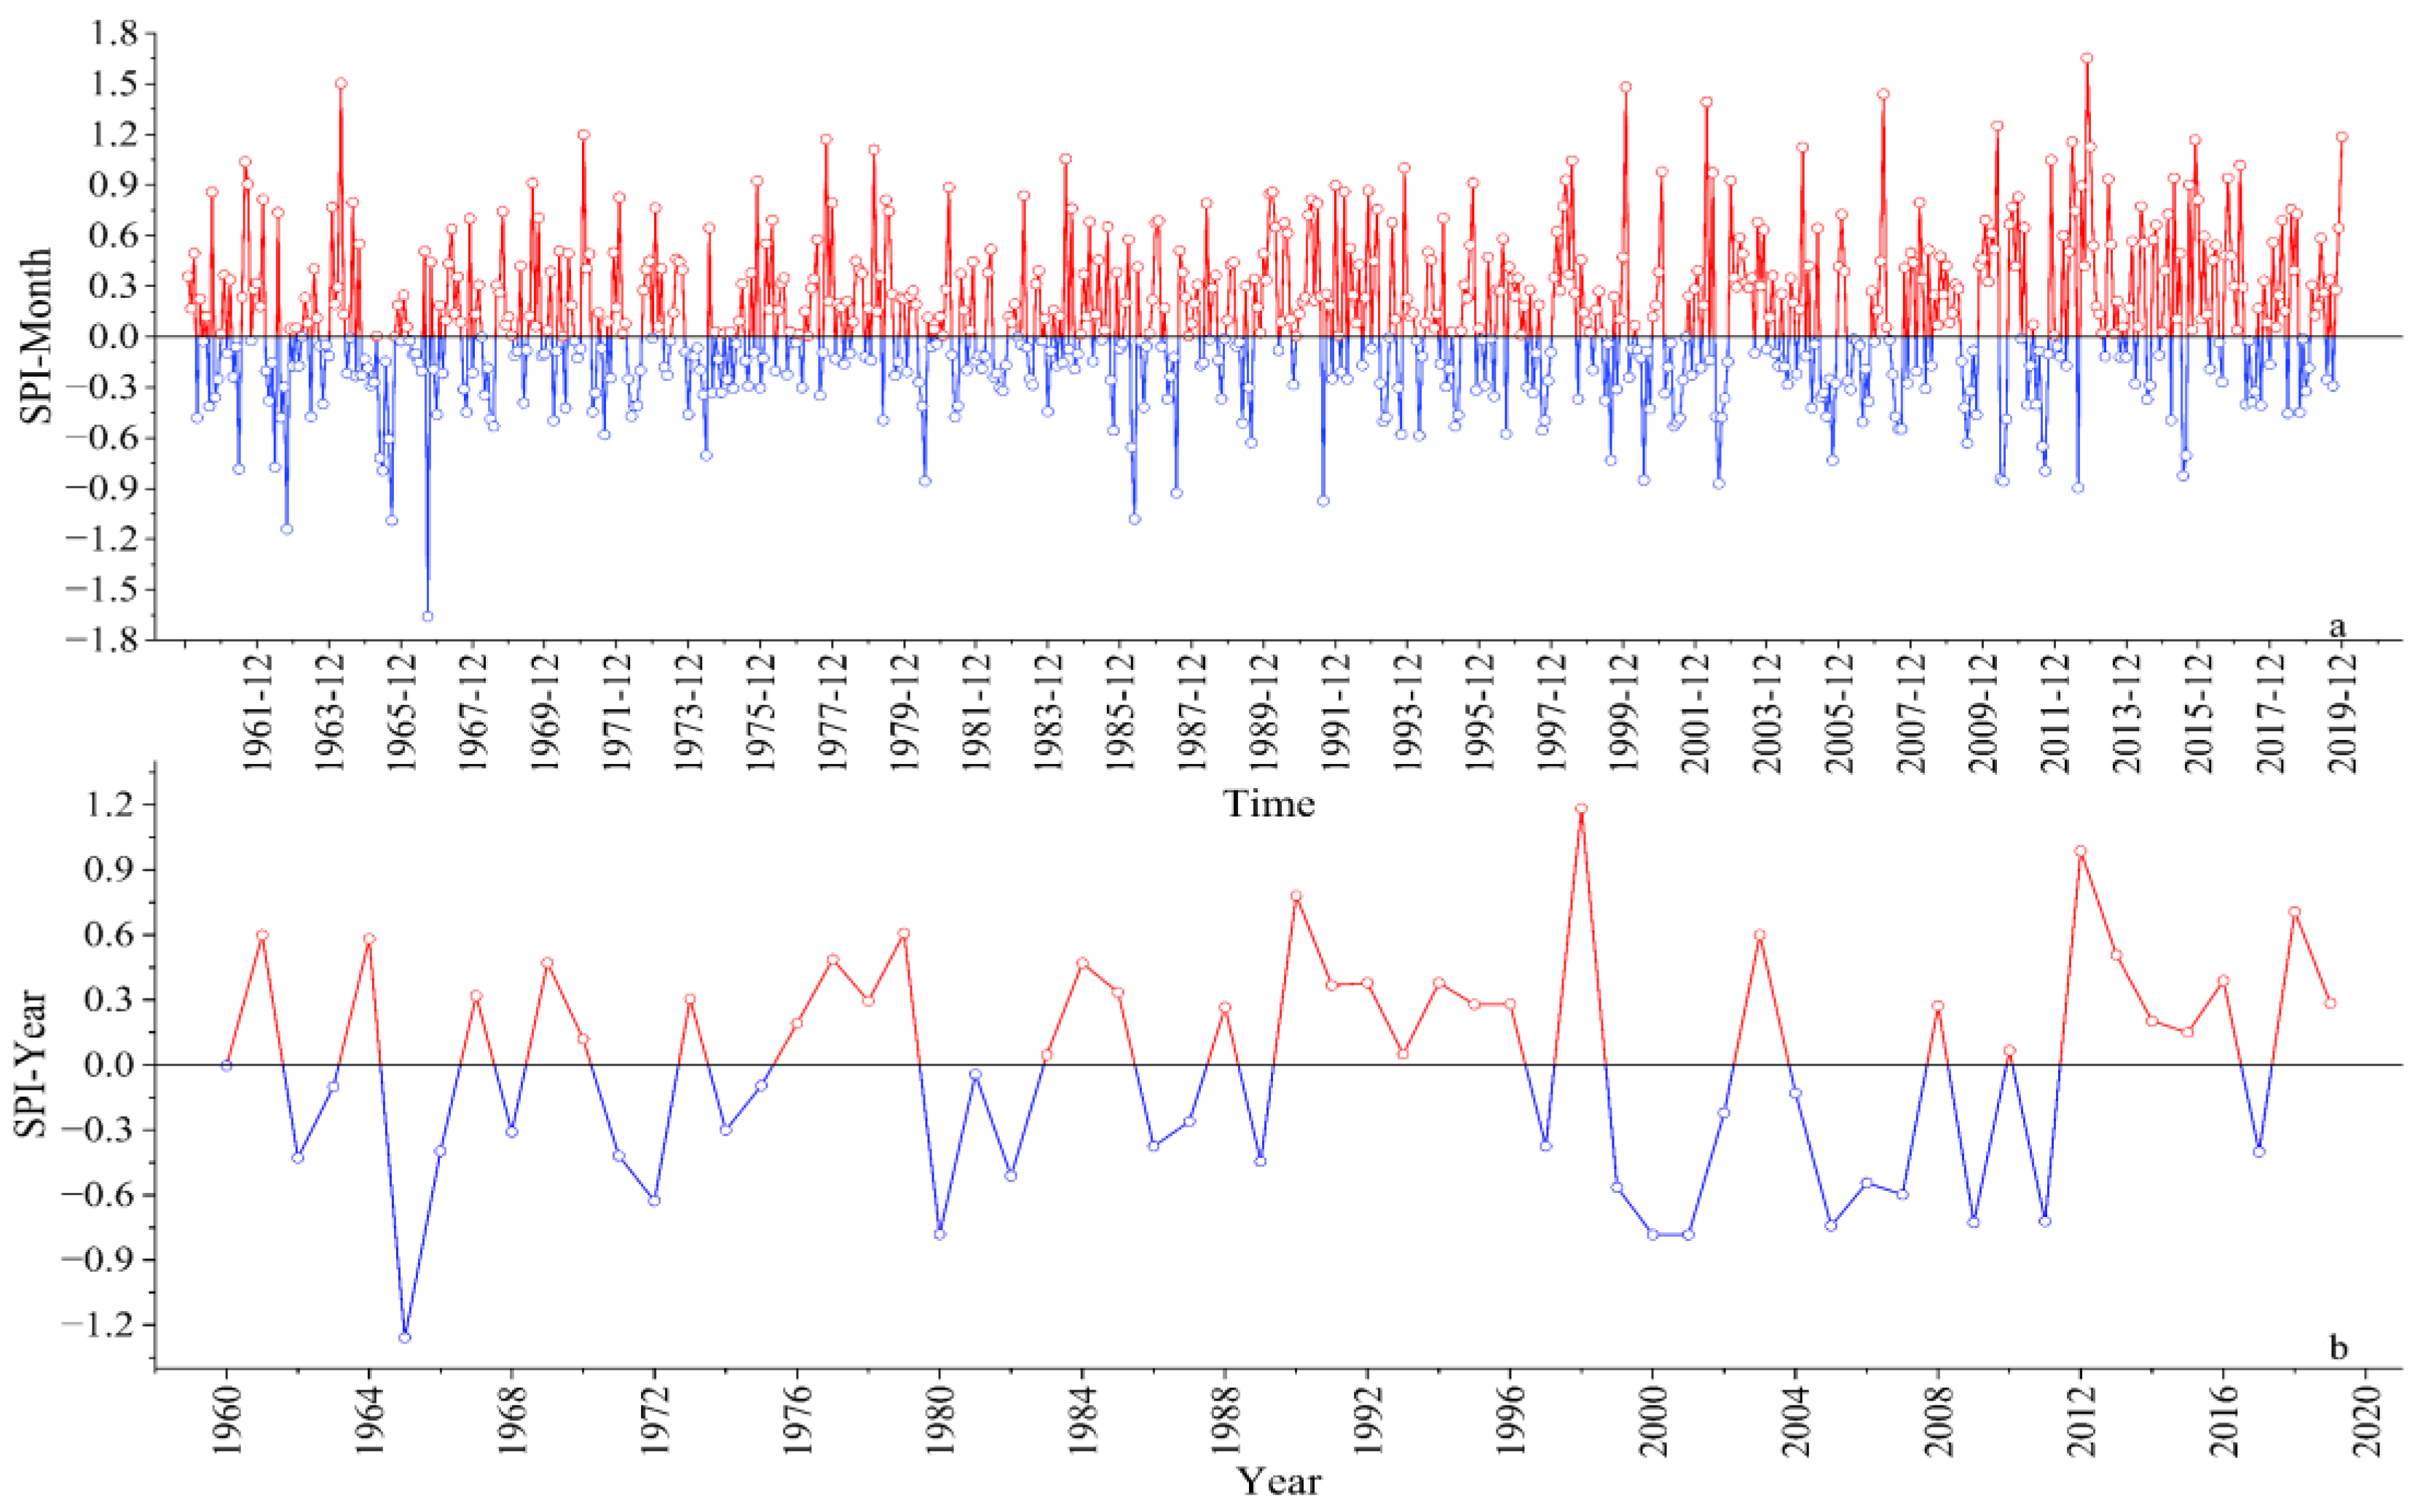
The SPI calculated for different time scales can be used to monitor different types of drought. For example, the monthly SPI can reflect regional short-term dry–wet events and transition patterns, while the annual and seasonal SPIs can reflect dry–wet cycle characteristics. The average SPI values for Inner Mongolia were calculated at two time scales, namely, 1 month and 12 months, identified as SPI_Month and SPI_Year, respectively (
Figure 2). The significant influence of short-term precipitation caused the SPI values at the short time scale (i.e., 1 month) to frequently fluctuate around 0 (
Figure 2). A total of 42 months of short-term drought occurred during the study period, accounting for 6% of the entire study period. Among these, mild drought occurred for 38 months, accounting for 90% of all drought occurrences, while moderate drought occurred for 3 months, and severe drought occurred for 1 month, together accounting for approximately 10% of the total. A total of 12 years of drought occurred across the study period, representing 20% of the total period. Moderate drought occurred for 1 year, while mild drought occurred for 11 years.
An evaluation of SPI_Month indicated severe drought in Inner Mongolia in 1966, while an analysis of SPI_Year indicated that the precipitation in the region was close to normal values and did not reach drought levels (
Figure 2). SPI_Year indicated moderate drought in Inner Mongolia in 1965, while SPI_Month indicated mild drought at the same time. To explain this inconsistency, further analysis revealed that SPI_Month was consistently below 0 from November 1964 to October 1965, indicating below-average monthly precipitation in that period and leading to the classification of moderate drought in Inner Mongolia in 1965. Many evaluated periods reflected this phenomenon (
Figure 2), indicating that as time scales increased, drought periods became more continuous. This phenomenon occurred because of the cumulative impact of previous changes in precipitation on drought.
To investigate the interannual variation in drought in Inner Mongolia, the annual scale SPI (SPI_Year) was analyzed to better evaluate specific periods of drought occurrence. The variation in SPI_Year (
Figure 2b) enabled better resolution regarding the overall drought situation in Inner Mongolia from 1960 to 2019. A frequency analysis indicated that a drought event took place approximately every 3–5 years. A relatively high frequency of drought was observed from 1999 to 2007, with 8 out of 9 years during the period reflecting drought. Almost every month experienced drought from February 2000 to November 2002, marking the longest continuous drought period in nearly 60 years. As the average values of SPI_Year for each station were investigated, only the average drought conditions across the entire region were reflected in the analysis, and it was not possible to assess specific drought conditions at individual stations.
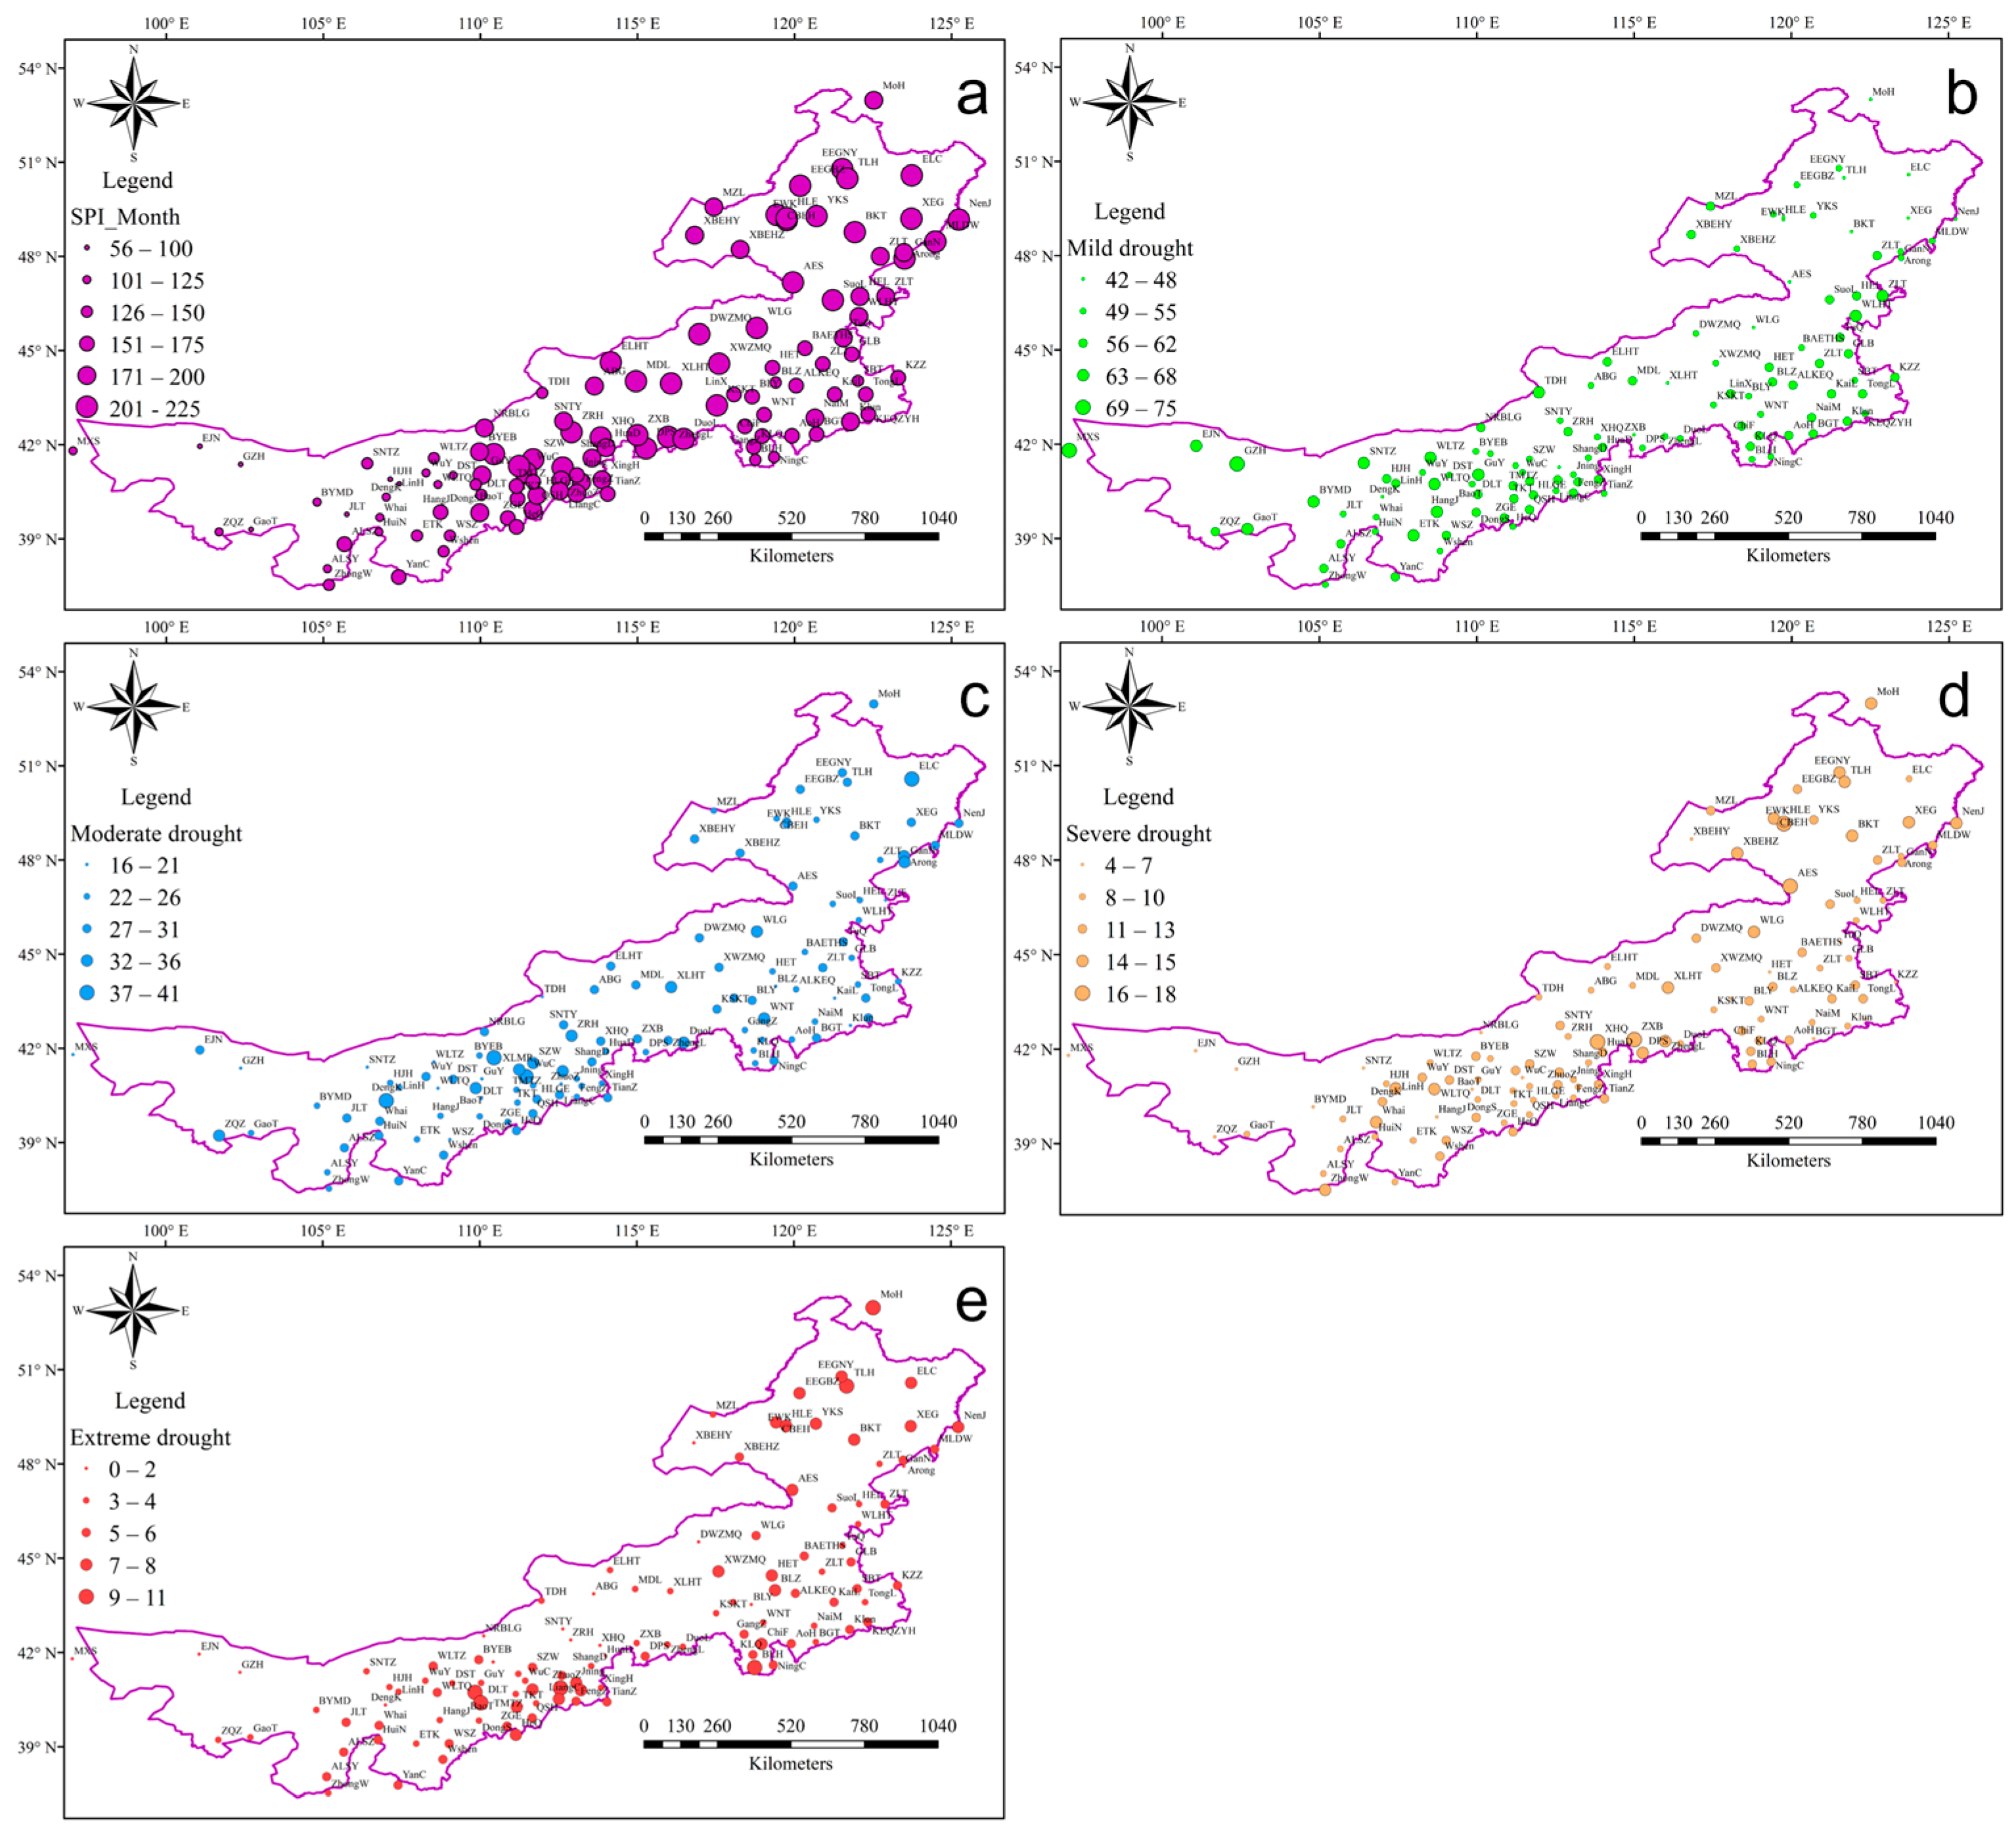
To better describe the spatial variation in the SPI at different time scales, the frequency of different drought levels at each station in the study area was separately calculated (
Figure 3). At the monthly scale (SPI_Month), a noticeable boundary was observed between the eastern and western regions, roughly delineated by longitude 110°E. Specifically, the frequency of drought occurrence in the eastern part of this area was significantly higher than that in the western part. Using ELC-WLG-XHQ-WuC as a dividing line, it was found that the northern region experienced more frequent drought occurrences than the southern region. Overall, the frequency of monthly scale drought ranged between 16% and 30%.
Regarding drought severity levels at the monthly scale, mild drought occurrences were the most frequent, accounting for over 50% of the total drought occurrences, followed by moderate drought, which comprised approximately 25% of the total; severe drought, which accounted for around 15% of the total; and extreme drought, which was the least frequent and accounted for less than 10% of the total. Regarding spatial variation, the frequency of mild drought generally aligned with the overall drought distribution, reflecting a higher frequency in the east and north and a lower frequency in the west and south. However, the spatial distribution of mild drought occurrences exhibited the opposite pattern. Using longitude 110°E as a reference, it was found that the proportion of mild drought occurrences was significantly higher in the western region than in the eastern region, and it was also higher in the southern region than in the northern region. For moderate drought, both the occurrence frequency and percentage were generally consistent with the overall distribution. Severe drought primarily occurred in the central-southern and northeastern regions, with occurrence aligning with the frequency distribution. Extreme drought occurrences were primarily concentrated in the vicinity of longitude 110°E and the northeastern regions, with occurrence being consistent with the frequency distribution.
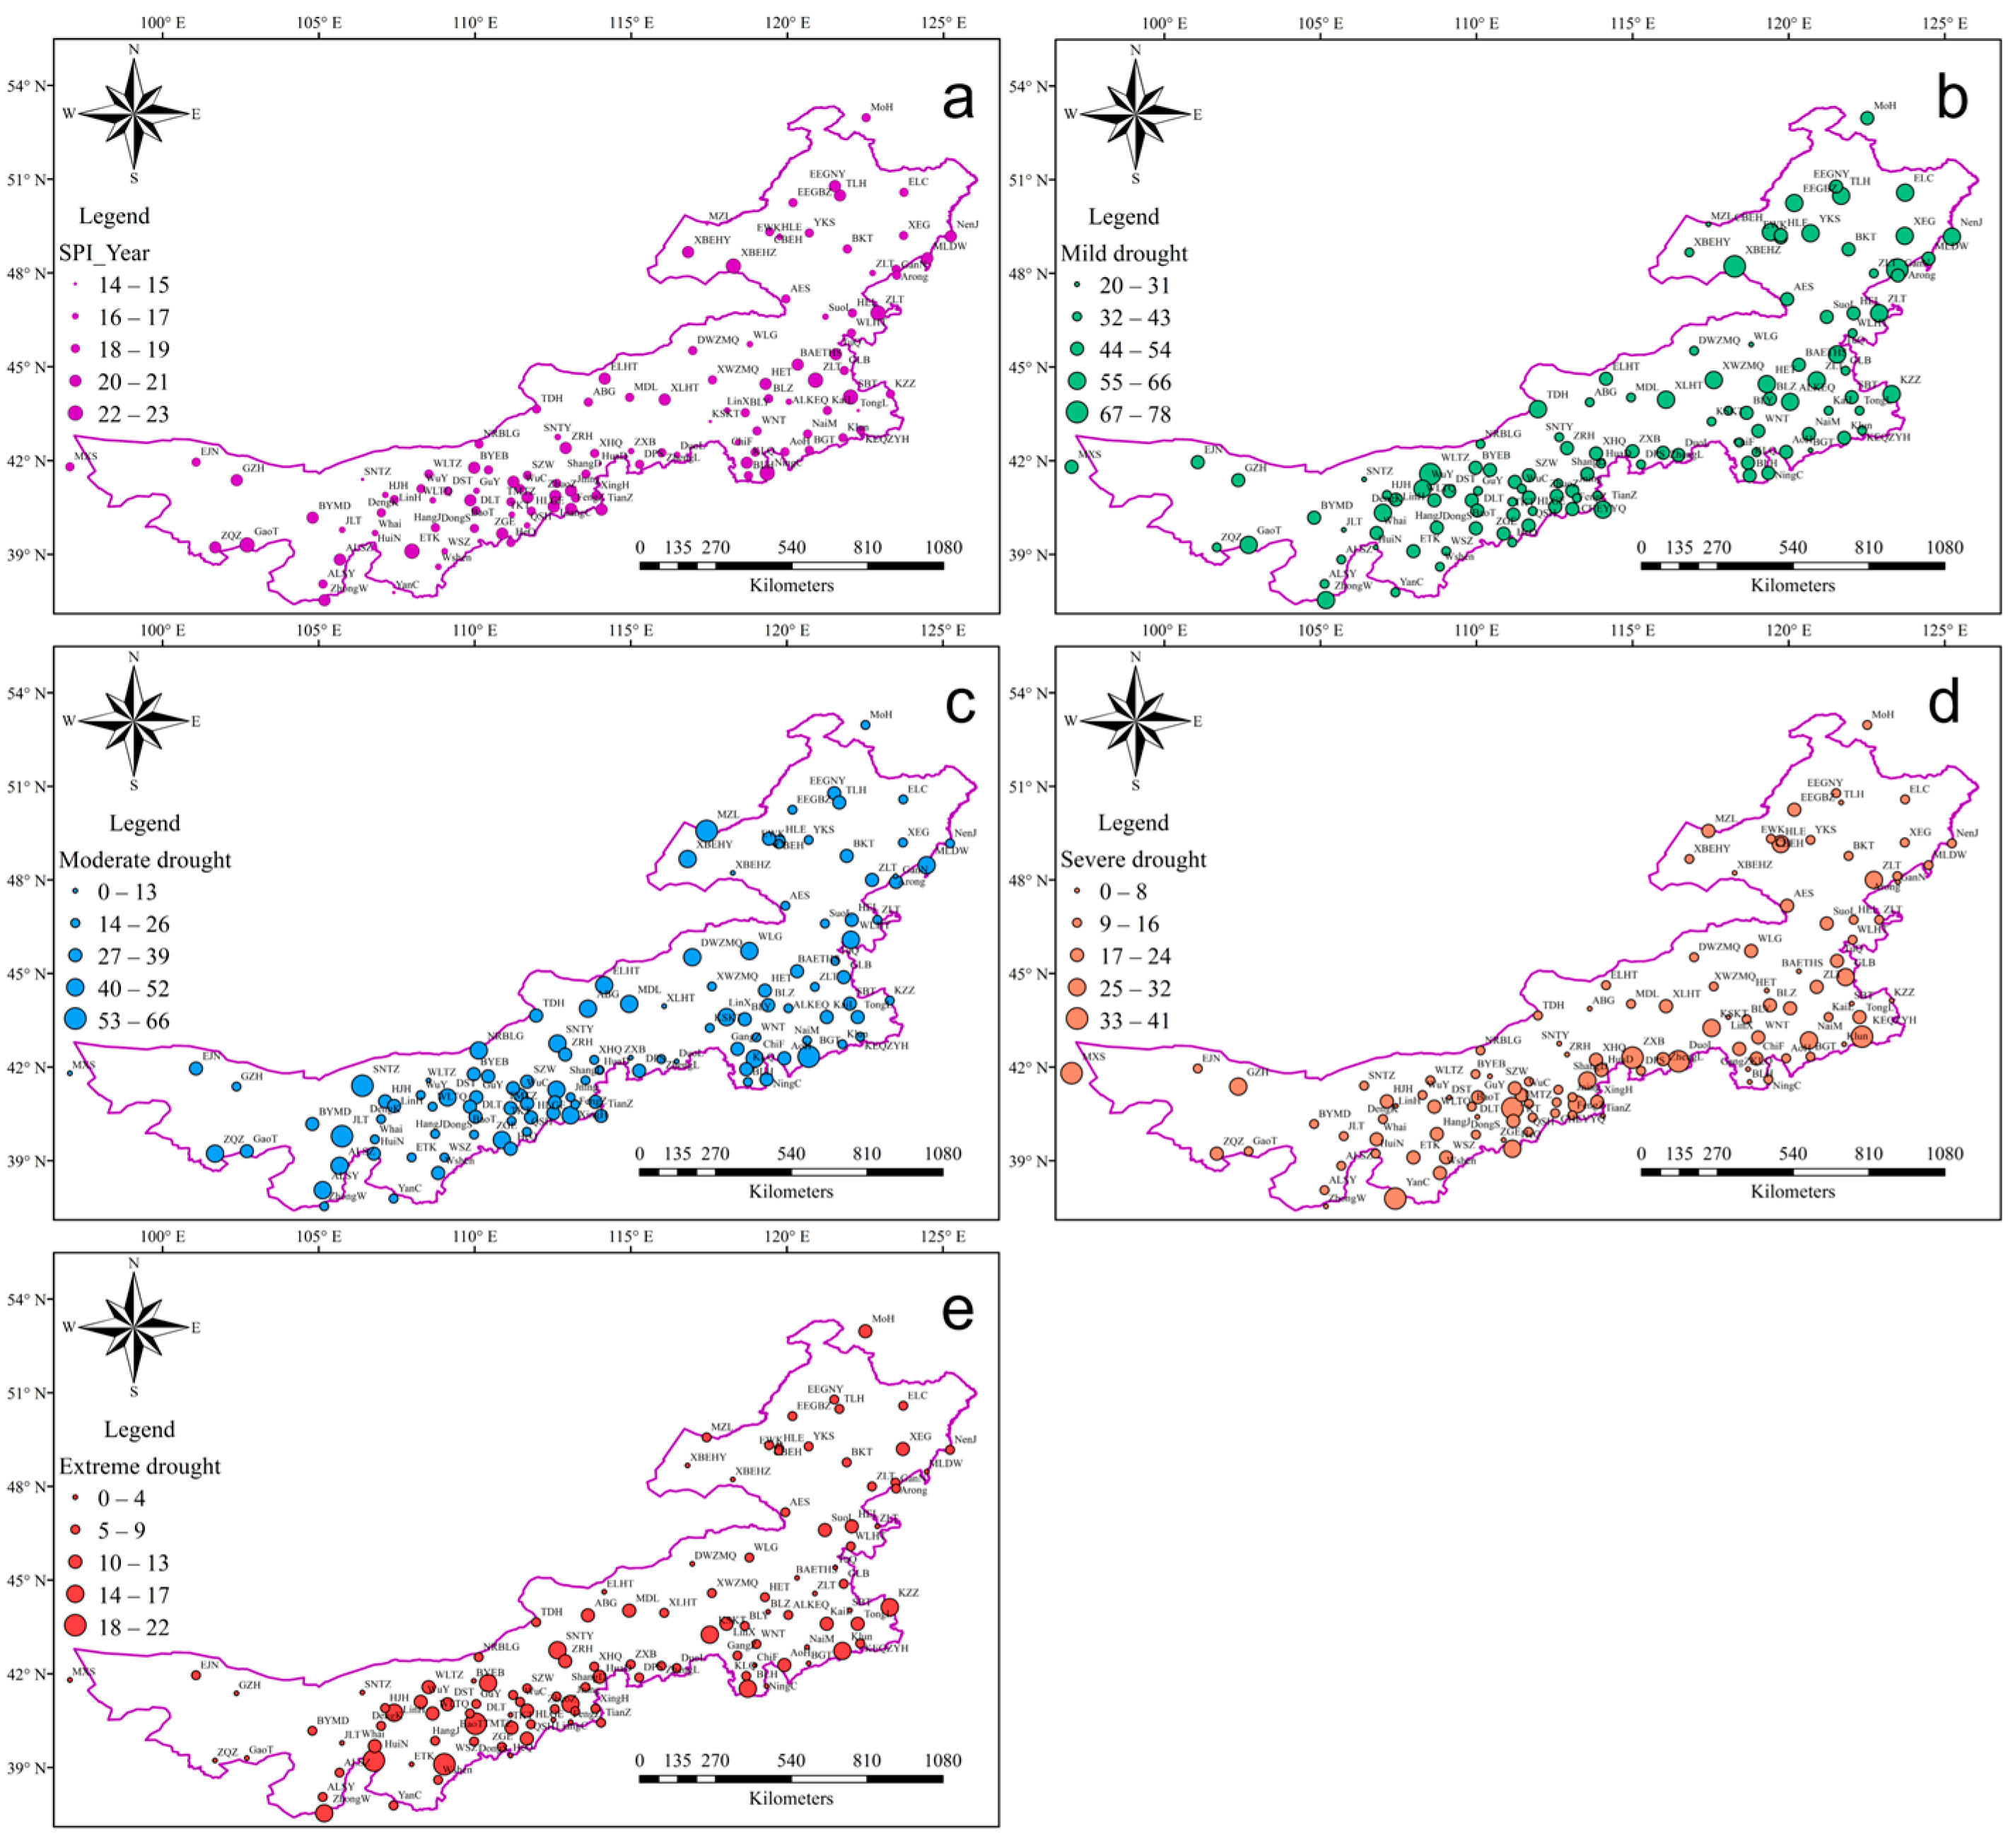
At the annual scale, drought in Inner Mongolia (
Figure 4) occurred with a frequency ranging from 23% to 38%. The XBEHZ and SBT stations in eastern Inner Mongolia experienced the highest number of drought occurrences. Using ELC-WLG-XHQ-WuC as a dividing line, it was found that the southern region experienced more frequent drought occurrences than the northern region, contrary to the drought distribution at the monthly scale. Thus, drought at different time scales exhibited different patterns influenced by the preceding precipitation period. Regarding drought severity levels at the annual scale, mild drought was the most frequent, accounting for over 45% of all drought occurrences, followed by moderate drought (approximately 30%), severe drought (15%), and then extreme drought (less than 10%). Spatially, the frequency of mild drought generally aligned with the overall distribution, exhibiting more occurrences in the east and north and fewer occurrences in the west and south. However, the spatial distribution of mild drought occurrences was generally consistent with their frequency; that is, the frequency of moderate drought occurrences was higher in the north than in the south, with the western region experiencing more moderate drought occurrences than the eastern region. These distinctions were delineated at approximately 115°E longitude. Regarding the occurrence percentage, a pattern opposite to that of the frequency distribution was observed. Both the frequency and percentage spatial distributions of severe drought were generally consistent, primarily occurring in the southern part of the central region. Extreme drought occurrences were primarily concentrated in the central region and the southern part of the eastern region, with the occurrence percentages being consistent with the frequency distribution.
3.2. Spatiotemporal Distribution of Different Grades of Precipitation
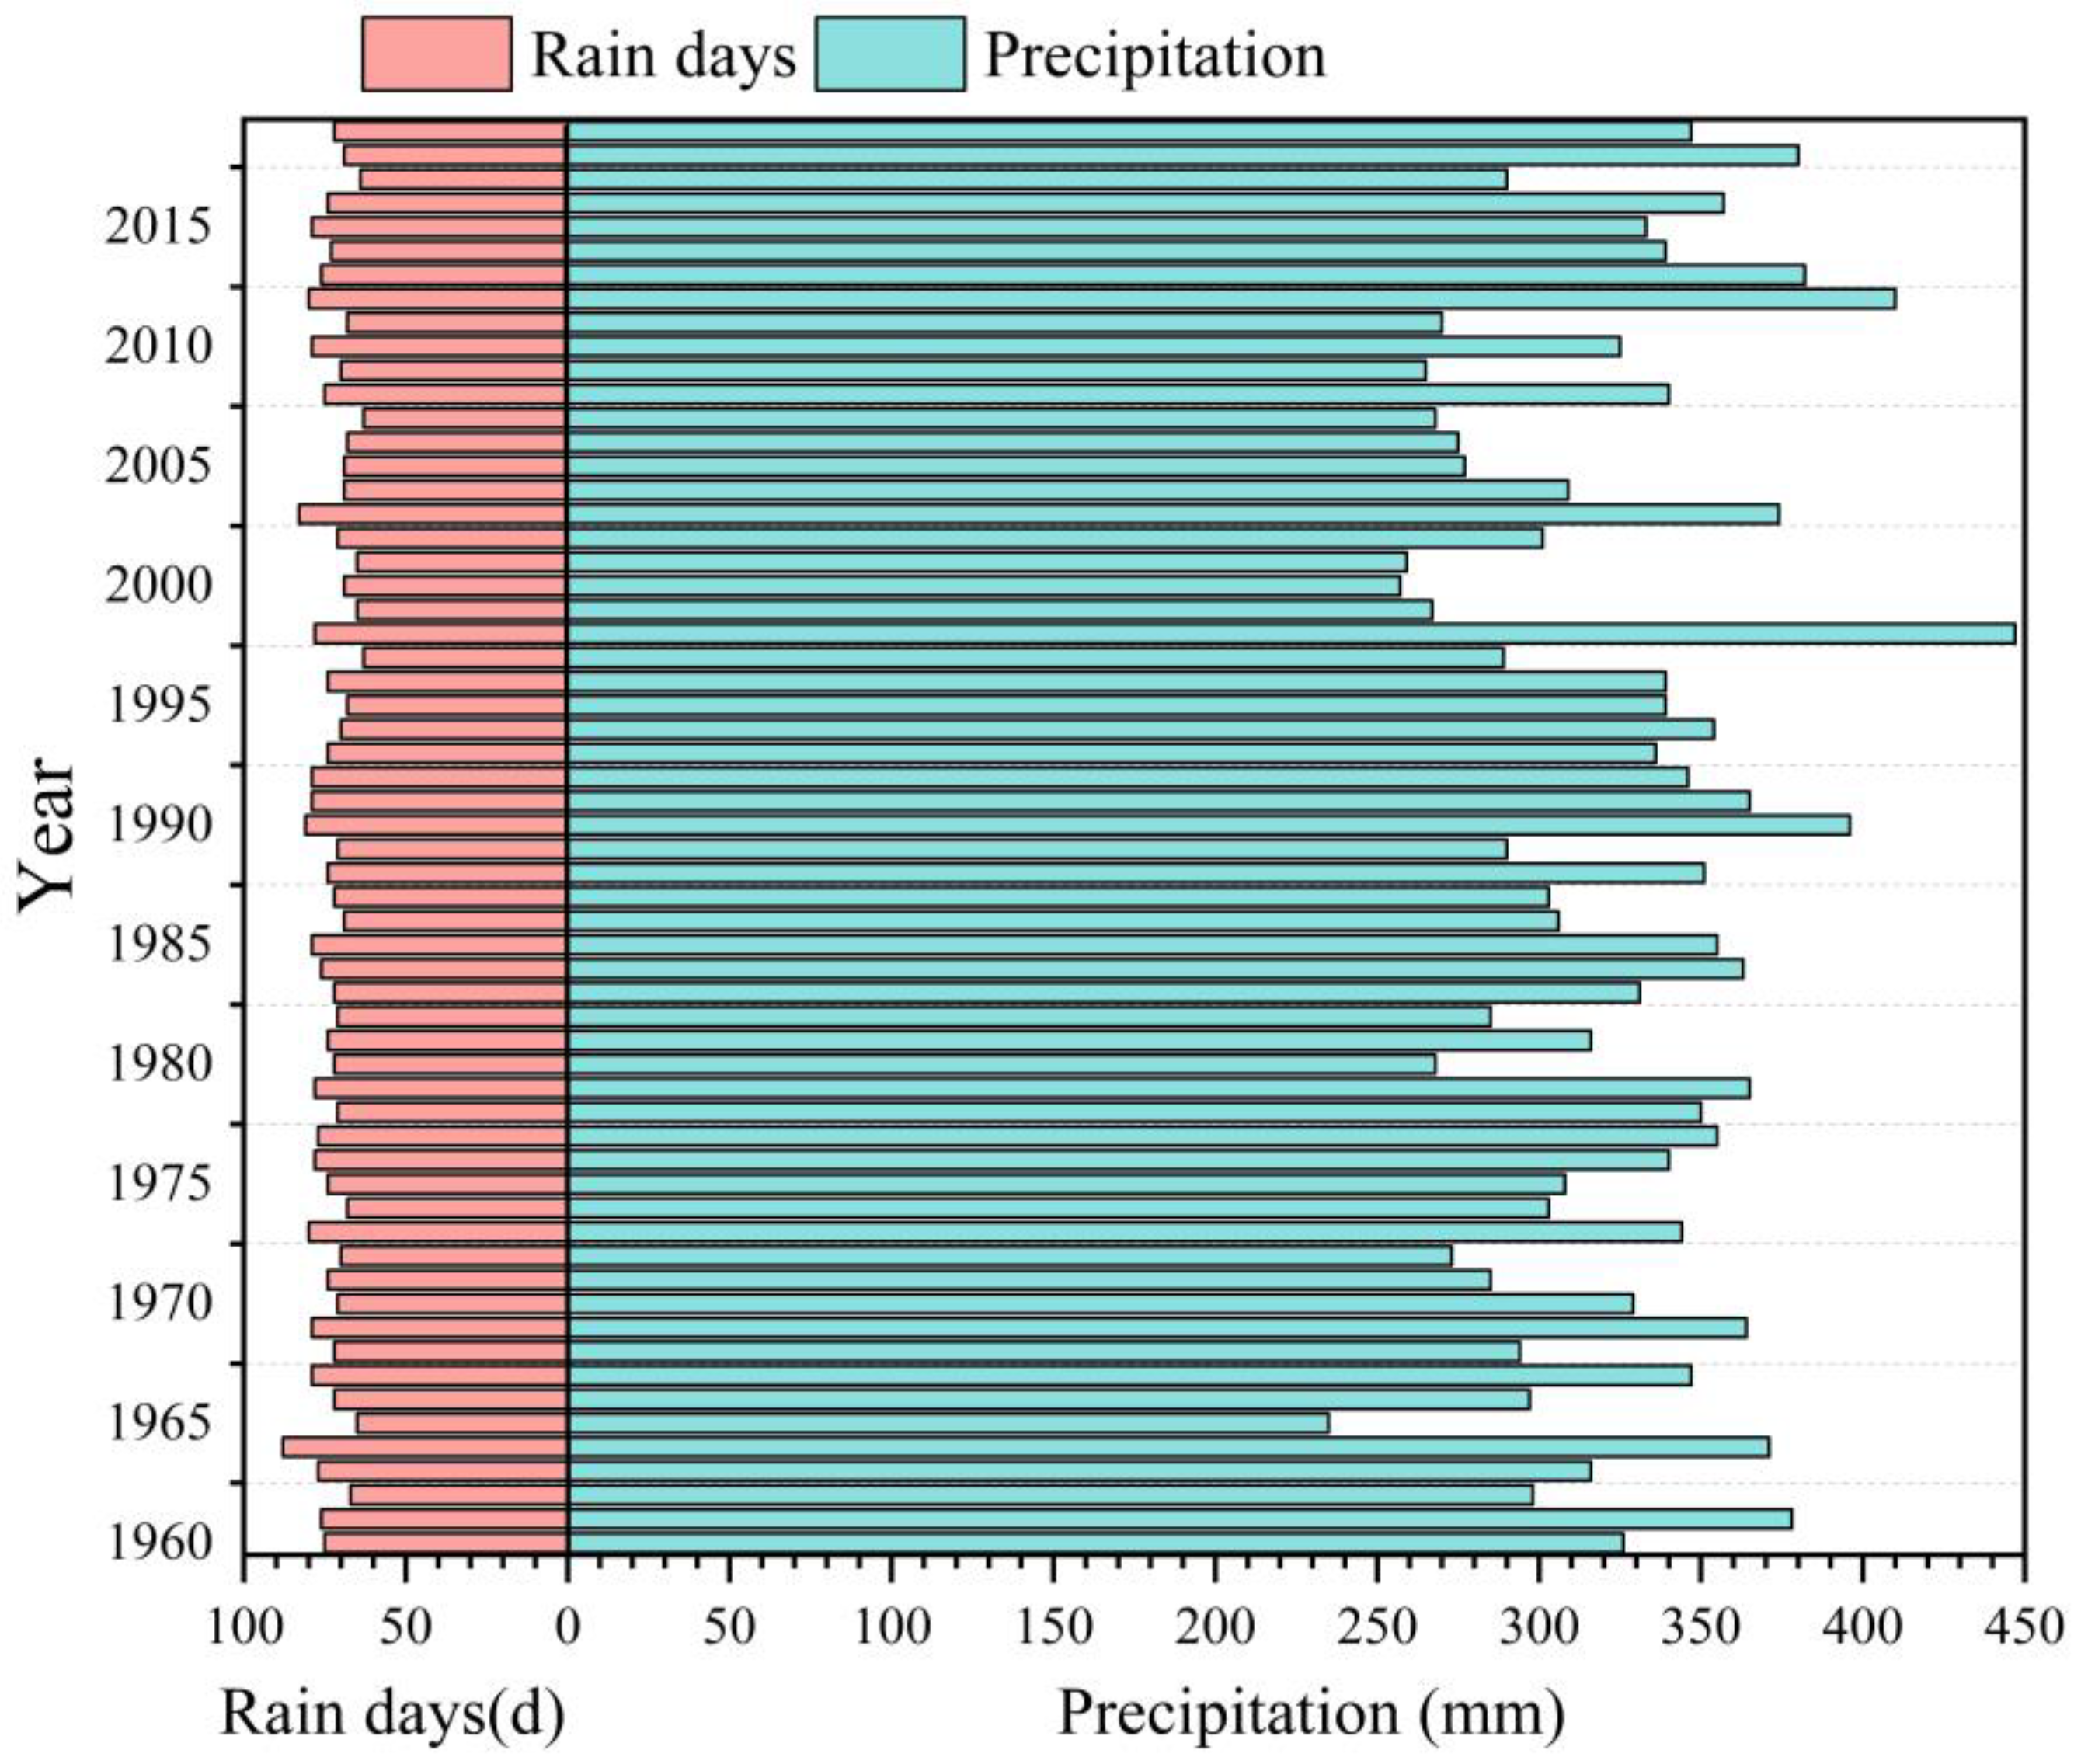
The relationship between drought occurrence and precipitation was intertwined. The average annual precipitation and rain days for the entire study area were calculated based on the statistics for all stations in the study area (
Figure 5). The average annual precipitation in Inner Mongolia significantly fluctuated at about 325 mm. In addition, a nearly two-fold difference was found between the maximum (447 mm) and minimum (235 mm) annual precipitation. Multi-year precipitation exhibited a weak upward trend, although it was not significantly different overall. The variation in rain days was relatively small, accounting for approximately 20% of the total days in a year. The difference between the maximum and minimum annual rain days was around 40%. The multi-year trend in rain days exhibited a weak decreasing trend that was also not significantly different. Despite having opposite trends, a relatively good overall correlation was observed between the two, with a corresponding correlation coefficient (R) of 0.71.
Most of Inner Mongolia is situated in arid and semi-arid regions; thus, precipitation is relatively concentrated. Light to moderate rainfall occurs almost every year, while heavy rainfall, especially torrential rain, occurs less frequently, with some stations reporting no occurrences of torrential rain. When calculating the multi-year averages for heavy and torrential rainfall, the statistical analyses were based on actual years of occurrence. The multi-year averages precipitation of different grades are shown in
Figure 6. Significant differences were observed for the multi-year average of light rainfall, ranging from 27.2 mm to 220 mm. Noticeable differences were observed between the eastern and western regions, roughly divided by longitude 110°E. In the eastern region, the multi-year average of light rainfall was generally above 100 mm, but it was below 100 mm in the western region. High-value areas for light rainfall were concentrated in the northeastern region of Inner Mongolia and the Hetao region. The multi-year average of moderate rainfall was similar to that of light rainfall, with high-value areas concentrated in the northeastern region of Inner Mongolia and the Hetao region, although the north–south differences were more pronounced than for light rainfall.
Regarding the timing of rains, moderate rainfall was rare during the colder winter months. The differences in rainfall event distributions between the eastern and western regions of Inner Mongolia were particularly pronounced for heavy rainfall. High-value areas were predominantly found in the southeastern part of the region, roughly delineated by longitude of 115°E. In the western region, the multi-year average of heavy rainfall remained below 70 mm, with only a few exceptions at specific stations. The concentrated patterns of precipitation in Inner Mongolia caused heavy rainfall to mainly occur during the rainy season months, while almost no torrential rain was recorded in western Inner Mongolia (
Figure 6d). The high-value areas for the multi-year average of torrential rains were primarily concentrated in southeastern Inner Mongolia, significantly contributing to the region’s annual precipitation totals.
3.3. Spatiotemporal Distribution of Rain Days Exhibiting Different Grades
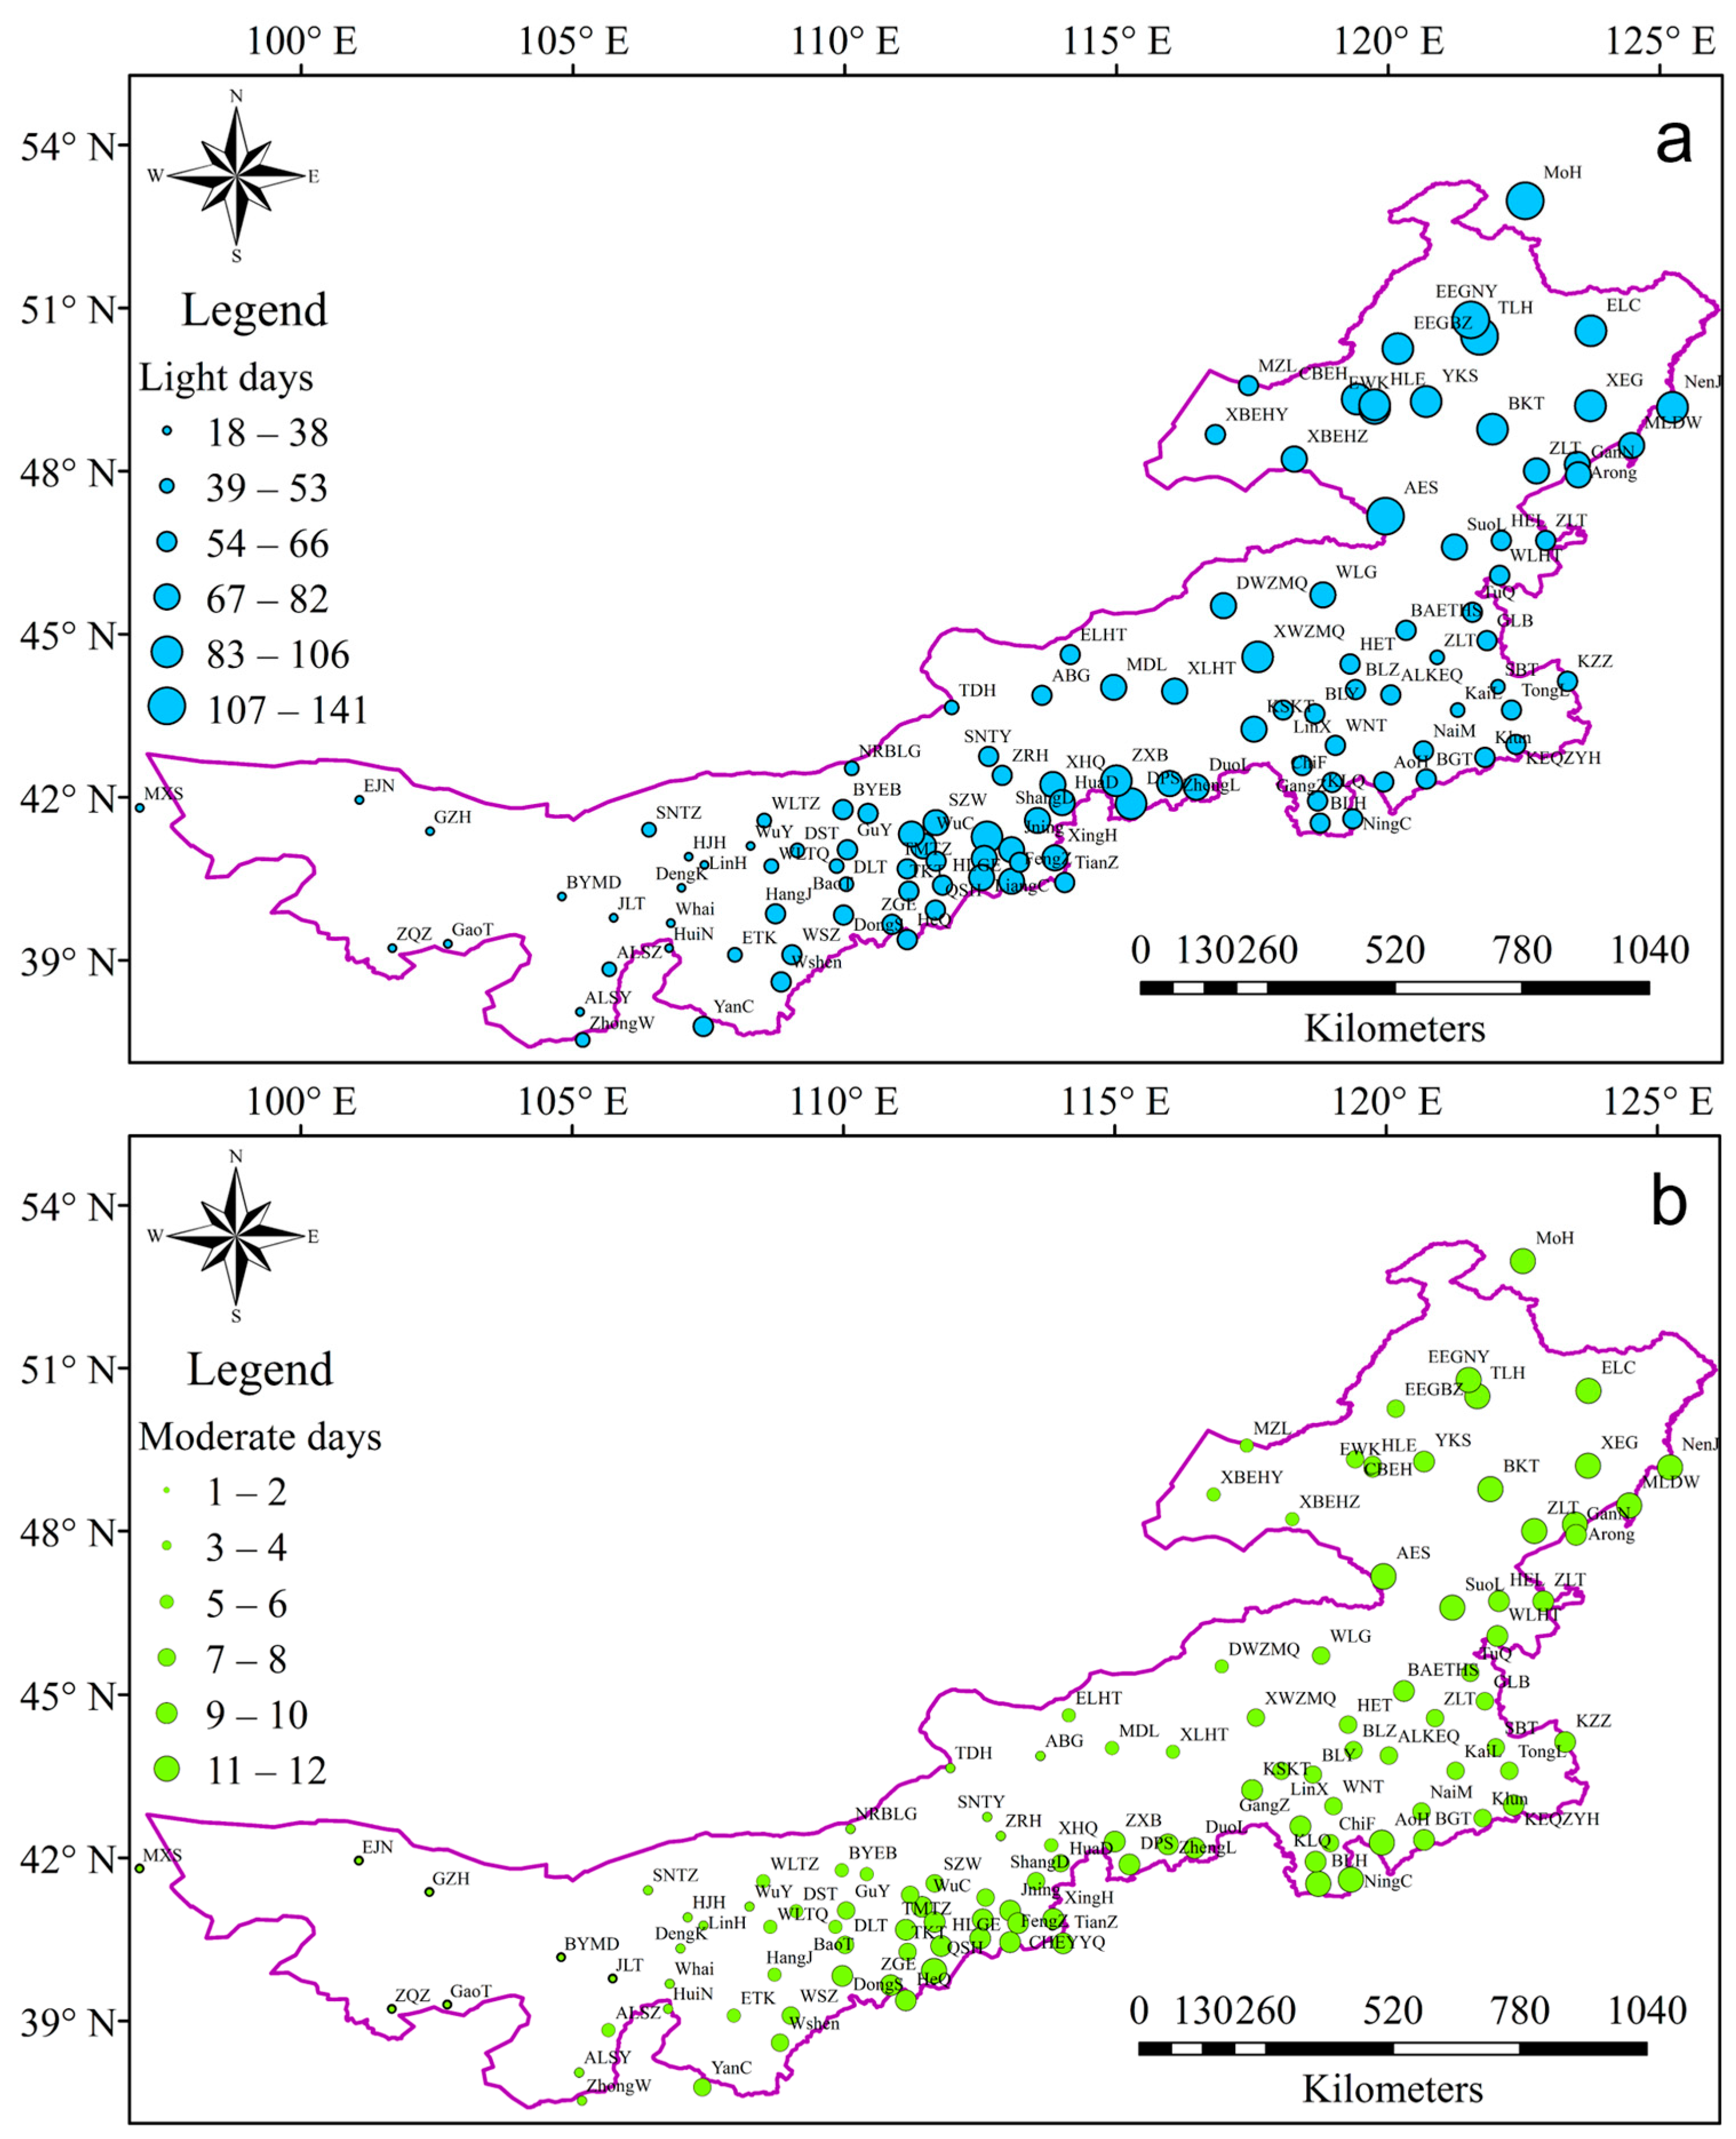
The spatial distribution of the multi-year average of light and moderate rain days in Inner Mongolia are shown in
Figure 7. The number of light rain days decreased from east to west, with high-value areas primarily concentrated in the northeastern region of Inner Mongolia, averaging around 80 days per year. In the western regions of Inner Mongolia, the multi-year average of light rain days was less than 50 days per year. Fewer occurrences of moderate rain days were observed on average, and the difference in moderate rain days was relatively small compared with light rain days. The multi-year average moderate rain days exhibited greater occurrences in the south and fewer occurrences in the north, with high-value areas primarily concentrated in the northeastern region of Inner Mongolia and the Hetao region, while low-value areas were concentrated in the western region of Inner Mongolia.
By analyzing the percentage of light rain days and moderate rain days in relation to the total number of annual precipitation days, it was observed that light rain days accounted for over 80% of the total, yet they contributed to less than half of the annual precipitation. Notably, the drier the region, the higher the proportion of light rain days. In contrast, moderate rain days accounted for less than 18% of the total, but they contributed to more than 30% of the total annual precipitation, with a greater proportion found in areas that experienced higher rainfall.
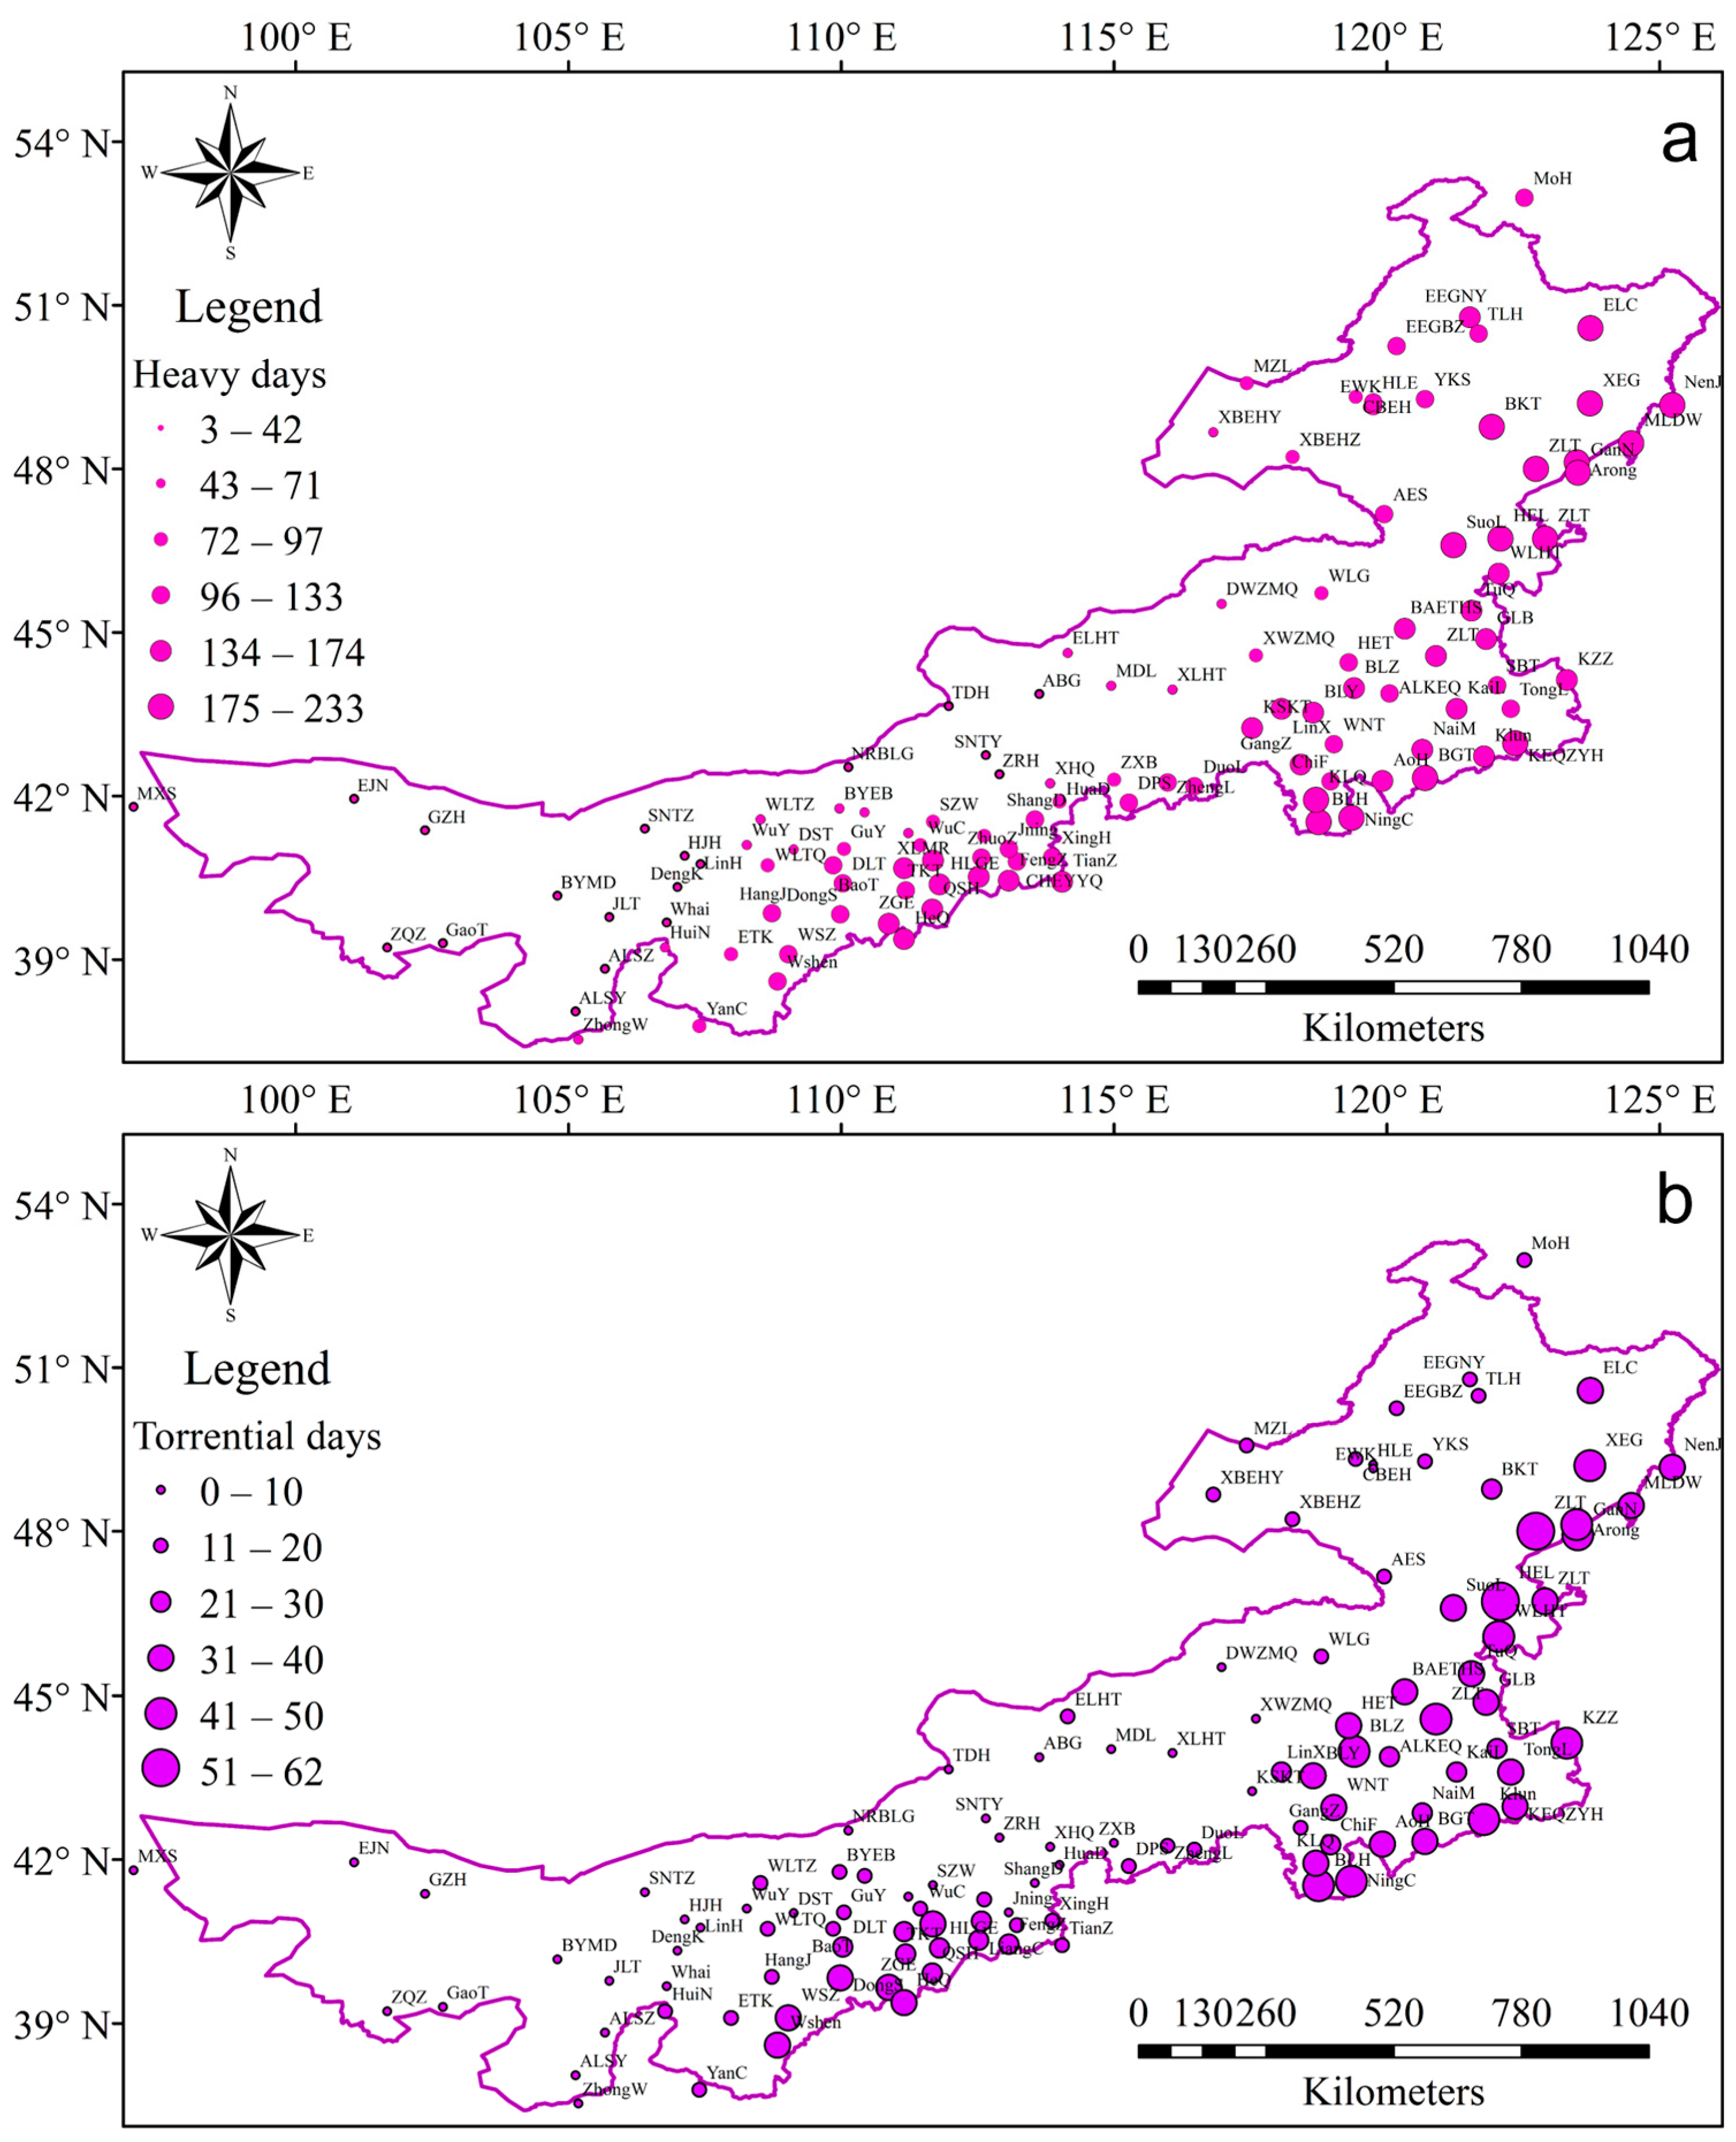
Due to the infrequency of heavy and torrential rainfall in Inner Mongolia, multi-year accumulations were used when analyzing rain days to facilitate the differentiation of spatial distributions. Both heavy and torrential rain events were more prevalent in the south and east than in the north and west (
Figure 8). Most stations in the eastern region, delineated by longitude 115°E, exhibited a multi-year accumulation of heavy rainfall days of around 100 days. However, most of the stations in the western region exhibited fewer than 90 heavy rainfall days when considering multi-year accumulation. The east–west difference in the multi-year accumulation of torrential rain days was even more pronounced. In the east, torrential rain primarily occurred in the southeast at an average of once per year at most. In the west, torrential rain predominantly occurred in the Hetao region, with most areas experiencing torrential rains approximately once every 6 years.
3.4. Relationship Between the SPI and Precipitation of Different Grades
The climate trend coefficients were used to analyze the variation in SPI_Month and SPI_Year trends, in addition to the variation in different precipitation levels among the 116 stations in the study area. Over 92% of the stations exhibited coefficients > 0 for SPI_Month, and over 62% of the stations exhibited coefficients > 0 for SPI_Year. These results suggested a trend of alleviated drought in Inner Mongolia, consistent with previous studies. Regarding the different levels of precipitation, 48% of the stations exhibited increased light rainfall, while 52% of the stations exhibited decreasing trends. In addition, 71% of the stations exhibited increased moderate rainfall, while 29% of the stations exhibited a decreasing trend. Considering heavy rainfall, 58% of the stations exhibited increasing trends, while 42% of the stations exhibited decreasing trends. Further, 50% of the stations exhibited increasing torrential rainfall, while 47% of the stations exhibited decreasing trends. In terms of total precipitation, 64% of the stations exhibited increasing trends, while 36% of the stations exhibited decreasing trends, with increased moderate rainfall significantly contributing to overall precipitation changes.
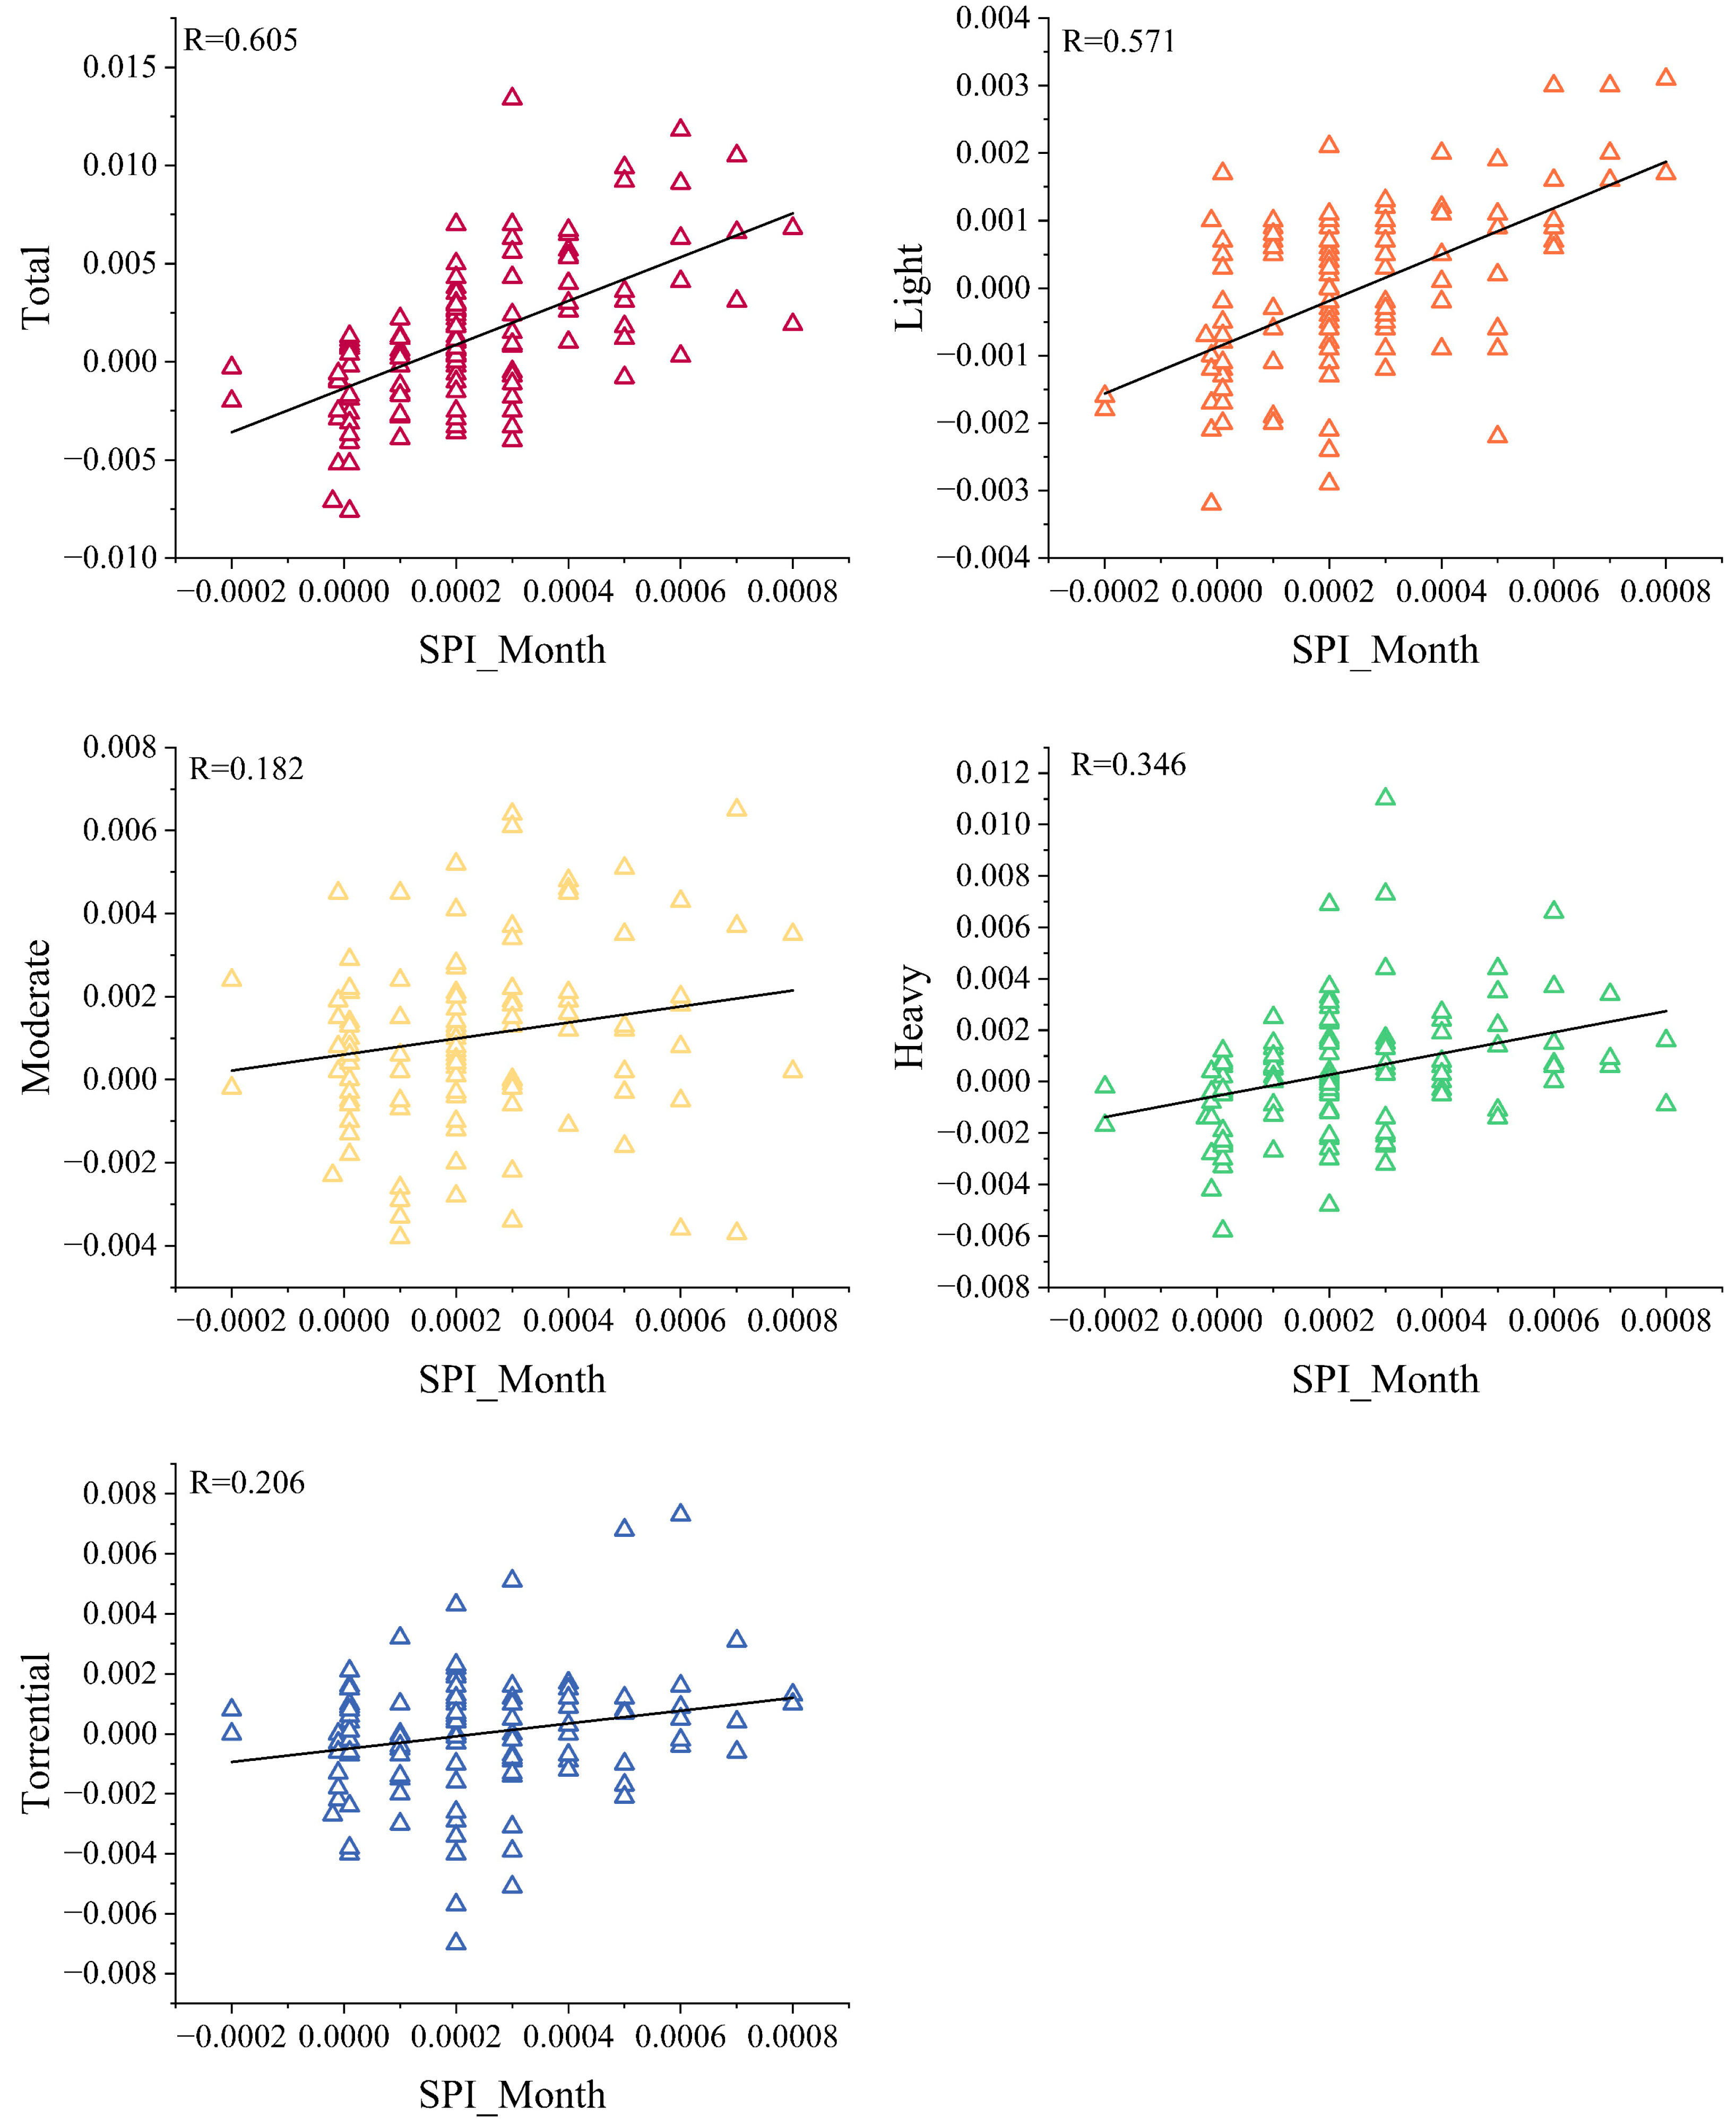
The correlation between the trend coefficients of SPI_Month and different grades of precipitation was evaluated to determine the impacts of various levels of precipitation on drought (
Figure 9). Overall, variation in the monthly SPI exhibited the strongest correlation with total precipitation, followed by light rainfall, and it exhibited a weak correlation with moderate rainfall. Among the four different precipitation grades, the correlation between the monthly SPI and light rainfall was the strongest. This correlation was primarily attributed to the significant proportion of days with light rainfall compared with the total rain days, especially during the dry seasons. In addition, light rainfall tended to be more evenly distributed over time than the other grades of precipitation. The weaker correlation with moderate rainfall may be due to its greater temporal variability.
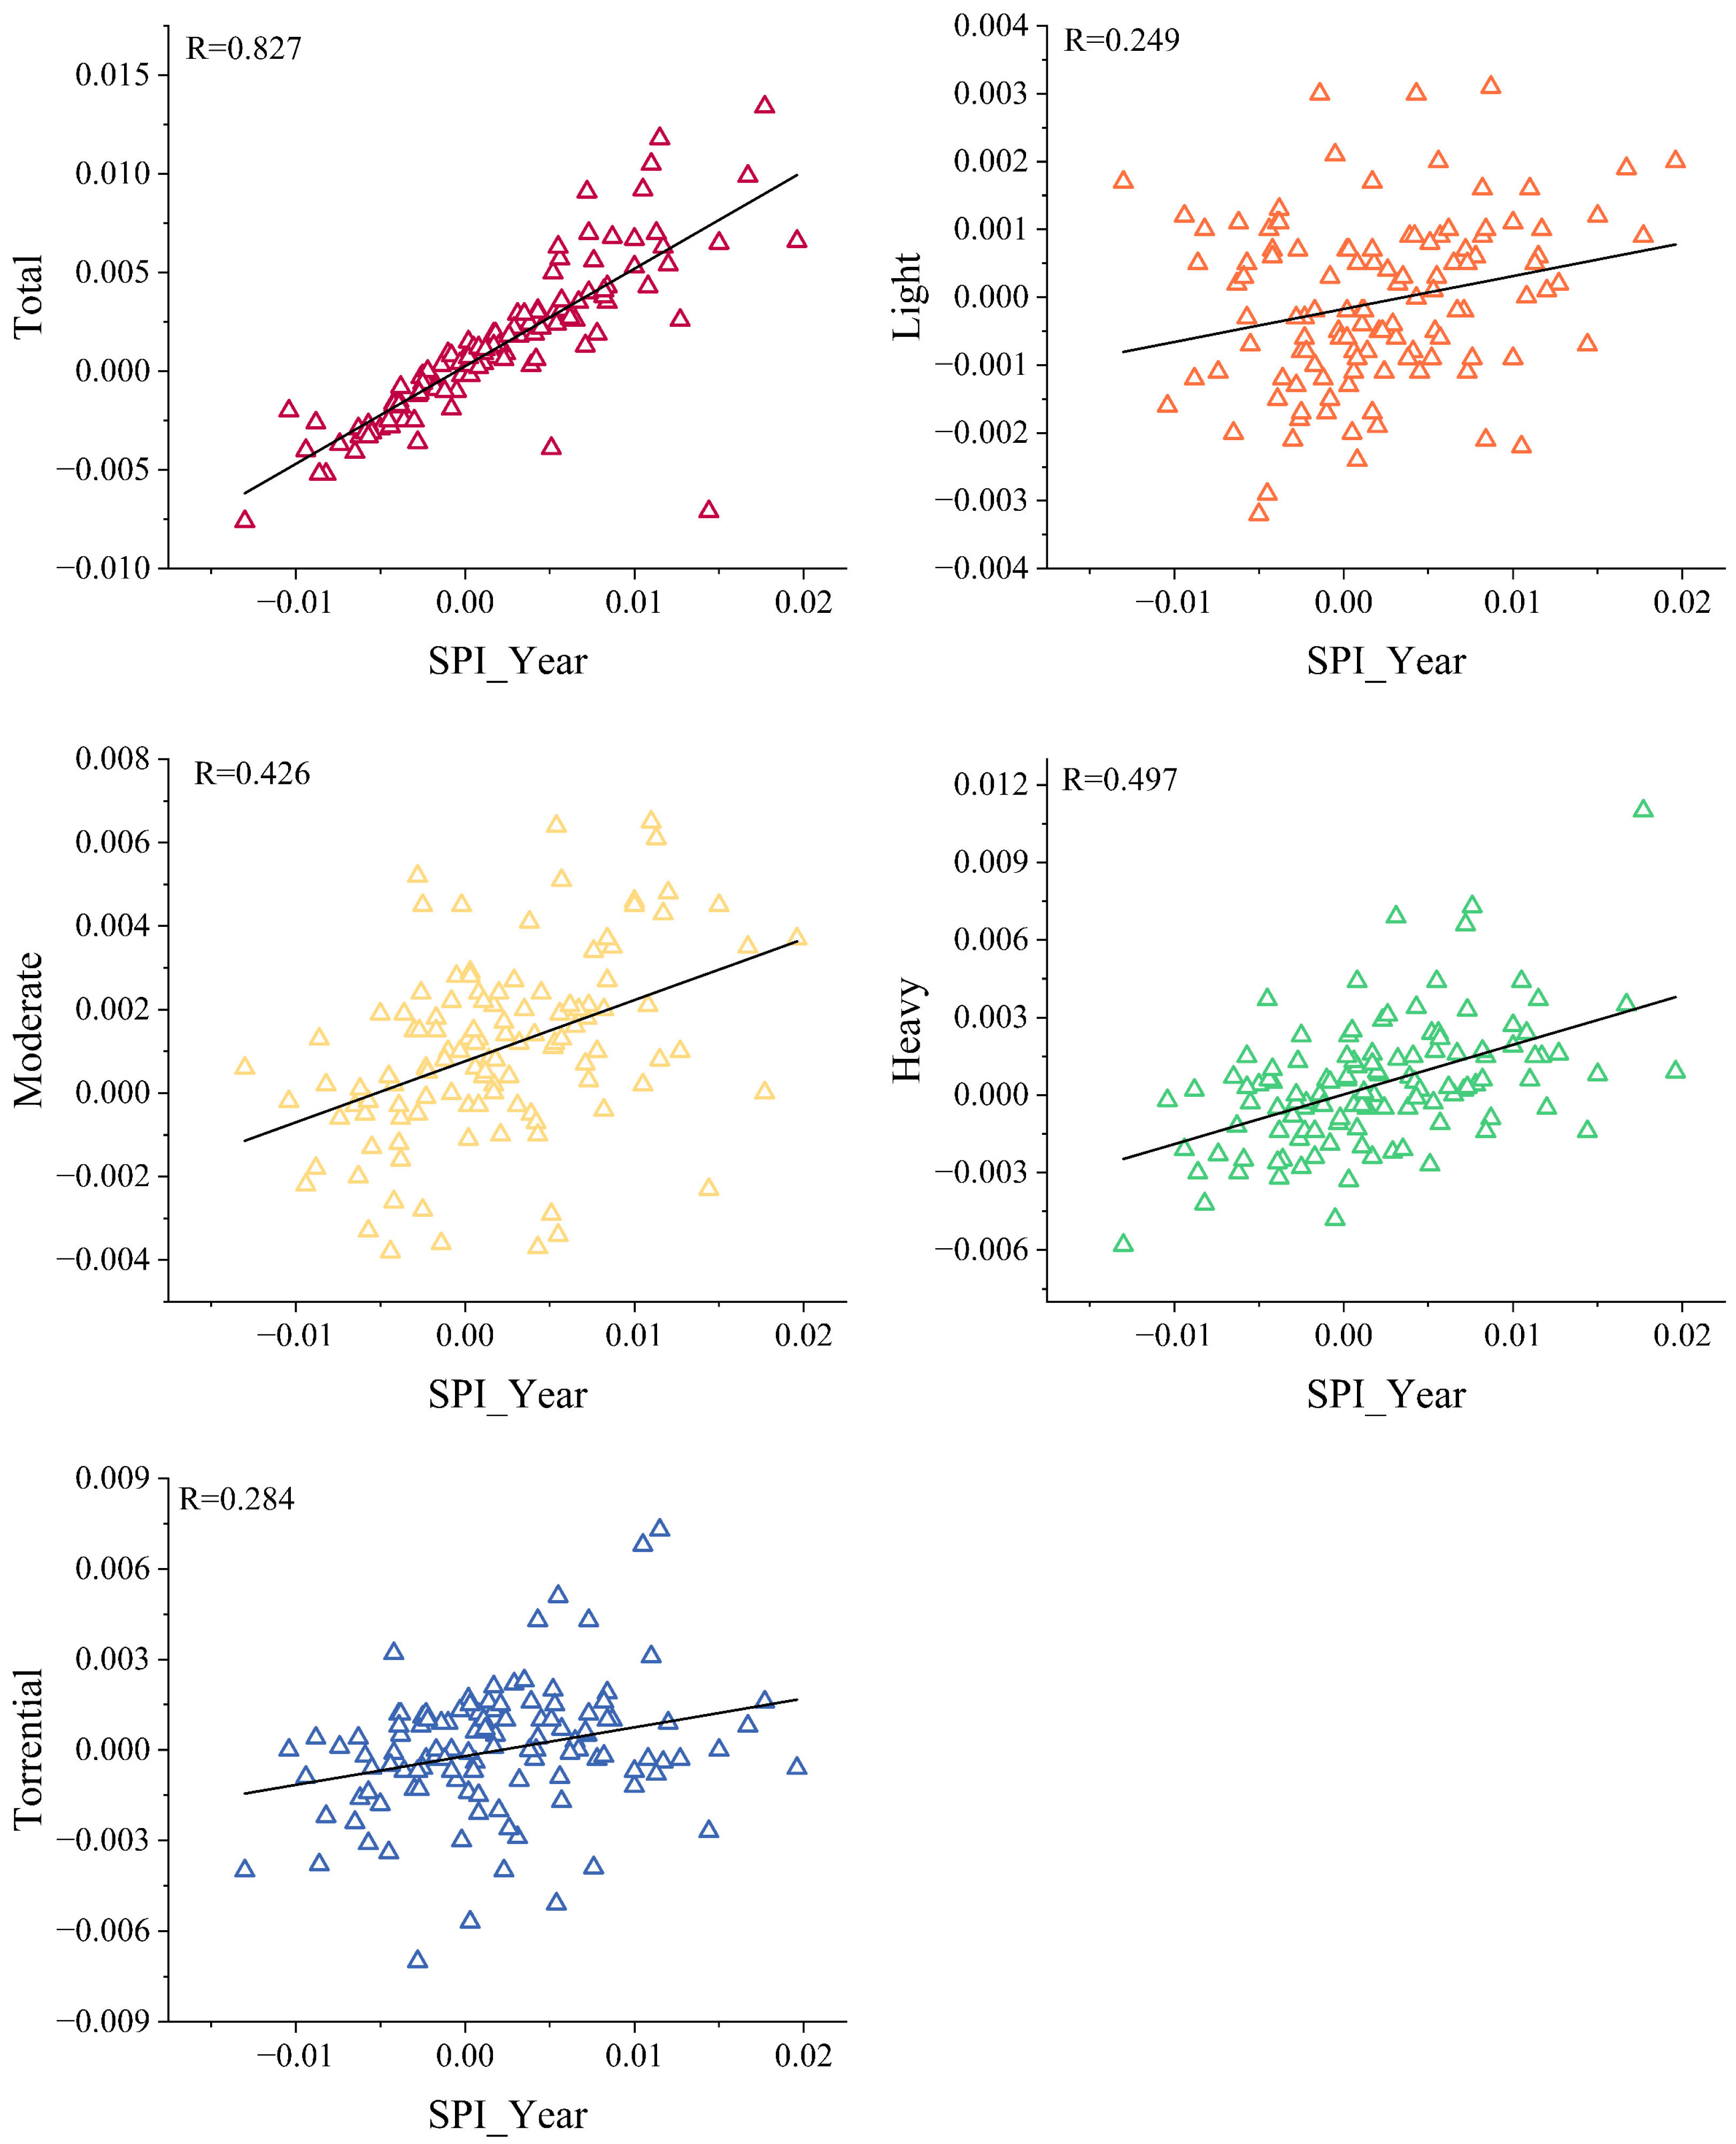
The correlation between the SPI_Year trend coefficients and different grades of precipitation is shown in
Figure 10. The SPI_Year trend exhibited the strongest correlation with total precipitation, followed by heavy rainfall and then moderate rainfall, and the weakest correlation was observed for extreme rainfall. In the Inner Mongolia region, the contributions to precipitation followed the order of moderate rainfall, heavy rainfall, light rainfall, and extreme rainfall. Similarly, the changes in drought conditions were generally consistent with the variation in these contributions.
4. Discussion
The characteristics of and the variation in drought in Inner Mongolia are influenced not only by proximity to the ocean, elongated east–west geographical differences, and climate change but also by various other factors. Previous studies have indicated that the East Asian summer monsoon significantly weakened from the late 1970s to the early 21st century, resulting in reduced precipitation in northern China and a notable trend toward aridification [
40,
41,
42]. However, a period of interdecadal variation in the East Asian monsoon from weak to strong occurred between 2003 and 2005, leading to some alleviation of drought conditions in northern China over the past decade [
43]. In [
44], it was found that inter-annual precipitation increased in spring, autumn, and winter, but it was the opposite in summer. A noticeable increase in both the intensity and coverage of drought in the eastern and central parts of Inner Mongolia has occurred since the 1990s, while a decrease has been observed in the western region. These differences may be attributed to the uneven distribution of precipitation following an abrupt temperature change in Inner Mongolia in the mid-1980s, with decreasing precipitation observed in the eastern and central regions, along with a significant increasing trend in the western region [
45]. However, some studies have indicated that it occurred after 2000 [
46,
47]; this discrepancy may arise from differences in data sequence lengths and analytical methods.
The western region is characterized by desert and desert areas, wherein surface soil properties minimally influence changes in precipitation and evaporation. The impact of land degradation on regional climate mainly manifests as a decrease in summer precipitation and an increase in temperature, further exacerbating the drought situation in the region, and human activities have intensified this process [
48]. However, the central and eastern pastoral–agricultural transition zones are influenced by climate backgrounds including temperature increases, precipitation decreases, and changes in soil moisture content, leading to increased aridification. Therefore, the decreased drought intensity and coverage in western Inner Mongolia may be associated with changes in background climate including slight temperature increases and significant precipitation increases. The dry–wet climatic characteristics of Inner Mongolia were found to exhibit clear temporal and spatial variability and complexity, consistent with previous studies [
49]. Consequently, using a single meteorological drought index is not often adequate to provide a comprehensive understanding of drought evolution characteristics. To achieve precise monitoring and defense against drought disasters in the future, a combination of indicators such as agricultural drought, hydrological drought, and socio-economic drought is needed to conduct targeted analyses of drought characteristics under different underlying surface conditions in Inner Mongolia.
The eastern, central, and western regions of Inner Mongolia are influenced by the westerly circulation and plateau monsoons, which exhibit distinct temporal and spatial variation and complexity in terms of dry and wet characteristics. Vegetation in the central and eastern pastoral–agricultural transition zones has noticeably degraded, leading to increased evaporation to some extent. Consequently, the increased drought intensity and coverage in the eastern and central regions may be related to background climate changes, that is, temperature increases, precipitation decreases, and changes in underlying surfaces. The western region is characterized by desert areas that experience minimal influence from changes in precipitation and evaporation due to surface soil properties. However, the central and eastern pastoral–agricultural transition zones are influenced by background changes in climate including temperature increases, precipitation decreases, and changes in soil moisture content, leading to increased aridification [
48]. Therefore, the decreased drought intensity and coverage in western Inner Mongolia may be associated with background climate changes including slight temperature increases and significant precipitation increases. The climatic dry–wet characteristics of Inner Mongolia exhibit clear temporal and spatial variability and complexity. Consequently, using a single meteorological drought index often fails to comprehensively characterize drought evolution. Achieving the precise monitoring and mitigation of drought disasters in the future will require the integration of indicators such as agricultural drought, hydrological drought, and socio-economic drought in order to obtain a better understanding of drought characteristics in Inner Mongolia under different underlying surface conditions.
In [
50], the CMIP6 model was used to analyze the 700 hPa divergence wind field, as well as the 700 hPa and 500 hPa water vapor flux divergence fields across China under three different scenarios at the end of the 21st century. The results showed that the Bay of Bengal–South China Sea–Western Pacific regions function as a water vapor sink in summer, primarily due to water vapor convergence. In contrast, a divergence in water vapor flux was observed over most of northern Xinjiang, Inner Mongolia, and the Qinghai-Tibet Plateau. This suggests that the dispersal of water vapor in these regions plays a significant role in exacerbating drought conditions or reducing humidity levels. Meanwhile, the results indicated that the average annual runoff in most regions of China is increasing in the 21st century, with the rate of increase becoming more pronounced over time and with higher emission scenarios. The northwest, Inner Mongolia, and northeast regions exhibit the largest growth rates, with projections suggesting that by the end of the 21st century, their maximum growth rates could exceed 40% compared with the benchmark period. Conversely, the overall average annual soil moisture in China is trending downward, displaying a spatial pattern characterized by an increase in the north and a decrease in the south. Notably, the northwest, Inner Mongolia, and north China regions are experiencing an upward trend in soil moisture, with this trend intensifying over time and in response to rising emission pathways.


