Article

The Bioaccumulation of Potentially Toxic Elements in the Organs of Phragmites australis and Their Application as Indicators of Pollution (Bug River, Poland)

by
Elżbieta Skorbiłowicz
1,
Mirosław Skorbiłowicz
1 and
Marcin Sidoruk
2,*
1
Department of Technology in Environmental Engineering, Faculty of Civil Engineering and Environmental Sciences, Bialystok University of Technology, Wiejska 45E, 15-351 Białystok, Poland
2
Department of Water Resources and Climatology, Faculty of Agriculture and Forestry, University of Warmia and Mazury in Olsztyn, Plac Łódzki 2, 10-719 Olsztyn, Poland
*
Author to whom correspondence should be addressed.
Water 2024, 16(22), 3294; https://doi.org/10.3390/w16223294
Submission received: 17 October 2024 / Revised: 12 November 2024 / Accepted: 15 November 2024 / Published: 17 November 2024
(This article belongs to the Special Issue Advance in Hydrology and Hydraulics of the River System Research 2025)

Abstract

:
The bioaccumulation of potentially toxic elements (PTEs) in aquatic plants is critical in assessing the quality of aquatic environments and the risks associated with anthropogenic activities. This research involved using Phragmites australis as a bioindicator in a comprehensive assessment of the spatial variation in pollution within the Bug River catchment, employing advanced statistical methods to identify pollution sources. The study aimed to investigate the bioaccumulation of PTEs in different parts of the P. australis plant and to evaluate their suitability as bioindicators of contamination. Plant samples were collected from 32 locations in the Bug River catchment, and the concentrations of metals such as Cd, Pb, Cr, Ni, Zn, Cu, Fe, and Mn were determined by atomic absorption spectrometry. The results indicated that PTE accumulation was highest in the roots, underscoring their crucial role in monitoring metal concentrations. Metal concentrations differed based on land use within the catchment area, with the highest levels observed in urbanized regions, highlighting the significant impact of human activities like wastewater discharge and transport emissions. The highest concentrations were observed for Fe, Mn, and Zn, while Cd concentrations were notably elevated in agricultural areas. The analyses confirmed that P. australis serves as an effective bioindicator of heavy metal contamination and can be employed in long-term biomonitoring programs.

1. Introduction

The water quality in rivers depends mainly on human activities within both the watercourse and the entire catchment [1]. Anthropopressure leads to the emission of potentially toxic elements (PTEs), which exhibit high concentrations, persistence, and toxicity in the environment [2,3]. PTEs are harmful to the environment and human health [4,5] and can come from both natural sources (sedimentary rocks and volcanic eruptions) and anthropogenic sources, such as industry, agriculture, mining, and wastewater [6,7].
The spatially and temporally variable concentrations of PTEs in rivers depend on the chemical, physical, and biological processes taking place in the riverbed and catchment. Geographic conditions and land use significantly affect the quantity and quality of substances delivered to rivers [4]. Aquatic ecosystems are an integral part of sustainable development and public health, but they are threatened by human activities that introduce PTEs such as lead, cadmium, chromium, and zinc into waters. The Bug River in Poland is exposed to pollution from industrial, agricultural, and urban sources. Traditional monitoring methods often fail to account for bioavailable fractions, so bioindicators such as Phragmites australis, which absorb PTEs from water and sediment, are increasingly being used [8].
Assessing PTEs in water and river sediment provides information on the total pollution load in the ecosystem, but biomonitoring, based on the analysis of PTEs in the tissues of aquatic organisms, can provide more integrated and long-term data [4,8]. Aquatic plants accumulate pollutants throughout the growing season, allowing the monitoring of environmental quality over a longer period [9,10].
P. australis is an effective bioindicator of heavy metals and tolerates higher concentrations of PTEs than those present in water [11,12]. PTE accumulation in plants depends on environmental factors, metal transport mechanisms, and elemental interactions [11,13]. Analysis of PTE concentrations in various plant organs (roots, stems, and leaves) provides knowledge about bioaccumulation mechanisms and the degree of environmental contamination. Aquatic plants can absorb PTEs through both the roots and leaves, making them practical biomonitoring tools [14]. Identifying the plant organ that accumulates the most trace elements is important for monitoring programs [9,15].
In recent years, plants have become increasingly important as bioindicators of pollution. Patra and Sharma [13] showed that P. australis is an effective bioindicator of metals in polluted waters and soils. Marmiroli et al. [16] developed a new biomonitoring index based on macrophytes, while Franzaring et al. [17] highlighted the use of plants in air quality monitoring, demonstrating their utility in both water studies and atmospheric pollution assessment. Plants as bioindicators represent an effective and economical tool in assessing and managing the condition of natural and human-altered ecosystems.
This study aimed to investigate the ability of P. australis to uptake, translocate, and accumulate PTEs in different parts of its structure (roots, stems, and leaves). The research involved samples collected from the Bug River and its main tributaries in Poland, with the objectives of (1) determining the metal content (Pb, Cr, Cu, Zn, Ni, Cd, Fe, and Mn) in various parts of the plant and assessing differences in metal concentrations between specific plant organs; (2) examining the impact of land use (urban, agricultural, and forested areas) on the spatial distribution of PTEs in plants; and (3) identifying local sources of PTE pollution in the Bug River catchment using multivariate analysis, which is crucial to water quality management in this region.
Using P. australis as a bioindicator of PTE pollution in rivers like the Bug allows for a more effective assessment of human impacts on aquatic ecosystems and the development of more precise water quality management strategies. The novelty of the research lies in its holistic approach, integrating bioaccumulation data into land use analysis and advanced statistical methods to understand pollution dynamics and guide remediation efforts.

2. Materials and Methods
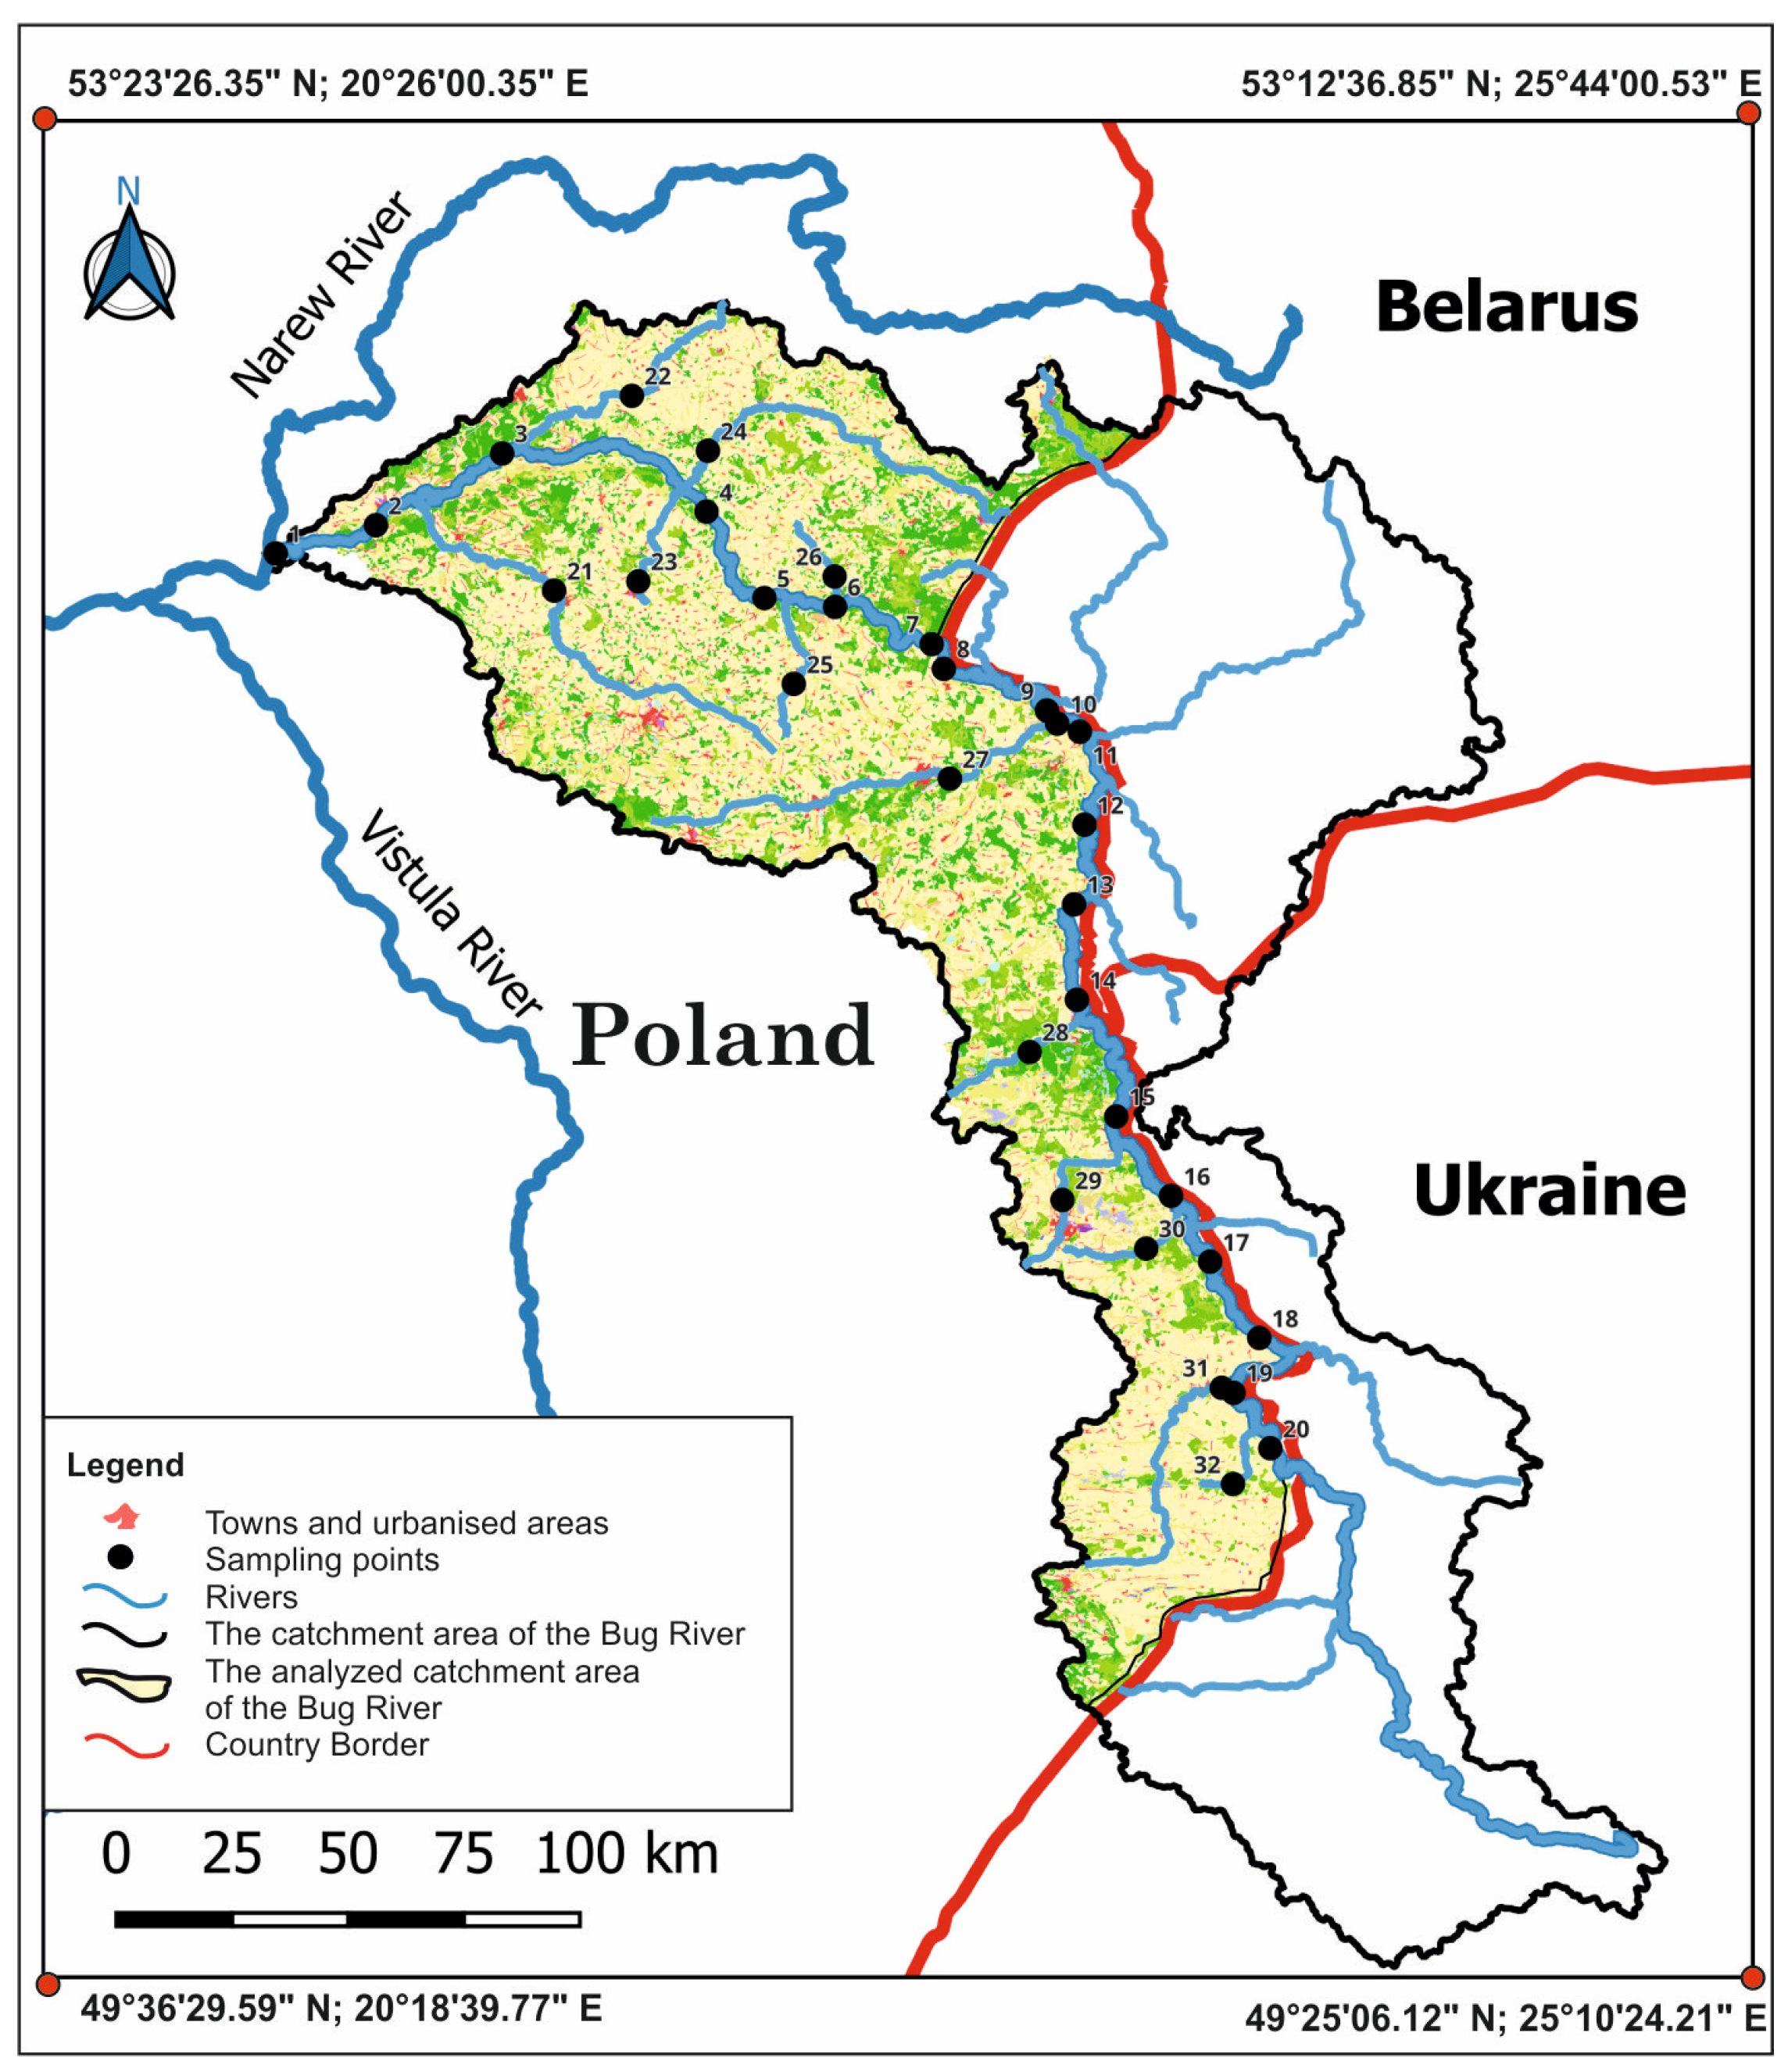
2.1. Study Area

The subject of this study is the Bug River, the fourth-largest river in Poland. It is a typical lowland river with gentle gradients. The total drop in elevation of the river is approximately 185 m, from its source in Ukraine (around 310 m above sea level) to its confluence with the Narew River (approximately 125 m above sea level). The average gradient of the Bug River over its entire length is about 0.25‰. The riverbed meanders, forming numerous bends and oxbow lakes. A high level of naturalness characterizes the landscape of the river valley. The total length of the Bug River is 772 km. Its source and upper section, measuring 185 km, are in Ukraine. In its middle course, throughout 363 km, the Bug River forms a natural border between the Republic of Poland and Ukraine (185 km) and Belarus (178 km) (Figure 1). The remaining 224 km flows through Polish territory, where the Bug discharges into the Narew River in the area of the Zegrzyński Reservoir. The catchment area in Poland covers 39,420 km2. Brown soils, podzolic soils, luvisols, chernozems, rendzinas, and alluvial soils dominate in the Bug catchment area. Agricultural land accounts for 50.3%, meadows and pastures make up 17.7%, and forests cover 23.5% of the catchment area.
The climate of the study area is classified as temperate and warm transitional. The average temperature is 11.8 °C, and the growing season lasts about 200 days. The area receives an average of 600 mm of precipitation annually, with the maximum occurring in the summer months (June to September, which can account for up to half of the annual rainfall). The river valley landscape is distinguished by a high level of natural integrity, with 14% of the area legally protected. The catchment area encompasses sections of the Biała Forest, Kamieniecka Forest, Nadbużański Landscape Park, and multiple nature reserves.
The primary human activities in the catchment area are tourism and agriculture, with less emphasis on industrial activity. The most developed industry is the food processing sector, which includes the bakery, dairy, sugar, meat, and fruit and vegetable processing industries. Other industries include ceramics, machinery and metalwork, light, cement, and electrotechnology. The region is dominated by small towns, with only three larger cities: Siedlce (72,858 inhabitants), Chełm (69,016), and Biała Podlaska (55,424).
Vehicle emissions, untreated municipal and industrial wastewater, and wastewater from Ukraine’s mines and industrial facilities are the main anthropogenic factors threatening the ecological stability of the Bug River catchment. Additionally, other point and non-point sources of pollution contribute to the environmental pressures on the region.

2.2. Plant Sampling and Analytical Procedures

Fieldwork in the Bug River catchment area was conducted in 2018, 2019, and 2020. A total of 32 sampling points were established, with 20 positioned along the Bug River and 12 on its tributaries, including the Liwiec, Brok, Cetynia, Nurzec, Toczna, Kamianka, Krzna, Włodawka, Uherka, Udal, Huczwa, and Bukowa rivers. The selection of both the number and locations of these sampling points was guided by land use types in the catchment area, encompassing urban, agricultural, and forested regions. The urban group included sampling points 2, 10, 14, 19, 23, 26, 28, and 30, situated near densely populated areas such as Wyszków (26,965 residents), Włodawa (13,535), Hrubieszów (18,212), and Siemiatycze (15,169), as well as along roads close to smaller towns and residential buildings. The second group (forested areas) comprised points 3, 5, 6, 7, 11, 15, 17, 22, 24, 27, and 32, located within forest complexes, most protected under the Natura 2000 program. The third group (agricultural areas) included points 1, 4, 8, 9, 12, 13, 16, 18, 20, 21, 25, 29, and 31 adjacent to agricultural lands, including areas designated for livestock grazing (Figure 1).
The macrophyte diversity was relatively low, and P. australis was the most representative species at all sampling points. Plant material was collected in August, the peak of the growing season for common reed, during which bioaccumulation tends to be most intense [18,19]. Sampling was conducted on climatologically identical days to exclude the influence of weather conditions. At each sampling point, 4–6 plants were randomly selected and combined to form a single replicate. The collected macrophytes were thoroughly washed with river water to remove attached sediments and epiphytes. The macrophytes were then divided into three parts (i.e., roots, stems, and leaves) to assess varying bioaccumulation capacities and placed in three labeled polyethene zip-lock bags. In the laboratory, the samples were air-dried at room temperature to a constant weight. Finally, all samples were ground in an agate mortar to obtain a homogeneous powder. The dried and homogenized plant material was placed in Teflon vessels, and 8 ml of HNO3 and 2 ml of 30% H2O2 were added, followed by mineralization in a microwave digestion system (Ethos Easy, Milestone, Italy) according to the manufacturer’s instructions. According to Du Laing et al. [20], mineralization using a microwave digestion system with a mixture of HNO3 and H2O2 is the most suitable method for determining heavy metals in Phragmites australis. The mineralized samples (roots, stems, and leaves) were analyzed for Pb, Cr, Cu, Zn, Ni, Cd, Fe, and Mn content using flame atomic absorption spectrometry (AAS) on an ICE 3500 Thermo Scientific spectrometer. The measurement error was determined by comparing the results with the characteristics of certified reference materials, including grass mix ERM-CD281 and strawberry leaves LGC7162. The calculated measurement error did not exceed 5% of the certified value.

2.3. Statistical Analysis

Statistical analyses were conducted using Statistica software, version 13.3. Calculations included the mean, minimum, maximum values, standard deviation, and coefficient of variation. Data distribution normality was assessed with the Shapiro–Wilk test. Statistical significance was determined based on the error probability with p < 0.05. The significance of differences between the study groups was controlled using one-way ANOVA analysis of variance. Spearman’s correlation, based on the Shapiro–Wilk test, was used to identify relationships between metals at specific locations. The primary sources of the investigated metals were identified using the results of a multivariate statistical analysis (Factor Analysis, FA). The Kaiser–Meyer–Olkin (KMO) and Bartlett test were performed for the elemental content in 75 samples to confirm the appropriateness of using FA. The KMO values ranged from 0.55 to 0.60, and the Bartlett test was statistically significant. Multivariate statistical analysis is frequently employed to identify metal sources [21,22].

3. Results and Discussion

3.1. Content of Potentially Toxic Elements (PTEs) in Phragmites australis

The average concentrations of metals in the organs of P. australis (roots, stems, and leaves) followed the same descending order: Fe > Mn > Zn > Pb > Ni > Cu > Cr > Cd (Table 1). This study demonstrated that metal concentrations in the plant organs did not exhibit significant spatiotemporal variations within the Bug River system. However, the sampling location and the specific plant organ significantly influenced the overall metal content.
The absorption of trace elements was concentrated mainly in the roots. The bioaccumulation of metals followed the order of roots > stems > leaves, with the highest concentrations detected in the roots and the lowest in the leaves (Table 1). The elevated metal concentrations observed in the roots can be attributed to absorption primarily occurring through the root system, with the metal translocation from roots to above-ground plant parts remaining below 1 for most elements. This root accumulation suggests a degree of metal tolerance, likely due to protective mechanisms that restrict the movement of toxic compounds from roots to stems and leaves [23,24,25]. Additionally, plant physiology significantly contributes by selectively excluding certain non-essential metals, thereby safeguarding the above-ground parts [26].
According to Sawidis et al. [27], P. australis can accumulate large amounts of metals due to its parenchyma with sizeable intercellular air spaces. The roots, which are in direct contact with the sediment, facilitate this process. This was confirmed by studies conducted by Bonanno and Giudice [28], which found that metal concentrations in different organs of P. australis followed the order of roots > rhizomes > leaves > stems. Similarly, Cicero-Fernández et al. [29] reported that the roots of P. australis showed a higher accumulation capacity than the shoots. The differences in Pb, Cd, and Cu concentrations between the roots and stems were insignificant, while the concentrations of Cr were similar in the roots, stems, and leaves. However, for Ni, Fe, Mn, and Zn, all four plant organs showed significant differences in accumulation. Kabata-Pendias and Pendias [23] suggested that the transport of trace elements between plant organs depends on the electrochemical properties of the elements.
The measured concentrations of Cr, Cd, Pb, and Fe in the studied plants were higher than the naturally occurring levels of these elements in aquatic plants [23,24]. In contrast, Mn, Zn, Ni, and Cu analyses showed concentrations below phytotoxicity levels. The highest amounts of Fe were recorded, while Cd showed the lowest, which the geochemical properties of these elements can explain. Fe concentrations were approximately 6, 4, and 2 times higher in the roots, stems, and leaves, respectively, compared to natural levels. Iron, however, is an essential element involved in metabolic processes, and its high concentration in the roots of P. australis may be due to the precipitation of iron hydroxides on the root surface [30]. Mazmudar and Das [31] proposed that the substantial accumulation of Fe in the underground organs of the studied species is due to the microbial reduction of insoluble Fe(III) to the more soluble Fe(II) in the rhizosphere enhancing Fe bioavailability.
Cadmium (Cd) is considered non-essential and hazardous, posing risks to the entire ecosystem [32]. High Cd concentrations in plants cause several physiological and biochemical changes, such as inhibiting processes like mineral transport, photosynthesis, and nutrient uptake [33]. One cause of cadmium toxicity is its interaction with other elements. Cd is highly mobile in the environment, allowing it to be absorbed by plant root systems and transported to above-ground organs [23]. P. australis is highly tolerant of Cd, relying on defense mechanisms such as increased antioxidant enzyme activity [34]. The arithmetic mean of Cd in P. australis over the analyzed years was 0.40 mg·kg−1 in the roots, 0.29 mg·kg−1 in the stems, and 0.18 mg·kg−1 in the leaves, with a range of 0.06–0.48 mg·kg−1. The study found that Cd concentrations in the roots and stems were 2 and 1.5 times higher than reference values, respectively [23]. Given the absence of mines or extensive industrial infrastructure in the catchment area, the Cd concentration in plant material can be attributed to sewage, mineral and organic fertilizers, and transport. Sewage sludge, manure, and lime contribute to environmental Cd enrichment [35]. High Cd levels in agricultural soils are often caused by the repeated use of phosphate fertilizers [36]. The excessive use of fertilizers over long periods leads to the accumulation of heavy metals in water bodies and aquatic plants, potentially causing further ecological imbalances. Cd can enter rivers not only through agriculture but also via emissions from transportation. Vehicles emit Cd through tire wear [37] and diesel engines [38].
Like cadmium, lead (Pb) is highly toxic and not essential for plant growth. Even at low concentrations, Pb toxicity is severe for plants [39]. Pb accumulation causes physiological issues, such as DNA damage and the destruction of root and shoot systems [40], and impacts enzymatic activity [41]. Pb is relatively immobile in the soil and accumulates in the roots, resulting in minimal translocation to above-ground organs [42]. In this study, the average Pb concentrations in plant organs were as follows: roots, 7.1 mg·kg−1; stems, 6.3 mg·kg−1; and leaves, 5.2 mg·kg−1, all of which were higher than naturally occurring Pb levels in aquatic plants [43,44]. According to Bonanno [25], the lower Pb concentrations in leaves may be related to the element’s low mobility and tendency to accumulate in the roots. The primary source of Pb is road traffic, particularly for rivers near roads with heavy traffic. Although leaded gasoline has been phased out, Pb remains in the environment, especially in areas exposed to heavy traffic. Another source of Pb emissions is coal combustion. With the rapid growth in urban populations, increased energy consumption in urban buildings has increased Pb emissions [44].
Chromium (Cr) is toxic to plants, and its excess can disrupt protein synthesis [45]. In this study, the average Cr concentrations in the roots, stems, and leaves exceeded the phytotoxicity threshold. However, analyses of Mn, Zn, Ni, and Cu in plant tissues revealed concentrations within the ranges of 104.58–790.76, 5.15–50.41, 2.36–11.09, and 0.55–697 mg·kg−1, respectively, which were mostly at natural levels. Mn, Zn, and Cu are essential micronutrients for plants and play important roles in various enzyme activities. The highest amounts of these elements were found in the roots. According to Baldantoni et al. [46], the high Mn accumulation in roots indicates its availability from sediments. At the same time, Zn is transported from soil and sediments in the form of Zn2+ and absorbed by the roots [47]. Studies by Hammerschmitt et al. [48] showed that Zn accumulation in the root system prevents the transport of the element to the leaves. Research by Bonanno [43] and Kumari and Tripati [49] demonstrated the good bioaccumulation capacity of Cu in Phragmites australis. According to Kelepertzis [50] and Tóth et al. [51], soil enrichment with Cr, Cu, Ni, and Zn is primarily caused by applying pesticides, phosphate, and inorganic fertilizers. Many authors indicate that large amounts of Zn are emitted due to tire wear during vehicle use [52].
P. australis reflects the effects of water and soil pollution and records temporal fluctuations in heavy metals [53,54,55]. Additionally, Bonanno and Giudice [25] demonstrated that the organs of P. australis function as “bioindicators” and can be used as “biomonitors”. However, the results presented by Llagostera et al. [56] emphasize that metal pollution in aquatic environments may not be equally reflected in all plant organs. These internal plant differences in metal accumulation should be carefully considered when designing biomonitoring programs. Studies conducted on the Bug River and its tributaries confirmed that Phragmites australis’s organs (roots, stems, and leaves) reflect the cumulative effects of environmental pollution and are valuable for long-term biomonitoring due to their effectiveness and metal bioaccumulation capacity. In addition to these advantages, P. australis possesses other characteristics that make it an excellent test species. It is one of the most widespread emergent plant species worldwide. Moreover, the plant exhibits a high capacity for acclimatization to unfavorable environmental conditions. It also can accumulate various nutrients, heavy metals, and micro-pollutants, surpassing other aquatic plants [57].

3.2. Spatial Distribution of PTEs in Phragmites australis

The spatial distribution of potentially toxic elements (PTEs) in P. australis provides valuable information for studies identifying the elemental sources, possible enrichment zones, and general distribution trends of toxic elements in plant material. The Bug River and its tributaries carry characteristic pollutants accumulated within the catchment. The catchment is characterized by a high degree of naturalness, with diverse landscapes including forested, semi-natural, agricultural (with varying degrees of cultivation), and urbanized areas (with different types and densities of development), some of which are used for tourism. The spatial maps of Pb, Cr, Cu, Zn, Ni, Fe, and Mn distribution (Figure 2) reveal specific general patterns. Areas with high concentrations of these metals were similarly distributed and located, except for Cd. The results indicate that the highest metal concentrations were found at sampling points in Wyszków (2) and Włodawa (14), as well as at tributaries including the Cetynia River in Białobrzegi (23), the Kamianka River in Siemiatycze (26), and a point on the Włodawka River (28).
Local pollution sources, including traffic emissions, atmospheric deposition, industrial activities, and mineral and organic fertilization, influence the spatial distribution of these elements in the analyzed plants. Road traffic significantly contributes to the distribution of PTEs in the study area. The S8 expressway (Wyszków) and national roads 19 (Kamianka River—Siemiatycze), 82 (Włodawa and the Włodawka River point), and 62 (Wyszków) traverse much of the study area and increase the levels of the analyzed metals. The presence of metals in the plants is also linked to their levels in the atmospheric air.
Additionally, urban activities in the catchment contribute to the influx of trace elements, mainly through the discharge of domestic wastewater (with treatment plants located in Wyszków, Włodawa, Siemiatycze, and Białobrzegi) and industrial effluents, especially from the food industry (mainly the dairy, meat, and fruit and vegetable sectors). This indicates that the continuous influx of pollutants significantly impacts the deterioration of river conditions.
Surface runoff from the catchment also contributes to the inflow of chemical compounds into the studied rivers. This process is closely linked to climatic conditions, especially rainfall, terrain characteristics, soil type, and land use intensity within the catchment. Forests, meadows, and pastures act as moderate barriers, preventing the inflow of metals, while arable land and urban areas act as zero barriers.
In the studied catchment, agricultural land accounts for 50.3%, meadows and pastures account for 17.7%, and forests cover 23.5% of the area. Therefore, agricultural activities, including residents’ use of fertilizers, pesticides, and herbicides, provide critical evidence of anthropogenic impact. The analyses that were conducted revealed a relatively unique spatial distribution pattern for Cd concentrations. Even at low concentrations, the presence of Cd can lead to environmental degradation. Anthropogenic activities are the primary sources of Cd pollution, accounting for 80–90% [58]. Activities contributing to Cd emissions include animal husbandry, wastewater, phosphate fertilizers, and fossil fuel combustion [59,60]. The spatial distribution of Cd concentrations showed that higher levels were primarily found in agricultural areas. Skorbiłowicz et al. [61] recorded the highest Igeo, CF, and PLI values for Cd in arable soils between 1995 and 2015 in the Bug River catchment, which impacted the Cd content in Phragmites australis.

3.3. Identification of Local PTE Sources in P. australis Based on Land Use in the Catchment

Poland experiences a water deficit; lakes and rivers are essential water sources. The Bug River, the subject of this study, flows into the Narew River, which serves as a water intake for parts of Warsaw. The EU Biodiversity Strategy for 2030 aims to restore nature and reverse ecosystem degradation [62]. Riparian areas significantly influence the functioning of ecosystems, and the type of land adjacent to rivers impacts the influx of chemical substances. The amount of pollutants entering the water is primarily related to the land use in the catchment. Macrophytes can serve as long-term indicators of river quality and are sensitive to local environmental conditions. Incorporating land use assessments and the chemical composition of macrophytes allows for a better interpretation of river study results and can aid in determining appropriate catchment management strategies. The relationship between catchment land use and water ecosystem quality assessments using macrophytes is crucial to river protection.
The Bug River and its tributaries were studied considering the land use within the catchment (urban, agricultural, and forested areas). Urban areas included sampling points in highly populated towns and along roads passing through smaller towns. Forested areas were located within forest complexes, while agricultural areas were near arable fields. Table 1 presents the results of the P. australis analyses based on catchment land use, with the average concentrations of Pb, Cr, Cu, Zn, Ni, Cd, Fe, and Mn in the following order (mg∙kg−1):
  • Urban: Fe > Mn > Zn > Pb > Ni > Cu > Cr > Cd
  • Agricultural and forested: Fe > Mn > Zn > Ni > Pb > Cu > Cr > Cd
The order of heavy metals was similar, except for Pb, which ranked higher than Ni in urban areas. It should be noted that the most anthropogenically impacted catchment was the urban area, where the metal concentrations in P. australis were higher than in agricultural and forested areas (Table 2).
Statistical analyses were employed to clarify the origin of heavy metals in the study area. Correlation analysis is commonly used to examine relationships between different heavy metals. Correlation analysis can indicate whether the elements share the same source and exhibit similar migration patterns when highly correlated. A lack of significant correlation suggests that heavy metals may originate from different sources and be influenced by various factors.
Pearson’s correlation coefficients for the metals analyzed in P. australis were calculated, considering the catchment land use. The following elements showed significant correlations (p < 0.05) in agricultural areas: Pb, Cr, Cu, Zn, Fe, and Mn. The specific correlations were as follows: Pb–Cr, r = 0.68; Pb–Mn, r = 0.57; Cr–Cu, r = 0.45; Cr–Mn, r = 0.81; Zn–Cu, r = 0.73; and Fe–Mn, r = 0.53. In forested areas, the concentrations of Pb, Cr, Cu, Zn, Ni, Fe, and Mn in the analyzed plants were significantly correlated (p < 0.05), with correlation coefficients ranging from 0.47 to 0.88, regardless of the sampling location (Table 3). Significant positive correlations (p < 0.05) were observed in urban areas between Pb and Cr, Cu, Mn; Cu, Zn, and Cr; Cu and Zn, Ni; and Ni and Fe, Mn. This indicates that these heavy metals may share the same sources of pollution or migration characteristics.
The correlation analysis confirmed the spatial distribution of Pb, Cr, Cu, Zn, Ni, Fe, and Mn (Figure 2), where specific general trends were observed—areas with high concentrations of these metals were similarly distributed, except for Cd. Cd did not correlate significantly with any metal in agricultural, forested, or urban areas. In addition to correlation analysis, factor analysis was applied to identify local sources of PTEs in the Bug River catchment based on land use (urban, agricultural, and forested areas). The results of the factor analysis for heavy metal concentrations in P. australis are presented in Table 3.
Two factors were identified in all three catchments—urban, agricultural, and forested. In the urban catchment, Factor 1 explained 41% of the variance and was strongly and positively correlated with Cu, Zn, and Cr. Factor 2 accounted for 27% of the total variance and showed highly positive factor loadings for Ni and Fe. These results suggest that Cu, Zn, and Cr may originate from familiar sources, which is consistent with the correlation analysis. According to the spatial distribution patterns, Cu, Zn, and Cr may result from domestic and industrial wastewater discharges, particularly from the food industry, and atmospheric deposition, commonly containing Cu, Zn, Cr, Ni, and Fe. Runoff from impermeable urban areas is recognized as an essential non-point source of pollution, containing high levels of contaminants that can degrade water quality [63]. For instance, the Environmental Protection Agency (EPA) estimated that urban runoff and stormwater outflows rank as the fourth largest pollution source in rivers, the third largest in lakes, and the second largest in estuaries [64]. Vehicular traffic also significantly influences Cu, Zn, Cr, Ni, and Fe levels in the studied urban area.
Pollutant transport from agricultural areas to rivers from diffuse sources depends on rainfall, terrain, soil erosion, surface and subsurface flows, soil structure, land management, and vegetation cover. Component 1 was strongly associated with Pb, Cr, and Mn in the agricultural catchment, explaining 30% of the total variance. The source of these metals may include organic and mineral fertilizers, sewage sludge, and pesticides. Component 2 explained 22% of the variance, with a highly favorable loading for Fe, related to erosion processes within the catchment. Poor land management practices can lead to severe soil erosion and subsequent river pollution due to the migration of substances into water bodies.
Forested catchments can act as filters, reducing or absorbing pollutants. Studies by Lin et al. [65] demonstrated that forest vegetation improves water quality and is the best pollution filter compared to urban or agricultural sources. Component 1, explaining 31% of the variance, primarily represented Pb, Cu, Fe, and Mn pollution in the forested catchment, while Component 2, explaining 18% of the variance, was mainly associated with Cd contamination. Given the nature of the area, the Fe and Mn sources may be partially natural. Pb and Cu come from familiar sources consistent with the correlation analysis, such as diffuse runoff during rainfall.
In contrast, the source of Cd is likely coal combustion and vehicle emissions, with Cd released via tire wear and diesel engines [37,38]. Due to their small size and long atmospheric residence times, Cd particles are easily transported over long distances [66]. During rainfall, they are washed from the forested catchment into river waters.

4. Conclusions

This research demonstrated that P. australis plants are highly effective bioaccumulators of potentially toxic elements (PTEs), making them valuable bioindicators for monitoring pollution in aquatic ecosystems. The highest concentrations of metals such as Fe, Mn, Zn, Pb, Ni, Cu, Cr, and Cd were recorded in the roots, suggesting that the roots are the most sensitive organ in terms of metal accumulation. Bioaccumulation followed the order of roots > stems > leaves, confirming the effectiveness of roots as monitoring tools. Significant differences in heavy metal concentrations were observed based on catchment land use. In urban catchments, PTE concentrations were significantly higher, indicating the dominant influence of anthropogenic factors, such as domestic and industrial wastewater discharges, atmospheric deposition, and heavy vehicular traffic. The average Pb concentration in the roots was 71 mg·kg−1, while, in the leaves, it was 52 mg·kg−1, significantly exceeding the natural levels of these elements in aquatic plants. In agricultural catchments, the primary sources of pollution were mineral and organic fertilizers, whereas in forested catchments, metal concentrations were relatively lower, indicating a reduced impact from human activities. The concentrations of metals such as Fe, Mn, Zn, Pb, and Cd exceeded natural levels for aquatic plants. Cr and Pb concentrations were exceptionally high, likely due to industrial activities and road traffic in urban regions. The results also suggested that the concentrations of metals such as Mn, Zn, Ni, and Cu remained below phytotoxicity thresholds, meaning that their accumulation does not pose an immediate risk of phytotoxicity—multivariate analysis allowed for the identification of the primary sources of pollution. The findings indicated that in urban areas, the primary sources of metals were wastewater discharges, industrial emissions, and atmospheric deposition. In contrast, in agricultural catchments, the primary sources of pollution were mineral fertilizers, pesticides, and sewage sludge. The factor analysis results confirmed correlations between certain elements, suggesting familiar sources of pollution in some catchments.
Overall, the results affirm the effectiveness of P. australis in biomonitoring environmental pollution, especially for heavy metal contamination. This plant is suitable for the long-term monitoring of aquatic ecosystems, which is essential in evaluating the impact of human activities and achieving effective water quality management.

Author Contributions

Conceptualization, E.S., M.S. (Mirosław Skorbiłowicz), and M.S. (Marcin Sidoruk); methodology, E.S.; software, M.S. (Mirosław Skorbiłowicz); validation, M.S. (Mirosław Skorbiłowicz), E.S. and M.S. (Marcin Sidoruk); formal analysis, E.S. and M.S. (Mirosław Skorbiłowicz); investigation, M.S. (Marcin Sidoruk); writing—original draft preparation, E.S., M.S. (Mirosław Skorbiłowicz) and M.S. (Marcin Sidoruk); writing—review and editing, E.S., M.S. (Mirosław Skorbiłowicz) and M.S. (Marcin Sidoruk); visualization, E.S., M.S. (Mirosław Skorbiłowicz) and M.S. (Marcin Sidoruk); supervision, E.S.; project administration, E.S.; funding acquisition, E.S. and M.S. (Marcin Sidoruk). All authors have read and agreed to the published version of the manuscript.

Funding

The research was carried out as part of research project No. WZ/WB-II ’S/2/2021 at Białystok University of Technology and financed by a subsidy provided by the Minister of Science and Higher Education. The results presented in this paper were obtained as part of a comprehensive study financed by the University of Warmia and Mazury in Olsztyn, Faculty of Agriculture and Forestry, Department of Water Management and Climatology (grant no. 30.610.008–110). This study was funded by the Minister of Science under “the Regional Initiative of Excellence Program References”.

Data Availability Statement

The authors will make data available upon request.

Conflicts of Interest

The authors declare no conflicts of interest.

References

  1. Tikadar, K.K.; Jahan, F.; Mia, R.; Rahman, M.D.Z.; Sultana, M.A.; Islam, S.; Kunda, M. Assessing the potential ecological and human health risks of trace metal pollution in surface water, sediment, and commercially valuable fish species in the Pashur River, Bangladesh. Environ. Monit. Assess. 2024, 196, 1042. [Google Scholar] [CrossRef] [PubMed]
  2. Badawy, W.M.; Ghanim, E.H.; Duliu, O.G.; El Samman, H.; Frontasyeva, M.V. Major and trace element distribution in soil and sediments from the Egyptian central Nile Valley. J. Afr. Earth Sci. 2017, 131, 53–61. [Google Scholar] [CrossRef]
  3. Kicińska, A.; Wikar, J. Health risk associated with soil and plant contamination in industrial areas. Plant Soil 2024, 498, 295–323. [Google Scholar] [CrossRef]
  4. Ali, M.M.; Rahman, S.; Islam, M.S.; Rakib, M.R.J.; Hossen, S.; Rahman, M.Z.; Kormoker, T.; Idris, A.M.; Phoungthong, K. Distribution of heavy metals in water and sediment of an urban river in a developing country: A probabilistic risk assessment. Int. J. Sediment. Res. 2022, 37, 173–187. [Google Scholar] [CrossRef]
  5. Barszcz, A.A.; Sidoruk, M. Impacts of water management in aquaculture on heavy metal accumulation in rainbow trout muscles and associated health risks from consumption. Food Control 2024, 164, 110617. [Google Scholar] [CrossRef]
  6. Jayasree, B.; Naidu, M.V.S.; Bhaskar, B.P.; Madhuri, K.V.N.; Sagar, G.K.; Kumari, P.L. Transect approach for assessing major and trace elemental contamination in agricultural soils of the palamaner division, chittoor district, andhra pradesh, India. Environ. Monit. Assess. 2024, 196, 1040. [Google Scholar] [CrossRef]
  7. Skorbiłowicz, E.; Ofman, P.; Skorbiłowicz, M.; Sidoruk, M.; Tarasiuk, U. Geochemical Assessment of Heavy Metal Distribution in Bug River Sediments, Poland: The Impacts of Urbanization and Agricultural Practices. Water 2024, 16, 1573. [Google Scholar] [CrossRef]
  8. Alsubih, M.; El Morabet, R.; Khan, R.A.; Khan, N.A.; Khan, M.H.; Ahmed, S.; Qadir, A.; Changani, F. Occurrence and health risk assessment of arsenic and heavy metals in groundwater of three industrial areas in Delhi, India. Environ. Sci. Pollut. Res. 2021, 28, 63017–63031. [Google Scholar] [CrossRef]
  9. Guittonny-Philippe, A.; Masotti, V.; Höhener, P.; Boudenne, J.-L.; Viglione, J.; Laffont-Schwob, I. Constructed wetlands to reduce metal pollution from industrial catchments in aquatic Mediterranean ecosystems: A review to overcome obstacles and suggest potential solutions. Environ. Int. 2014, 64, 1–16. [Google Scholar] [CrossRef]
  10. Kushwaha, A.; Rani, R.; Kumar, S.; Gautam, A. Heavy metal detoxification and tolerance mechanisms in plants: Implications for phytoremediation. Environ. Rev. 2016, 24, 39–51. [Google Scholar] [CrossRef]
  11. Telahigue, K.; Antit, M.; Rabeh, I.; Chouba, L.; Kheriji, S.; Cafsi, M.E.; Hajji, T.; Mhadhbi, L. Heavy Metal Bioaccumulation and Oxidative Stress Profile in Brachidontes pharaonis (Bivalvia: Mytilidae) from the Tunisian Coast: Insight into Its Relevance as Bioindicator of Marine Pollution. Bull. Environ. Contam. Toxicol. 2022, 109, 831–838. [Google Scholar] [CrossRef] [PubMed]
  12. El-Metwally, M.E.A. Heavy metal accumulation and interaction dynamics in Brachidontes pharaonis: A bioindicator study in the Red Sea. Environ. Monit. Assess. 2024, 196, 1011. [Google Scholar] [CrossRef] [PubMed]
  13. Patra, A.K.; Sharma, A. Phragmites australis as a model organism for phytoremediation: Opportunities and constraints. Environ. Sci. Pollut. Res. 2018, 25, 21734–21748. [Google Scholar]
  14. No, D. Directive 2455/2001/EC of the European Parliament and of the Council of 20 November 2001 establishing the list of priority substances in the field of water policy and amending Directive 2000/60/EC (Text with EEA relevance). Off. J. Eur. Communities 2001, 15, 1–5. [Google Scholar]
  15. Srivastava, J.; Gupta, A.; Chandra, H. Phytoremediation of urban wastewater: Potentials and prospects. Int. J. Phytoremediation 2021, 23, 34–52. [Google Scholar]
  16. Marmiroli, M.; Pigoni, V.; Savo-Sardaro, M.L. The role of macrophytes in assessing water quality in Italian river basins: Towards a new biomonitoring index? Ecol. Indic. 2019, 106, 105457. [Google Scholar]
  17. Franzaring, J.; Klumpp, A.; Fangmeier, A. Air quality bio-monitoring: Successes, challenges and perspectives of biomonitoring programs in Europe. Environ. Pollut. 2017, 230, 994–1008. [Google Scholar]
  18. Ruiz, M.; Velasco, J. Nutrient Bioaccumulation in Phragmites australis: Management Tool for Reduction of Pollution in the Mar Menor. Water Air Soil. Pollut. 2010, 205, 173–185. [Google Scholar] [CrossRef]
  19. Eid, E.M.; Shaltout, K.H.; Al-Sodany, Y.M.; Haroun, S.A.; Galal, T.M.; Ayed, H.; Khedher, K.M.; Jensen, K. Seasonal potential of Phragmites australis in nutrient removal to eliminate the eutrophication in Lake Burullus. Egypt. J. Freshw. Ecol. 2020, 35, 135–155. [Google Scholar] [CrossRef]
  20. Du Laing, G.; Tack, F.M.G.; Verloo, M.G. Performance of selected destruction methods for the determination of heavy metals in reed plants (Phragmites australis). Anal. Chim. Acta 2003, 497, 191–198. [Google Scholar] [CrossRef]
  21. Lu, X.; Zhang, X.; Li, L.; Chen, H. Multivariate statistical analysis of heavy metals in street dust of Baoji, NW China. J. Hazard. Mater. 2010, 173, 744–749. [Google Scholar] [CrossRef] [PubMed]
  22. Chen, T.; Liu, X.; Zhu, M.; Zhao, K.; Wu, J.; Xu, J.; Huang, P. Identification of trace element sources and associated risk assessment in vegetable soils of the urban-rural transitional area of Hangzhou, China. Environ. Pollut. 2011, 159, 1317–1323. [Google Scholar] [CrossRef] [PubMed]
  23. Kabata-Pendias, A.; Pendias, H. Trace Elements in Soils and Plants, 3rd ed.; CRC Press: Boca Raton, FL, USA, 2001. [Google Scholar]
  24. Markert, B. Plants as Biomonitors: Indicators for Heavy Metals in the Terrestrial Environment; VCH Publishers: Weinheim, Germany, 1992. [Google Scholar]
  25. Cymes, I.; Glińska-Lewczuk, K.; Szymczyk, S.; Sidoruk, M.; Potasznik, A. Distribution and potential risk assessment of heavy metals and arsenic in sediments of a dam reservoir: A case study of the Łoje retention reservoir, NE Poland. J. Elementol. 2017, 22, 843–856. [Google Scholar] [CrossRef]
  26. Lu, Q.; He, Z.-L.; Graetz, D.A.; Stoffella, P.J.; Yang, X. Uptake, and distribution of metals by water lettuce (Pistia stratiotes L.). Environ. Sci. Pollut. Res. 2011, 18, 978–986. [Google Scholar] [CrossRef]
  27. Sawidis, T.; Chettri, M.K.; Zachariadis, G.A.; Stratis, J.A. Heavy metals in aquatic plants and sediments from water systems in Macedonia, Greece. Ecotoxicol. Environ. Saf. 1995, 32, 73–80. [Google Scholar] [CrossRef]
  28. Bonanno, G.; Giudice, R.L. Heavy metal bioaccumulation by the organs of Phragmites australis (common reed) and their potential use as contamination indicators. Ecol. Indic. 2010, 10, 639–645. [Google Scholar] [CrossRef]
  29. Cicero-Fernández, D.; Peña-Fernández, M.; Expósito-Camargo, J.A.; Antizar-Ladislao, B. Role of Phragmites australis (common reed) for heavy metals phytoremediation of estuarine sediments. Int. J. Phytoremediation 2016, 18, 575–582. [Google Scholar] [CrossRef] [PubMed]
  30. Batty, L.C.; Baker, A.J.M.; Wheeler, B.D. Aluminium and phosphate uptake by Phragmites australis: The role of Fe, Mn and Al root plaques. Ann. Bot. 2002, 89, 443–449. [Google Scholar] [CrossRef]
  31. Mazmudar, K.; Das, S. Phytoremediation of Pb, Zn, Fe, and Mg with 25 wetland species from a papermill contaminated site in North East India. Environ. Sci. Pollut. Res. 2015, 22, 701–710. [Google Scholar] [CrossRef]
  32. Zhou, C.; Ge, N.; Guo, J.; Zhu, L.; Ma, Z.; Cheng, S.; Wang, J. Enterobacter asburiae Reduces Cadmium Toxicity in Maize Plants by Repressing Iron Uptake-Associated Pathways. J. Agric. Food Chem. 2019, 67, 10126–10136. [Google Scholar] [CrossRef]
  33. Zhou, C.; Ge, N.; Guo, J.; Zhu, L.; Ma, Z.; Cheng, S.; Wang, J. Silicon supplementation ameliorated the inhibition of photosynthesis and nitrate metabolism by cadmium (Cd) toxicity in Cucumis sativus L. Sci. Hortic. 2010, 123, 521–530. [Google Scholar]
  34. Ederli, L.; Reale, L.; Ferranti, F.; Pasqualini, S. Responses induced by high concentration of cadmium in Phragmites australis roots. Physiol. Plantarum 2004, 121, 66–74. [Google Scholar] [CrossRef] [PubMed]
  35. Duan, B.; Feng, Q. Comparison of the Potential Ecological and Human Health Risks of Heavy Metals from Sewage Sludge and Livestock Manure for Agricultural Use. Toxics 2021, 9, 145. [Google Scholar] [CrossRef] [PubMed]
  36. Verkleij, J.A. The Effects of Heavy Metals Stress on Higher Plants and Their Use as Biomonitors. In Plant as Bioindicators: Indicators of Heavy Metals in the Terrestrial Environment; Markert, B., Ed.; VCH Publishers: Weinheim, Germany, 1993; pp. 415–442. [Google Scholar]
  37. Gope, M.; Masto, R.E.; George, J.; Hoque, R.R.; Balachandran, S. Bioavailability and health risk of some potentially toxic elements (Cd, Cu, Pb and Zn) in street dust of Asansol, India. Ecotoxicol. Environ. Saf. 2017, 138, 231–241. [Google Scholar] [CrossRef]
  38. Nagajyoti, P.C.; Lee, K.D.; Sreekanth, T.V.M. Heavy metals, occurrence and toxicity for plants: A review. Environ. Chem. Lett. 2010, 8, 199–216. [Google Scholar] [CrossRef]
  39. Diaconu, M.; Pavel, L.V.; Hlihor, R.M.; Rosca, M.; Fertu, D.I.; Lenz, M.; Corvini, P.X.; Gavrilescu, M. Characterization of heavy metal toxicity in some plants and microorganisms—A preliminary approach for environmental bioremediation. New Biotechnol. 2020, 56, 130–139. [Google Scholar] [CrossRef]
  40. Gichner, T.; Žnidar, I.; Száková, J. Evaluation of DNA damage and mutagenicity induced by lead in tobacco plants. Mutat. Res.-Genet. Toxicol. Environ. Mutagen. 2008, 652, 186–190. [Google Scholar] [CrossRef]
  41. Reddy, A.M.; Kumar, S.G.; Jyothsnakumari, G.; Thimmanaik, S.; Sudhakar, C. Lead induced changes in antioxidant metabolism of horsegram (Macrotyloma uniflorum (Lam.) Verdc.) and bengalgram (Cicer arietinum L.). Chemosphere 2005, 60, 97–104. [Google Scholar] [CrossRef]
  42. Siedlecka, A.; Tukendorf, A.; Skórzyńska-Polit, E.; Maksymiec, W.; Wójcik, M.; Baszyński, T.; Krupa, Z. Angiosperms (Asteraceae, Convolvulaceae, Fabaceae and Poaceae; other than Brassicaceae). In Metals in the Environment; Prasad, M.N.V., Ed.; Analysis by Biodiversity; Marcel Dekker, Inc.: New York, NY, USA, 2001; pp. 171–217. [Google Scholar]
  43. Bonanno, G. Comparative performance if trace element bioaccumulation and biomonitoring in the plant species Typha domingensis, Phragmites australis and Arundo donax. Ecotoxicol. Environ. Saf. 2013, 97, 124–130. [Google Scholar] [CrossRef]
  44. Li, Q.; Cheng, H.; Zhou, T.; Lin, C.; Guo, S. The estimated atmospheric lead emissions in China, 1990–2009. Atmos. Environ. 2012, 60, 1–8. [Google Scholar] [CrossRef]
  45. Ali, S.; Mir, R.A.; Tyagi, A.; Manzar, N.; Kashyap, A.S.; Mushtaq, M.; Raina, A.; Park, S.; Sharma, S.; Mir, Z.A.; et al. Chromium Toxicity in Plants: Signaling, Mitigation, and Future Perspectives. Plants 2023, 12, 1502. [Google Scholar] [CrossRef] [PubMed]
  46. Broadley, M.R.; White, P.J.; Hammond, J.P.; Zelko, I.; Lux, A. Zinc in plants: Tansley review. New Phytol. 2007, 173, 677–702. [Google Scholar] [CrossRef] [PubMed]
  47. Hammerschmitt, R.K.; Tiecher, T.L.; Facco, D.B.; Silva, L.O.S.; Schwalbert, R.; Drescher, G.L.; Trentin, E.; Somavilla, L.M.; Kulmann, M.S.S.; Silva, I.C.B.; et al. Copper and zinc distribution and toxicity in ‘Jade’/‘Genovesa’ young peach tree. Sci. Hortic. 2020, 259, 108763. [Google Scholar] [CrossRef]
  48. Kumari, M.; Tripathi, B.D. Efficiency of Phragmites australis and Typha latifolia for heavy metal removal from wastewater. Ecotoxicol. Environ. Saf. 2015, 112, 80–86. [Google Scholar] [CrossRef] [PubMed]
  49. Kelepertzis, E. Accumulation of heavy metals in agricultural soils of Mediterranean: Insights from Argolida basin, Peloponnese, Greece. Geoderma 2014, 221-222, 82–90. [Google Scholar] [CrossRef]
  50. Tóth, G.; Hermann, T.; Da Silva, M.R.; Montanarella, L. Heavy metals in agricultural soils of the European Union with implications for food safety. Environ. Int. 2016, 88, 299–309. [Google Scholar] [CrossRef]
  51. Bhattacharya, T.; Chakraborty, S.; Tuteja, D.; Patel, M. Zinc and Chromium Load in Road Dust, Suspended Particulate Matter and Foliar Dust Deposits of Anand City, Gujarat. Open J. Met. 2013, 3, 42–50. [Google Scholar] [CrossRef]
  52. Ozaki, H.; Watanabe, I.; Kuno, K. Investigation of the heavy metal sources in relation to automobiles. Water Air Soil Pollut. 2004, 157, 209–223. [Google Scholar] [CrossRef]
  53. Vardanyan, L.G.; Ingole, B.S. Studies on heavy metal accumulation in aquatic macrophytes from Sevan (Armenia) and Carambolim (India) lake systems. Environ. Int. 2006, 32, 208–218. [Google Scholar] [CrossRef]
  54. Milke, J.; Gałczyńska, M.; Wróbel, J. The Importance of Biological and Ecological Properties of Phragmites Australis (Cav.) Trin. Ex Steud., in Phytoremendiation of Aquatic Ecosystems—The Review. Water 2020, 12, 1770. [Google Scholar] [CrossRef]
  55. Li, J.; Leng, Z.; Jia, H.; Wei, L.; Yuguda, T.K.; Du, D. Effect of Seawall Embankment Reclamation on the Distribution of Cr, Cu, Pb and Zn Pollution in Invasive Spartina alterniflora and Native Phragmites australis Coastal Saltmarshes of East China. Biology 2023, 12, 253. [Google Scholar] [CrossRef] [PubMed]
  56. Llagostera, I.; Pérez, M.; Romero, J. Trace metal content in the seagrass Cymodocea nodosa: Differential accumulation in plant organs. Aquat. Bot. 2011, 95, 124–128. [Google Scholar] [CrossRef]
  57. Ali, S.; Abbas, Z.; Rizwan, M.; Zaheer, I.E.; Yavaş, İ.; Ünay, A.; Abdel-DAIM, M.M.; Bin-Jumah, M.; Hasanuzzaman, M.; Kalderis, D. Application of Floating Aquatic Plants in Phytoremediation of Heavy Metals Polluted Water: A Review. Sustainability 2020, 12, 1927. [Google Scholar] [CrossRef]
  58. Zhao, Y.; Deng, Q.; Lin, Q.; Zeng, C.; Zhong, C. Cadmium Source Identification in Soils and High-Risk Regions Predicted by Geographical Detector Method. Environ. Pollut. 2020, 263, 114338. [Google Scholar] [CrossRef]
  59. Yuan, Z.; Luo, T.; Liu, X.; Hua, H.; Zhuang, Y.; Zhang, X.; Zhang, L.; Zhang, Y.; Xu, W.; Ren, J. Tracing Anthropogenic Cadmium Emissions: From Sources to Pollution. Sci. Total Environ. 2019, 676, 87–96. [Google Scholar] [CrossRef]
  60. Wang, J.; Jiang, Y.; Sun, J.; She, J.; Yin, M.; Fang, F.; Xiao, T.; Song, G.; Liu, J. Geochemical Transfer of Cadmium in River Sediments near a Lead-Zinc Smelter. Ecotoxicol. Environ. Saf. 2020, 196, 110529. [Google Scholar] [CrossRef] [PubMed]
  61. Skorbiłowicz, E.; Skorbiłowicz, M.; Rogowska, W. Temporal and spatial changes in metal contents of arable soils in the Bug river catchment in 1995-2015 (Poland). Int. J. Conserv. Sci. 2022, 13, 895–914. [Google Scholar]
  62. European Commission (EC). EU Biodiversity Strategy for 2030: Bringing Nature Back into Our Lives; European Commission: Brussels, Belgium, 2019. [Google Scholar]
  63. Brabec, E.; Schulte, S.; Richards, P.L. Impervious surfaces and water quality: A review of current literature and its implications for watershed planning. J. Plan. Lit. 2002, 16, 499–514. [Google Scholar] [CrossRef]
  64. USEPA. National Water Quality Inventory: Report to Congress; USEPA, Office of Water: Washington, DC, USA, 2017.
  65. Lin, B.Q.; Chen, X.; Yao, H.; Chen, Y.; Liu, M.; Gao, L.; James, A. Analyses of landuse change impacts on catchment runoff using different time indicators based on SWAT model. Ecol. Indic. 2015, 58, 55–63. [Google Scholar] [CrossRef]
  66. Steinnes, E.; Friedland, A.J. Metal contamination of natural surface soils from long-range atmospheric transport: Existing and missing knowledge. Environ. Rev. 2006, 14, 169–186. [Google Scholar] [CrossRef]
Figure 1. Location of survey points along the Bug River and its tributaries.
Water 16 03294 g001
Figure 2. Spatial variability of PTE in P. australis within the Polish section of the Bug River catchment area.
Water 16 03294 g002
Table 1. Content of potentially toxic elements (PTEs) in the roots, stems, and leaves of P. australis collected from the Bug River and its main tributaries [mg·kg−1].
Basic StatisticsPbCrCuZnNiCdFeMn
Roots n = 96
Min2.590.700.585.152.980.29360.55104.58
Max6.472.452.4519.516.000.48632.24358.75
Average7.1 ab2.93.3 ef21.7 h8.2 ij0.40 lł1361.9 mno430.1 rs
Stalks n = 96
Min3.320.970.557.312.360.06360.55111.52
Max7.363.053.2226.276.480.24791.68403.88
Average6.3 a2.2 cd2.7 eg19.95.8 ik0.29 l885.5 mop227.9 rtu
Leaves n = 96
Min7.162.143.3230.637.150.291381.74491.66
Max12.427.116.9750.4111.090.452919.86790.76
Average5.2 ab1.6 cd1.9 fg17.5 h3.3 j0.18 ł489.1 np159.4 stu
Natural Content0.1–5 **0.02–0.5 *5–30 *10–70 *0.1–5 *0.05–0.2 *50–200 **20–500 *
Notes: Same letters—statistically significant difference with p < 0.05 ANOVA. Without letters—no significant difference in ANOVA. *—Kabata-Pendias and Pendias [21], **—Markert [22].
Table 2. Content of PTEs in P. australis from the Bug River and its main tributaries based on catchment land use.
Basic StatisticsPbCrCuZnNiCdFeMn
Agricultural area n = 39
Min2.590.700.585.152.980.29360.55104.58
Max6.472.452.4519.516.000.48632.24358.75
Average4.68 a1.33 c1.78 e13.26 g4.30 i0.39 k477.25 ł166.51 n
Forest area n = 33
Min3.320.970.557.312.360.06360.55111.52
Max7.363.053.2226.276.480.24791.68403.88
Average5.32 b1.62 d1.95 f15.15 h4.76 j0.13 kl520.28 m191.07 o
Urbanized area n = 24
Min7.162.143.3230.637.150.291381.74491.66
Max12.427.116.9750.4111.090.452919.86790.76
Average9.96 ab4.58 cd4.99 ef36.38 gh9.45 ij0.36 l2156.27 łm623.20 no
Notes: Same letters—statistically significant difference with p < 0.05 ANOVA. Without letters—no significant difference in ANOVA.
Table 3. PTE content of P. australis from the Bug River and its major tributaries in relation to catchment management.
VariableUrbanized AreaAgricultural AreaForest Area
Factor 1Factor 2Factor 1Factor 2Factor 1Factor 2
Pb0.660.550.78−0.110.83−0.50
Cr0.85−0.250.84−0.010.640.10
Cu0.850.220.370.600.84−0.20
Zn0.70−0.050.030.630.63−0.50
Ni0.220.710.130.530.64−0.04
Cd0.19−0.49−0.380.16−0.250.76
Fe−0.130.820.340.760.720.07
Mn0.400.420.850.100.74−0.01
Variance explained [%]412730223118
Disclaimer/Publisher’s Note: The statements, opinions and data contained in all publications are solely those of the individual author(s) and contributor(s) and not of MDPI and/or the editor(s). MDPI and/or the editor(s) disclaim responsibility for any injury to people or property resulting from any ideas, methods, instructions or products referred to in the content.

