Article

Temporal Variability of Hydroclimatic Extremes: A Case Study of Vhembe, uMgungundlovu, and Lejweleputswa District Municipalities in South Africa

1
South African Weather Service, Private Bag X097, Pretoria 0001, South Africa
2
Department of Geography, Geoinformatics and Meteorology, University of Pretoria, Private Bag X020, Hatfield, Pretoria 0028, South Africa
*
Author to whom correspondence should be addressed.
Water 2024, 16(20), 2924; https://doi.org/10.3390/w16202924
Submission received: 11 September 2024 / Revised: 10 October 2024 / Accepted: 10 October 2024 / Published: 14 October 2024
(This article belongs to the Section Water and Climate Change)

Abstract

:
The current study investigated hydroclimatic extremes in Vhembe, Lejweleputswa, and uMgungundlovu District Municipalities based on streamflow data from 21 river gauge stations distributed across the study site for the period spanning 1985–2023. Statistical metrics such as the annual mean and maximum streamflow, as well as trends in annual, maximum, seasonal, and high/low flow, were used to evaluate the historical features of streamflow in each of the three district municipalities. Moreover, the Standardized Streamflow Index (SSI) time series computed from streamflow observations at 3- and 6-month accumulation periods were used to assess hydroclimatic extremes, including drought episodes, proportion of wet/dry years and trends in SSI, drought duration (DD), and drought severity (DS). The results indicate that the three district municipalities have experienced localized and varying degrees of streamflow levels and drought conditions. The uMgungundlovu District Municipality in particular has experienced a significant decline in annual and seasonal streamflow as well as an increase in drought conditions during the 38-year period of analysis. This is supported by the negative trends observed in most of the assessed metrics (e.g., annual, maximum, seasonal, low/high flow, and SSI), whereas DD and DS showed positive trends in all the stations, suggesting an increase in prolonged duration and severity of drought. The Lejweleputswa District Municipality depicted positive trends in most of the assessed metrics, suggesting that streamflow increased, whereas drought decreased in the region over the 38-year period of study. Moreover, the Vhembe District Municipality experienced both negative and positive trends, suggesting localized variations in dry and wet conditions. The results presented in this study contribute towards drought monitoring and management efforts in support of policy- and decision-making that aim to uplift water resources management and planning at local and district municipality levels.

1. Introduction

Climate change continues to be a global concern as many countries strive to address its detrimental impacts across key climate-sensitive sectors, including socio-economic and sustainable development. The African Continent, considered highly prone to climate change, has over the years experienced numerous effects of climate change manifested in the form of rising temperatures, fluctuating rainfall and rainy seasons, sea-level rise, heat stress, and tropical cyclones, among others [1]. In most African countries, rain-fed agriculture forms the main contributor to socio-economic development; consequently, spatio-temporal and interannual variations in precipitation and elevated temperatures have become a persistent threat to these countries, particularly for local and rural populations. Climate change is believed to be the cause of increased frequent occurrences of hydroclimatic extremes such as droughts and floods [2]. The impacts of hydroclimatic extremes cut across fundamental socio-economic and climate-sensitive sectors. As climate change continues to rise over time [3,4], there is a growing concern about the potential increase in hydroclimatic extremes in frequency and/or magnitude and their consequences. In particular, climate change is expected to alter the pattern, frequency, and intensity of precipitation. Such changes are likely to elevate the intensity and frequency of droughts and floods, thus exacerbating impacts on the environment, society, and economy, including adding stress on the already overstrained water resources [5,6].
The frequency and magnitude of floods and droughts have always been a challenge to most African countries, and in most cases, they have resulted in the destruction and loss of human lives, extensive damage to infrastructure, and food insecurity, especially in low-income communities and households [7]. Between 1900 and 2020, drought has reportedly affected more than two billion people globally, leading to over USD 174 billion in damages [8], with ~44% of drought events recorded in Africa. South Africa, like most semi-arid to arid African countries, has experienced widespread and persistent drought episodes that have impacted key economic sectors such as agriculture, energy, and water resources. The Western and Eastern Cape Provinces are some of the provinces that have experienced severe drought in recent years, significantly impacting water supply for various purposes, including for household, agriculture, and industrial usage [9,10]. Furthermore, parts of South Africa have experienced severe floods, the most recent being the 2022 floods in KwaZulu-Natal, which caused severe damages in eThekwini Metropolitan Municipality, leading to the displacement of approximately 40,000 civilians, the destruction of roads and bridges, and the death of over 400 people. The KZN government estimated the total cost of the April 2022 flood damage to be approximately ZAR 17 billion.
Given the destructive impacts resulting from weather and climate extremes such as floods and drought, the importance of quantifying the spatial–temporal extent of hydroclimatic extremes can never be overemphasized as it contributes to understanding the influence of such extremes on the existing ecosystem, including the availability of water resources. Streamflow is one of the useful climatic variables for monitoring climate variations, including understanding the inherent hydrological processes that affect water resources’ management and evaluating characteristics of hydroclimatic extremes in general [11]. Change in streamflow has significant implications for the availability of water resources [6]. Climate change is likely to increase water stress, especially in climate-sensitive regions that receive delayed/reduced precipitation, streamflow, and runoff [12,13]. Various studies have alluded to the fact that streamflow characteristics have changed over time and will continue to change due to precipitation changing patterns, human activities, and climate change [14]. Human activities that influence streamflow include water abstraction and uses, hydrologic cycle, land use processes, as well as population growth [15]. Significant changing patterns in streamflow, including both increasing and decreasing trends, have been documented in South Africa [16,17,18] and in other countries such as in Ethiopia [19], China [20], India [21,22], Australia [23,24], and California [25].
Almost all of these studies were conducted at a basin/catchment level. For instance, in South Africa, the reported studies were conducted in Limpopo River Basin, Rietspruit sub-basin, Eastern Cape, Western Cape, and Northern Cape provinces. While impacts of hydroclimatic extremes are often registered at smaller spatial scales such as district or municipal levels, studies focusing on such areas are limited due to the lack of availability of hydrometeorological data, among other factors. Nonetheless, the importance of quantifying the spatial–temporal extent of hydroclimatic extremes can never be overemphasized, as it contributes towards understanding the influence of such extremes on the existing ecosystem, including the availability of water resources. Consequently, robust approaches such as the statistical analysis of streamflow data can be utilized to detect patterns manifested as trends and study the historical and future changes in streamflow as well as the resulting extremes that influence the availability of water resources at the district municipal level.
In this regard, the present study investigated historical changes in streamflow and hydroclimatic extreme events in the Vhembe, Lejweleputswa, and uMgungundlovu District Municipalities. In particular, the current study has undertaken the following analyses: (1) annual mean and maximum streamflow to evaluate changes in mean/maximum flow, (2) trends in annual maximum streamflow to assess the changes in longer extreme flows, (3) trends in annual low/high flow quantiles, where these are associated with dry and wet conditions that could result in drought and floods conditions, respectively, and (4) drought analysis based on the Standardized Streamflow Index (SSI) and its features based on drought duration and severity. The current study contributes towards drought monitoring and management in support of the better management of water resources, including the development of drought-related policy- and decision-making strategies to mitigate the impacts of extreme events.

2. Materials and Methods

2.1. Study Area

The current study was carried out in three district municipalities of South Africa, namely Vhembe, Lejweleputswa, and uMgungundlovu (Figure 1). The Vhembe District Municipality, shown in the top-right panel, is situated at the most northern part of South Africa in Limpopo Province and shares a border with three neighboring countries (e.g., Botswana to the northwest, Zimbabwe to the north, and Mozambique to the southeast through the Kruger National Park). The district has a total land size of 25,600 km2 and is home to an estimated 1.4 million people (based on Stats SA, 2016 Community Survey). The district is divided into four local municipalities (Musina, Thulamela, Collins Chabane, and Makhado). Annual average rainfall amounts vary across the district, but it receives most of its rainfall during the summer season, particularly during the early summer season. In particular, the Vhembe District Municipality records lower average annual rainfall in the western and northern parts, ranging between 200 and 400 mm/year. The central region experiences a much higher average annual rainfall ranging between 800 and 1200 mm/year. The district is often influenced by dry spells that can propagate into prolonged drought. Moreover, this district municipality also experiences intense storms and flooding events from time to time during the summer months.
The uMgungundlovu District Municipality (bottom right figure) is in the KwaZulu-Natal midlands. The district municipality comprises seven local municipalities, with the area bordered by the Ilembe District Municipality to the east; the Umzinyathi District Municipality to the northeast; the Ethekwini Metropolitan Municipality to the southeast; the Harry Gwala District Municipality to the southwest; and both the Okhahlamba-Drakensberg World Heritage Site and the Uthukela District to the north. uMgungundlovu is a home to ~1.1 million people (2016 Community Survey), with approximately 60% of its population residing in urban areas. The uMgungundlovu District Municipality has a land size of approximately 9600 km2, making it the smallest of the three district municipalities. Like Vhembe District Municipality, uMgungundlovu District receives most of its rainfall during the early- to mid-summer rainfall season, and it has a higher average annual rainfall compared to the other districts. The average annual rainfall varies between 600 and 800 mm/year towards the northern parts of the district to high average annual rainfall above 1000 mm/year towards the western mountainous regions.
The Lejweleputswa District Municipality (bottom left) is located in the northwestern parts of the Free State Province and in the central region of South Africa. It is the largest of the three district municipalities and has a total land size of 32,287 square km. The district comprises five local municipalities, namely Masilonyana, Tokologo, Tswelopele, Matjhabeng, and Nala. It is home to about 634,462 people, which is the lowest out of the three districts. Lejweleputswa District Municipality is characterized by mid-summer rainfall season. Rainfall is evenly and uniformly distributed over the entirety municipality region. Almost the whole district receives average annual rainfall amounts varying between 400 and 600 mm/year. Lejweleputswa District Municipality is prone to both droughts and floods, among other hazards such as heatwaves and veld fires. The economy of the Lejweleputswa District Municipality thrives on mining and farming. The district is rich in gold deposits and is a major agricultural producer of maize and sunflower.

2.2. Data

The daily streamflow datasets were collected from the Department of Water and Sanitation, South Africa, on https://www.dws.gov.za/Hydrology/Verified/hymain.aspx (accessed on 24 September 2024), for a period of 38 years from 1985 to 2023. The datasets were collected from 21 river stations across the three district municipalities; see their distribution in Figure 1. The stations were selected due to the availability of continuous datasets for the period spanning from 1985 to 2023 and less than 5% gaps. Only uMgungundlovu district presented a fair spatial distribution of the stream gauge stations. Clearly there is a lack of river gauge stations in the western parts of both Vhembe and Lejweleputswa District Municipalities. The lack of even spatial distribution of the station network is one of the challenges faced when conducting research studies on a small/local scale. Nonetheless, the available river stations will give key information on the extremes experienced across the three district municipalities, with the hope that the findings will contribute to the monitoring of flood and drought hazards as well as management and preparedness measures thereof.

2.3. Methods

2.3.1. Annual Streamflow Analysis

The daily streamflow data were analyzed to assess general characteristics of streamflow within the three district municipalities. The analysis considered basic descriptive statistics that involved the calculation of annual mean and maximum streamflow and their respective trends. High and low flow were considered in this study as indicators for wet and dry conditions which could be associated with flood and drought conditions, respectively. Consequently, these indicators can be used to monitor flood (high flow) and drought (low flow) conditions. In this study, high and low flows were calculated at the 90th (e.g., upper) and 10th (lower) percentile quantiles, respectively. In addition to the mean annual, maximum, and seasonal streamflow, trends analysis was conducted for high and low flow for the investigated period (1985–2023).

2.3.2. Generalized Extreme Value Distribution

The alarming rate at which hydroclimatic extremes have frequently occurred in recent years has cultivated a desire to understand the spatial–temporal characteristics of these extremes. In this regard, extreme value analysis was conducted on maximum streamflow based on the Generalized Extreme Value (GEV) distribution. It is worth noting that frequency analysis is generally a more holistic approach of extreme analysis. The method of moments (MOMs) and L-moments (LMOs) are often used to determine the parameters of the probability distributions of the extremes. This is because the appropriateness of the fitted probability distributions is tested using goodness-of-fit tests, including the Chi-square and Kolmogorov–Smirnov tests, while the suitable distribution is determined using the D-index diagnostic test [26]. Unlike MOMs, LMOs can show the nature of the shapes in higher-order moments. Additionally, the use of LMOs is particularly suited for (a) analyzing even small sample sizes and (b) datasets with inherent outliers. However, the object of the current study, particularly in this section, was limited to characterizing the nature of the hydroclimatic extremes’ spatial distribution of the GEV parameters based on Maximum Likelihood Estimation (i.e., location, scale, and shape), which is known to be better than the MOMs [27]. A further justification of using GEV distributions is based on the extremal theorem unlike the linear models that use the central limit theory. Regarding L-moments, there are various packages, e.g., in R that provide exemplary statistical comparisons of the various distributions that will be considered in a study that is underway.
GEV distribution was used to assess the yearly maxima streamflow features. The GEV, characterized by three parameters (location, shape, and scale), was developed with extreme value theory to integrate the Gumbel, Fréchet, and Weibull extreme value distributions into a single distribution [28]. Mathematically, the three-parameter GEV distribution can be described as per Equation (1).
f x ; μ , σ , ξ = 1 σ t x ξ + 1 e t x
where
t x = 1 + ξ x μ σ 1 / ξ   f o r     ξ 0 e x μ / σ                 f o r     ξ = 0
In these equations, μ corresponds to the location parameter, ξ is the shape parameter, and σ represents the scale parameter [29,30]. The differences in these parameters depend on the value of the shape parameter, ξ, only. The shape parameter varies between zero, less than zero, and greater than zero, corresponding to three classes of the GEV family of distributions. For instance, the Gumbel (Type I) distribution is described when ξ = 0, whereas ξ < 0 and ξ > 0 are associated with the Weibull (Type II) and Freshet (Type III) class of distributions, respectively.
The Gumbel distribution (e.g., the Extreme Value Type I distribution) is defined by Equation (3).
f x ; μ , β = 1 β e x μ β + e x μ β
F x ; μ , β = e e x μ β
where μ and β > 0 represent the location and scale parameters, respectively. The Fréchet distribution (the Extreme Value Type II distribution) is described as given by Equation (5),
f x ; α , β = β β x α + 1 e β x α
F x ; α , β = e β x α
where α > 0 and β > 0 correspond to the shape and the scale parameters, respectively.
The Weibull distribution (the Extreme Value Type III distribution) is defined as per Equation (7)
f x ; λ , k = k λ x λ k 1 e x / λ   k             f o r     x 0 0 ,                   x < 0
f x ; λ , k = 1 e x / λ   k           f o r     x 0 0 ,                   x < 0
where λ > 0 and k > 0 are the scale and shape parameters, respectively.
In the present study, the annual maximum streamflow time series was fitted into the GEV class of distribution using the L-Moments method [31]. The aim of this analysis was to evaluate which of the three GEV distributions better characterized the streamflow data across the selected river stations. In this case, the results were assessed based on the values of the shape parameter and the corresponding classes of the GEV family distribution, e.g., the Gumbel, Frechet, and Weibull (or Type I, II, and III, respectively) distributions.

2.3.3. Standardized Streamflow Index, Drought Duration, and Severity

The Standardized Streamflow Index (SSI) developed by Modarres [32] and further investigated by Telesca et al. [33] was used to characterize drought across the three district municipalities. The concept of the Standardized Precipitation Index (SPI) [34] was applied to compute SSI, which requires only streamflow datasets as the input. In this regard, the SSI was computed based on the methodology described in [9,17] and references therein for 3 and 6 accumulated timescales. Daily streamflow observations were aggregated into monthly values and used to calculate SSI values.
A gamma distribution in which a random variable x is continuous [34] can be expressed as follows
g x , α , β = 1 β α Γ α x α 1 e x / β
where α > 0 and β > 0 are the estimated shape and scale parameters, respectively, x > 0 is the streamflow (m3/s), and Γ(α) is the gamma function defined by
Γ α = 0 x α 1 e x d x
The gamma distribution is used to compute the cumulative probability function given as follows,
G x = 0 x g x d x = 0 x 1 β α Γ α x α 1 e x / β d x = 1 Γ a 0 x t a 1 e 1 d t
when x = 0 and q = P(x) > 0. The cumulative probability density can be defined as per Equation (12),
H x = q + 1 q G ( x )
The cumulative probability distribution function is transformed into a normal distribution, with an average and standard deviation of zero (0) and one (1), respectively. This results in SSI time series consisting of both negative (equivalent to drought/dry conditions) and positive (wet conditions) values. The computed SSI-3 and SSI-6 values were categorized using the classification criteria of SPI, as recommended by the World Meteorological Organization standards [35]. Based on the resulting SSI-3 and SSI-6 time series, annual trends were calculated using the Mann–Kendall trend test. In addition, the SSI-3- and SSI-6-month time series were used to estimate drought duration (DD) (i.e., the number of months between the start and end of drought) and drought severity (DS) (the cumulated index values within the drought duration) features based on the method presented in [31].
A drought epoch was defined when 2 or more consecutive months showed negative SSI values. For each drought episode, DD represents the number of months of the drought event. In this case, the DS was estimated as the absolute sum of the SSI [36,37],
D S e = j = 1 D D S S I j
where j corresponds to a drought month and DD is the duration of a drought event e.

2.3.4. Trend Analysis

The trends in annual, maximum, and seasonal streamflow (including low/high flow) as well as in SSI-6 and SSI-6 time series and DD and DS features were estimated based on the Mann–Kendall (MK) test [38,39]. The MK test is known to work well with data that do not conform with certain distributions nor follow the presumption of normality [40]. Such an approach has been extensively applied in streamflow trend analysis [3,41,42,43,44], as well as in other studies involving other climate variables, including rainfall [44,45]. In particular, the MK test statistic (S) is calculated as follows
S = i = 1 n 1 j = i + 1 n s g n x j x i
where n represents the number of datasets, and xi and x j are the ranks for the ith (i = 1, 2, 3, …, n – 1) and jth (j = i + 1, 2, …, n) datasets. The sign function, sgn, is calculated using Equation (15),
s g n   x j x i = 1 ;             if   x j x i > 0 0 ;             if   x j x i = 0 1 ;             if   x j x i < 0
The variance [Var(S)] is calculated as given by
V a r S = n n 1 2 n + 5 i = 1 P t i t i 1 2 t i + 5 18
where P is the number of tied groups, is the summation over all the tied groups, and ti represents the number of data values in the ith group with i = 1, 2, 3, …, n. The standardized MK test is computed using Equation (17),
Z M K = S 1 V a r S ;             if   S > 0   0 ;                                       if   S = 0 S + 1 V a r S ;             if   S < 0
In this study, the computed trends were considered statistically significant when the p-value is less than or equal to 0.05 (i.e., at 5% confidence level).

3. Results

3.1. Streamflow Characteristics

3.1.1. Annual Mean and Maximum Streamflow

Table 1 gives summarized characteristics of streamflow data across the selected and analyzed river gauged stations, as described by the mean of the annual and maximum streamflow. Also shown in the table are the location of the river gauges and the corresponding station coordinates and catchment areas. The uMgungundlovu District Municipality exhibits the lowest annual mean streamflow ranging from 1.04 to 9.59 m3/s, followed by Vhembe with mean values between 1.22 and 24.35 m3/s and Lejweleputswa with values between 1.66 and 47.11 m3/s. In terms of maximum streamflow, river gauges in Lejweleputswa District Municipality recorded the greatest peak (~208–784 m3/s), followed by Vhembe with the highest peak of ~698 m3/s (698 m3/s) and uMgungundlovu (526 m3/s). It is worth noting that most of the stream gauge stations in Lejweleputswa District Municipality are located in the vicinity of major rivers.
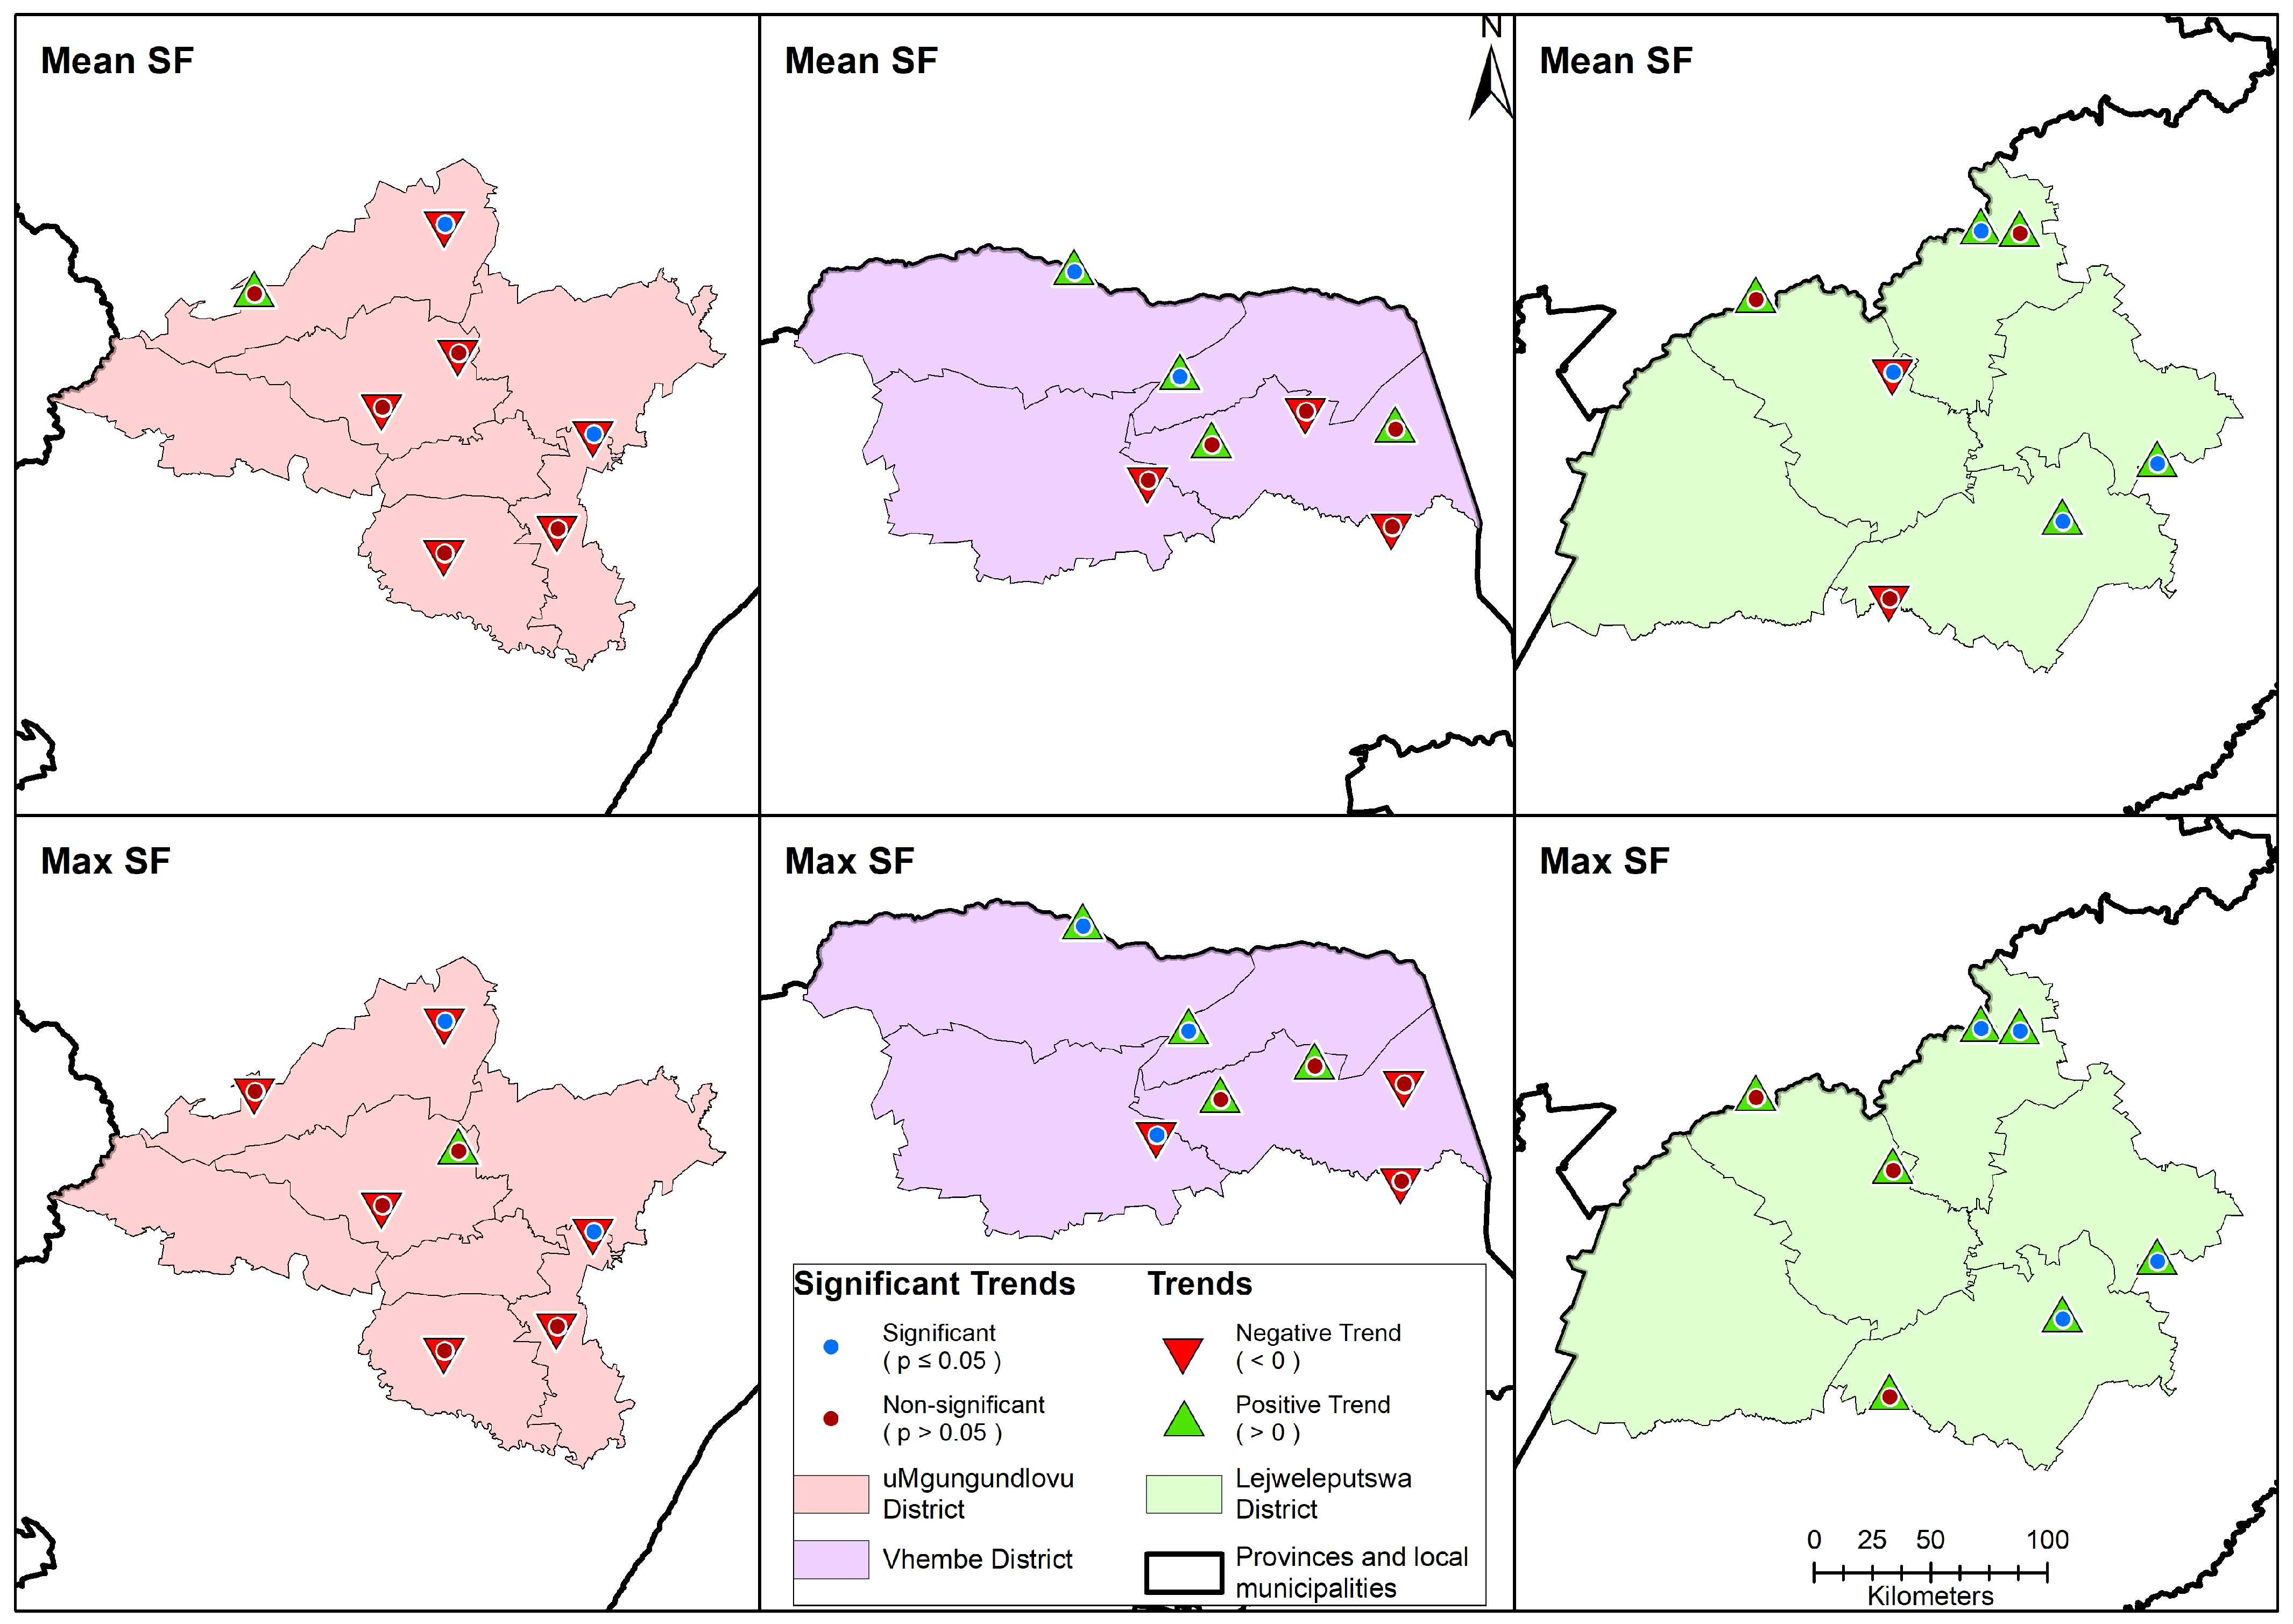
Figure 2 depicts the spatial distribution of trends in annual mean and maximum streamflow for each of the three district municipalities during the 1985–2023 investigated period. Negative trends in both annual and maximum streamflow are observed across the uMgungundlovu District Municipality, with exceptions to one river gauged station. Only two river stations show statistically significant trends (p ≤ 0.05). In Vhembe District Municipality, four of the gauged stations depict positive trends in both annual and maximum streamflow. Five of the river gauged stations depict positive trends, whereas all the seven river gauges exhibit positive trends in maximum streamflow data in Lejweleputswa District Municipality. Generally, the observed trends indicate that while there has been a decrease in streamflow in uMgungundlovu, the Vhembe District Municipality has experienced both an increase (upper north) and decrease (south-eastern parts) in streamflow during the 1985–2023 study period. Similarly, most of the stations in Lejweleputswa District Municipality experience an increase in streamflow during the 38-year assessed period.

3.1.2. Seasonal Streamflow

Table 2 presents the results for seasonal trends in streamflow across the river stations and district municipalities. Statistically significant trends are shown in bold. Based on the results, ~71% (5 out of 7) of the stations recorded negative trends in uMgungundlovu and Lejweleputswa District Municipalities and positive trends in Vhembe during the SON (September–October–November) season. In the DJF (December–January–February) season, all except one river station recorded negative trends in uMgungundlovu, five recorded positive trends in Vhembe, and positive trends were recorded across the river gauge stations in Lejweleputswa District Municipality. During the MAM (March–April–May) season, six river gauge stations depicted negative trends in uMgungundlovu, five showed negative trends in Vhembe, and all seven stions in Lejweleputswa recorded positive trends. Four out of the seven river gauge stations recorded negative trends in uMgungundlovu, six displayed positive trends in Vhembe, and positive trends were recorded across all the stations in Lejweleputswa during the winter season, JJA (June–July–August). Generally, trends in seasonal streamflow are highly variable, with such variations being mostly localized.

3.1.3. Generalized Extreme Value Analysis

The results for the GEV analysis on the annual maximum streamflow for the three district municipalities are presented in Table 3. For the Vhembe District Municipality, the shape values are highly variable, ranging from the lowest of −0.4 to the highest of 4.6. According to GEV classification, when the shape parameter is lower than zero (0), the GEV is equivalent to the Weibull distribution. In this case, one of the river flow data in Vhembe is best described by the Weibull distribution, one by the Gumbel distribution, and the rest of the stations’ data fall within the Fréchet distribution. Similarly, the shape parameter values for the river stations’ data in uMgungundlovu District Municipality range between 0.1 and 1.1. Consequently, three (four) of the stations’ data are characterized by Gumbel (Fréchet) distributions. In Lejweleputswa District Municipality, two of the river flow data are characterized by the Weibull, one by the Gumbel, and four by the Fréchet distributions.

3.1.4. High and Low Flow

The spatial distribution of trends in low and high quantiles of streamflow is illustrated in Figure 3 for each of the district municipalities. In each figure, the up- and down-pointing triangles correspond to positive and negative trends, with the inside blue and brown symbols corresponding to statistically significant and non-significant trends, respectively. According to low- and high-test results, 86% (6 out 7) of the gauging stations show a downward streamflow trend across the uMgungundlovu District Municipality, with five of the river stations exhibiting significant trends at the 5% significance level. An upward trend in the low (high) quantile of streamflow is observed in five (four) of the stream gauges within the Vhembe District Municipality. A notable spatial shift in the negative and positive trend pattern is observed in both low and high quantiles. Six of the river gauges in Lejweleputswa District Municipality exhibit negative trends for both the low and high quantile flow. Overall, trends in both low and high flow indicate that streamflow has declined during the study period in uMgungundlovu, which suggests that the district municipality has experienced increased drought episodes during the 1985–2023 period. Similarly, an increasing trend in low flow indicates that streamflow has increased in some parts of Vhembe, resulting in a decrease in drought. Furthermore, the increasing trends in both low and high flow indicate that the streamflow has increased, suggesting that Lejweleputswa District Municipality has experienced a decrease in drought episodes during the analyzed period.

3.2. Hydrological Extremes

3.2.1. Trends in Standardized Streamflow Index

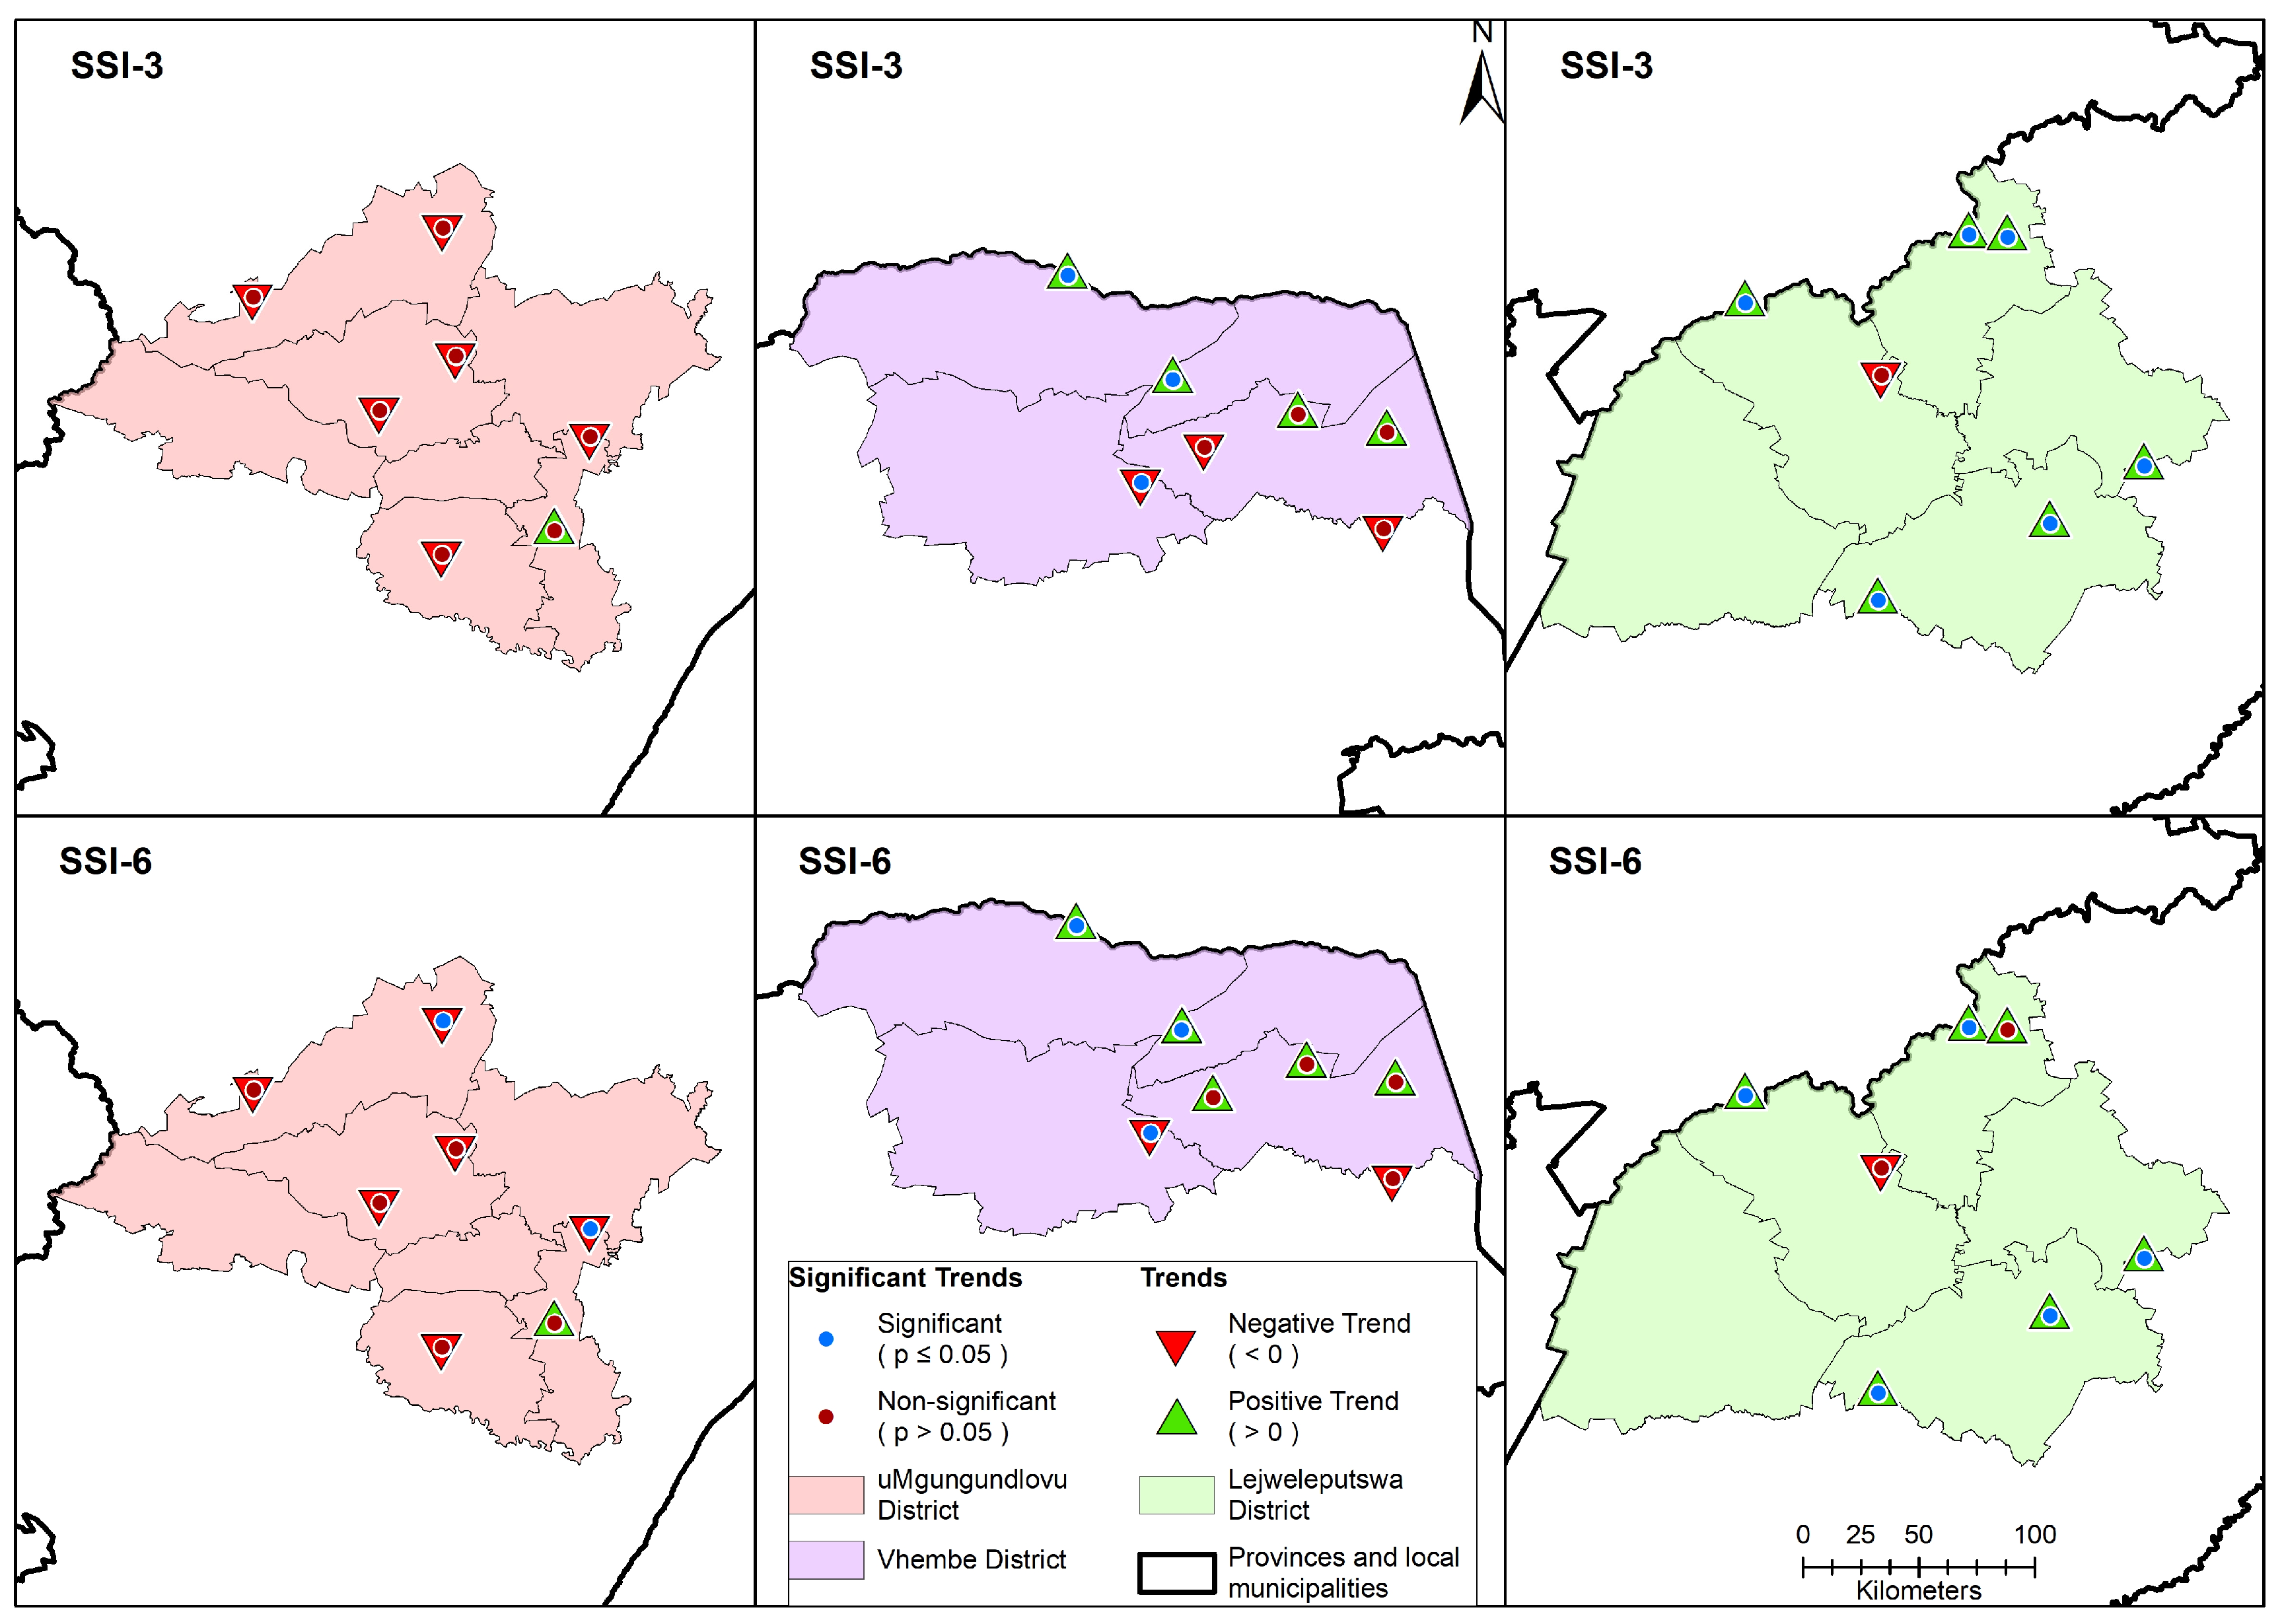
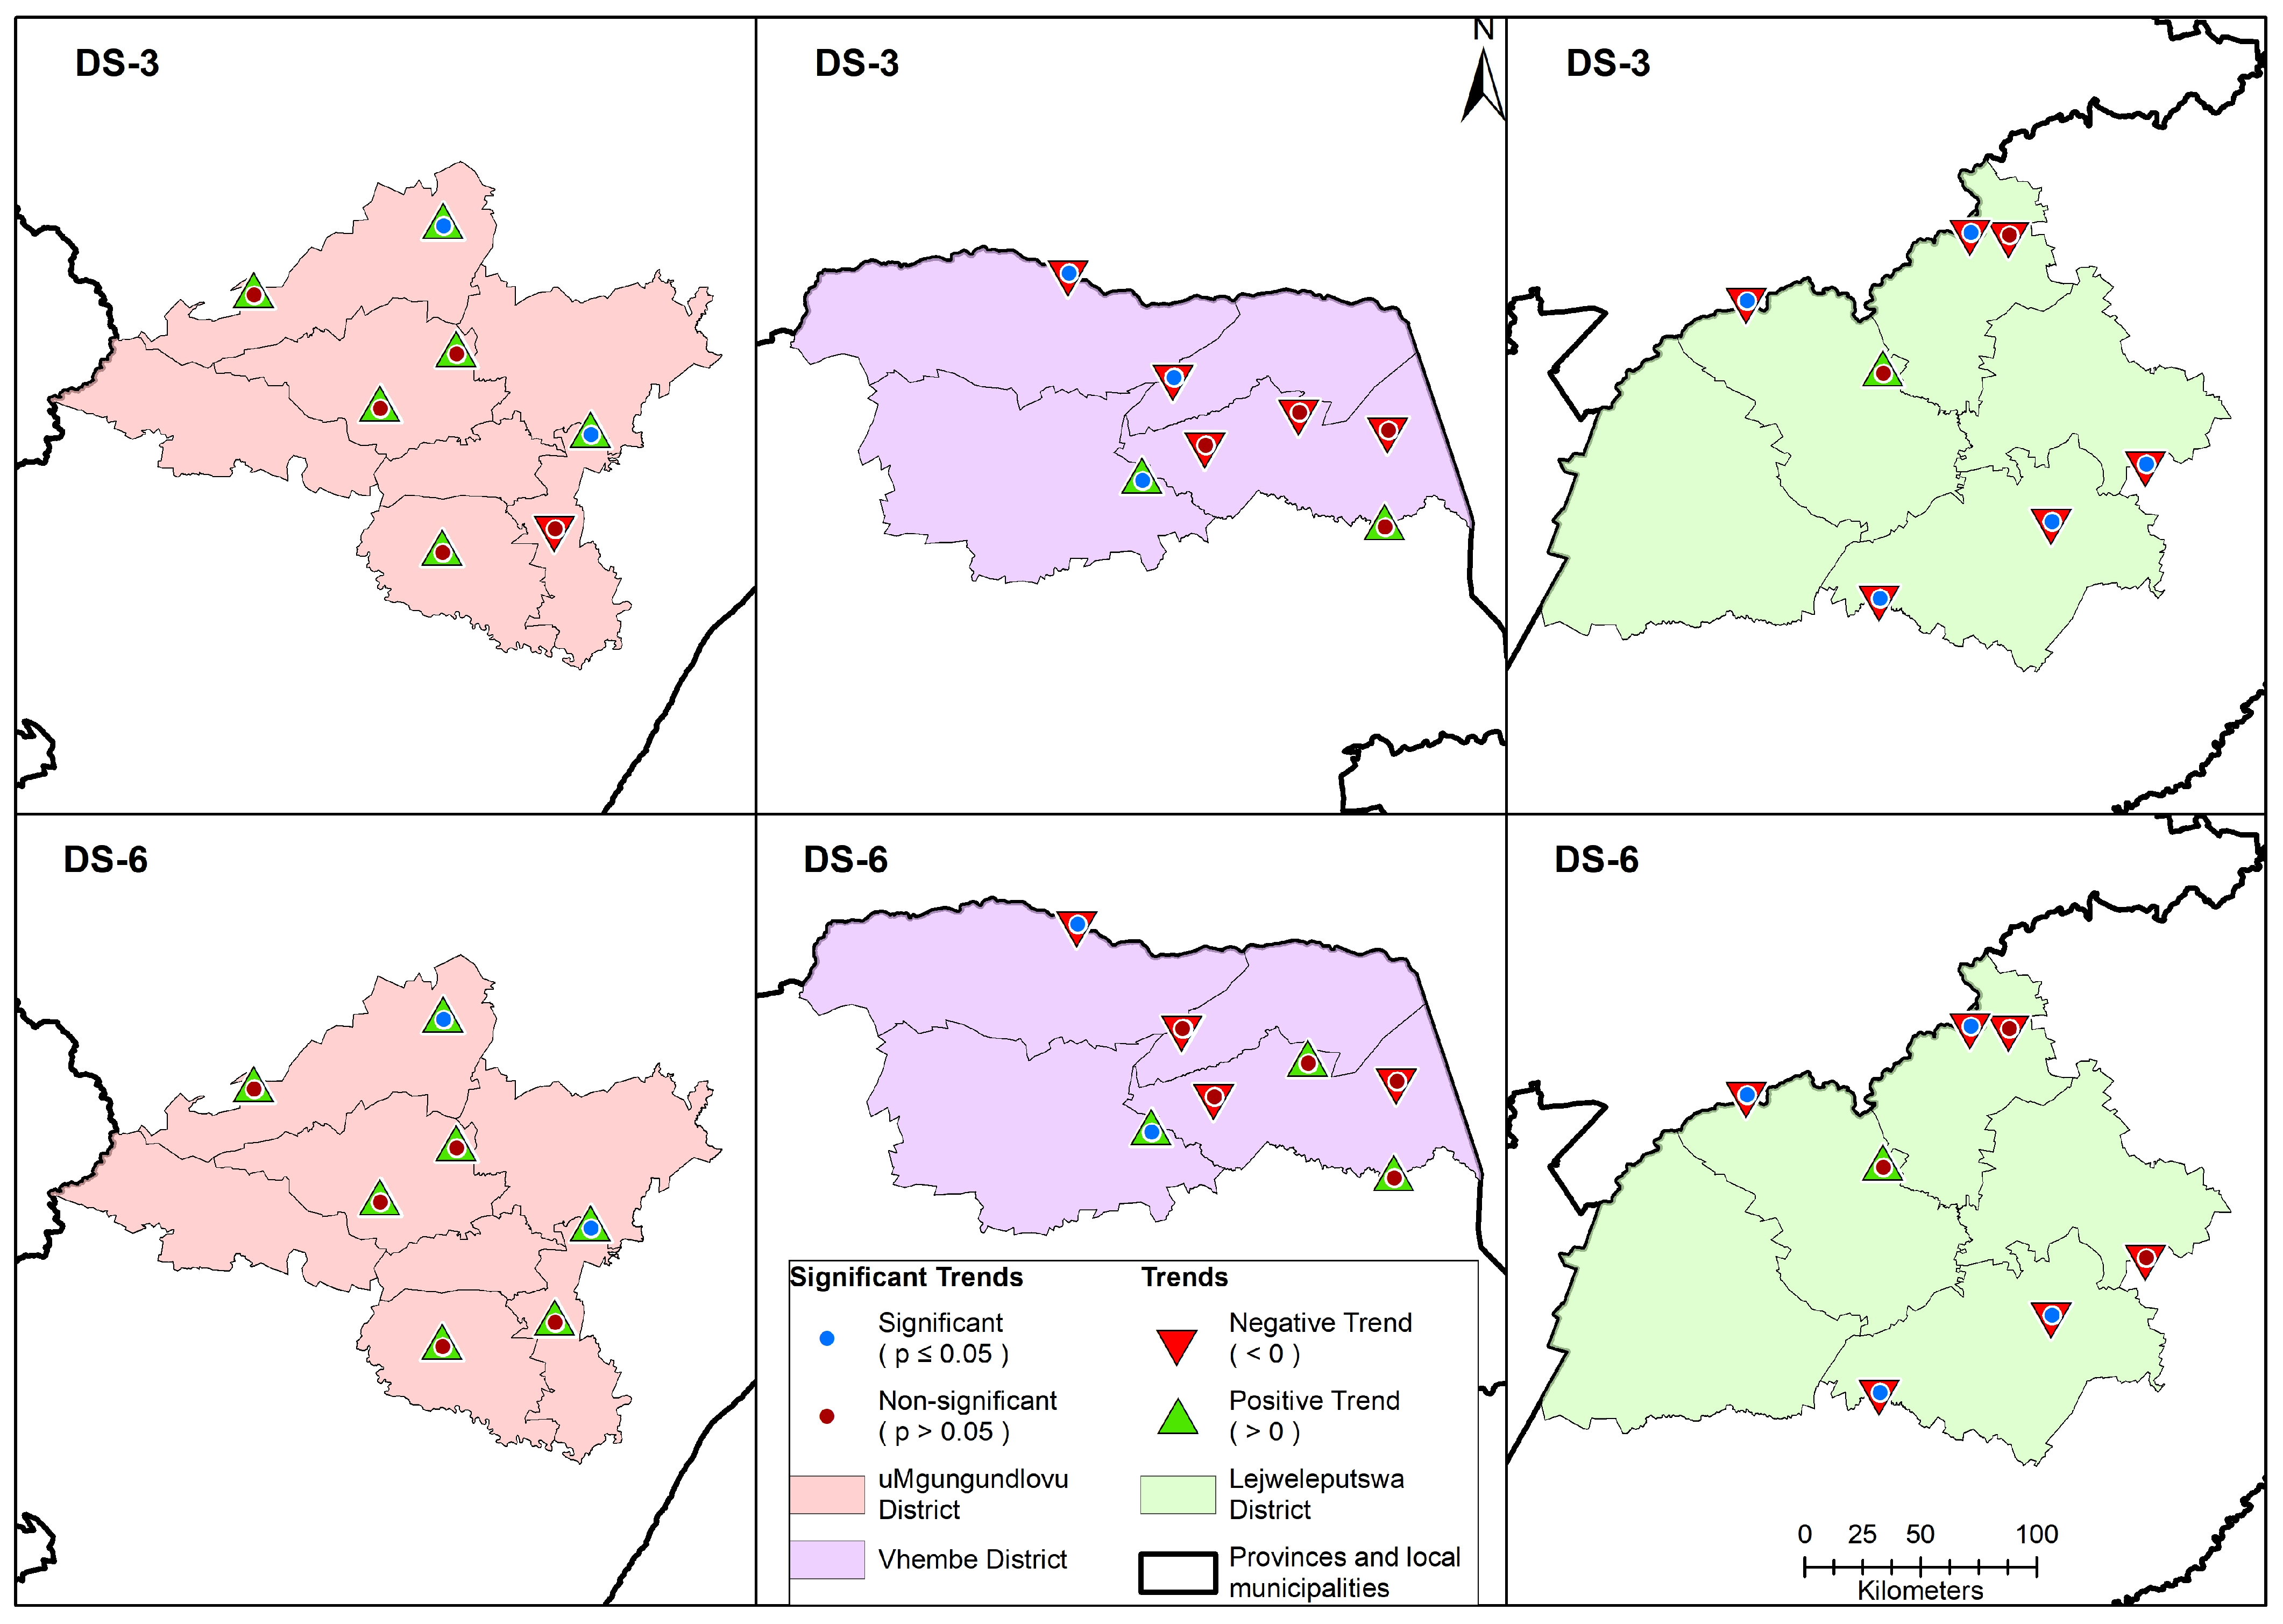
Figure 4 depicts the spatial distribution of trends in the SSI values at 3- and 6-month accumulation time-steps for each of the district municipalities. The uMgungundlovu District Municipality shows negative trends in six of the river gauge stations across the two accumulation timescales. Most of the detected trends are statistically significant (i.e., p ≤ 0.05). In Vhembe District Municipality, four (five) of the river gauges depict positive trends in the SSI-3 and SSI-6 accumulation periods, with two of the river gauges exhibiting statistically significant trends. Most of the river gauges in Lejweleputswa District Municipality depict statistically significant positive trends in both SSI- and SSI-6. Overall, the observed trends in uMgungundlovu suggest that the district has experienced increased drought episodes, Lejweleputswa has experienced decreased drought, and the upper north and south of Vhembe has experienced increasing and decreasing drought during the 1985–2023 investigated period. The trends in SSI for both uMgungundlovu and Lejweleputswa district municipalities are consistent with trends in low and high flow. Thus, decreasing trends in low and high flow are associated with increasing drought in uMgungundlovu, whereas increasing trends are associated with decreasing drought episodes in Lejweleputswa District Municipality.

3.2.2. The Proportion of Wet and Dry Years

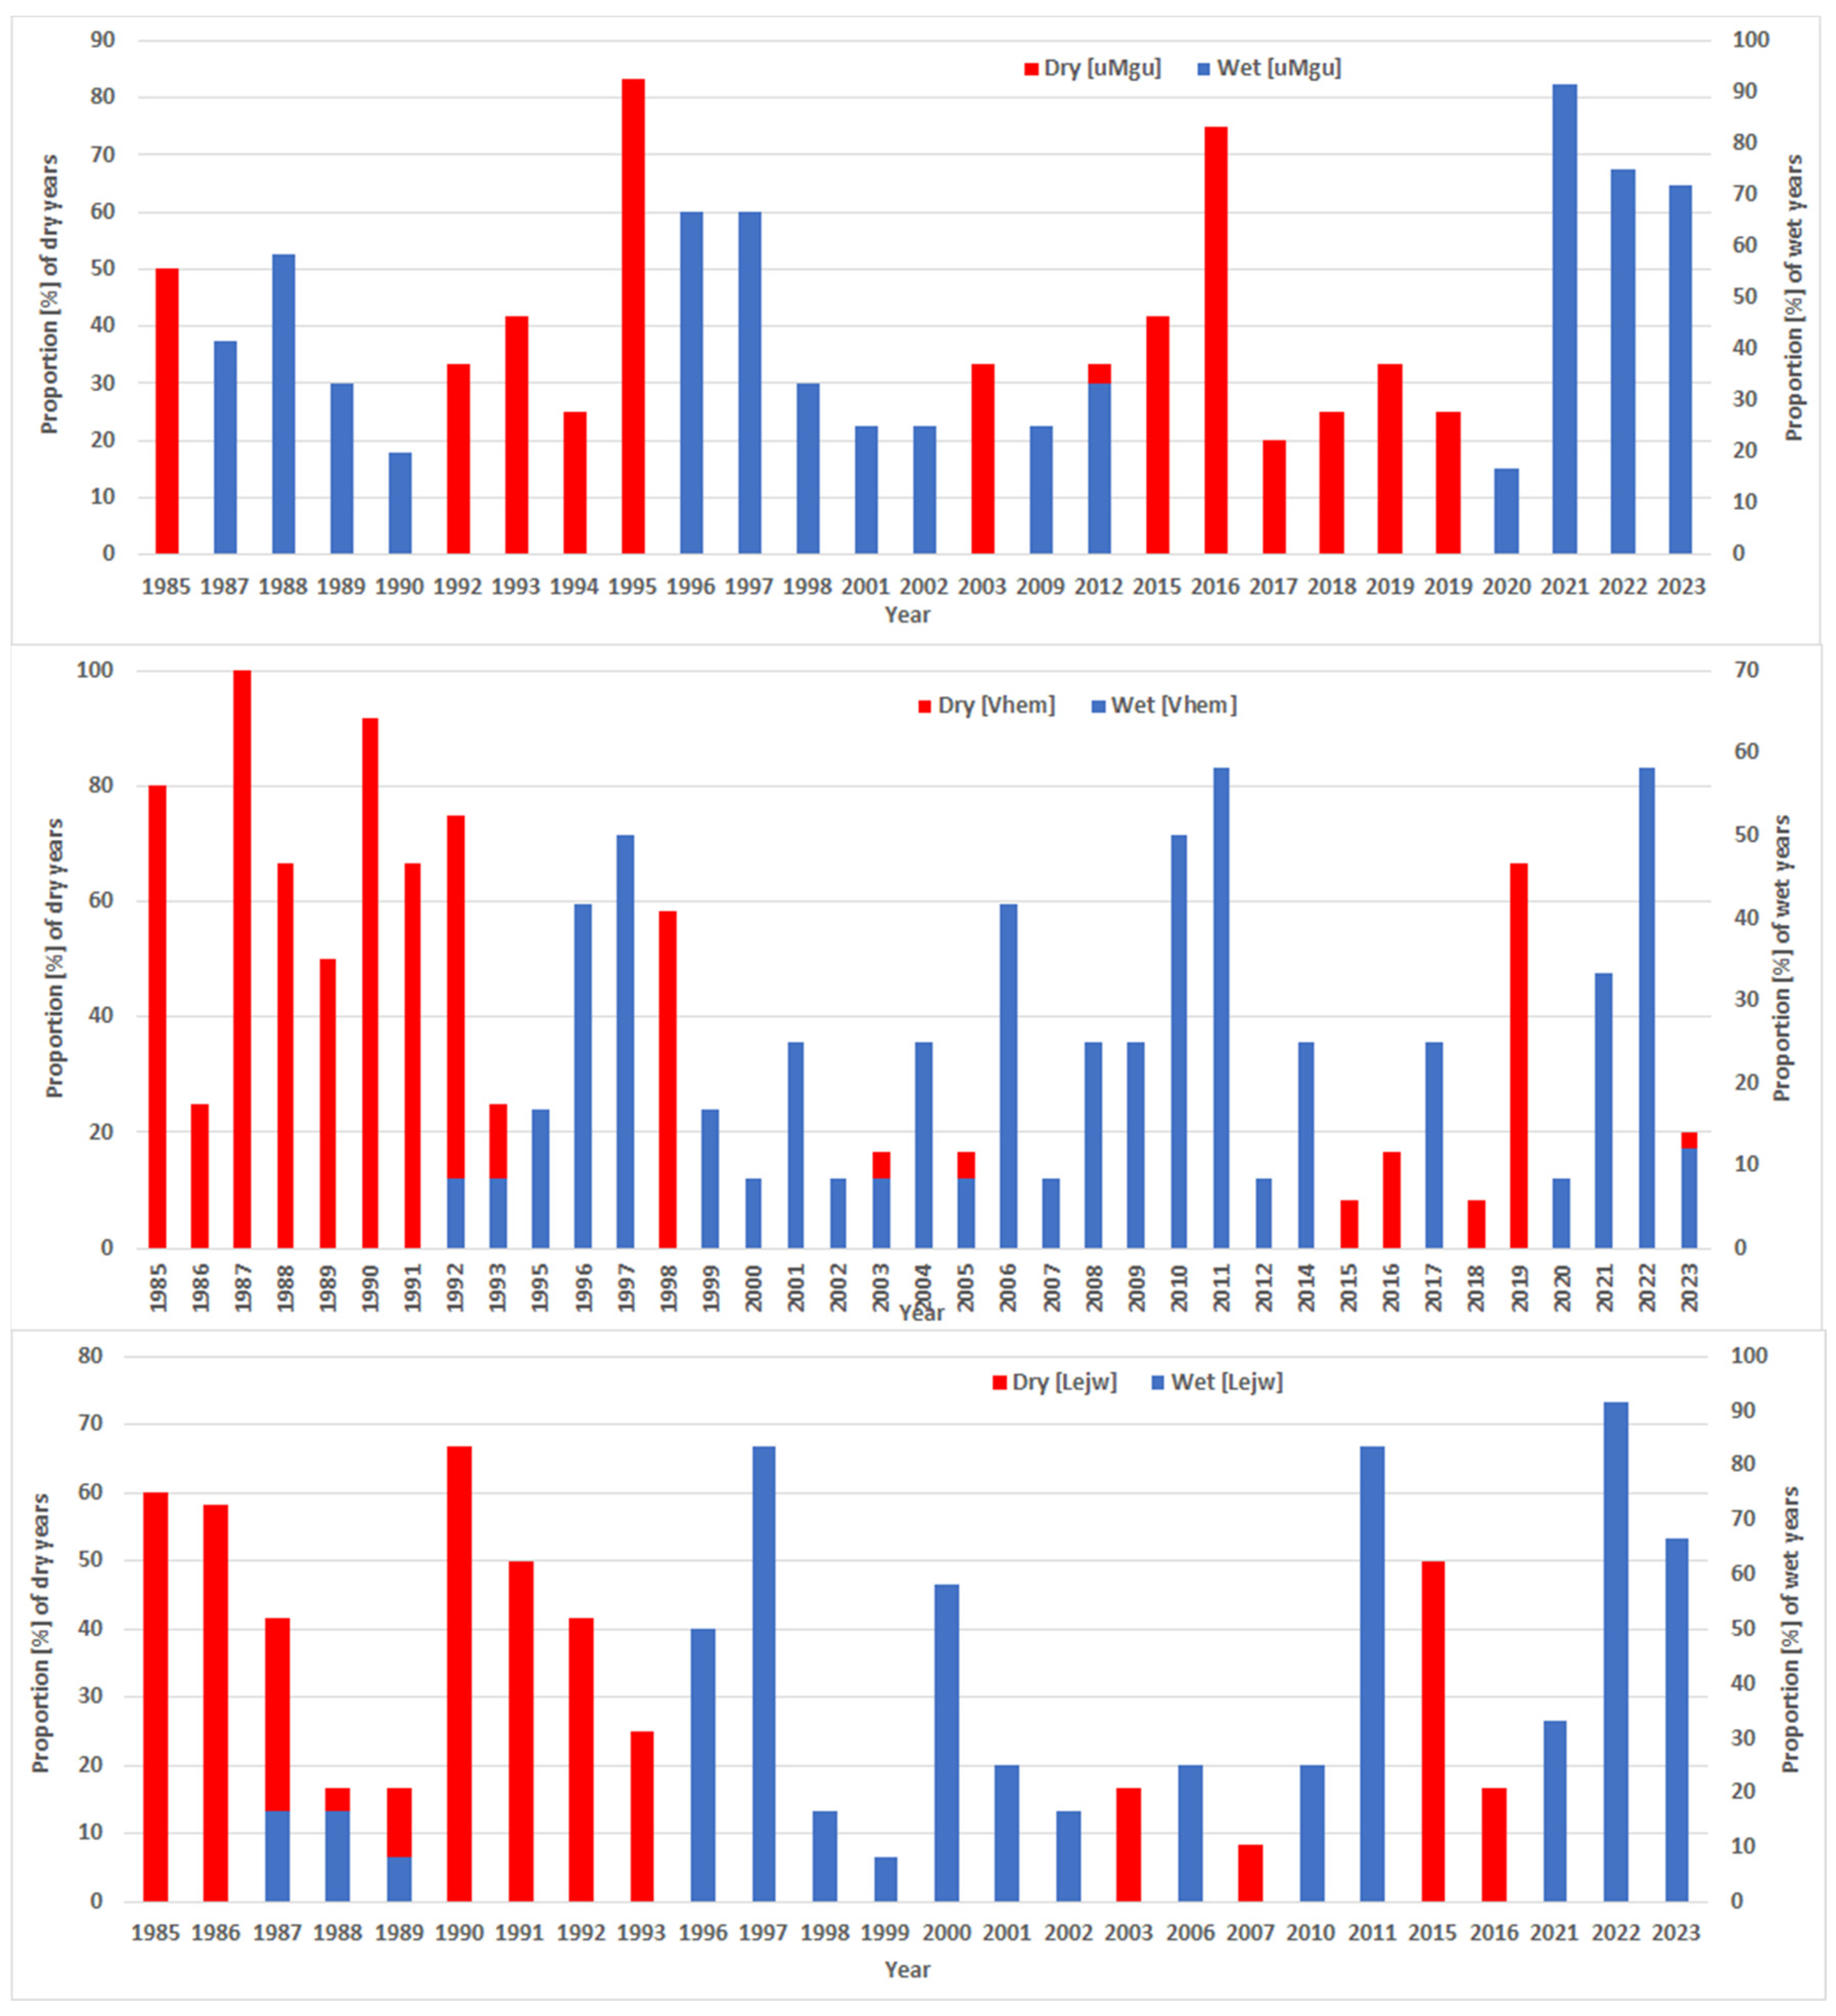
A 3-month average SSI analysis taken from selected stations for each district municipality was used to compute the proportion of dry (equivalent to drought) and wet (excess precipitation) years in each study site based on the methodology described in [46]. A year was considered dry if the SSI ≤ −1.0 and wet if the SSI ≥ 1.0. Years outside these thresholds (e.g., −0.99 < SSI < 0.99) were classified as years exhibiting near-normal conditions. The resulting episodes of the dry and wet years are reported as a percentage count of the respective dry and wet occurrences over 3-month accumulation time-steps (Figure 5). The sum of the proportion of dry, normal, and wet years gives a total of 100%. In this study, only the proportions of dry and wet years are reported. The results indicate that the uMgungundlovu District experienced dry/wet episodes in approximately 32% of all years assessed, e.g., 38 years. The district has consistently experienced drought from 2015 to 2019. Vhembe District experienced dry and wet conditions in 34% and 37% of all the analyzed years, respectively. In particular, continuous dry episodes occurred between 1985 and 1993, whereas wet years predominated from 1999 to 2014. The Lejweleputswa District Municipality experienced few dry and wet years (28%) compared to the two other districts. Dry episodes consistently occurred from 1985 to 1993. Overall, the three district municipalities experienced consistent wet episodes in the last three years, e.g., 2021–2023.

3.2.3. Trends in Drought Duration and Severity

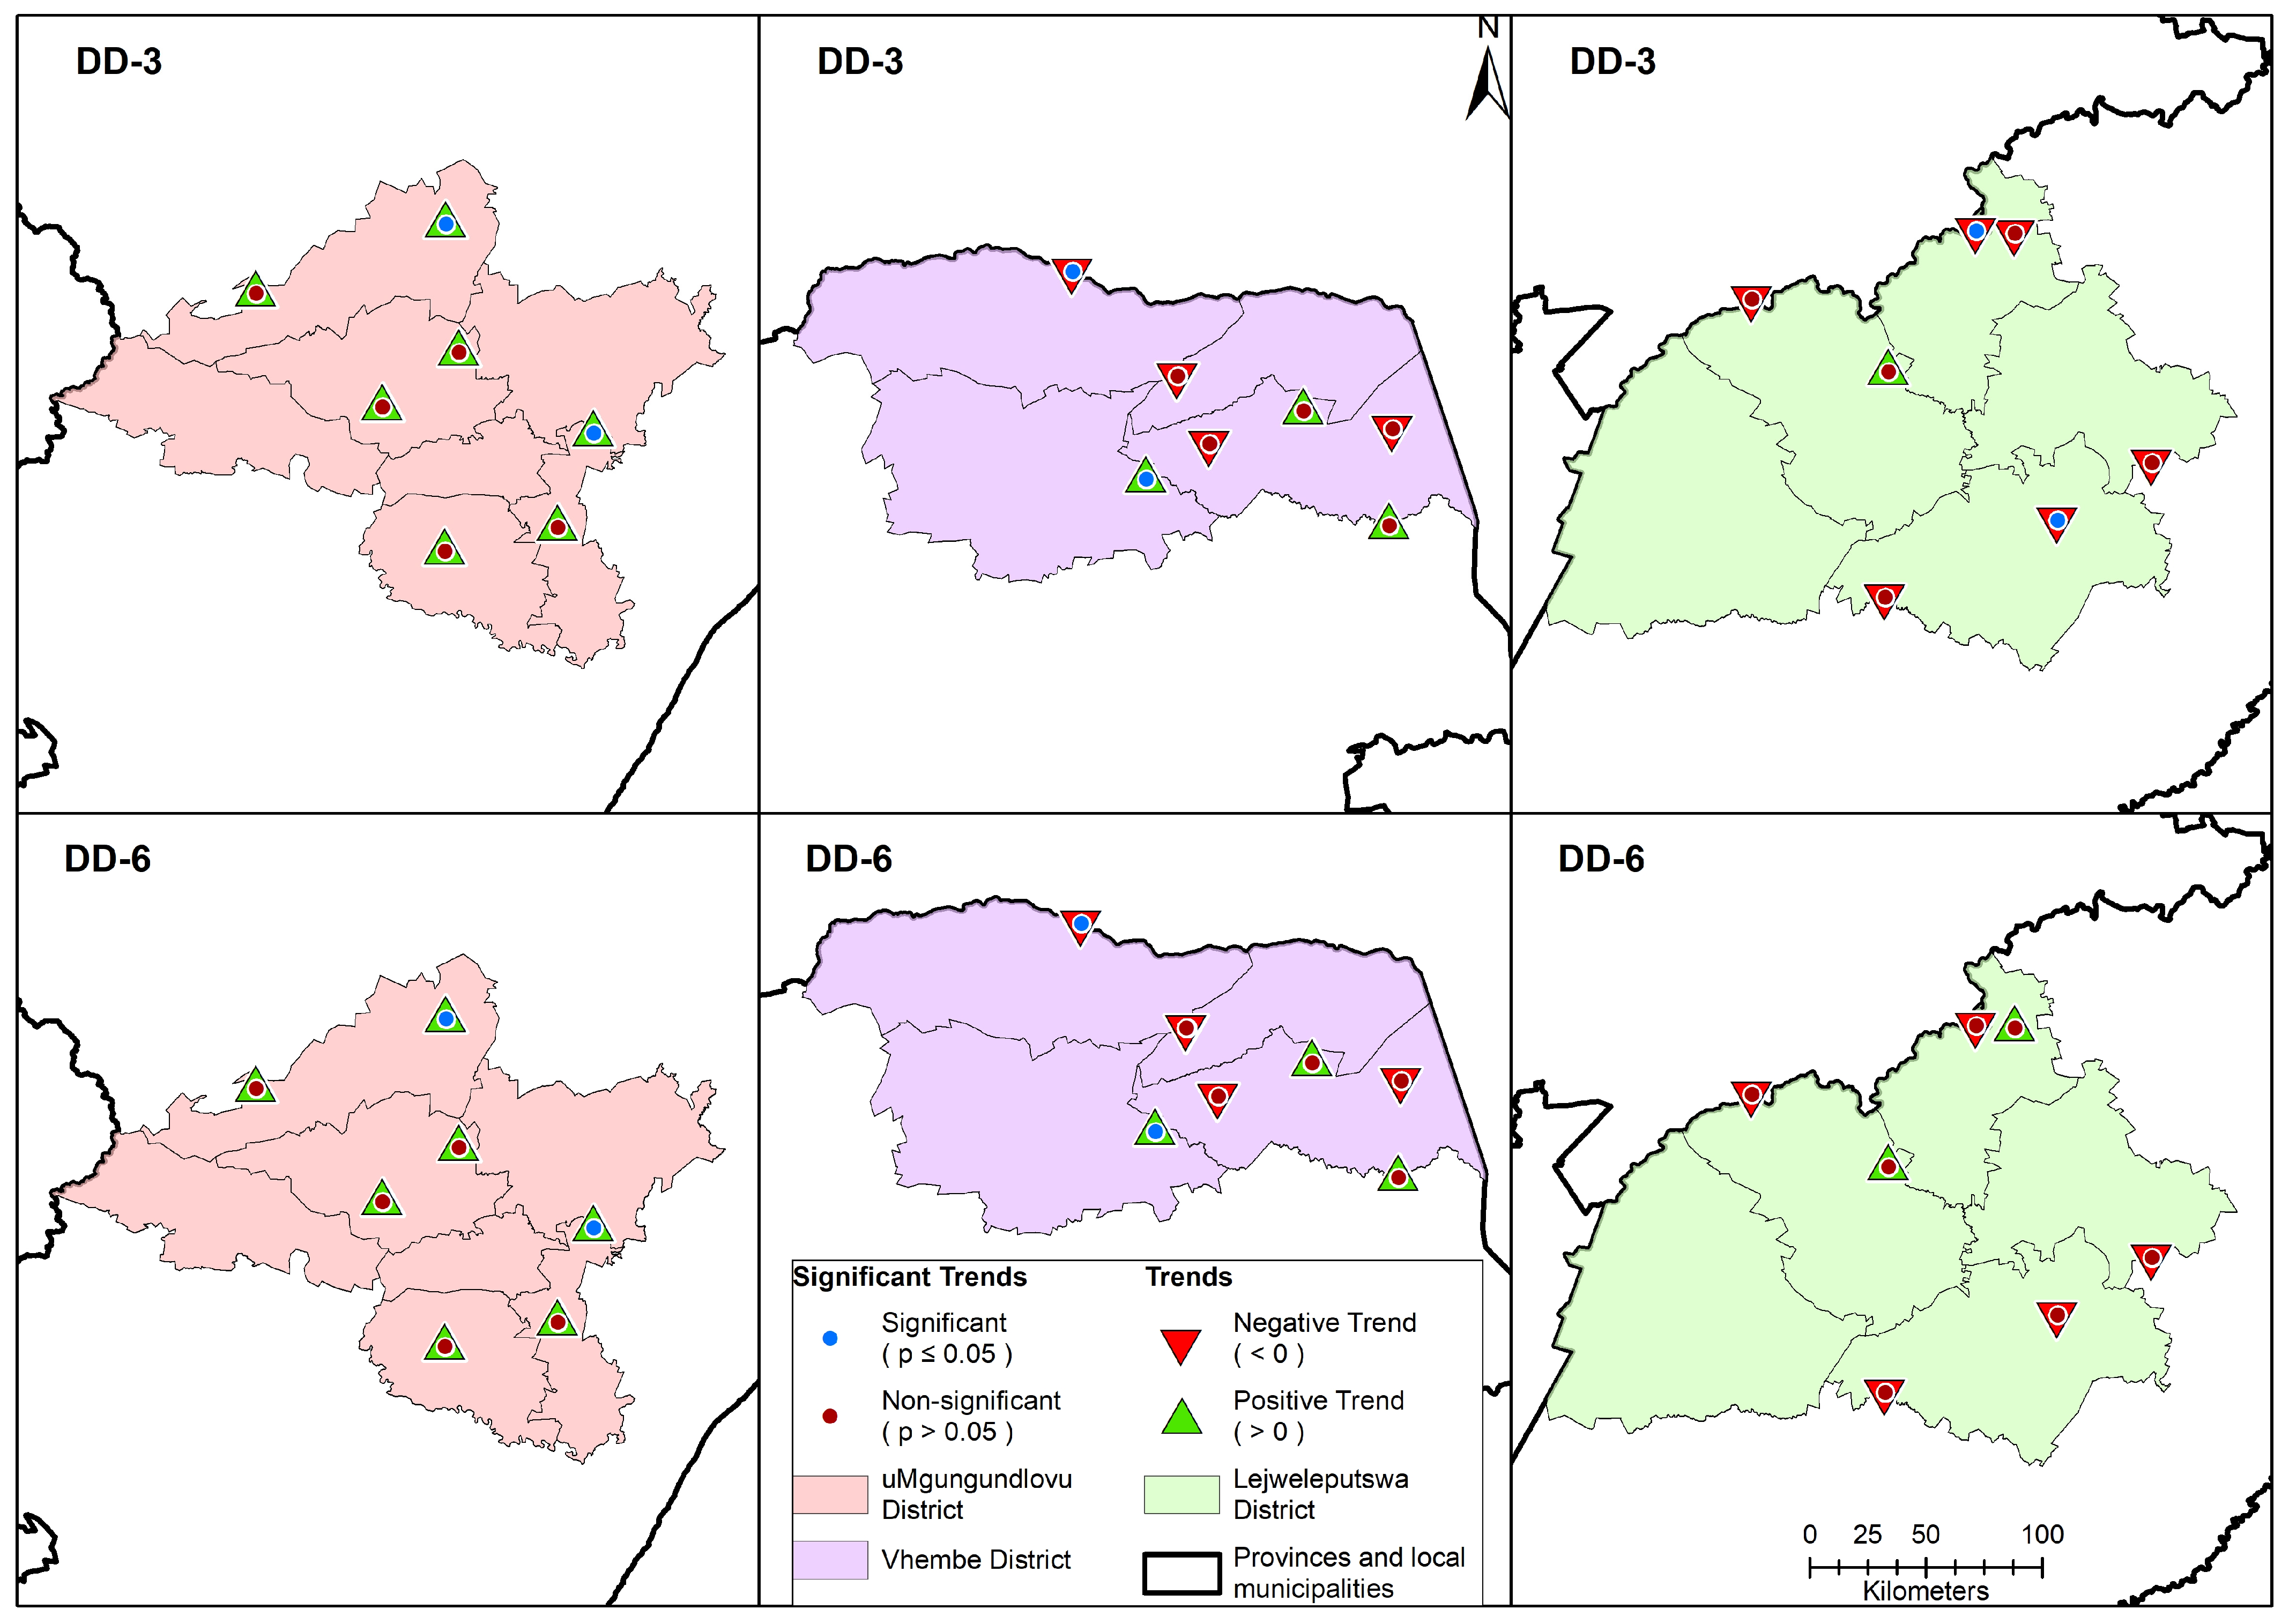
The trends in DD, based on the analysis of the SSI-3 and -6 time series, indicate an increasing trend pattern across the uMgungundlovu District Municipality (Figure 6). The observed trends are statistically significant in only two of the river gauges. Moreover, the detected upward trend suggests that that duration of drought in uMgungundlovu has decreased over the assessed period. Four of the river gauges exhibit negative trends in Vhembe District Municipality based on both the SSI-3 and SSI-6 analysis, respectively. Both the SSI-3 and SSI-6 analysis depict similar patterns of the observed trends in DD. These results suggest that the upper north of the Vhembe District has experienced less DD, whereas the southeastern areas experienced longer DD. The Lejweleputswa District Municipality recorded negative trends in six of the seven river gauges, suggesting that the region has mostly experienced longer DD over the investigated period (1985–2023).
Figure 7 depicts the spatial distribution of trends in DS across the three district municipalities. A similar trend pattern is observed for the DS across the accumulation time-steps and district municipalities. The resulting trends in DS suggest that the severity of drought has decreased (e.g., positive trends in all except one gauge station under SSI-3) in the uMgungundlovu and increased in most parts of Vhembe and Lejweleputswa District Municipalities, as supported by observed negative trends in DS.
Figure 8 shows the spatial distribution of the DD mean for each of the study sites. The average DD ranges from approximately 6 to 11 months in uMgungundlovu, 2 to about 7 months in Vhembe, and 7 to 10 months in Lejweleputswa. Results for the uMgungundlovu District Municipality depict similar spatial distribution patterns for both SSI-3 and SSI-6 analysis. The results indicate that most of the regions in uMgungundlovu experienced drought episodes that lasted between 6 and 7 months over the 38-year period of the study. The southeastern parts of Vhembe District Municipality experienced shorter DD lasting for 2 (SSI-3) and about 4 months for SSI-6 analysis. The central parts of the district where most of the stations are located have experienced longer drought, reaching a maximum of about 7 months. Drought mostly lasted between 7 and 8 months in the western areas of Lejweleputswa and 8 and 9 months towards the eastern regions of the district municipality.
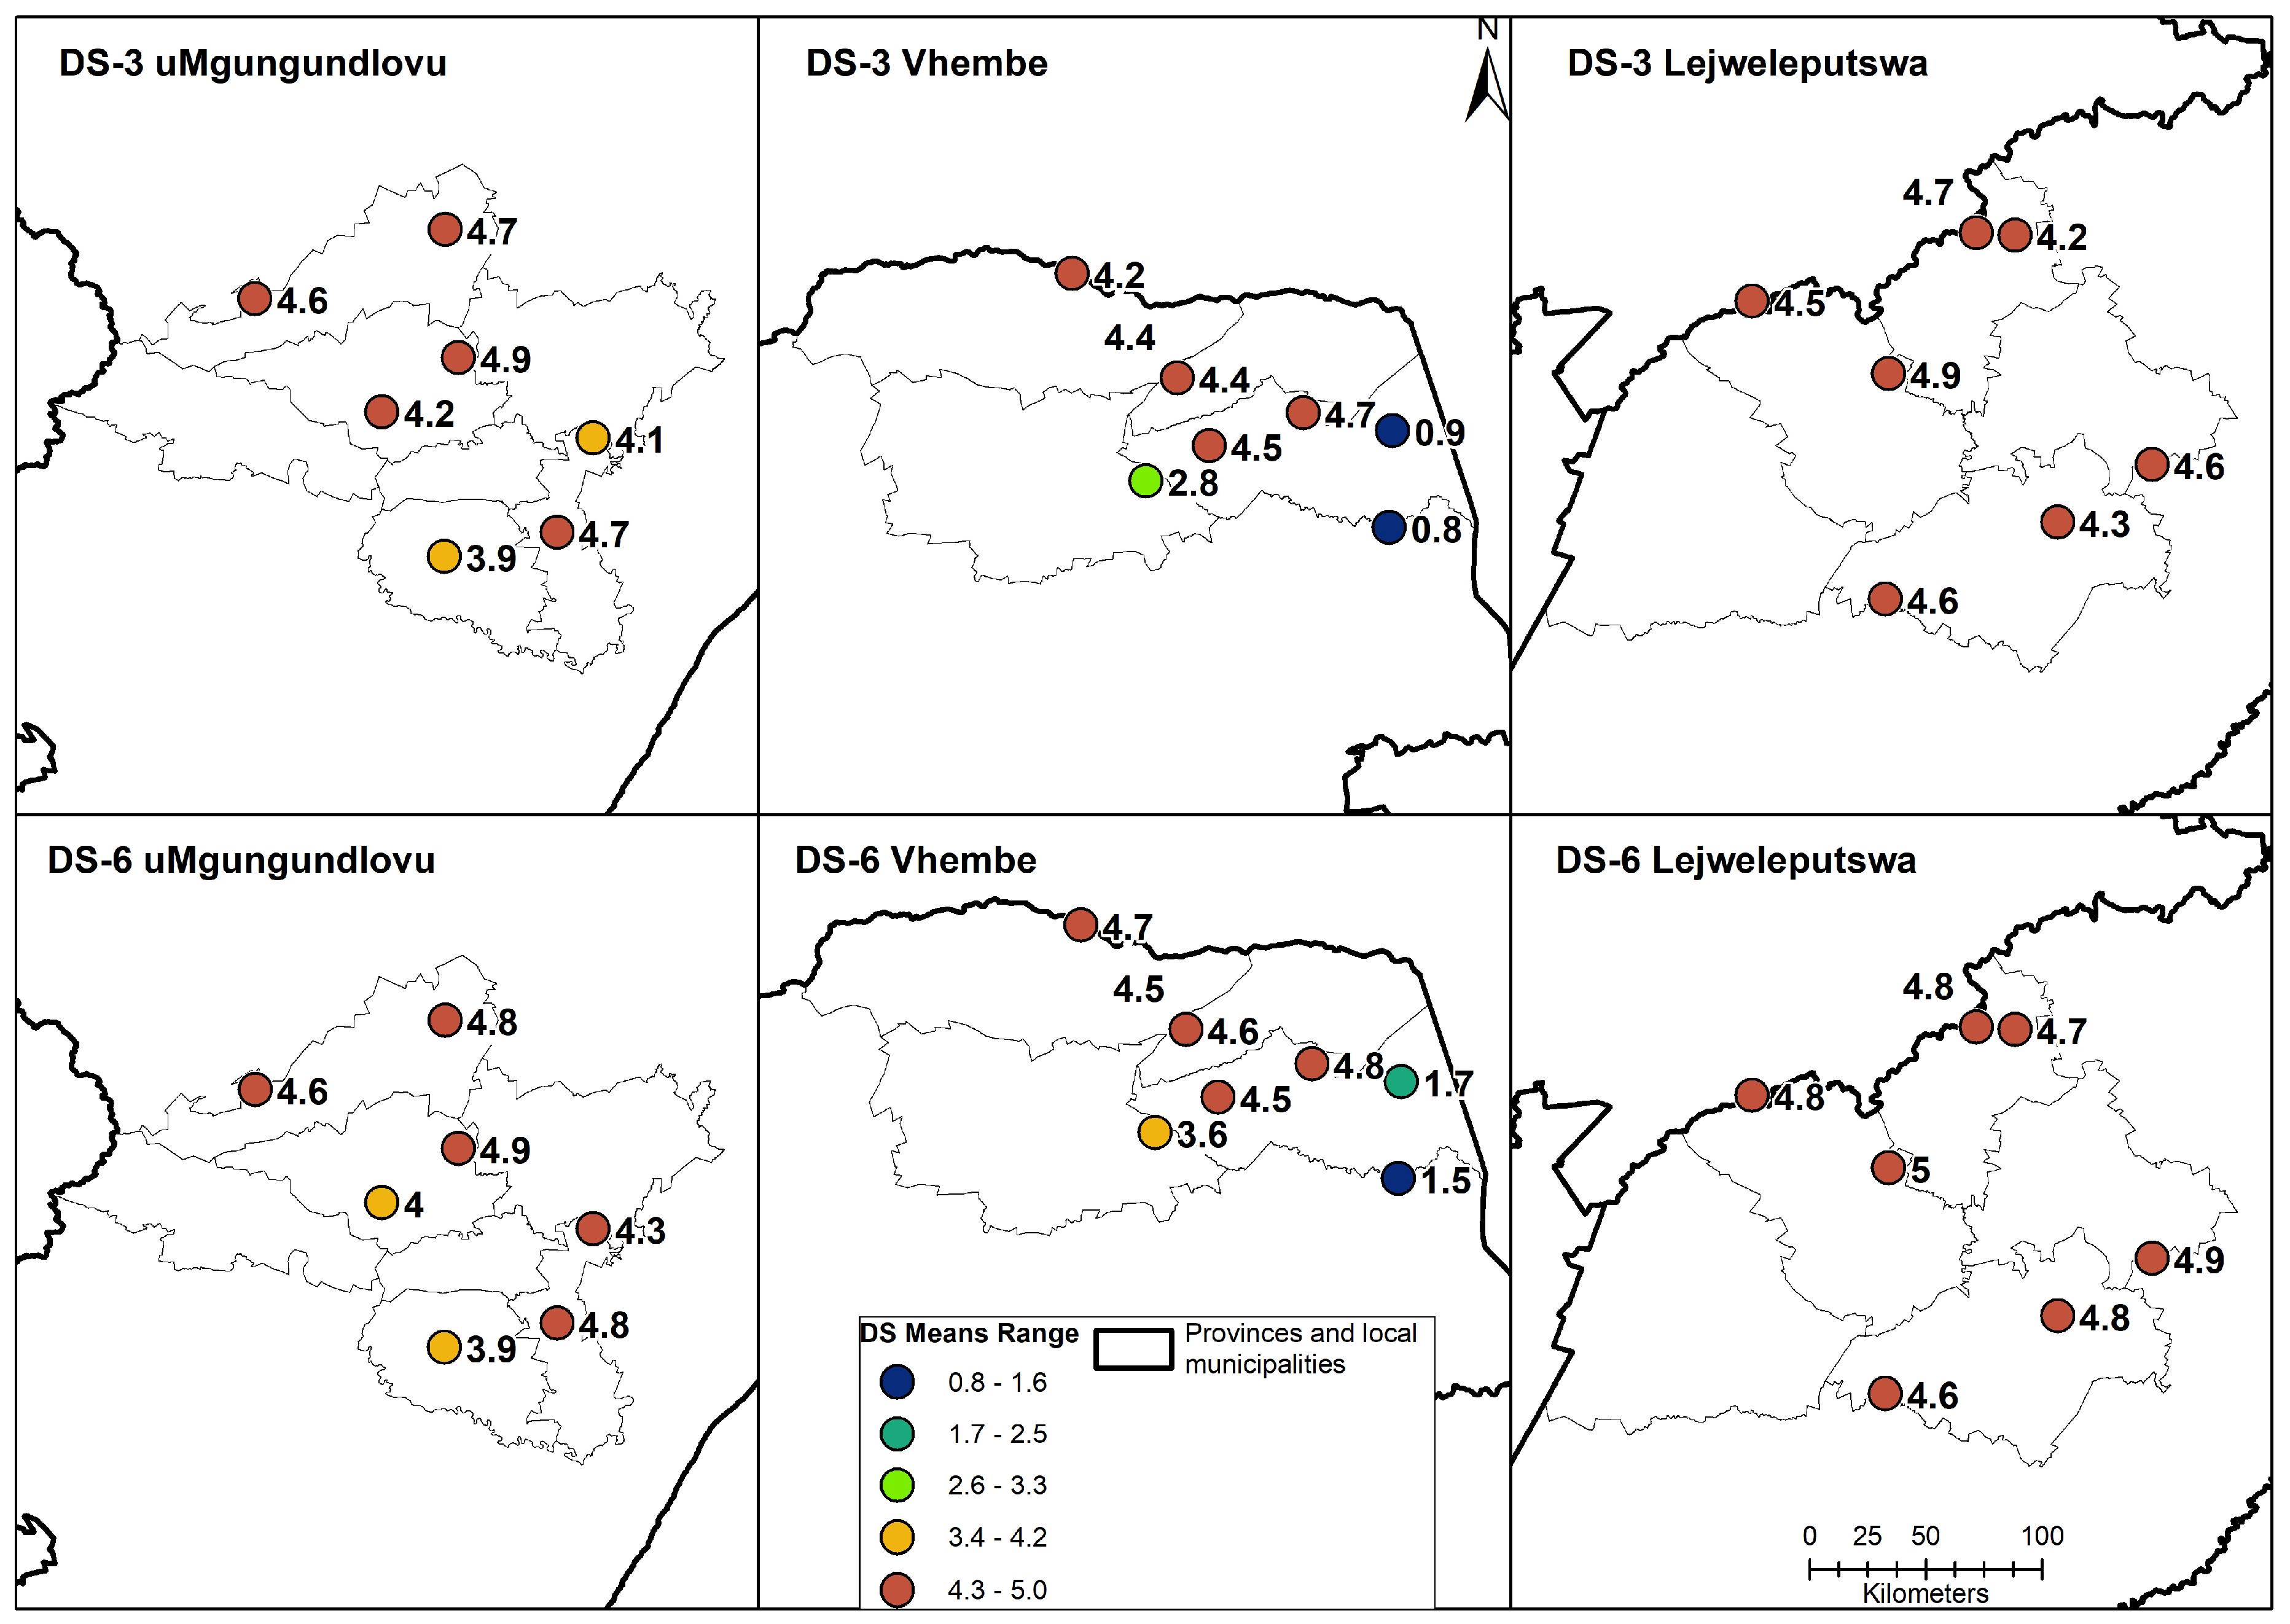
In terms of DS (Figure 9), the severity values ranged between 3.9 and 4.9 (both for SSI-3 and SSI-6) in uMgungundlovu and 0.8–4.7 (SSI-3) and 1.5–4.7 (SSI-6) in Vhembe and 4.2–4.9 (SSI-3) and 4.5–5 (SSI-6) in Lejweleputswa District Municipalities. Only two river stations in the northeastern of Vhembe District recorded less severe drought, ranging between 0.8 and 1.7. Comparable to DD, drought was less severe in the southeastern and southern parts of Vhembe and Lejweleputswa District Municipalities, respectively. Moreover, drought was more severe in the central and towards the northern parts of Vhembe as well as in the southeastern and northern parts of Lejweleputswa District Municipalities.

4. Discussion

South Africa is considered a semi-arid to arid country and has enormous dry lands, making the region prone to variations in precipitation and other climatic variables, resulting in hydroclimatic extremes such as floods and drought. The present study investigated hydroclimatic extremes in uMgungundlovu, Vhembe, and Lejweleputswa District Municipalities, situated in KwaZulu-Natal, Limpopo, and Free State Provinces of South Africa, respectively. While the three municipalities fall under the summer rainfall season, there are several aspects that differentiate the regions. These include the size of the land area, land use, population size, unemployment rate, climatic conditions, especially in terms of precipitation and temperature variations, as well as the key socio-economic activities that sustain each of the district municipalities. These factors contribute to the changes in streamflow and the occurrences of hydroclimatic extremes thereof. Consequently, selected statistical metrics, e.g., trends in annual mean and maximum streamflow, low/high flow quantiles, drought events based on SSI-3 and -6, as well as drought features characterized by their duration and severity, were examined to understand the historical changing patterns of these metrics and assess their impacts on water-linked sectors under the changing climate.
The results indicate that annual and maximum streamflow are highly variable (mostly localized) across the three district municipalities. This is in accordance with the variation in precipitation, given that streamflow is directly influenced by changes in rainfall coupled with evapotranspiration. Negative trends in annual, maximum, seasonal, and high (low) streamflow were mostly recorded in uMgungundlovu District Municipality, implying that streamflow has declined in the region during the 38-year period of analysis. These findings are in accordance with studies by Jury [47], which reported a drying trend in KwaZulu Natal (Tugela Valley) characterized by declining wet spells, river discharge, and rising potential evaporation in the period of 1950–2100. Elsewhere, decreasing trends in annual streamflow were recorded in the Northern, Eastern, and Western Cape Provinces during 1985–20202 [16]. Moreover, Ntleko [48] reported decreasing trends in the frequency, intensity, and duration of extreme rainfall events in KwaZulu-Natal Province over the period 1989–2019, with such findings having a significant impact on river discharge. The Vhembe and Lejweleputswa District Municipalities have experienced both increased and decreased streamflow (trends are inclusive of all assessed flow metrics) during the current investigated period. The results for Vhembe District Municipality are in accordance with those reported by Botai et al. [17], where most regions in the Limpopo River Basin recorded a decline, while few of them showed an increase in historical streamflow over the period 1976 and 2005 as well as in projected streamflow for the period 2036–2099. Similar studies on decreased annual rainfall and temperature trends in the Limpopo River Basin over the period 1979 to 2013 were reported by Mosase and Ahiablame [49], as well as significant reductions in projected annual rainfall by 2030 reported in Zhu and Ringler [50].
Moreover, trends in SSI-3 and SSI-6 accumulation time-steps indicate that drought conditions have increased across the uMgungundlovu District Municipality, as well as in the southeastern parts of Vhembe and towards the central of the Lejweleputswa District Municipality. It is worth noting that most regions of the Lejweleputswa District Municipality have experienced noticeable wet conditions during the 38-year study period. While drought in the current study was measured using the Standardized Streamflow Index, which is computed based on streamflow data, only few studies have been reported in the literature where a similar approach has been applied. Most of the drought-related studies conducted in the Free State and KwaZulu-Natal have used the SPI and the Standardized Precipitation Evapotranspiration Index (SPEI). Nonetheless, the findings reported in this study are in accordance with studies reported in the Free State based on the SPI and SPEI analysis [51] and Effective Drought Index [52] in KwaZulu-Natal based on the SPI [53] and Limpopo River Basin based on the SSI analysis [17].
In addition, the results indicate that the duration and severity of the drought have increased over the years, with uMgungundlovu being the most affected district municipality, whereby the entire region experienced a noticeable increase in both DD and DS. Most regions in Vhembe District Municipality experienced prolonged and severe drought, with exceptions to the southeastern areas. Moreover, prolonged DD was observed in the southeastern parts of the Lejweleputswa District Municipality. The SSI, DD, and DS trend results reported for the Lejweleputswa District Municipality are in accordance with those reported in drought characteristics analysis in the Northern Cape, Eastern Cape, and Western Cape Provinces of South Africa [16], as well as in the Free State and northwest provinces [51].
The results presented in this study, particularly the persistence of prolonged drought as well as increased severity, have detrimental impacts on various climate-sensitive and socio-economic sectors, including water resources, agriculture, food security, health, and energy, among others [54,55]. South Africa is generally a water-stressed country, so any form of drought in these district municipalities is likely to affect cross-cutting systems in water-limited regions. Studies by Botai et al. [17] projected increased frequencies of drought events in the Limpopo River Basin for the near- (2036–2065) and far-future (2070–2099) periods. Based on the outcomes of streamflow and drought features reported in this study, it is clear that most parts of Vhembe District Municipality have experienced a decline in streamflow and increased drought events over the 38-year period of study. Consequently, a continuation of these extreme patterns, supported by projections reported in [17], is likely to intensify the already high level of the water crisis in the region. Most parts of KwaZulu-Natal Province experience water shortages attributed to poor water infrastructure maintenance as well as a lack and/or failure of municipal planning, which results in poor financial management [56]. uMgungundlovu has been found to be the most affected district municipality, having experienced the most frequent occurrences of extreme events. Consequently, prolonged drought extremes, coupled with the province’s drawback on water-related infrastructure, are likely to compromise efforts to deliver water services in the region. Moreover, while most regions in Lejweleputswa have experienced a decrease in drought, prolonged duration and increased severity of drought have been observed in some parts of the district municipality. Such conditions are likely to affect agricultural activities and exacerbate many challenges faced by the province, including the high unemployment rate, poverty, low economic growth, migration, as well as degradation of the natural environment [57]. Overall, the findings presented in this study, e.g., the decreasing trends in streamflow and SSI-3/6 in uMgungundlovu and increasing trends in streamflow/SSI-3/6 in Lejweleputswa, suggest that uMgungundlovu and Lejweleputswa regions are more prone to drought and floods, respectively. The results indicate that the Vhembe District Municipality is prone to both drought and floods at a localized scale.

5. Conclusions

In this study, hydroclimatic extremes in Vhembe (Limpopo Province), uMgungundlovu (KwaZulu-Natal Province), and Lejweleputswa (Free State Province) district municipalities were analyzed based on a number of selected indicators, which included the mean annual and maximum streamflow, as well as trends in annual, maximum, seasonal, and high/low flow for the period 1985–2023. The SSI-3 and SSI-6 time series were used to assess drought conditions across the three district municipalities in the 38-year period of the study. In addition, the MK trend analysis was performed on both annual SSI-3 and SSI-6 as well as on drought duration and severity derived from the SSI-3 and SSI-6 time series. Overall, the results depict localized variability for each of the district municipalities, pointing to the following conclusions:
-
Six out of the seven assessed rainfall districts in uMgungundlovu District Municipality exhibited negative trends in both annual mean and maximum streamflow, as well as in high and low flow, suggesting that streamflow has declined across the district municipality during the 1985–2023 investigated period. Moreover, negative trends in SSI were detected in six of the river stations, further suggesting an increase in drought conditions during the period of analysis.
-
In Lejweleputswa District Municipality, five and all seven of the river gauged stations showed positive trends in annual and maximum streamflow, respectively. Moreover, six of the river gauged stations depicted positive trends in high/low flow and in the SSI-3/6 time series. The results for Lejweleputswa suggest that the district municipality has experienced increased streamflow (which could be associated with floods) and decreased drought conditions over the investigated period.
-
The Vhembe District Municipality has experienced both an increase (upper north) and decrease (southeastern parts) in streamflow and SSI-3/6 during the 1985–2023 study period, suggesting that the region is characterized by both localized dry and wet conditions that could be associated with drought and floods, respectively.
The present study contributes towards drought monitoring and management in support of the better management of water resources, including the development of drought-related policy- and decision-making strategies to mitigate impacts of weather and climate extreme events. Based on the current findings, it is recommended that proper adaptation strategies, including water harvesting and cultivation of resistant crop varieties, among others, be planned by agricultural sectors in order to ensure food security, particularly in the uMgungundlovu and parts of the Vhembe District Municipalities, where significant drought conditions were detected.

Author Contributions

Conceptualization, C.M.B.; methodology, C.M.B.; validation, J.O.B.; formal analysis, C.M.B. and J.P.d.W.; investigation, C.M.B. and J.O.B.; data curation, J.P.d.W.; writing—original draft preparation, C.M.B.; writing—review and editing (All); visualization, J.P.d.W. All authors have read and agreed to the published version of the manuscript.

Funding

This research was funded by the Government of Flanders as part of the Integrated Climate-driven Multi-Hazard Early Warning System, project number 2020 2896.

Data Availability Statement

The raw data supporting the conclusions of this article will be made available by the authors on request.

Acknowledgments

The authors wish to express their appreciation to the anonymous reviewers for providing extensive comments and suggestions that lead to the improvement in the quality of this manuscript.

Conflicts of Interest

The authors declare no conflicts of interest.

References

  1. Sagna, P.; Dipama, J.M.; Vissin, E.W.; Diomande, B.I.; Diop, C.; Chabi, P.A.B.; Sambou, P.C.; Sane, T.; Karambiri, B.L.C.N.; Koudamiloro, O.; et al. Climate Change and Water Resources in West Africa: A Case Study of Ivory Coast, Benin, Burkina Faso, and Senegal. In Climate Change and Water Resources in Africa; Diop, S., Scheren, P., Niang, A., Eds.; Springer: Cham, Switzerland, 2021. [Google Scholar] [CrossRef]
  2. Raikes, J.; Smith, T.F.; Jacobson, C.; Baldwin, C. Pre-disaster planning and preparedness for floods and droughts: A systematic review. Int. J. Disaster Risk Reduct. 2019, 38, 101207. [Google Scholar] [CrossRef]
  3. IPCC. Working Group I Contribution to the IPCC Fifth Assessment Report, Climate Change 2013: The Physical Science Basis; IPCC: Geneva, Switzerland, 2013. [Google Scholar]
  4. IPCC. Climate Change 2007: Impacts, Adaptations, and Vulnerability. Contribution of Working Group Fourth Assessment Report of the IPCC; Parry, M.L., Canziani, O.F., Palutikof, J.P., van der Linden, P.J., Hanson, C.E., Eds.; Cambridge University Press: Cambridge, UK, 2007. [Google Scholar]
  5. Trenberth, K.E. Changes in precipitation with climate change. Clim. Res. 2011, 47, 123–138. [Google Scholar] [CrossRef]
  6. Asadieh, B.; Krakauer, N.Y.; Fekete, B.M. Historical trends in mean and extreme runoff and streamflow based on observations and climate models. Water 2016, 8, 189. [Google Scholar] [CrossRef]
  7. Kusangaya, S.; Mazvimavi, D.; Shekede, M.D.; Masunga, B.; Kunedzimwe, F.; Manatsa, D. Climate Change Impact on Hydrological Regimes and Extreme Events in Southern Africa. In Climate Change and Water Resources in Africa; Diop, S., Scheren, P., Niang, A., Eds.; Springer: Cham, Switzerland, 2021. [Google Scholar] [CrossRef]
  8. EM-DAT: The International Disaster Database. Available online: https://doc.emdat.be/docs (accessed on 24 September 2024).
  9. Botai, C.M.; Botai, J.O.; De Wit, J.P.; Ncongwane, K.P.; Adeola, A.M. Drought Characteristics over the Western Cape Province, South Africa. Water 2017, 9, 876. [Google Scholar] [CrossRef]
  10. Botai, C.M.; Botai, J.O.; Adeola, A.M.; de Wit, J.P.; Ncongwane, K.P.; Zwane, N.N. Drought risk analysis in the Eastern Cape Province of South Africa: The copula lens. Water 2020, 12, 1938. [Google Scholar] [CrossRef]
  11. Abtew, W.; Melesse, A.M.; Dessalegne, T. El Niño Southern Oscillation link to the Blue Nile River Basin hydrology. Hydrol. Process. 2009, 23, 3653–3660. [Google Scholar] [CrossRef]
  12. Arnell, N.W. Climate change and global water resources: SRES emissions and socio-economic scenarios. Glob. Environ. Chang. 2004, 14, 31–52. [Google Scholar] [CrossRef]
  13. Oki, T.; Kanae, S. Global hydrological cycles and world water resources. Science 2006, 313, 1068–1072. [Google Scholar] [CrossRef]
  14. Swain, S.S.; Mishra, A.; Chatterjee, C.; Sahoo, B. Climate-changed versus land-use altered streamflow: A relative contribution assessment using three complementary approaches at a decadal time-spell. J. Hydrol. 2021, 596, 126064. [Google Scholar] [CrossRef]
  15. Rodgers, K.; Roland, V.; Hoos, A.; Crowley-Ornelas, E.; Knight, R. An Analysis of Streamflow Trends in the Southern and Southeastern US from 1950–2015. Water 2020, 12, 3345. [Google Scholar] [CrossRef]
  16. Botai, C.M.; Botai, J.O.; de Wit, J.P.; Ncongwane, K.P.; Murambadoro, M.; Barasa, P.M.; Adeola, A.M. Hydrological Drought Assessment Based on the Standardized Streamflow Index: A Case Study of the Three Cape Provinces of South Africa. Water 2021, 13, 3498. [Google Scholar] [CrossRef]
  17. Botai, C.M.; Botai, J.O.; Zwane, N.N.; Hayombe, P.; Wamiti, E.K.; Makgoele, T.; Murambadoro, M.D.; Adeola, A.M.; Ncongwane, K.P.; de Wit, J.P.; et al. Hydroclimatic extremes in the Limpopo River Basin, South Africa, under changing climate. Water 2020, 12, 3299. [Google Scholar] [CrossRef]
  18. Lakhraj-Governder, R.; Grab, S.W. Rainfall and river flow trends for the Western Cape Province, South Africa. S. Afr. J. Sci. 2019, 115, 1–6. [Google Scholar]
  19. Legesse, D.; Vallet-Coulomb, C.; Gasse, F. Hydrological response of a catchment to climate and land use changes in Tropical Africa: Case study South Central Ethiopia. J. Hydrol. 2003, 275, 67–85. [Google Scholar] [CrossRef]
  20. Wang, J.; Li, H.; Hao, X. Responses of snowmelt runoff to climatic change in an inland river basin, northwestern China, over the past 50 years. Hydrol. Earth Syst. Sci. 2010, 15, 1979–1987. [Google Scholar] [CrossRef]
  21. Kuriqi, A.; Ali, R.; Pham, Q.B.; Montenegro Gambini, J.; Gupta, V.; Malik, A.; Linh, N.T.T.; Joshi, Y.; Anh, D.T.; Nam, V.T.; et al. Seasonality shift and streamflow flow variability trends in central India. Acta Geophys. 2020, 68, 1461–1475. [Google Scholar] [CrossRef]
  22. Islam, A.; Sikka, A.K.; Saha, B.; Singh, A. Streamflow response to climate change in the Brahmani River Basin, India. Water Resour. Manag. 2012, 26, 1409–1424. [Google Scholar] [CrossRef]
  23. Patil, R.; Wei, Y.; Pullar, D.; Shulmeister, J. Evolution of streamflow patterns in Goulburn-Broken catchment during 1884–2018 and its implications for floodplain management. Ecol. Indic. 2020, 113, 106277. [Google Scholar] [CrossRef]
  24. Zhang, X.S.; Amirthanathan, G.E.; Bari, M.A.; Laugesen, R.M.; Shin, D.; Kent, D.M.; MacDonald, A.M.; Turner, M.E.; Tuteja, N.K. How streamflow has changed across Australia since the 1950s: Evidence from the network of hydrologic reference stations. Hydrol. Earth Syst. Sci. 2016, 20, 3947–3965. [Google Scholar] [CrossRef]
  25. Ficklin, D.L.; Luo, Y.; Luedeling, E.; Zhang, M. Climate change sensitivity assessment of a highly agricultural watershed using SWAT. J. Hydrol. 2009, 374, 16–29. [Google Scholar] [CrossRef]
  26. Vivekanandan, N. Flood frequency analysis using method of moments and L-moments of probability distributions. Cogent Eng. 2015, 2, 1018704. [Google Scholar] [CrossRef]
  27. Ilinca, C.; Stanca, S.C.; Anghel, C.G. Assessing Flood Risk: LH-Moments Method and Univariate Probability Distributions in Flood Frequency Analysis. Water 2023, 15, 3510. [Google Scholar] [CrossRef]
  28. Fisher, R.A.; Tippett, L.H.C. Limiting forms of the frequency distribution of the largest and smallest member of a sample. Proc. Camb. Philos. Soc. 1928, 24, 180–190. [Google Scholar] [CrossRef]
  29. Hosking, J.R.M. Algorithm AS 215: Maximum-likelihood estimation of the parameters of the generalized extreme-value distribution. J. R. Stat. Soc. Ser. C (Appl. Stat.) 1985, 34, 301–310. [Google Scholar] [CrossRef]
  30. Martins, E.S.; Stedinger, J.R. Generalized maximum-likelihood generalized extreme-value quantile estimators for hydrologic data. Water Resour. Res. 2000, 36, 737–744. [Google Scholar] [CrossRef]
  31. Gilleland, E.; Katz, R.W. Package ‘extRemes’. J. Stat. Softw. 2016, 72, 1–39. [Google Scholar] [CrossRef]
  32. Modarres, R. Streamflow drought time series forecasting. Stoch. Environ. Res. Risk Assess. 2007, 21, 223–233. [Google Scholar] [CrossRef]
  33. Telesca, L.; Lovallo, M.; Lopez-Moreno, I.; Vicente-Serrano, S. Investigation of scaling properties in monthly streamflow and Standardized Streamflow Index (SSI) time series in the Ebro basin (Spain). Phisica A 2012, 391, 1662–1678. [Google Scholar] [CrossRef]
  34. McKee, T.B.; Doesken, N.J.; Kleist, J. The relationship of drought frequency and duration to time scales. In Proceedings of the 8th Conference on Applied Climatology, Anaheim, CA, USA, 17–22 January 1993; American Meteorological Society: Boston, MA, USA, 1993; pp. 179–183. [Google Scholar]
  35. WMO. Standardized Precipitation Index User Guide; Svoboda, M., Hayes, M., Wood, D., Eds.; WMO-No. 1090; WMO: Geneva, Switzerland, 2012. [Google Scholar]
  36. Shiau, J.T.; Feng, S.; Nadaraiah, S. Assessment of hydrological droughts for the Yellow River, China, using copulas. Hydrol. Process. 2007, 21, 2157–2163. [Google Scholar] [CrossRef]
  37. Tan, C.; Yang, J.; Li, M. Temporal-spatial variation of drought indicated by SPI and SPEI in Ningxia Hui Autonomous region, China. Atmosphere 2015, 6, 1399–1421. [Google Scholar] [CrossRef]
  38. Mann, H.B. Nonparametric tests against trend. Econom. J. Econom. Soc. 1945, 13, 245–259. [Google Scholar] [CrossRef]
  39. Kendall, M.G. Rank Correlation Methods; Charles Grin: London, UK, 1975. [Google Scholar]
  40. Wang, J.; Lin, H.; Huang, J.; Jiang, C.; Xie, Y.; Zhou, M. Variations of drought tendency, frequency, and characteristics and their responses to climate change under CMIP5 RCP scenarios in Huai River Basin, China. Water 2019, 11, 2174. [Google Scholar] [CrossRef]
  41. Kahya, E.; Kalayci, S. Trend analysis of streamflow in Turkey. J. Hydrol. 2004, 289, 128–144. [Google Scholar] [CrossRef]
  42. Dixon, H.; Lawler, D.M.; Shamseldin, A.Y. Streamflow trends in western Britain. Geophys. Res. Lett. 2006, 33, L19406. [Google Scholar] [CrossRef]
  43. Ali, R.; Kuriqi, A.; Abubaker, S.; Kisi, O. Long-term trends and seasonality detection of the observed flow in Yangtze River using Mann-Kendall and Sen’s innovative trend method. Water 2019, 11, 1855. [Google Scholar] [CrossRef]
  44. Chen, Z.; Chen, Y.; Li, B. Quantifying the effects of climate variability and human activities on runoff for Kaidu River Basin in arid region of northwest China. Theor. Appl. Climatol. 2013, 111, 537–545. [Google Scholar] [CrossRef]
  45. Malik, A.; Kumar, A. Spatio-temporal trend analysis of rainfall using parametric and non-parametric tests: Case study in Uttarakhand, India. Theor. Appl. Climatol. 2020, 140, 183–207. [Google Scholar] [CrossRef]
  46. Nkiaka, E.; Nawaz, N.R.; Lovett, J.C. Using standardized indicators to analyse dry/wet conditions and their applications for monitoring drought/floods: A study in the Logone catchment, Lake Chad Basin. Hydrol. Sci. J. 2017, 62, 2720–2736. [Google Scholar] [CrossRef]
  47. Jury, M.R. Historical and projected climatic trends in KwaZulu-Natal: 1950–2100. Water SA 2022, 48, 369–379. [Google Scholar] [CrossRef]
  48. Ntleko, T.P.Z. Exploring extreme rainfall events in KwaZulu-Natal over the period 1989–2019. Master’s Thesis, University of Witwatersrand, Johannesburg, South Africa, 2023. [Google Scholar]
  49. Mosase, E.; Ahiablame, L. Rainfall and temperature in the Limpopo River Basin, southern Africa: Means variations and trends from 1979 to 2013. Water 2018, 10, 364. [Google Scholar] [CrossRef]
  50. Zhu, T.; Ringler, C. Climate Change Implications for Water Resources in the Limpopo River Basin. Technical Report April; IFPRI: Washington, DC, USA, 2010. [Google Scholar]
  51. Botai, C.M.; Botai, J.O.; Dlamini, L.; Zwane, N.; Phaduli, E. Characteristics of Droughts in South Africa: A Case Study of Free State and North West Provinces. Water 2016, 8, 439. [Google Scholar] [CrossRef]
  52. Adeola, O.M.; Masinde, M.; Botai, J.O.; Adeola, A.M.; Botai, C.M. An Analysis of Precipitation Extreme Events Based on the SPI and EDI Values in the Free State Province, South Africa. Water 2021, 13, 3058. [Google Scholar] [CrossRef]
  53. Ndlovu, M.S.; Demlie, M. Assessment of Meteorological Drought and Wet Conditions Using Two Drought Indices Across KwaZulu-Natal Province, South Africa. Atmosphere 2020, 11, 623. [Google Scholar] [CrossRef]
  54. Shayanmehr, S.; Porhajašová, J.I.; Babošová, M.; Sabouhi Sabouni, M.; Mohammadi, H.; Rastegari Henneberry, S.; Shahnoushi Foroushani, N. The Impacts of Climate Change on Water Resources and Crop Production in an Arid Region. Agriculture 2022, 12, 1056. [Google Scholar] [CrossRef]
  55. Veijalainen, N.; Ahopelto, L.; Marttunen, M.; Jääskeläinen, J.; Britschgi, R.; Orvomaa, M.; Belinskij, A.; Keskinen, M. Severe Drought in Finland: Modeling Effects on Water Resources and Assessing Climate Change Impacts. Sustainability 2019, 11, 2450. [Google Scholar] [CrossRef]
  56. Lebek, K.; Twomey, M.; Krueger, T. Municipal failure, unequal access and conflicts over water: A hydrosocial perspective on water insecurity of rural households in KwaZulu-Natal, South Africa. Water Altern. 2021, 14, 271–292. [Google Scholar]
  57. Free State Economy Green Strategy. 2014. Available online: https://www.dffe.gov.za/sites/default/files/docs/greeneconomystrategy_freestate.pdf (accessed on 10 August 2024).
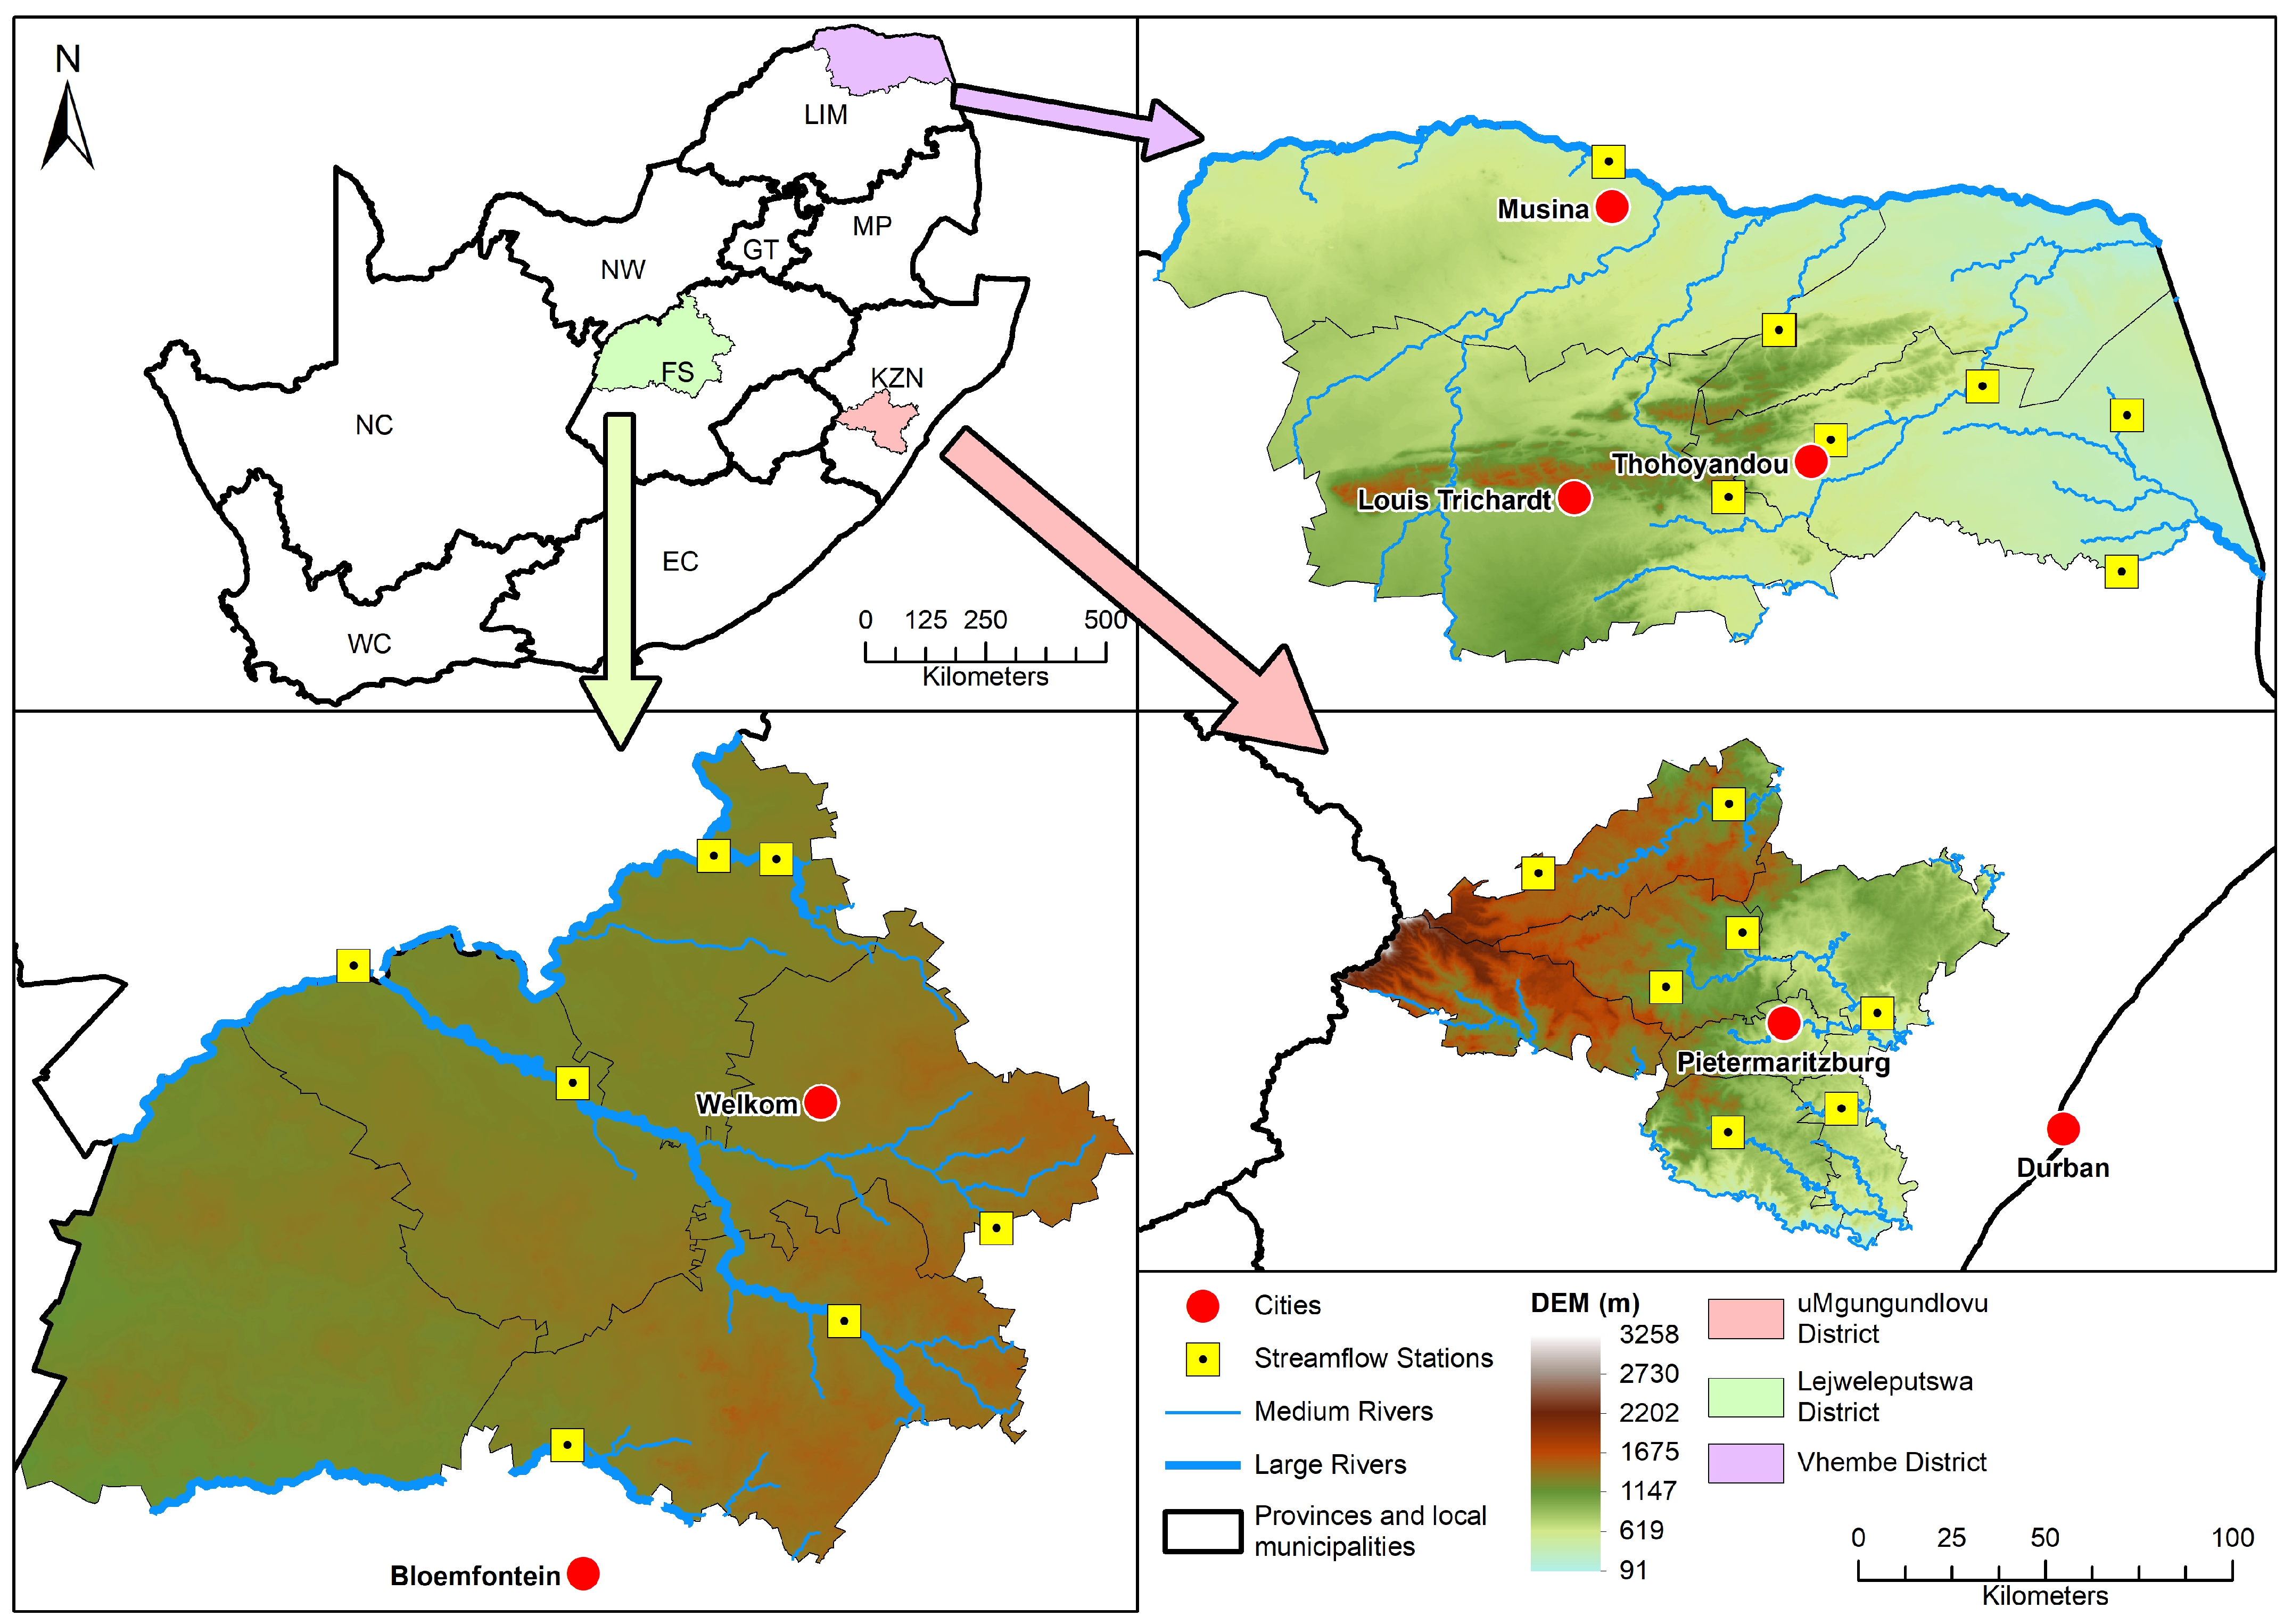
Figure 1. Study area map of the three district municipalities with the spatial distribution of streamflow stations.
Water 16 02924 g001
Figure 2. Trends in annual mean (top panel) and maximum (bottom panel) streamflow (m3/s) for each of the three district municipalities for the period spanning 1985–2023. Up- and down-pointing triangles correspond to positive and negative trends, with blue and brown symbols corresponding to statistically significant and non-significant trends, respectively.
Water 16 02924 g002
Figure 3. Trends in streamflow quantiles (low = Q0.1 and high = Q0.9) for each district municipality during the 1985–2023 investigated period. Up- and down-pointing triangles correspond to positive and negative trends, with blue and brown symbols corresponding to statistically significant and non-significant trends, respectively.
Water 16 02924 g003
Figure 4. Trends in Standardized Streamflow Index (SSI-3 and SSI-6) across the district municipalities during the 1985–2023 assessed period. Up- and down-pointing triangles correspond to positive and negative trends, with blue and brown symbols corresponding to statistically significant and non-significant trends, respectively.
Water 16 02924 g004
Figure 5. The proportion (%) of dry and wet years in (top): uMgungundlovu, (middle): Vhembe, and (bottom): Lejweleputswa District Municipalities based on the SSI-3 time series.
Water 16 02924 g005
Figure 6. Trends in drought duration based on the analysis of the SSI-3 and SSI-6 time series across the district municipalities during the 1985–2023 investigated period. Up- and down-pointing triangles correspond to positive and negative trends, with blue and brown symbols corresponding to statistically significant and non-significant trends, respectively.
Water 16 02924 g006
Figure 7. Trends in drought severity based on the analysis of the SSI-3 and SSI-6 time series for each of the study sites during the 1985–2023 investigated period. Up- and down-pointing triangles correspond to positive and negative trends, with blue and brown symbols corresponding to statistically significant and non-significant trends, respectively.
Water 16 02924 g007
Figure 8. Drought duration annual mean based on the SSI-3 and SSI-6 time series analysis for each of the study site during 38-year study period (1985–2023).
Water 16 02924 g008
Figure 9. Drought severity annual mean based on the SSI-3 and -6 analysis across the study sites during the 1985–2023 period of analysis.
Water 16 02924 g009
Table 1. Summary of the river stations, including location of the station, coordinates, catchment area, and annual mean and maximum flow.
Station NameDistrict MunicipalityLatitudeLongitudeCatchment Area (km2)Mean Flow (m3/s)Maximum Flow (m3/s)
U2H005uMgungundlovu −29.57630.60325199.59357.8
U2H006uMgungundlovu −29.38230.2783392.64131.5
U2H013uMgungundlovu −29.51330.0942993.61151.0
U6H003uMgungundlovu −29.80430.5164171.07169.0
U7H007uMgungundlovu −29.86230.2441144.35151.0
V2H004uMgungundlovu −29.07230.24615417.21526.7
V2H007uMgungundlovu −29.23929.7881181.0438.4
A7H008Vhembe−22.22729.990202,98524.35698.67
A8H009Vhembe−22.63430.4021571.468.86
A8H010Vhembe−22.63430.3991091.2217.18
A9H003Vhembe−22.89830.524621.79159.29
A9H006Vhembe−23.03630.278161.3022.80
A9H012Vhembe−22.76930.88922685.34366.34
B9H001Vhembe−22.83931.2376481.4157.06
C2H061Lejweleputswa −27.39026.46480,23547.11784.93
C4H004Lejweleputswa −27.93526.12415,9356.82586.65
C4H008Lejweleputswa −28.28627.14336672.98208.16
C4H010Lejweleputswa −28.50926.778-1.66419.26
C5H015Lejweleputswa−28.80826.11264006.822586.65
C6H002Lejweleputswa −27.39926.61377735.99626.68
C9H021Lejweleputswa −27.65425.597108,58541.13744.04
Table 2. Seasonal trends in streamflow. Bold indicates statistically significant trends at 5% confidence level.
Station NameDistrict MunicipalityTrends [SON]Trends [DJF]Trends [MAM]Trends [JJA]
U2H005uMgungundlovu −0.185−0.236−0.247−0.171
U2H006uMgungundlovu 0.001−0.204−0.036−0.045
U2H013uMgungundlovu −0.104−0.104−0.0610.020
U6H003uMgungundlovu 0.001−0.115−0.0390.126
U7H007uMgungundlovu −0.072−0.144−0.101−0.066
V2H004uMgungundlovu −0.352−0.242−0.104−0.188
V2H007uMgungundlovu −0.1520.0720.0500.066
A7H008Vhembe0.0910.3900.4010.224
A8H009Vhembe0.1360.2150.0960.082
A8H010Vhembe0.1760.2600.2520.265
A9H003Vhembe0.0780.0470.0880.096
A9H006Vhembe−0.159−0.048−0.229−0.366
A9H012Vhembe0.121−0.023−0.0640.072
B9H001Vhembe−0.1820.0340.2610.063
C2H061Lejweleputswa −0.0230.1930.2980.541
C4H004Lejweleputswa −0.2310.0770.0450.115
C4H008Lejweleputswa 0.3250.2470.1490.314
C4H010Lejweleputswa 0.4410.2870.2980.355
C5H015Lejweleputswa−0.0740.2660.1740.004
C6H002Lejweleputswa −0.0360.1230.1090.438
C9H021Lejweleputswa 0.1740.2200.2500.333
Table 3. Estimated GEV parameters across the districts.
VhembeuMgungundlovuLejweleputswa
StationLocationScaleShapeStationLocationScaleShapeStationLocationShapeShape
A7H008348.9294.1−0.4U2H00524.219.80.9C2H061409.8263.7−0.7
A8H0091.21.00.7U2H00617.010.00.4C4H00483.597.90.4
A8H0100.60.91.3U2H01316.313.30.4C4H0080.10.22.7
A9H0035.34.60.6U6H0036.17.40.9C4H0108.549.05.8
A9H0060.30.72.6U7H0071.31.61.1C5H01581.080.40.9
A9H01247.746.30.3V2H00447.231.60.5C6H002242.0218.0−0.5
B9H0011.35.94.6V2H0077.73.90.2C2H06178.674.31.3
Disclaimer/Publisher’s Note: The statements, opinions and data contained in all publications are solely those of the individual author(s) and contributor(s) and not of MDPI and/or the editor(s). MDPI and/or the editor(s) disclaim responsibility for any injury to people or property resulting from any ideas, methods, instructions or products referred to in the content.