Article

Short-Term Effects of Abrupt Salinity Changes on Aquaculture Biofilter Performance and Microbial Communities

by
Eliza M. Costigan
1,
Deborah A. Bouchard
2,
Suzanne L. Ishaq
3 and
Jean D. MacRae
1,*
1
Department of Civil & Environmental Engineering, University of Maine, Orono, ME 04469, USA
2
Cooperative Extension and Aquaculture Research Institute, University of Maine, Orono, ME 04469, USA
3
School of Food and Agriculture, University of Maine, Orono, ME 04469, USA
*
Author to whom correspondence should be addressed.
Water 2024, 16(20), 2911; https://doi.org/10.3390/w16202911
Submission received: 27 August 2024 / Revised: 6 October 2024 / Accepted: 8 October 2024 / Published: 13 October 2024
(This article belongs to the Section Wastewater Treatment and Reuse)

Abstract

:
In recirculating aquaculture systems (RASs), ammonia excreted by fish must be converted to the less toxic nitrate before recirculation. Nitrifying microorganisms in biofilters used for this transformation can be sensitive to changes in salinity, which can present issues for systems that raise anadromous fish such as Atlantic salmon. Freshwater biofilters maintained at a low level of salinity (such as biofilters operated in coastal areas) may be better equipped to handle more drastic salinity shifts; therefore, experiments were performed on freshwater and low-salinity (3 ppt) biofilters to assess their ability to recover nitrification activity after an abrupt change in salinity (3, 20, and 33 ppt). Two-week tests showed full nitrification recovery in freshwater biofilters after a shift to 3 ppt but no ammonia oxidation in 20 or 33 ppt. Low-salinity-adapted filters (transitioned from 0 to 3 ppt) showed a small recovery (about 11%) after a shift to 20 ppt, and no activity when shifted to 33 ppt. Illumina sequencing revealed that, while nitrification was slowed or stopped with shifting salinities, the nitrifiers survived the salinity increases; conversely, the heterotrophic communities were more greatly affected and were reduced in proportion with increasing salinity. This work indicates that biofilters operated at low salinity may recover more quickly after large salinity changes, though this slight benefit may not outweigh the cost of low-level salinity maintenance. Further research into halotolerant heterotrophs in biofilms may increase the effectiveness of nitrifying biofilters under variable salinities.

Graphical Abstract

1. Introduction

Recirculating aquaculture systems (RASs) have become an increasingly popular source of high-quality protein production, with strong potential to supplement traditional, water-intensive aquaculture methods. In RASs, optimal conditions allow for low water exchange, targeted at around 300 L per kg feed [1]. Thus, to maintain the water quality required for healthy animal growth, the recirculated water must be treated to remove or transform fish waste products. When fish consume proteins in food, some of the nitrogen is excreted through the gills in the form of ammonium [2]. Most aquatic animal species cannot tolerate more than 1.0 mg L−1 of total ammonia nitrogen (TAN) in water; ideally, the concentration for long-term exposure should be kept under 0.05 mg L−1 [3]. It is imperative that the ammonia-nitrogen be converted to its less toxic form, nitrate, before the RAS water is recirculated or discharged. This conversion, nitrification, is a two-step process where ammonium (NH4+) is converted to nitrite (NO2), and then to nitrate (NO3) [4], in an aerobic environment. The microorganisms that perform these conversions in biofilters grow in biofilms on plastic beads or other filter media. These microorganisms, also called nitrifiers, are sensitive to changes in their environment, such as changes in pH, temperature, and salinity. Changes in salinity of RASs can be convenient when raising anadromous species such as Atlantic salmon, as this eliminates the need for multiple biofilters operated at different salinities. This could be particularly beneficial for smaller-scale RASs, though shifting salinities abruptly has proven to be a hindrance to biofilter performance [5].
Several studies have been performed to assess nitrifying biofilters’ resistance to changes in their environments, highlighted in depth by one study in 2022 [6]. It has been shown that biofilms may be more resilient to changes in salinity if they have previously been prepared for shifts in salinity and osmolarity; however, osmotic stress preparation and recovery of freshwater biofilters may take weeks or months [7], bringing added expense. Another method that has been investigated is the potential to run freshwater systems at a moderate level of salinity to prepare the systems for variable salinities [8]. Many types of fish, including salmon, eels, bass, and flounder, are able to tolerate a large range of salinity over their lifetimes [9]. If the fish raised in a particular RAS can withstand some salinity, maintenance at this concentration may assist the biofilters in their transition to higher salinity levels later. The study performed in 2020 [7] showed that both biofilters started up in brackish water (12 parts per thousand, or ppt) and fresh water performed complete nitrification within 60 days; however, nitrate levels only increased in the reactors around day 40. Because operation at any salinity level comes with a higher cost than operation with freshwater [10], potential benefits of moderate salinity start-up should be observed in the short-term.
Rates of salinity change were investigated in a study performed in 2019 [11], and it was observed that lower rates of salinity increase had no advantage over higher rates; therefore, they recommended that salinity be shifted over the course of a few days. This study also showed an immediate drop in ammonia oxidation with any salinity change. Based on the results of these studies, we theorized that maintaining biofilters at a low level of salinity (low enough that freshwater species may still grow unhindered) may help to decrease the initial drop in ammonia oxidation and help the biofilters to recover more quickly. This method could also be beneficial in smaller-scale RASs where gradual salinity shifts may be more difficult. Furthermore, this investigation may be helpful for coastal RASs whose “freshwater” may already have a small level of salinity due to saltwater intrusion into adjacent groundwater. Another study [5] showed that a shift to 5 ppt salinity had very little influence on nitrification performance of freshwater biofilters. Therefore, this study investigates whether biofilters continuously operated at a low level of salinity of 3 ppt (rather than a moderate one of 12 ppt used in a previous study [7]) are better equipped in the short-term to handle abrupt changes in salinity than fully freshwater biofilters.
The reactions of the biofilters to the shifts in salinity were assessed through nitrification performance and microbial community composition. The main categories of ammonia-transforming microbes found in RAS biofilter media are ammonia oxidizing archaea (AOA), ammonia oxidizing bacteria (AOB), nitrite oxidizing bacteria (NOB), complete ammonia oxidizers (comammox), and anaerobic ammonia oxidizers (anammox) [4,12]. The first two categories, AOA and AOB, perform the first step in the nitrification process (NH4+ → NO2), while the second step is performed by NOB (NO2 → NO3). Comammox bypass the two-step process and convert ammonia to nitrate, while anammox convert ammonia to nitrogen gas in the presence of nitrite [12].
Several genera of AOB are commonly found in general domestic wastewater treatment and aquaculture wastewater treatment, including Nitrosomonas, Nitrosospira, and Nitrosococcus [13]. Nitrosomonas are often found in traditional wastewater treatment, while Nitrosospira typically have higher abundance in soils [14]. Nitrosococcus can be found in wastewater treatment, but it appears to be better suited for saltwater than freshwater [15]. Up until the 2000s, Nitrobacter were thought to be the most abundant NOB in most wastewater treatment systems; however, more recent studies have indicated that NOB Nitrospira may be more abundant [16]. Nitrococcus can be found in saltwater [17], while Nitrospina has been found in both domestic wastewater and saltwater [18,19]. Community compositions of biofilters differ with salinity [3,7,8,12,20,21]. Analysis of the changes in community after a transfer to a low level of salinity can provide insight into which types of microbes may be better suited for low salinity operation.
This study analyzes (i) the effect of shifting freshwater biofilters to both low and high levels of salinity, (ii) the effect of shifting slightly saline biofilters to high levels of salinity, and (iii) the influence of these salinity shifts on the short-term microbial community changes in the biofilters. Studies often analyze microbial community results after a stable population has been reached; however, analyzing the community in the short-term can provide valuable insight into the immediate impacts of abrupt environmental change. Identifying the most-affected microbes within the first several weeks after salinity shifts can identify potential future long-term work on salinity shifts performed on biofilters with more specialized community compositions.

2. Materials and Methods

2.1. Experimental Setup

To assess biofilter nitrification in a controlled environment, experiments were designed as static, completely mixed reactors containing 6 L of water and 2 L of biological media. The media (Sweetwater SWX Bio Media, Pentair, Minneapolis, MN, USA, surface area of 0.899 m2 L−1) was taken from a freshwater nitrifying biofilter treating RAS water from tanks containing freshwater salmon parr, and the media had been in use for approximately 6 months. In the first round of experiments, four different salinities were tested: 0 ppt (freshwater), 3 ppt, 20 ppt, and 33 ppt (full strength seawater). The 3 ppt salinity was chosen as the arbitrary low level of salinity, while the 20 ppt was chosen as the middle-ground salinity between 3 ppt and full-strength seawater. Furthermore, while lower salinity is ideal for the initial stages of salmon rearing, post-smolt salmon have been shown to grow well in lower salinities such as 12 and 22 ppt [22]. Dilutions with fresh well water and full-strength artificial seawater (well water with Instant Ocean® Sea Salt, Spectrum Brands, Blacksburg, VA, USA) were performed to reach the appropriate salinities. Each salinity was tested in triplicate experiments, so four sets of three buckets with 6 L of water at their respective salinities and 2 L of biological media were transferred directly from the freshwater RAS biofilter. Each newly transferred biofilter was aerated using air stones connected to an air pump or central air from the lab to maintain approximately 9 mg L−1 of dissolved oxygen in each bucket. The buckets were opaque and lids were placed over each one to ensure minimal photolytic interference.

2.2. Biofilter Feeding

Each biofilter was spiked daily with ammonium chloride (NH4Cl) to achieve a daily initial NH4+-N concentration of 10 mg L−1; more specifically, the consumed ammonium was replaced each day to make up the concentration to 10 mg L−1, preventing daily ammonia accumulation. The value of 10 mg L−1 TAN was chosen based on the results of a study [5] that spiked 5 mg L−1 TAN with a slightly lower ratio of water to media and saw complete ammonium removal after 5 h. Furthermore, a preliminary set of experiments performed prior to those described here showed continuous daily consumption of 10 mg L−1 after 24 h.
For every gram of ammonia-nitrogen that is converted to nitrate-nitrogen, 7.05 g of alkalinity as CaCO3 is required [23]. This ratio was used to calculate the amount of alkalinity needed for each biofilter to account for the daily amount of oxidized ammonia; thus, each filter was also fed with 5.92 g of baking soda (NaHCO3) per g of N oxidized to supply the microbes with a carbon source and to buffer the pH. The daily feedings and chemical testing were performed by removing 10% of the water (0.6 L) from each biofilter. The removed water was tested for pH, ammonium, and nitrate concentrations (as described below), and an equivalent volume of well water (brought to the test salinity with Instant Ocean) was added to the biofilters with the required dry masses of NH4Cl and NaHCO3 to bring the NH4+-N concentration to 10 mg L−1 and supply sufficient buffering capacity. The water temperature was maintained at 16 ± 1 °C throughout the test periods.

2.3. Salinity Adjustment

The second round of experiments was performed by adjusting 18 L of media from the freshwater RAS biofilter to 3 ppt salinity and allowing the media to fully recover and reach steady state over a period of 30 days. At the end of the adjustment period, the newly acclimated 3 ppt biofilters had reached complete nitrification of 10 mg N L−1 d−1. The same ratio of water to media was used for the low-salinity biofilters as the freshwater biofilters (6:2). The biofilters were maintained and operated with the same conditions as the freshwater biofilters (as listed above). All experiments were run for 14 days, as this has been reported as an adequate time to show microbial community development in biofilters [7]. However, even if functional stability (complete nitrification) is observed, it is very unlikely that a stable microbial population is reached after this time; it can take up to a year to achieve true stability in wastewater treatment populations [24,25].

2.4. Chemical Analysis

The pH in each biofilter was monitored with a YSI probe, while NH4+-N and NO3-N concentrations were tested using Vernier Ion-Selective Electrodes (Beaverton, OR, USA). Conductivity and DO were also measured with YSI probes. The ammonium probe was calibrated with standards of 1 and 10 mg NH4+-N L−1, while the nitrate probe was calibrated with standards of 10 and 100 mg NO3-N L−1. The ammonia oxidation rate (equivalent to the ammonium removal rate) and the nitrate production rate were calculated using a mass balance of the ammonium-nitrogen and the nitrate-nitrogen in each biofilter. The theoretical maximum oxidation rate of ammonia-nitrogen and production of nitrate-nitrogen was 10 mg N L−1 d−1, calculated based on the 1:1 molar ratio of ammonia-N oxidation and nitrate-N production during nitrification. With the total amount of available surface area in each filter (1.8 m2), this value equates to 0.333 g m−2 d−1, comparable to loading rates used in other studies [11].

2.5. DNA Extraction and Sequencing

One sample of biofilm was taken from each biofilter at the start and finish of each experiment. Approximately 0.05 g of (wet) biofilm was scraped off the plastic media from each filter with a sterile spatula and DNA was extracted using a Qiagen® DNeasy PowerSoil Kit® (Germantown, MD, USA) according to the manufacturer’s instructions. The DNA concentrations of the samples were all 5–8 ng/μL; therefore, ethanol precipitation was performed to increase the concentration of each sample two- or four-fold (depending on the original concentration) to >10 ng/μL. This was performed by adding one-tenth volume of 3 M sodium acetate (pH of 5.3) to the samples, then adding 2.4 volumes of 100% ethanol and mixing. Samples were placed in a −20 °C freezer overnight, then centrifuged and washed twice with 70% ethanol. The pellet was dissolved in TE buffer to make up each sample to >10 ng/μL. PCR amplification, library preparation, and sequence determination were performed by Novogene Corporation (Beijing, China) using universal bacterial primers 515F (GTGYCAGCMGCCGCGGTAA) and 806R (GGACTACNVGGGTWTCTAAT). Paired-end Illumina NovaSeq 2 × 250 reads were performed on the variable V4 region of the 16s rRNA gene. The forward and reverse reads were trimmed to 230 bp to avoid deterioration in quality at the beginnings and ends of the reads. FASTQ files were uploaded to R, and the package Divisive Amplicon Denoising Algorithm (DADA2) [26] was used for dereplication, inference, merging, and chimera removal. The sequence variants were then assigned taxonomy based on a Silva training set (NR 99, Version 138), and sequences identified as chloroplasts and mitochondria were removed before further analysis. Sequence reads were placed in the National Center for Biotechnology Information (NCBI) with accession number PRJNA926625.

2.6. Sequence Data Analysis

The alpha diversities of the samples were quantified with observed sequence variants (SVs) as well as Shannon’s Diversity Index. A canonical coordinate analysis (CCA) was performed to identify shifts in the population between samples. The R package DESeq2 (differential expression analysis) [27] was used to determine the taxa in higher abundance in the freshwater biofilters versus the low-salinity biofilters. Feature prediction using the R package dplyr [28] was used to find genera that were statistically different between sets of samples. Feature prediction was also used to indicate taxa that were more likely to be in individual samples. A significance level of 0.05 was used for all tests except for the DESeq analyses, which used a significance level of 0.01.

3. Results and Discussion

3.1. Nitrification in the Freshwater-Adapted Filters

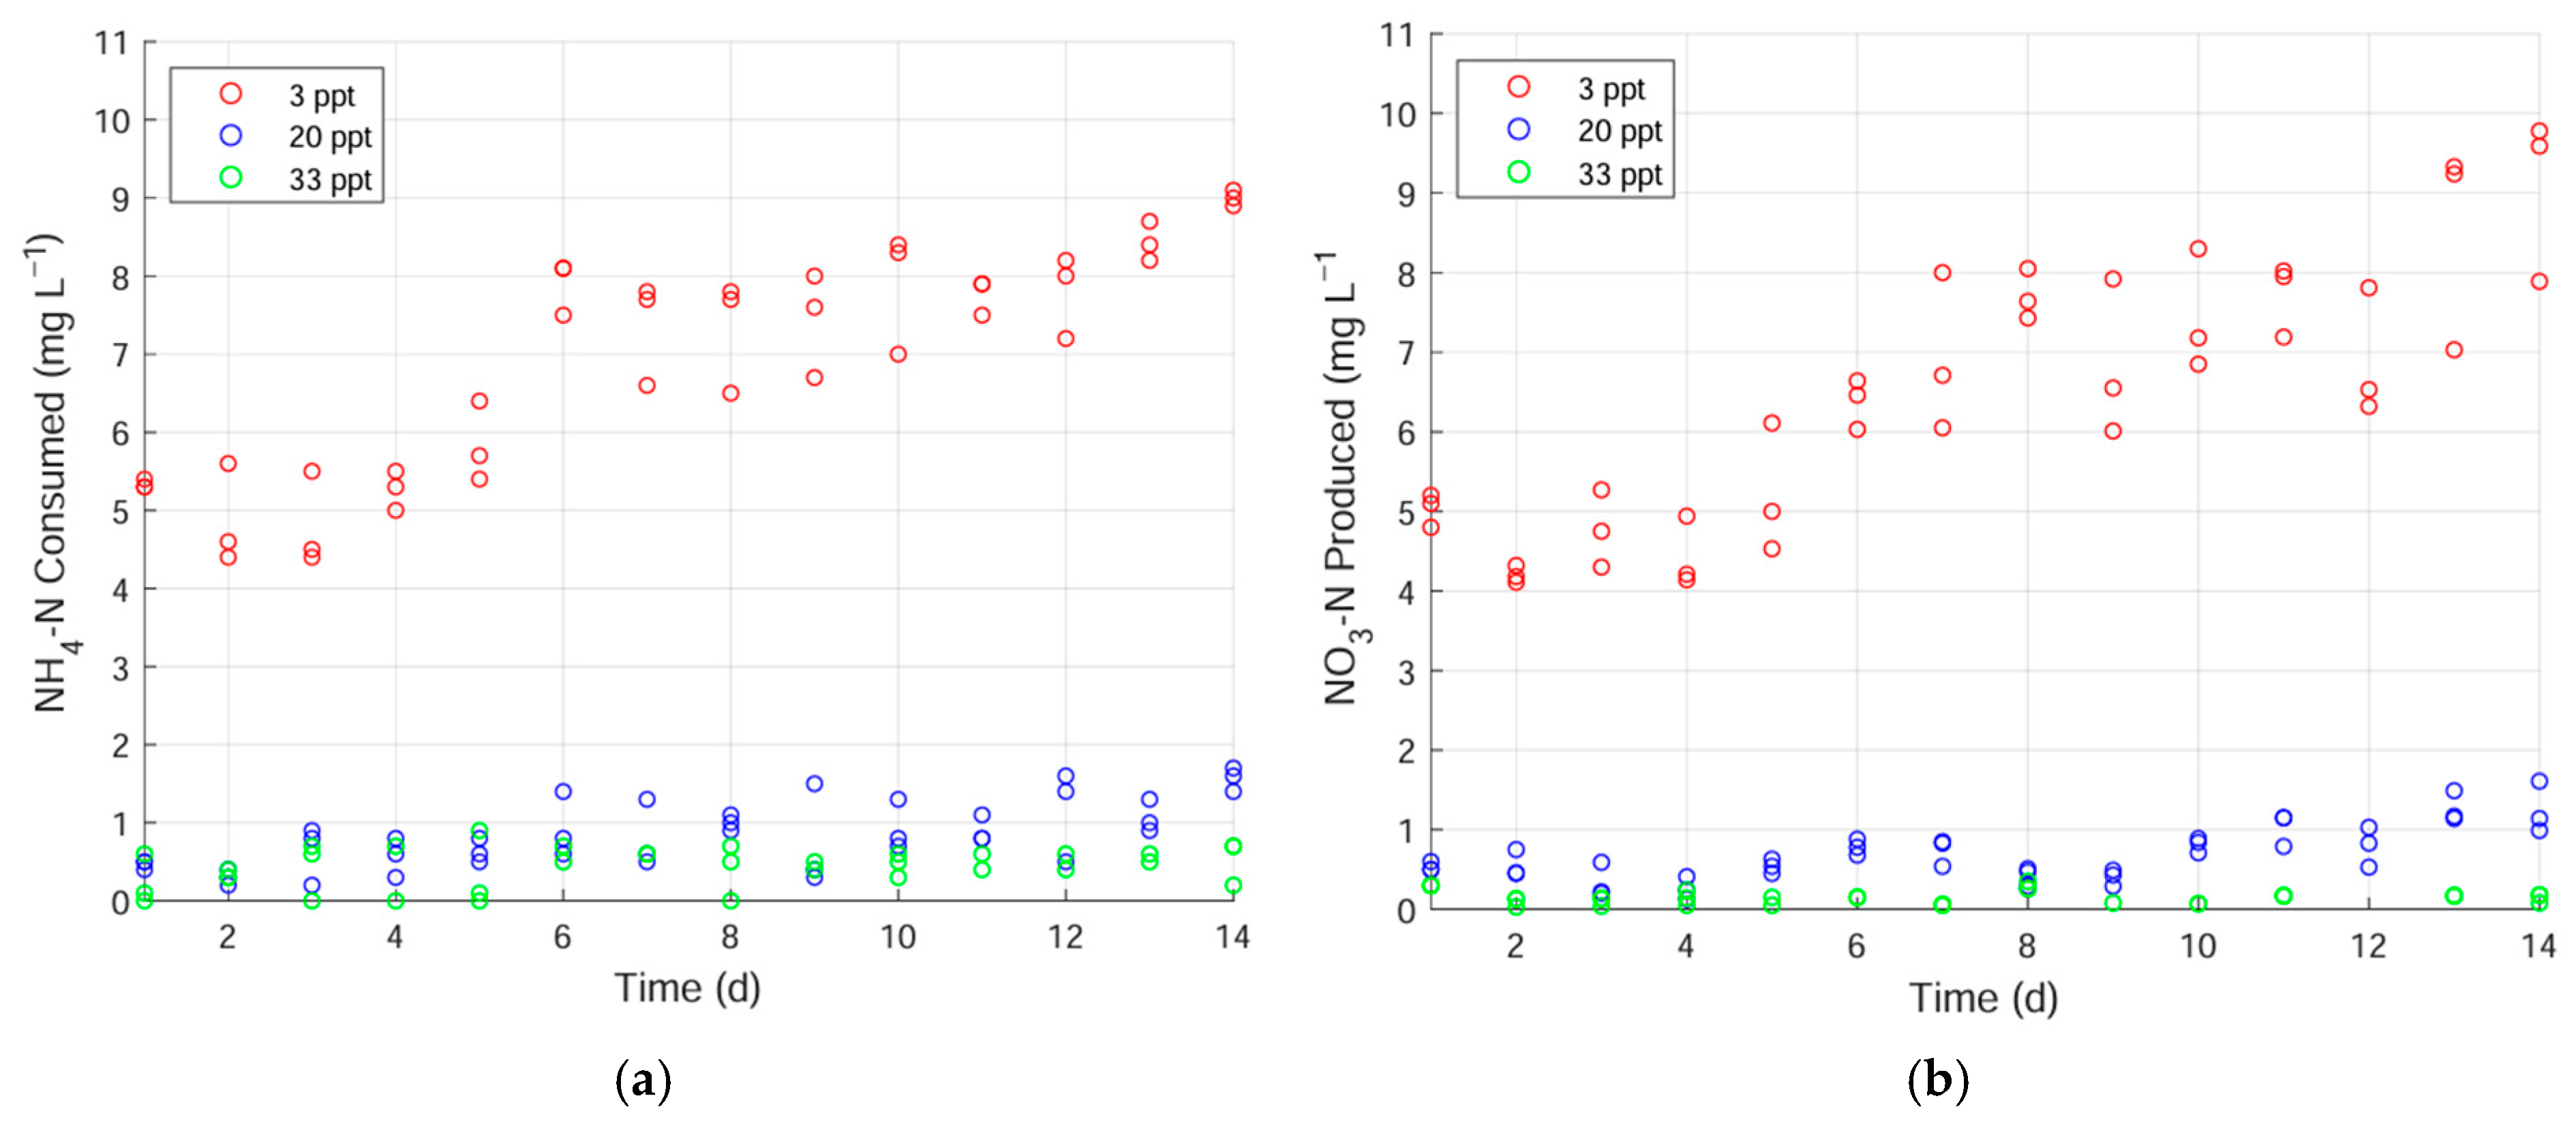
The results of the nitrification rate recovery tests on the freshwater media are presented in Figure 1. The pH of all biofilters stayed between 8.1 and 8.2 throughout the duration of the tests. Figure 1a shows the results of the daily ammonia-nitrogen oxidation, while Figure 1b shows the results of the daily nitrate production. The biofilters that were maintained at 0 ppt served as the control. In all tests, the ammonia oxidation and nitrate production rates were similar and showed almost identical reactions to the shifts in salinity, though the ammonia oxidation rates recovered slightly faster than the nitrate production rates. This indicates that there may have been a small accumulation of nitrite (which was not monitored). Thus, a mass balance calculation was used to find nitrite accumulation in each biofilter, and the average of each triplicate at the end of each test was as follows: 0 ppt: 9.1 mg N L−1, 3 ppt: 3.3 mg N L−1, 20 ppt: 4.9 mg N L−1, and 33 ppt: 2.2 mg N L−1. Accumulation of nitrite has been reported to be caused by large shifts in TAN concentration [29]. Nitrite is toxic to most invertebrates, and has been shown to affect anammox bacteria at higher concentrations (25 mg L−1 in the absence of ammonium, [30]), but concentrations at the levels obtained in this work should not have adversely affected the biofilter communities.
Initially, around 4 mg NH4+-N L−1 d−1 (0.133 g N m−2 d−1) was oxidized in the freshwater biofilters, reaching the maximum rate of 10 mg N L−1 d−1 (equal to the total amount of ammonium added) after about 12 days. This lag time before complete ammonia oxidation is most likely due to the effects of a shift in environment as well as the 10 mg N L−1 ammonium concentration used in the experiment. The source biofilter before the start of this test was exposed to approximately 0.5 mg NH4+-N L−1. The ammonia oxidation in the control biofilters recovered slightly more quickly to the shift in environment than the nitrite oxidation, as the ammonia oxidation reached approximately 9 mg N L−1 d−1 (0.300 g N m−2 d−1) at day 8 while the nitrate production was approximately 6 mg N L−1 d−1 (0.200 g N m−2 d−1) at this time point. The freshwater control biofilters reached ambient nitrate concentrations of around 58 mg N L−1 by day 14; this is a reasonable ambient nitrate concentration for safe biofilter operation [31,32].
Nitrification in the biofilters was initially depressed by the transfer to 3 ppt. After a lag time of about 4 days, the ammonia oxidation rate per day began to increase over time in the control filters. Consistent recovery in ammonia oxidation was not observed until approximately 9 days. At the start of the test, nitrification in the biofilters transitioned to 3 ppt were depressed relative to the control. Nitrification began to increase after about 9 days; and by the end of the test, these filters were nitrifying approximately 65% of the ammonia per day as the amount nitrified by the freshwater biofilters. Again, the ammonia oxidation recovered slightly faster than the nitrate production. The biofilters that were transitioned to 20 and 33 ppt did not recover at all from the abrupt change in salinity, performing negligible nitrification each day. This immediate inhibition is similar to results presented in a study [5] that found that abrupt transitions to 25 ppt and above resulted in complete inhibition of freshwater biofilters in the short term (inhibition was observed immediately and did not recover within 5 h).

3.2. Nitrification in the Low-Salt-Adapted Biofilters

The results of the tests using biofilter media adapted to low salt concentrations are presented in Figure 2. The biofilters acclimated to and maintained at 3 ppt served as the control for this set of tests. During the acclimation period of 30 days, the biofilters were fed with the same ratio of water to ammonium and sodium bicarbonate to achieve an initial ammonium concentration of 10 mg N L−1 d−1, which was consumed entirely each day. Theoretically, the transfer from the maintenance phase to the control biofilters at the start of the second test should have shown 10 mg N L−1 of ammonia oxidized daily. However, at the start of the test, the control biofilters oxidized about 5 mg NH4+-N L−1 d−1. This was slightly higher than the controls of the freshwater test, which only oxidized about 4 mg NH4+-N L−1 d−1 at the start, and this difference was found to be significant (statistical t-test gave a p-value of 0.006). One possible explanation for this is that the 100% water exchange at the beginning of the second experiment shocked the nitrifiers into lower activity at the beginning of the test, as they had experienced only a 10% daily water exchange during the maintenance period. A similar result was observed in a study [29] that showed a drop in nitrification efficiency after water exchanges over 25%, though this was attributed mostly to changes in pH and temperature.
Similar to the results of the freshwater tests, the ammonia oxidation recovered more quickly than the nitrate production in the control biofilters, and the biofilters did not recover with a shift to 33 ppt. However, the biofilters transitioned to 20 ppt did show some recovery over the two-week test, consuming about 1 mg NH4+-N L−1 d−1 (0.033 g N m−2 d−1). At the end of the test, the 20 ppt biofilters fully oxidized about 11% of the amount of ammonium consumed by the control biofilters. A similar mass balance was performed to calculate nitrite accumulation (3 ppt: 5.3 mg N L−1, 20 ppt: 1.8 mg N L−1, and 33 ppt: 2.8 mg N L−1). These results indicate that the biofilters operated at 3 ppt may be more resilient to an abrupt increase in salinity than freshwater biofilters.

3.3. Microbial Community Sequencing Results

There were 4589 unique sequence variants (SVs) in the sample set, with 82 shared taxa making up the core microbial community. The most abundant phylum in all samples, at about 43% of the total, were classified as Proteobacteria, followed by Bacteroidota, at about 16%, and Planctomycetota, at around 10%. These relative percentages are similar to the proportions found in other studies [12,33]. The rest of the most abundant phyla were made up of Acidobacteriota, Actinobacteriota, Chloroflexi, Bacillota (formerly Firmicutes), Gemmatimonadota, Nitrospirota, and Verrucomicrobiota. Nitrifying genera made up about 27% of the total reads. In several of the following figures, the samples have been designated shorthand names. FA1-3 corresponds to the initial freshwater samples, while FB1-3, FB4-6, FB7-9, and FB10-12 correspond to the final samples at 0 ppt, 3 ppt, 20 ppt, and 33 ppt, respectively. SA1-3 corresponds to the initial low-salinity samples, while SB1-3, SB4-6, and SB7-9 correspond to the final samples at 3 ppt, 20 ppt, and 33 ppt, respectively.

3.3.1. Bacterial Diversity

Table 1a,b present the bacterial diversity using both Shannon’s Index and evenness. Initially, there were 699–798 SVs in the freshwater biofilters. After the two-week-long test, the number of observed SVs in the control spanned from 571 to1005. In the 3 ppt biofilters, this number spanned from 540 to 887 at the end of the test. At the beginning of the low-salinity tests, the number of SVs ranged from 583 to 1005. After the two-week test, the 3 ppt biofilters serving as the control had 497 to 899 SVs. The 20 ppt biofilters had a relatively similar number of SVs in both the freshwater and the low-salinity tests (485–600 and 456–511, respectively). The 33 ppt biofilters had a noticeably higher number of SVs in the freshwater tests, though this could be attributed to a broader-based inhibition of activity in those biofilters resulting in little change in the community profile.
Evenness corresponds to the similarity of the species within each sample. Both high microbial diversity and high evenness have been linked to higher population stability [34,35,36]. The freshwater biofilters had higher evenness than the low-salinity biofilters, potentially indicating a more stable population in the freshwater biofilters. The statistical significance of this difference was confirmed by ANOVA (p-value of 3.12 × 10⁻⁷).

3.3.2. Canonical Coordinate Analysis (CCA)

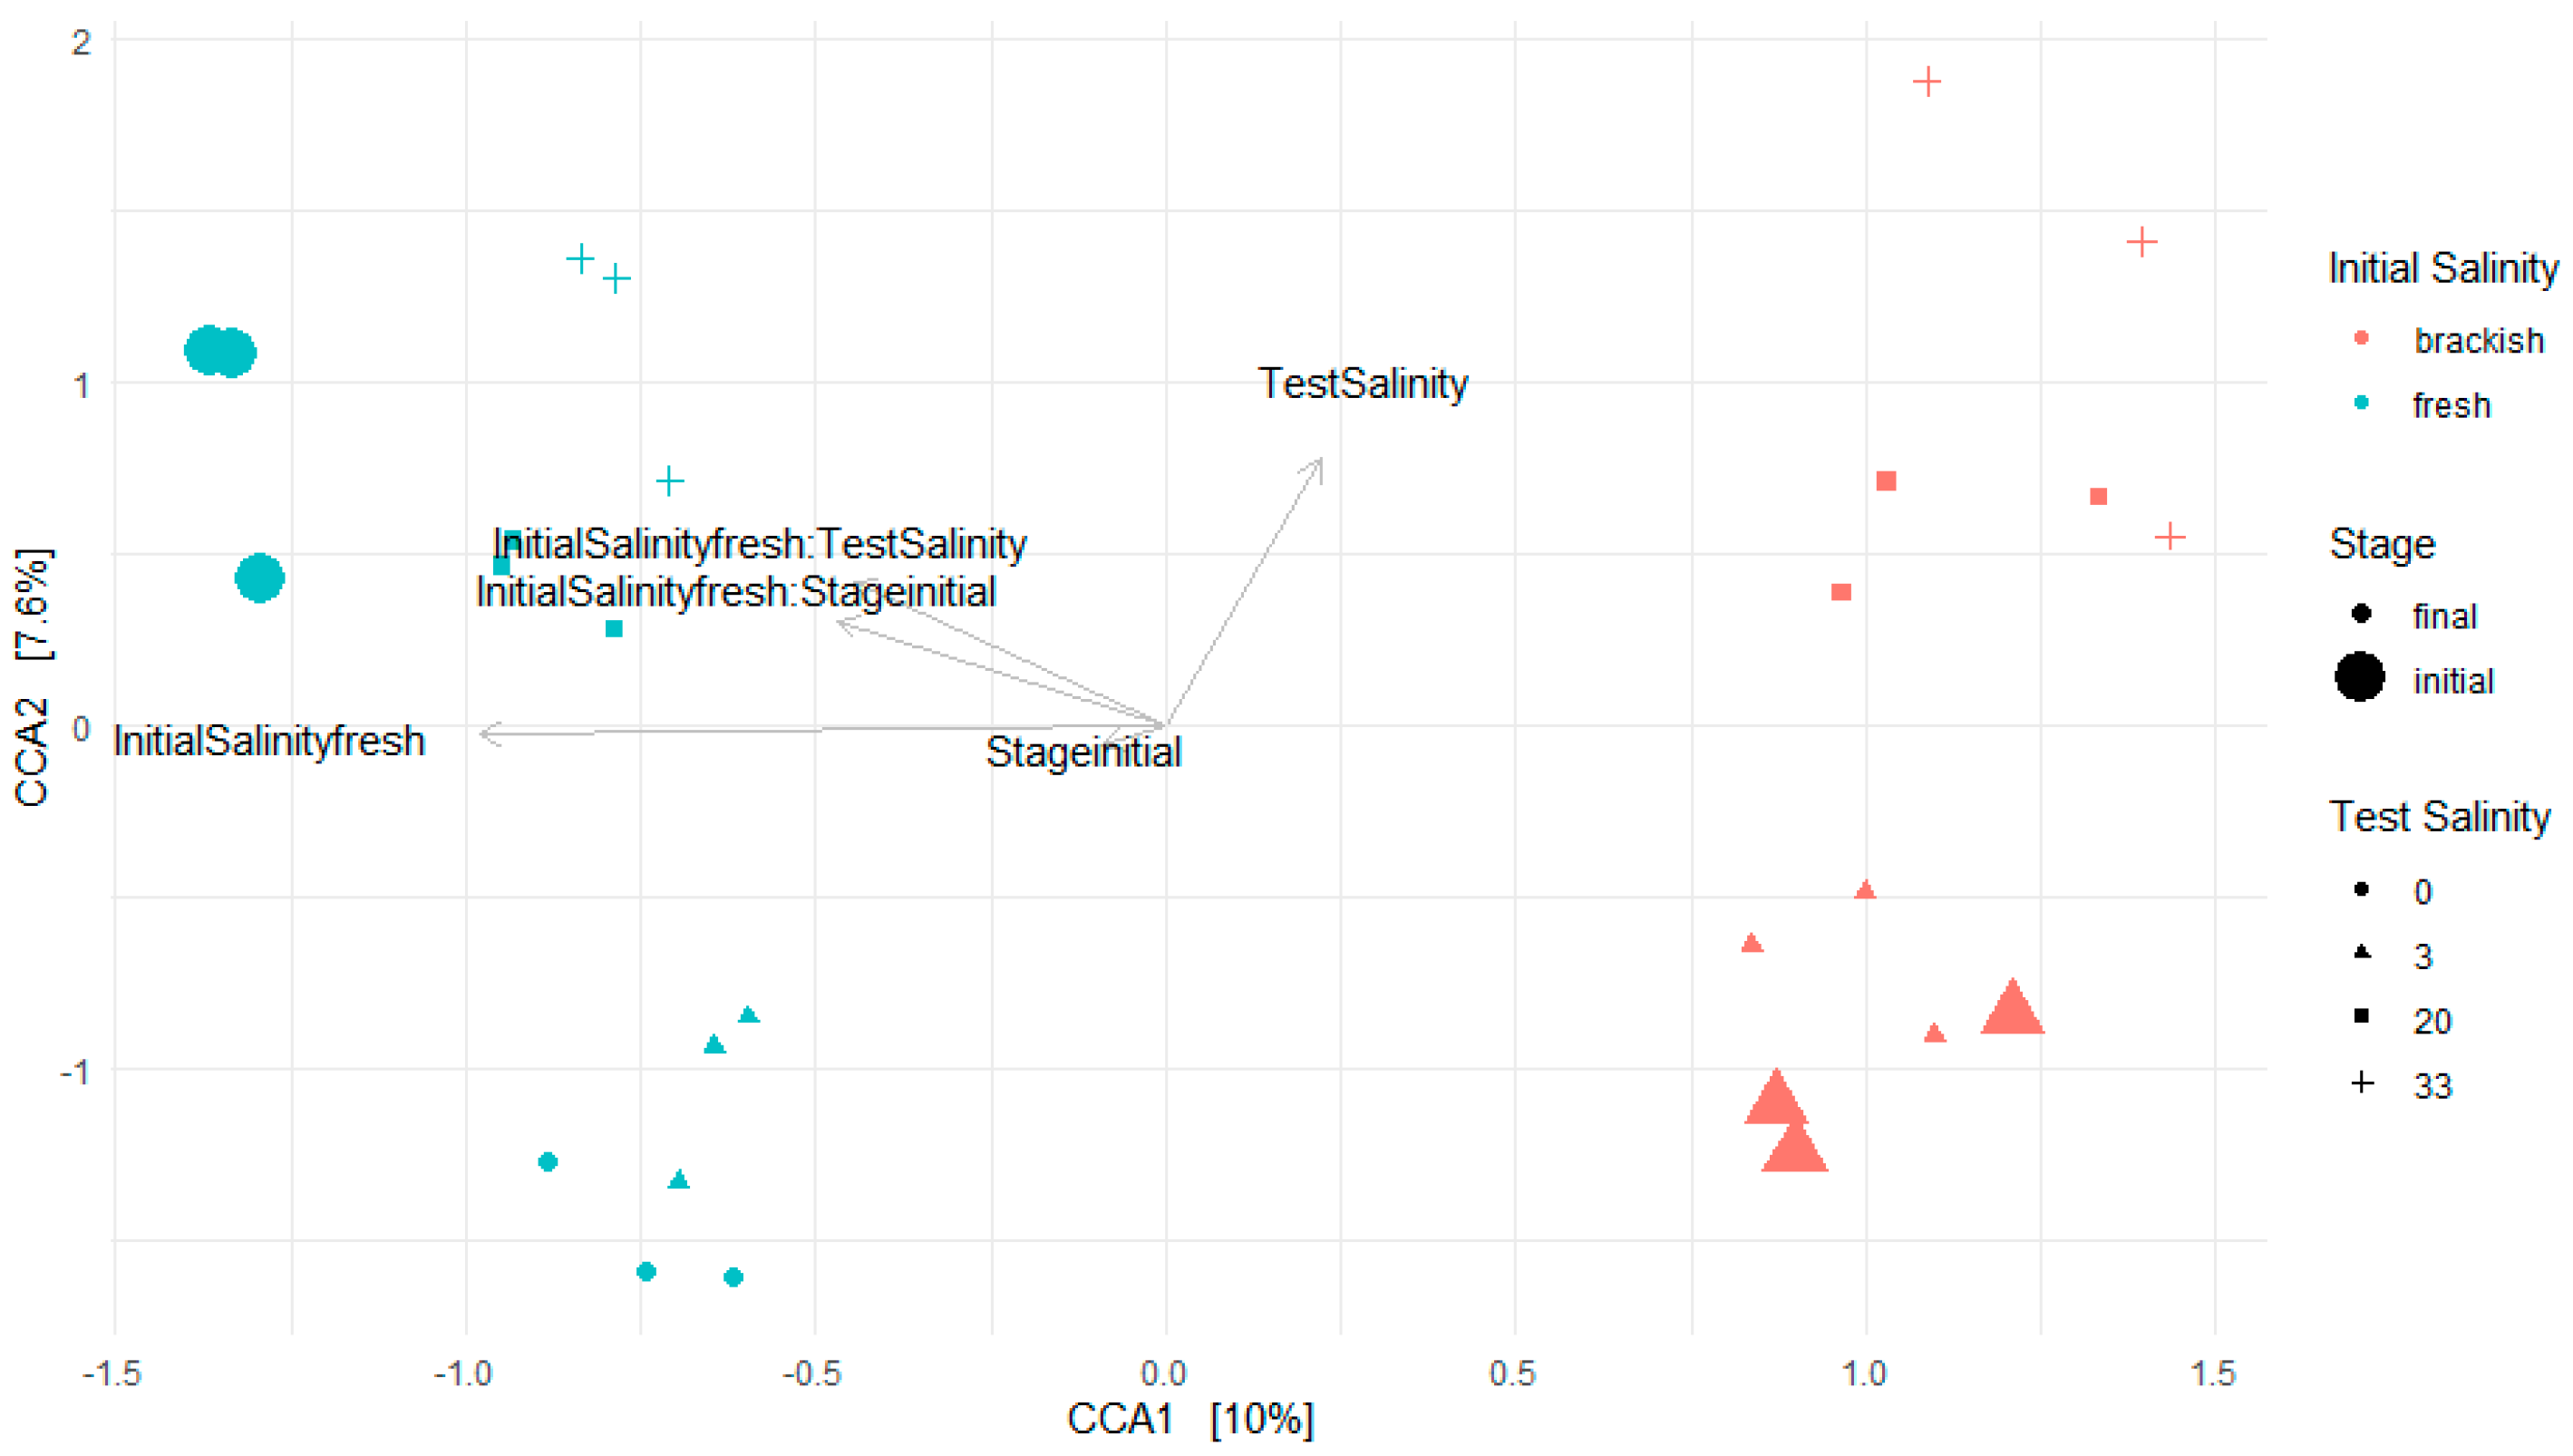
A canonical coordinate analysis (CCA) using Bray–Curtis dissimilarity was performed on the data to investigate the similarities between the samples, as shown in Figure 3. The model was formed using initial salinity, stage (initial or final sample), and test salinity as variables. An ANOVA test was performed on the model as a whole, and the results showed that the model is significant; however, an additional ANOVA test on the variables showed that only initial salinity and test salinity are significant drivers of community differences. Evidently, there is a stark divide between the freshwater biofilters and the low-salinity biofilters. Furthermore, there is a clear gradient upwards as salinity increases for both types of biofilters. The only divergent clustering is the initial freshwater samples that are clustered near the 20 and 33 ppt filter clusters. The change in freshwater samples from the start to the end of the experiment is likely due to a combination of the increased ammonium concentrations used in the tests relative to the concentration experienced by the biofilters before the start, the lack of organic matter and other fish waste constituents included in the water fed to the biofilters during the experiment, and operation as a fed batch system rather than flow-through.

3.3.3. Influence of Test Conditions and 30-Day Acclimation Period

Pairwise comparisons using the R package DESeq were used to investigate the genera that changed most in the biofilters. The DESeq analyses show the significance of the different taxa based on one factor such as initial salinity or stage (initial or final sampling) with the significance levels indicated by the distance away from the center line. The sizes of the points indicate the relative abundance of the significant taxa. The first pairwise comparison (Figure S2) was performed on the initial and final freshwater samples maintained at 0 ppt to investigate the taxa that were present at the start of the test that either did not survive the shift in test conditions or increased in abundance over the two-week test. A second DESeq analysis (Figure S3) was performed to identify the taxa that were significantly changed in the 3 ppt biofilters over the month-long period of acclimation to saltwater. The results of these analyses showed that the most significantly changed taxa were heterotrophic communities, most likely due to the fact that the microbes were deprived of organic carbon during the shift in test conditions. There were no significant changes in the nitrifying communities in either analysis (figures can be found in the Supplementary Materials). This indicates that heterotrophic microbes were more greatly affected by the experimental conditions than the nitrifiers. The rest of this study will focus on the difference in the nitrifying communities during the shifts to different salinities.

3.3.4. Nitrifying Bacteria Composition

The ammonia oxidizing and nitrite oxidizing sequences were analyzed separately from the rest of the dataset to assess changes in the nitrifying communities in the biofilters. As previously mentioned, the five types of nitrifying bacteria include AOB, AOA, NOB, anammox, and comammox bacteria. Several of the nitrifying bacteria could only be classified to the family level as Nitrosomonadaceae. The primary AOB classified to genus level were Nitrosomonas, while the primary NOB were Nitrospira. There were no AOA or anammox bacteria detected in the sequences. The genus Nitrospira has been shown to contain both NOB and comammox bacteria; however, phylogenetic analysis based on the V4 region of the 16S rRNA gene is not able to distinguish between the two [37]. Therefore, for the analysis below, the Nitrospira population will be referred to as NOB, though it should be noted that there could be some comammox Nitrospira.
For the AOB, there were 81 sequences classified to the Nitrosomonadaceae family, and 22 sequence variants were able to be classified to genus level as Nitrosomonas. The most prevalent AOB was a sequence variant (SV) of Nitrosomonas that was not classified to species level. The second most abundant, however, was classified as Nitrosomonas aestuarii, which has been found to be the dominant AOB in several marine biofilters [12,38]. None of the other AOB genera (at proportions higher than 0.5% of the total) were able to be classified to the species level. It has been theorized that Nitrosomonas are often absent or in low abundance in freshwater nitrifying biofilters [39]; however, other studies have found that AOB populations in freshwater biofilters are dominated by Nitrosomonas [12,21]. The other known AOB genera, Nitrosospira and Nitrosococcus, were not present in this study at proportions higher than 0.5% of the total reads. Therefore, ammonia oxidation can be attributed largely to Nitrosomonas sp. in both the freshwater and low-salinity biofilters. Some species of Nitrosomonas have been found to have generation times of 10–14 h [40].
The NOB had fewer unique SVs classified at the family level, at 29. The family Nitrospiraceae made up 22 of these sequences, all 22 of which were classified as Nitrospira. The most prevalent NOB throughout the biofilters was classified to the species level as Nitrospira defluvii. This species of Nitrospira was found to be the dominant NOB in freshwater and brackish biofilters in one study [12]. None of the other NOB genera were classified to the species level. Two other known NOB genera, Nitrobacter and Nitrotoga, were not present at proportions higher than 0.5% of the total reads, while Nitrococcus and Nitrospina were absent entirely from the sequences. Therefore, nitrite oxidation can be attributed largely to Nitrospira sp., with Nitrospira defluvii as the most common species. Nitrospira defluvii has been found to grow well in high-DO environments, similar to the levels maintained in these tests [16]. Some species of Nitrospira have been found to have generation times of 34–65 h [41], a slow rate compared to Nitrosomonas. This helps to explain the apparent quicker recovery of the AOB versus the NOB in Figure 1 and Figure 2. The long generation times of both AOB and NOB genera supports the theory that the nitrifiers likely did not reach a stable population by the end of the two-week tests.

3.3.5. Influence of Adaptation to Low-Salinity Conditions

Another DESeq analysis was performed to assess the differences between all the biofilters, compared by initial salinity (Figure S4). There were 72 taxa determined to have significant changes between the two experiments. Interestingly, the two major genera of nitrifiers, Nitrosomonas sp. (AOB) and Nitrospira sp. (NOB), were the most abundant species showing a significant change, and both increased in abundance in the low-salinity biofilters. Despite this change, the low-salinity filters showed slower nitrification recovery in the final 3 ppt and 20 ppt biofilters, and lack of recovery altogether in the 33 ppt biofilters in 14 days. Further investigation into the significantly different communities within each sample is shown in the following section.

3.3.6. Taxa Predictions for Freshwater versus Low-Salinity Biofilters

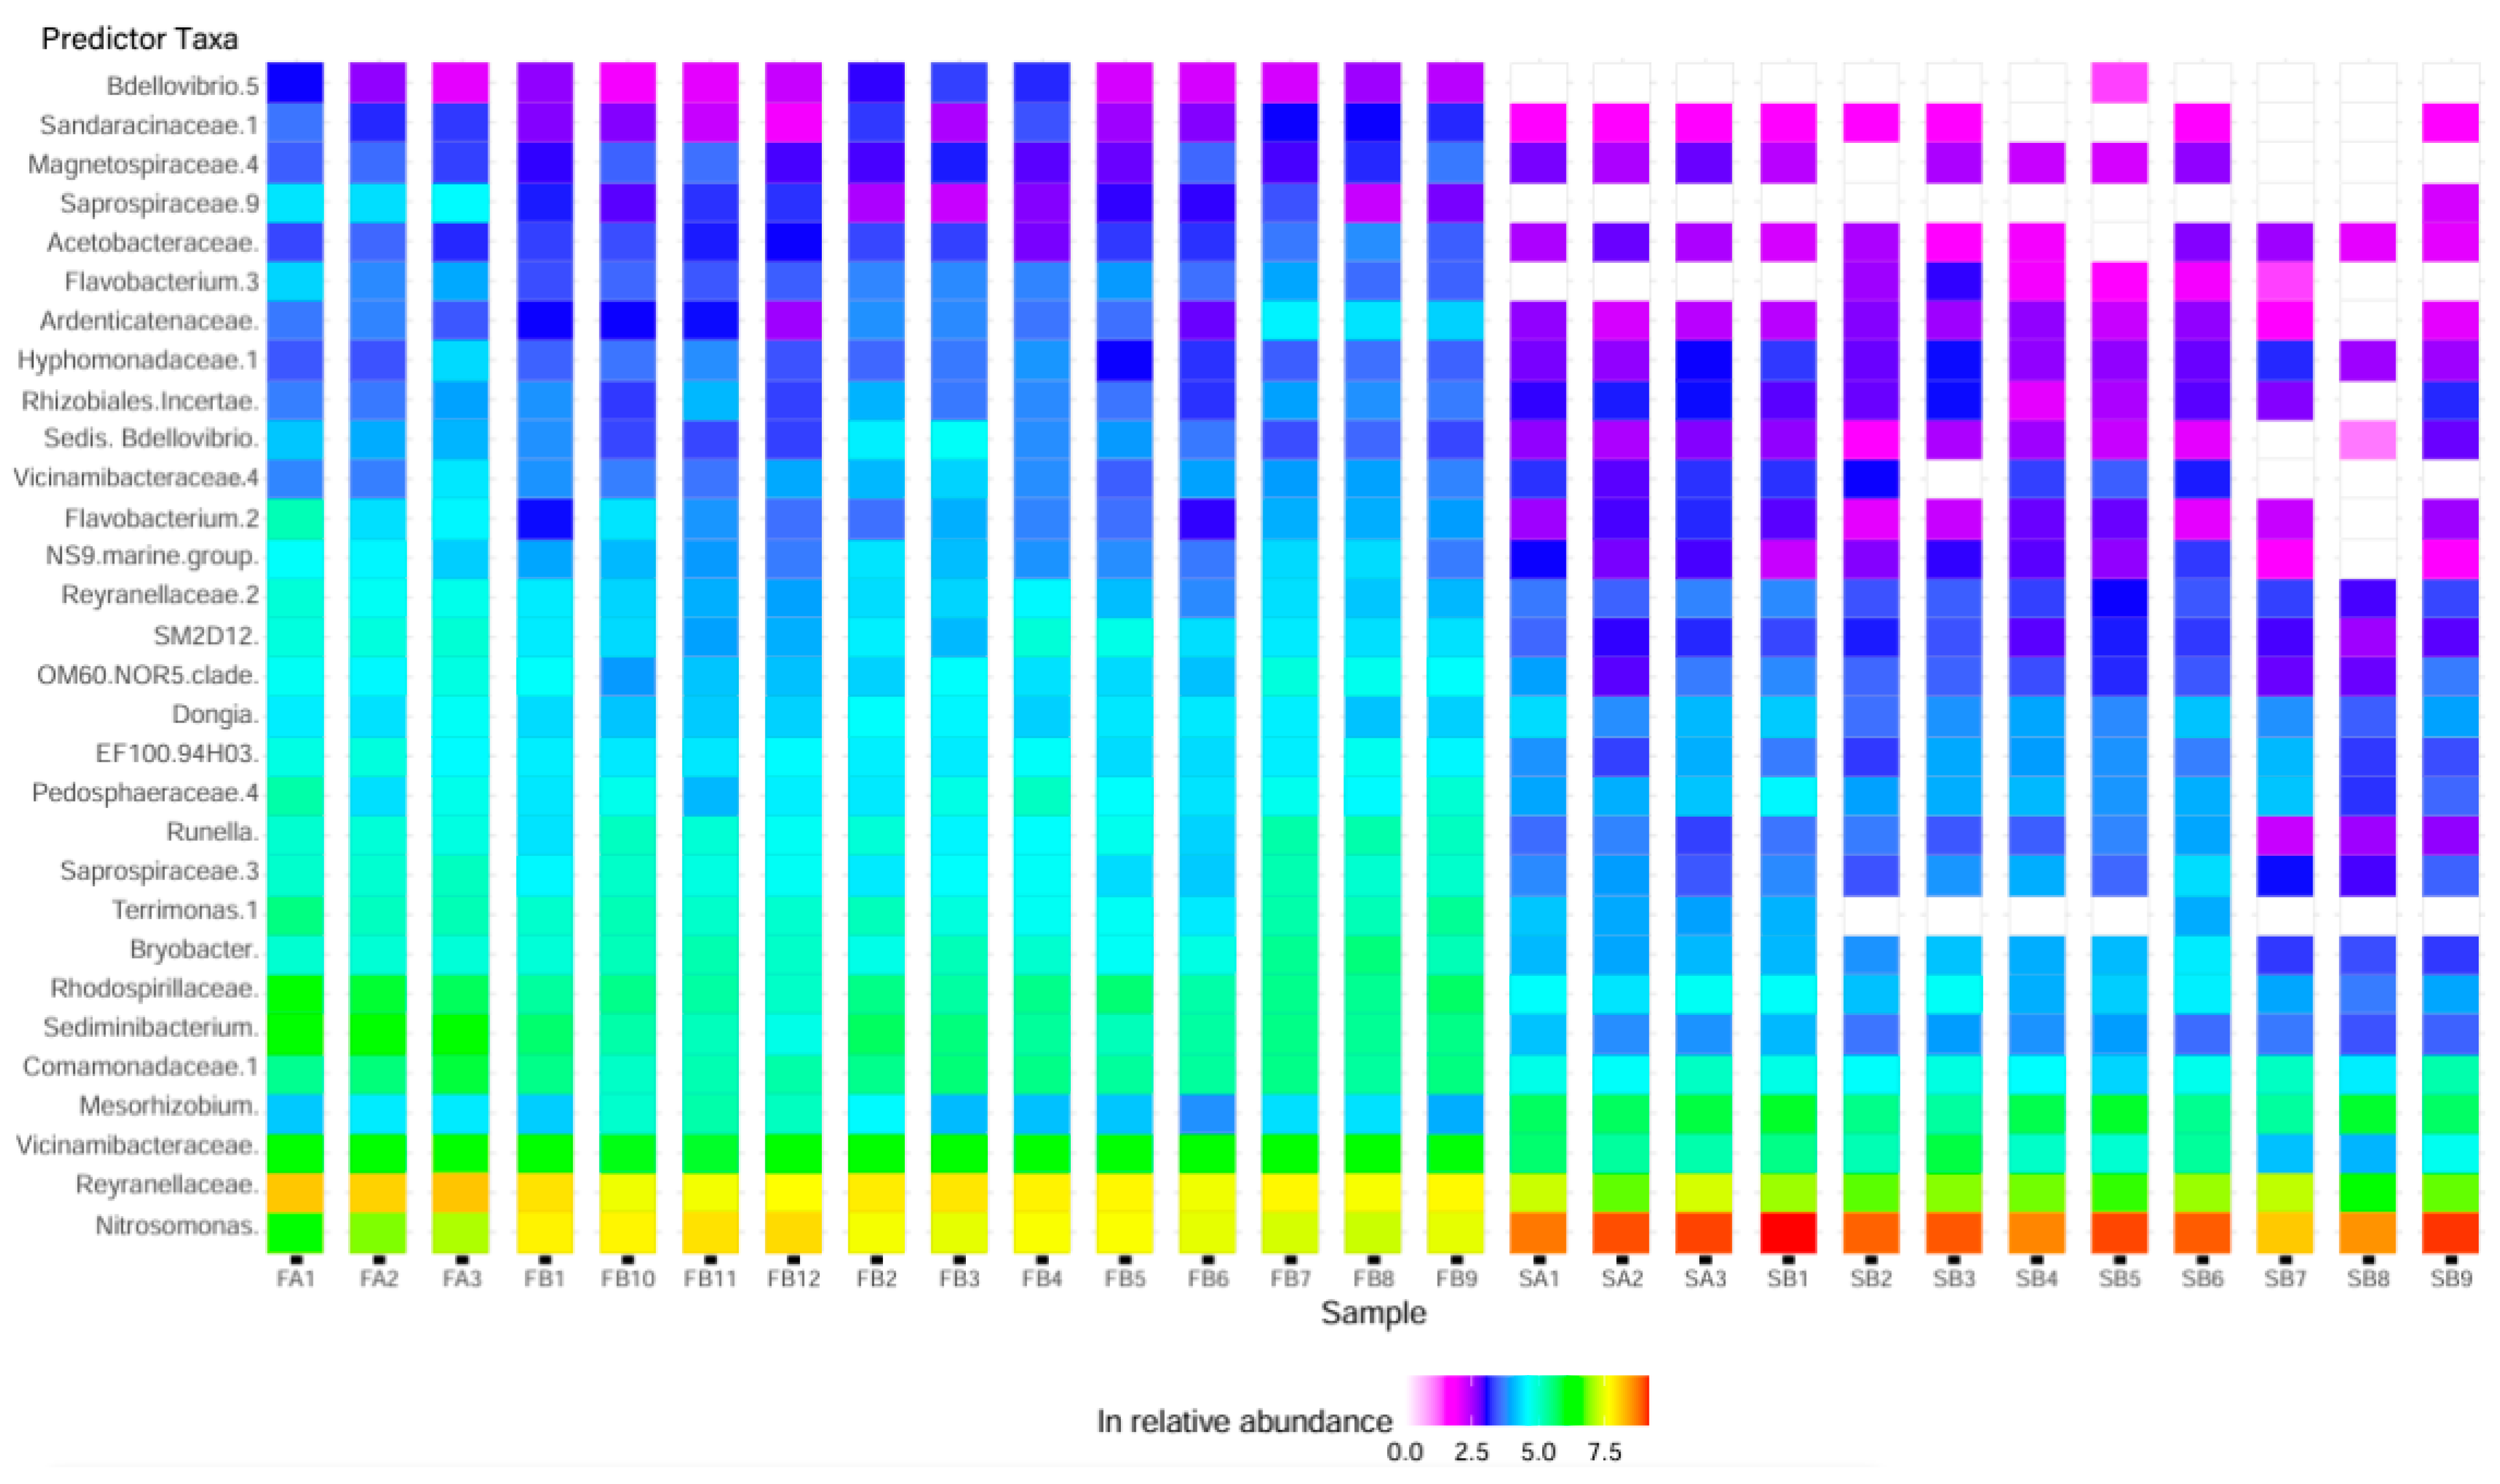
Feature prediction is similar to DESeq in that it can give insight into the more abundant taxa in certain biofilters; however, rather than showing the significance level and sequence abundance, tiles are colored for each taxon based on the likelihood that the particular taxa would be found in that sample, using a significance level of 0.01. Feature prediction revealed some stark contrasts between the freshwater biofilters and the low-salinity biofilters, though several of the bacteria could only be classified to the family level. Figure 4 shows the top 30 most significantly changed SVs, compared between samples. The most significant SV was Nitrosomonas sp., but interestingly, none of the other top 30 significant SVs belonged to nitrifying genera. This further indicates that the lower rate of nitrification in the low-salinity biofilters may be attributed to inhibition of the nitrifiers rather than population decline.
The top eight sequence variants displayed on the graph were detected mostly in the freshwater biofilters. In particular, Bdellovibrio sp. was detected in all freshwater biofilters but detected in only one of the low-salinity biofilters. Bdellovibrio sp. are predatory bacteria that prey on other Gram-negative bacteria [42]. The only bacteria that were significantly predicted to be of higher abundance in the low-salinity biofilters and able to be classified to genus level were Mesorhizobium sp. and Nitrosomonas sp. Mesorhizobium sp. have been classified as symbiotic bacteria that help to fix nitrogen in legumes, though they have also been found in freshwater RASs and are thought to improve water quality [43]. Interestingly, Nitrosomonas sp. was the only nitrifying SV classified to genus level significantly predicted to be in higher abundance in the low-salinity biofilters. This shows that, while both Nitrospira sp. and Nitrosomonas sp. were resistant to the salinity changes, the Nitrosomonas sp. may have been more resilient, and are more likely to be at higher abundance in low-salinity biofilters. Furthermore, the family of Pirellulaceae were shown to be in significantly higher abundance in the low-salinity biofilters. Pirellulaceae have been correlated with ammonia removal in wastewater treatment and in nature [44,45]; thus, it appears that nitrification-associated bacteria are in higher abundance in the low-salinity biofilters.

3.3.7. Changes in the Most Abundant Nitrifying SVs

Further investigation into the percentages of nitrifying communities is presented in Table 2, which shows the percentage of sequence reads in each sample that could be attributed to nitrifying genera. As a whole, the low-salinity biofilters had a higher percentage of nitrifying bacteria than the freshwater samples. Furthermore, within the low-salinity samples, the percentage of all six nitrifying genera was the highest in the 33 ppt biofilters, which could indicate that the heterotrophs were more likely to die off. The AOB and the NOB showed similar trends in proportion between samples.
An interesting difference between the freshwater and low-salinity tests is the difference in their initial nitrifier proportions, particularly in Nitrospira defluvii and the most abundant Nitrosomonas sp. The proportion of Nitrospira defluvii nearly tripled between the starts of the freshwater test and the low-salinity tests, while the proportion of Nitrosomonas sp. increased nearly eight-fold. Both Nitrospira sp. and Nitrosomonas sp. are often associated with human wastewater, which have much higher effluent N concentrations [14,16]. The high ammonia concentrations added in these tests may have influenced their increased proportion from the start of the freshwater tests to the start of the low-salinity tests. In addition to acclimation to the higher ammonium concentration, the higher proportions of nitrifiers at the beginning of the low-salinity test could help to explain the higher initial nitrification rates in the low-salinity 3 ppt biofilters relative to the freshwater 0 ppt biofilters, though the theoretical maximum nitrification rates were not achieved in the low-salinity biofilters. This could indicate that, while there may have been a higher proportion of nitrifiers in the low-salinity biofilters, they performed nitrification at a slightly slower rate than the freshwater biofilters. The 100% water exchange was likely also a contributing factor.
The Nitrospira defluvii showed a large increase in relative proportion as salinity was increased in the low-salinity biofilters. This trend was not observed in the freshwater biofilters, in which the proportions of each nitrifier stayed relatively constant, though nitrification only occurred in the 0 and 3 ppt biofilters (Figure 1). This indicates that the microbes became mostly inactive or died after a transition to 20 or 33 ppt rather than changing in response to their new conditions. In the low-salinity biofilters, however, the relative proportion of nitrifiers increased, and nitrification had started to occur in the 20 ppt biofilters approximately halfway through the test (Figure 2). The increase in the percentage of nitrifiers in the low-salinity tests shows that the nitrifying community in the low-salinity biofilters responded better to a change in salinity, as they continued to grow, at least in proportion to the rest of the community. The lack of nitrification in the high salt (33 ppt) low-salinity biofilters, however, shows that they were still inactive at the end of the experiment, so perhaps more heterotrophic bacteria were killed by the transition to saltwater.
The purpose of these tests was to investigate whether low-salinity biofilters were better prepared for a shift in salinity in the short term. The DNA results show that the microbial community did have a higher proportion of nitrifiers; however, the rate of nitrification did not reach 10 mg N L−1 d−1 in the 3 ppt test biofilters at the end of the two-week experiment, as was achieved in the freshwater experiment. This could indicate that the community needed more time to adapt to a more resilient state, or that flexibility comes at the cost of speed of the response.

3.3.8. Changes in the Overall Most Abundant SVs

The percentages in each sample of the most abundant non-nitrifying community members that were classified to genus level are presented in Table 3. The most abundant SV in all samples was a member of the family Microscillaceae, which was not classified to genus level, but was kept in the table due to its high abundance. The remainder of the table shows the taxa able to be classified to genus level. Several of the genera showed an overall decrease in proportion between the freshwater and low-salinity biofilters, such as Pirellula sp. and Terrimonas sp. The rest of the genera either stayed at similar proportions, or increased in the low-salinity biofilters. This shows that the more abundant heterotrophs in the biofilters may have been able to “bounce back” after the shift in salinity due to the larger number of members, while the less abundant species (<0.5% of the total reads) were killed almost entirely.

4. Conclusions

The results of this static, bench-scale study showed that maintaining biofilters with a small amount of salinity may assist in the recovery of nitrification activity more quickly after a dramatic change in salinity; however, the small short-term benefits (about 11% in two weeks) may not outweigh the cost of running a system with salinity. Systems may instead benefit from a multiple-day shift in salinity as recommended by previously discussed studies. The overall conclusions of this work are as follows:
(1)
When biofilters were maintained at 3 ppt before being shifted to 20 ppt, they showed a slight nitrification recovery (11%). Shifting to 33 ppt showed no recovery. When shifted similarly, freshwater biofilters did not recover in either 20 or 33 ppt. Low-level salinity maintenance may not be sufficient to enable traditional biofilters to respond rapidly to abrupt salinity shifts.
(2)
Sequencing results showed that heterotrophic bacteria in biofilters may be more sensitive to salinity changes than the nitrifiers in the short-term. Future work could include investigation into salinity shifts on different biofilter compositions with resistance to other environmental factors (such as pH or temperature); this could show whether community resistance to other environmental stressors may better prepare the heterotrophs for salinity shifts and provide faster short-term recoveries.
(3)
A longer series of similar tests (upwards of two weeks) could possibly fully characterize the effects of this method of salinity acclimation and help to fully understand the microbial community dynamics in more long-term scenarios.

Supplementary Materials

The following supporting information can be downloaded at https://www.mdpi.com/article/10.3390/w16202911/s1, Figure S1: Phylum distribution for (a) freshwater and (b) low-salinity biofilters; Figure S2: Differential abundance for initial freshwater samples and final freshwater samples maintained at 0 ppt; Figure S3: Differential abundance of microorganisms from the start of the 30-day 3 ppt acclimation period to the end; Figure S4: Differential abundance of organisms in freshwater (left) versus low-salinity-adapted (right) biofilters.

Author Contributions

Conceptualization, E.M.C. and J.D.M.; methodology, E.M.C., D.A.B., S.L.I. and J.D.M.; formal analysis, E.M.C. and S.L.I.; investigation, E.M.C.; writing—original draft preparation, E.M.C.; writing—review and editing, E.M.C., D.A.B., S.L.I. and J.D.M.; visualization, E.M.C.; supervision, J.D.M.; project administration, J.D.M.; funding acquisition, J.D.M. All authors have read and agreed to the published version of the manuscript.

Funding

This research received no external funding.

Data Availability Statement

The original data presented in the study are openly available online at the National Center for Biotechnology Information (NCBI) with accession number PRJNA926625.

Acknowledgments

The authors would like to thank the University of Maine for its research reinvestment fund, as well as the University of Maine Cooperative Extension and Aquaculture Research Institute for use of their biofilter media and facilities.

Conflicts of Interest

The authors declare no conflicts of interest. The funders had no role in the design of the study; in the collection, analyses, or interpretation of data; in the writing of the manuscript; or in the decision to publish the results.

References

  1. Bregnballe, J. A Guide to Recirculation Aquaculture. FAO Eurofish Rep. 2015, 100. Available online: https://openknowledge.fao.org/server/api/core/bitstreams/7928a883-445d-41e4-9ba2-ff4e464db8a2/content (accessed on 10 December 2021).
  2. Zimmer, A.M. Ammonia Excretion by the Fish Gill: Discoveries and Ideas That Shaped Our Current Understanding. J. Comp. Physiol. B Biochem. Syst. Environ. Physiol. 2024, 1–19. [Google Scholar] [CrossRef]
  3. Gao, Y.; Wang, X.; Li, J.; Lee, C.T.; Ong, P.Y.; Zhang, Z.; Li, C. Effect of Aquaculture Salinity on Nitrification and Microbial Community in Moving Bed Bioreactors with Immobilized Microbial Granules. Bioresour. Technol. 2020, 297, 122427. [Google Scholar] [CrossRef] [PubMed]
  4. Skoyles, A.; Chaganti, S.R.; Mundle, S.O.C.; Weisener, C.G. Nitrification Kinetics and Microbial Community Dynamics of Attached Biofilm in Wastewater Treatment. Water Sci. Technol. 2020, 81, 891–905. [Google Scholar] [CrossRef] [PubMed]
  5. Kinyage, J.P.H.; Pedersen, P.B.; Pedersen, L.F. Effects of Abrupt Salinity Increase on Nitrification Processes in a Freshwater Moving Bed Biofilter. Aquac. Eng. 2019, 84, 91–98. [Google Scholar] [CrossRef]
  6. Navada, S.; Vadstein, O. Salinity Acclimation Strategies in Nitrifying Bioreactors. Front. Mar. Sci. 2022, 9, 867592. [Google Scholar] [CrossRef]
  7. Navada, S.; Vadstein, O.; Gaumet, F.; Tveten, A.K.; Spanu, C.; Mikkelsen, Ø.; Kolarevic, J. Biofilms Remember: Osmotic Stress Priming as a Microbial Management Strategy for Improving Salinity Acclimation in Nitrifying Biofilms. Water Res. 2020, 176, 115732. [Google Scholar] [CrossRef]
  8. Navada, S.; Sebastianpillai, M.; Kolarevic, J.; Fossmark, R.O.; Tveten, A.K.; Gaumet, F.; Mikkelsen, Ø.; Vadstein, O. A Salty Start: Brackish Water Start-up as a Microbial Management Strategy for Nitrifying Bioreactors with Variable Salinity. Sci. Total Environ. 2020, 739, 139934. [Google Scholar] [CrossRef]
  9. Breves, J.P.; Shaughnessy, C.A. Endocrine Control of Gill Ionocyte Function in Euryhaline Fishes. J. Comp. Physiol. B Biochem. Syst. Environ. Physiol. 2024, 1–22. [Google Scholar] [CrossRef]
  10. Moran, D. Carbon Dioxide Degassing in Fresh and Saline Water. I: Degassing Performance of a Cascade Column. Aquac. Eng. 2010, 43, 29–36. [Google Scholar] [CrossRef]
  11. Navada, S.; Vadstein, O.; Tveten, A.K.; Verstege, G.C.; Terjesen, B.F.; Mota, V.C.; Venkataraman, V.; Gaumet, F.; Mikkelsen, Ø.; Kamstra, A. Influence of Rate of Salinity Increase on Nitrifying Biofilms. J. Clean. Prod. 2019, 238, 117835. [Google Scholar] [CrossRef]
  12. Hüpeden, J.; Wemheuer, B.; Indenbirken, D.; Schulz, C.; Spieck, E. Taxonomic and Functional Profiling of Nitrifying Biofilms in Freshwater, Brackish and Marine RAS Biofilters. Aquac. Eng. 2020, 90, 102094. [Google Scholar] [CrossRef]
  13. Holmes, D.E.; Dang, Y.; Smith, J.A. Nitrogen Cycling during Wastewater Treatment, 1st ed.; Elsevier Inc.: Amsterdam, The Netherlands, 2019; Volume 106, ISBN 9780128169759. [Google Scholar]
  14. Lehtovirta-Morley, L.E. Ammonia Oxidation: Ecology, Physiology, Biochemistry and Why They Must All Come Together. FEMS Microbiol. Lett. 2018, 365, fny058. [Google Scholar] [CrossRef] [PubMed]
  15. Fumasoli, A.; Bürgmann, H.; Weissbrodt, D.G.; Wells, G.F.; Beck, K.; Mohn, J.; Morgenroth, E.; Udert, K.M. Growth of Nitrosococcus-Related Ammonia Oxidizing Bacteria Coincides with Extremely Low pH Values in Wastewater with High Ammonia Content. Environ. Sci. Technol. 2017, 51, 6857–6866. [Google Scholar] [CrossRef] [PubMed]
  16. Mehrani, M.J.; Sobotka, D.; Kowal, P.; Ciesielski, S.; Makinia, J. The Occurrence and Role of Nitrospira in Nitrogen Removal Systems. Bioresour. Technol. 2020, 303, 122936. [Google Scholar] [CrossRef]
  17. Füssel, J.; Lücker, S.; Yilmaz, P.; Nowka, B.; van Kessel, M.A.H.J.; Bourceau, P.; Hach, P.F.; Littmann, S.; Berg, J.; Spieck, E.; et al. Adaptability as the Key to Success for the Ubiquitous Marine Nitrite Oxidizer Nitrococcus. Sci. Adv. 2017, 3, 2–10. [Google Scholar] [CrossRef]
  18. Huang, J.; Xu, L.; Guo, Y.; Liu, D.; Chen, S.; Tang, Q.; Zheng, H.; Tan, J.; Peng, F. Intermittent Aeration Improving Activated Granular Sludge Granulation for Nitrogen and Phosphorus Removal from Domestic Wastewater. Bioresour. Technol. Rep. 2021, 15, 100739. [Google Scholar] [CrossRef]
  19. Lücker, S.; Nowka, B.; Rattei, T.; Spieck, E.; Daims, H. The Genome of Nitrospina Gracilis Illuminates the Metabolism and Evolution of the Major Marine Nitrite Oxidizer. Front. Microbiol. 2013, 4, 27. [Google Scholar] [CrossRef]
  20. Roalkvam, I.; Dronen, K.; Dahle, H.; Wergeland, H.I. A Case Study of Biofilter Activation and Microbial Nitrification in a Marine Recirculation Aquaculture System for Rearing Atlantic Salmon (Salmo salar L.). Aquac. Res. 2020, 52, 94–104. [Google Scholar] [CrossRef]
  21. Khangembam, C.D.; Sharma, J.G.; Chakrabarti, R. Diversity and Abundance of Ammonia-Oxidizing Bacteria and Archaea in a Freshwater Recirculating Aquaculture System. HAYATI J. Biosci. 2017, 24, 215–220. [Google Scholar] [CrossRef]
  22. Ytrestøyl, T.; Takle, H.; Kolarevic, J.; Calabrese, S.; Timmerhaus, G.; Rosseland, B.O.; Teien, H.C.; Nilsen, T.O.; Handeland, S.O.; Stefansson, S.O.; et al. Performance and Welfare of Atlantic Salmon, Salmo salar L. Post-Smolts in Recirculating Aquaculture Systems: Importance of Salinity and Water Velocity. J. World Aquac. Soc. 2020, 51, 373–392. [Google Scholar] [CrossRef]
  23. Timmons, M.B.; Guerdat, T.; Vinci, B.J. Recirculating Aquaculture, 4th ed.; Ithaca Publishing Company, LLC.: Ithaca, NY, USA, 2018. [Google Scholar]
  24. Wang, X.; Wen, X.; Xia, Y.; Hu, M.; Zhao, F.; Ding, K. Ammonia Oxidizing Bacteria Community Dynamics in a Pilot-Scale Wastewater Treatment Plant. PLoS ONE 2012, 7, e36272. [Google Scholar] [CrossRef]
  25. Morin, L.; Goubet, A.; Madigou, C.; Pernelle, J.J.; Palmier, K.; Labadie, K.; Lemainque, A.; Michot, O.; Astoul, L.; Barbier, P.; et al. Colonization Kinetics and Implantation Follow-up of the Sewage Microbiome in an Urban Wastewater Treatment Plant. Sci. Rep. 2020, 10, 11634. [Google Scholar] [CrossRef] [PubMed]
  26. Callahan, B.J.; McMurdie, P.J.; Rosen, M.J.; Han, A.W.; Johnson, A.J.A.; Holmes, S.P. DADA2: High-Resolution Sample Inference from Illumina Amplicon Data. Nat. Methods 2016, 13, 581–583. [Google Scholar] [CrossRef]
  27. Love, M.I.; Huber, W.; Anders, S. Moderated Estimation of Fold Change and Dispersion for RNA-Seq Data with DESeq2. Genome Biol. 2014, 15, 550. [Google Scholar] [CrossRef]
  28. Wickham, H.; Francois, R.; Henry, L.; Muller, K. dplyr: A Grammar of Data Manipulation. 2022. Available online: https://dplyr.tidyverse.org (accessed on 5 March 2022).
  29. Emparanza, E.J.M. Problems Affecting Nitrification in Commercial RAS with Fixed-Bed Biofilters for Salmonids in Chile. Aquac. Eng. 2009, 41, 91–96. [Google Scholar] [CrossRef]
  30. Carvajal-Arroyo, J.M.; Puyol, D.; Li, G.; Lucero-Acuña, A.; Sierra-Álvarez, R.; Field, J.A. Pre-Exposure to Nitrite in the Absence of Ammonium Strongly Inhibits Anammox. Water Res. 2014, 48, 52–60. [Google Scholar] [CrossRef]
  31. Davidson, J.; Good, C.; Williams, C.; Summerfelt, S.T. Evaluating the Chronic Effects of Nitrate on the Health and Performance of Post-Smolt Atlantic Salmon Salmo Salar in Freshwater Recirculation Aquaculture Systems. Aquac. Eng. 2017, 79, 1–8. [Google Scholar] [CrossRef]
  32. Schrader, K.K.; Davidson, J.W.; Summerfelt, S.T. Evaluation of the Impact of Nitrate-Nitrogen Levels in Recirculating Aquaculture Systems on Concentrations of the off-Flavor Compounds Geosmin and 2-Methylisoborneol in Water and Rainbow Trout (Oncorhynchus mykiss). Aquac. Eng. 2013, 57, 126–130. [Google Scholar] [CrossRef]
  33. Gonzalez-Silva, B.M.; Jonassen, K.R.; Bakke, I.; Østgaard, K.; Vadstein, O. Nitrification at Different Salinities: Biofilm Community Composition and Physiological Plasticity. Water Res. 2016, 95, 48–58. [Google Scholar] [CrossRef]
  34. Glasl, B.; Smith, C.E.; Bourne, D.G.; Webster, N.S. Exploring the Diversity-Stability Paradigm Using Sponge Microbial Communities. Sci. Rep. 2018, 8, 8425. [Google Scholar] [CrossRef] [PubMed]
  35. Thibaut, L.M.; Connolly, S.R. Understanding Diversity-Stability Relationships: Towards a Unified Model of Portfolio Effects. Ecol. Lett. 2013, 16, 140–150. [Google Scholar] [CrossRef] [PubMed]
  36. Mikkelson, G.M.; McGill, B.J.; Beaulieu, S.; Beukema, P.L. Multiple Links between Species Diversity and Temporal Stability in Bird Communities across North America. Evol. Ecol. Res. 2011, 13, 361–372. [Google Scholar]
  37. Sun, D.; Tang, X.; Zhao, M.; Zhang, Z.; Hou, L.; Liu, M.; Wang, B.; Klümper, U.; Han, P. Distribution and Diversity of Comammox Nitrospira in Coastal Wetlands of China. Front. Microbiol. 2020, 11, 589268. [Google Scholar] [CrossRef] [PubMed]
  38. Ma, Y.; Yu, Z.; Du, X.; Zhang, T.; Wang, N.; Tao, W. Characterization of Bacterial Community, Ammonia-Oxidizing Bacteria, and Nitrospira during the Operation of a Commercial-Scale Recirculating Aquaculture System for Culturing Pufferfish Takifugu Rubripes. J. Ocean Univ. China 2020, 19, 1399–1408. [Google Scholar] [CrossRef]
  39. Bartelme, R.P.; McLellan, S.L.; Newton, R.J. Freshwater Recirculating Aquaculture System Operations Drive Biofilter Bacterial Community Shifts around a Stable Nitrifying Consortium of Ammonia-Oxidizing Archaea and Comammox Nitrospira. Front. Microbiol. 2017, 8, 101. [Google Scholar] [CrossRef]
  40. Thandar, S.M.; Ushiki, N.; Fujitani, H.; Sekiguchi, Y.; Tsuneda, S. Ecophysiology and Comparative Genomics of Nitrosomonas Mobilis Ms1 Isolated from Autotrophic Nitrifying Granules of Wastewater Treatment Bioreactor. Front. Microbiol. 2016, 7, 1869. [Google Scholar] [CrossRef]
  41. Fujitani, H.; Momiuchi, K.; Ishii, K.; Nomachi, M.; Kikuchi, S.; Ushiki, N.; Sekiguchi, Y.; Tsuneda, S. Genomic and Physiological Characteristics of a Novel Nitrite-Oxidizing Nitrospira Strain Isolated from a Drinking Water Treatment Plant. Front. Microbiol. 2020, 11, 545190. [Google Scholar] [CrossRef] [PubMed]
  42. Hobley, L.; King, J.R.; Sockett, R.E. Bdellovibrio Predation in the Presence of Decoys: Three-Way Bacterial Interactions Revealed by Mathematical and Experimental Analyses. Appl. Environ. Microbiol. 2006, 72, 6757–6765. [Google Scholar] [CrossRef]
  43. Shan, J.; Tian, X.; Guan, C.; Zhang, C.; Zhang, Y.; Chen, S. Effect of Copper Ion Sterilization on Bacterial Community in a Freshwater Recirculating Aquaculture System. Curr. Microbiol. 2022, 79, 58. [Google Scholar] [CrossRef]
  44. de Celis, M.; Belda, I.; Ortiz-Álvarez, R.; Arregui, L.; Marquina, D.; Serrano, S.; Santos, A. Tuning up Microbiome Analysis to Monitor WWTPs’ Biological Reactors Functioning. Sci. Rep. 2020, 10, 4079. [Google Scholar] [CrossRef] [PubMed]
  45. Kellogg, C.A.; Ross, S.W.; Brooke, S.D. Bacterial Community Diversity of the Deep-Sea Octocoral Paramuricea Placomus. PeerJ 2016, 2016, e2529. [Google Scholar] [CrossRef] [PubMed]
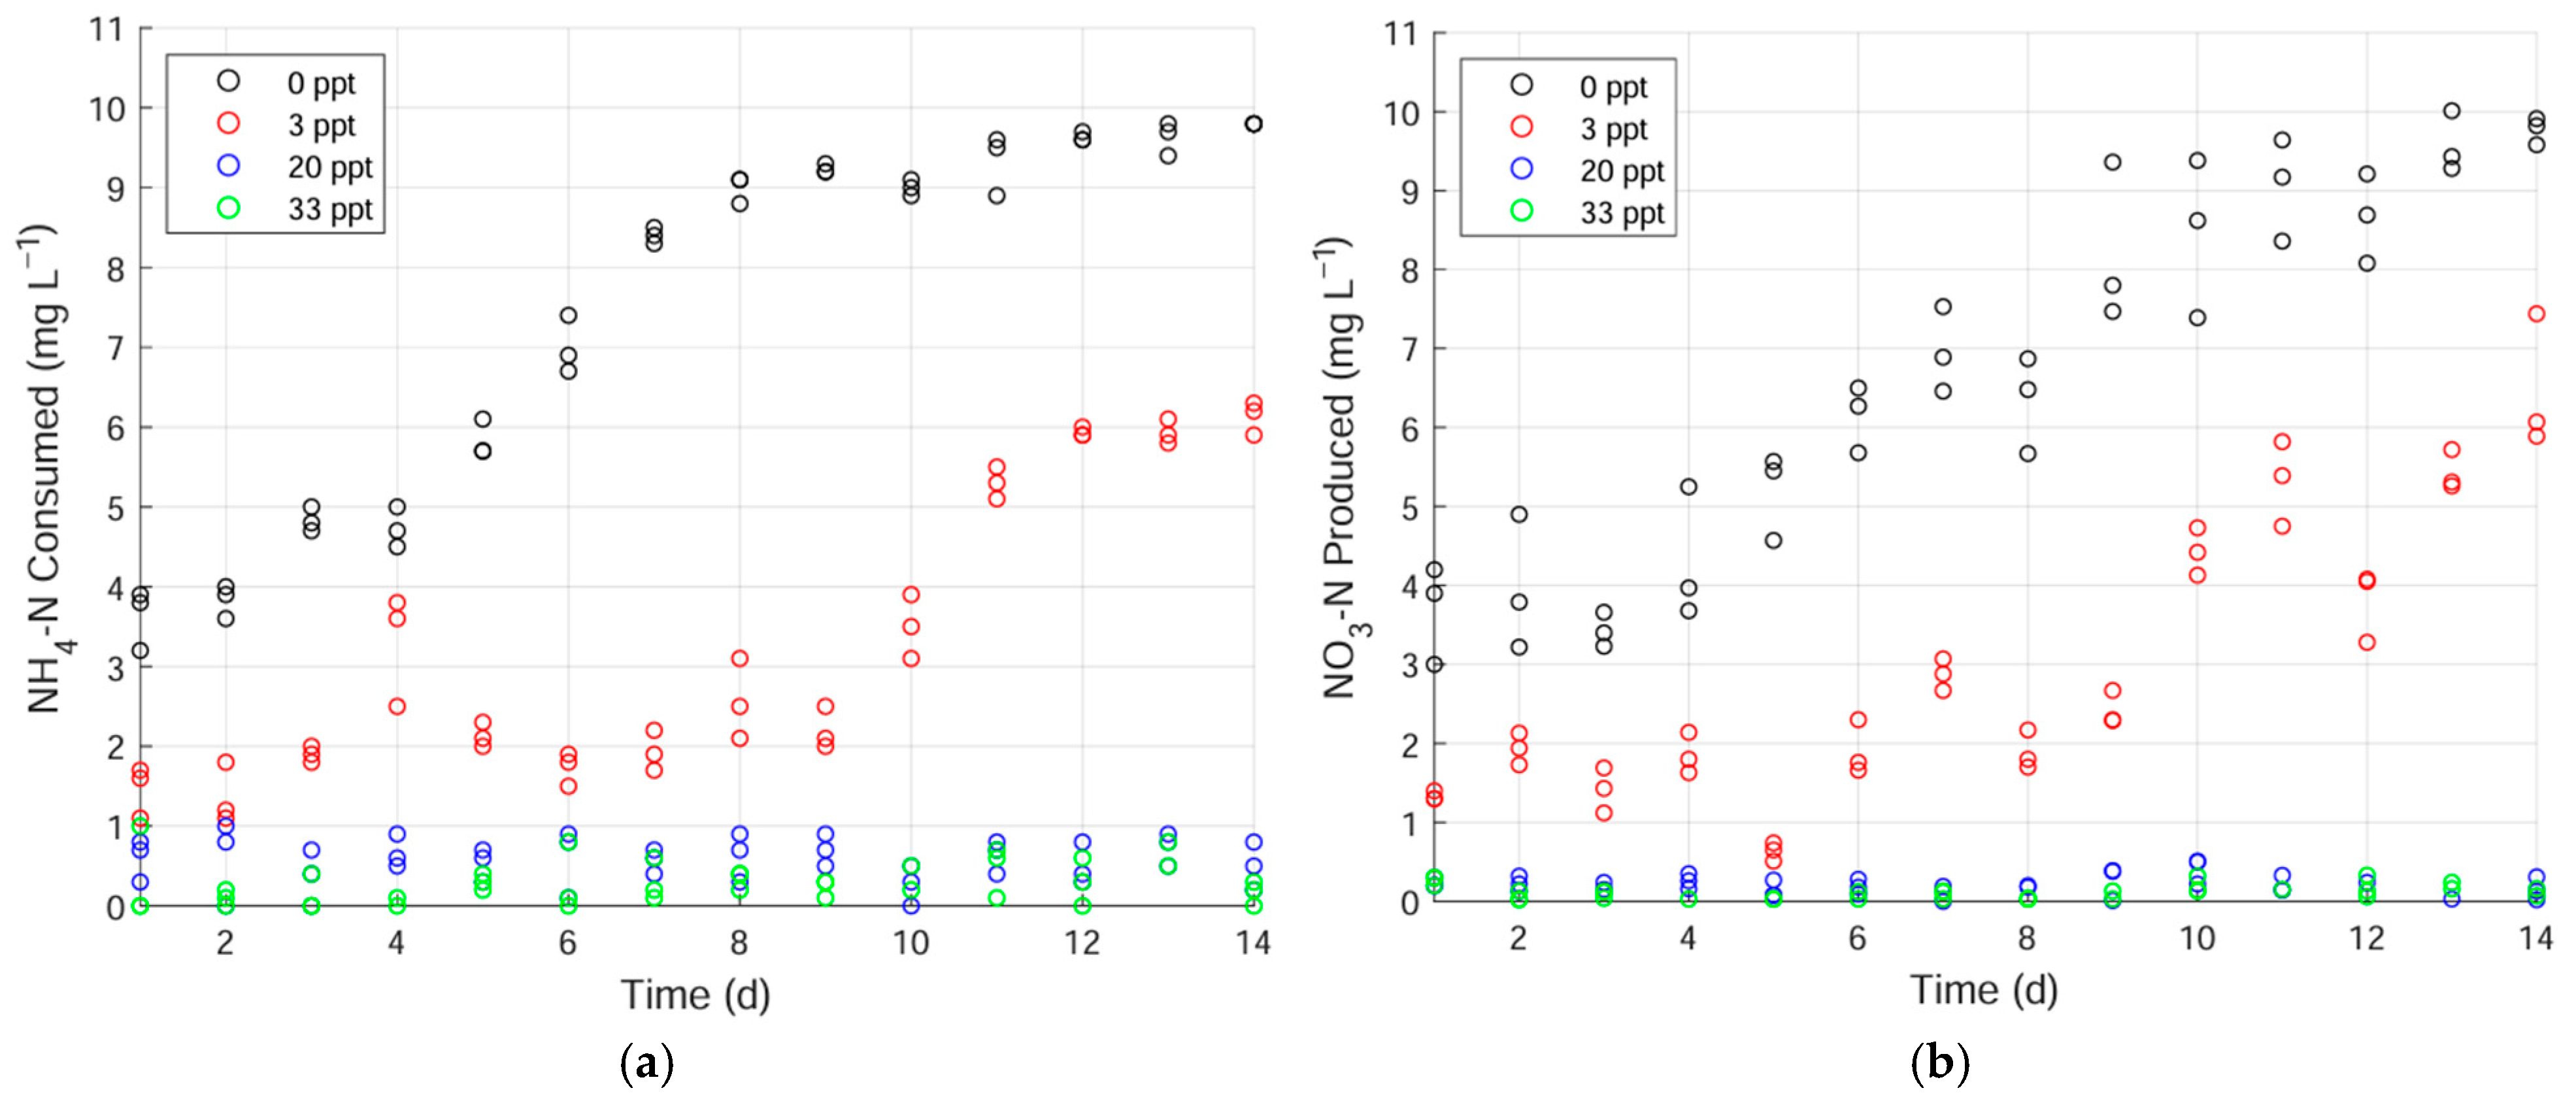
Figure 1. Daily (a) ammonium removal and (b) nitrate production at each salinity for freshwater biofilters. Background accumulation of nitrite at day 14: 9.1 mg L −1 for 0 ppt; 3.3 mg L −1 for 3 ppt; 4.9 mg L −1 for 20 ppt; 2.2 mg L −1 for 33 ppt.
Water 16 02911 g001
Figure 2. Daily (a) ammonium removal and (b) nitrate production at each salinity for low-salinity biofilters. Background accumulation of nitrite at day 14: 5.3 mg L−1 for 3 ppt, 1.8 mg L−1 for 20 ppt, 2.8 mg L−1 for 33 ppt.
Water 16 02911 g002
Figure 3. Canonical coordinate analysis (CCA) plot of all biofilter samples, arrows show influence of variables on clustering.
Water 16 02911 g003
Figure 4. Feature prediction of taxa in each biofilter, top 30 most significant taxa.
Water 16 02911 g004
Table 1. a. Alpha diversity and evenness of freshwater biofilter samples. b. Alpha diversity and evenness of low-salinity biofilter samples.
StageObserved # SVsShannon’s DiversityEvenness
MeanSt. Dev.MeanSt. Dev.MeanSt. Dev
a
Initial744504.8110.0360.7280.005
Final 0 ppt8362324.8740.1490.7280.014
Final 3 ppt6631944.6110.2450.7120.008
Final 20 ppt560654.6350.2020.7330.019
Final 33 ppt739494.7830.0330.7240.004
b
Initial7842124.5670.1670.6880.015
Final 3 ppt6412244.3050.2350.6700.008
Final 20 ppt488294.2490.1650.6860.022
Final 33 ppt478234.0940.2270.6640.041
Table 2. Percentage of total reads per sample for top 6 nitrifying genera (able to be classified to genus level and at >0.5% of total reads), average of the three biofilters at each salinity.
FamilyGenus sp.Freshwater Biofilters (%)Low-Salinity Biofilters (%)
InitialFinalInitialFinal
0 ppt3 ppt20 ppt33 ppt3 ppt20 ppt33 ppt
NitrospiraceaeNitrospira defluvii2.183.602.681.432.056.066.587.3410.71
NitrosomonadaceaeNitrosomonas sp.0.641.191.310.981.874.495.404.096.66
NitrospiraceaeNitrospira sp.3.332.122.372.091.982.402.182.403.46
NitrosomonadaceaeNitrosomonas
aestuarii
1.181.813.123.951.591.201.781.601.79
NitrospiraceaeNitrospira sp.0.550.630.710.590.560.610.570.571.09
NitrosomonadaceaeNitrosomonas sp.0.360.720.960.490.300.630.600.500.95
Table 3. Percentage of total reads per sample for top 9 non-nitrifying genera (able to be classified to genus level and at >0.5% of total reads, 16 taxa were left out), average of the three biofilters at each salinity.
FamilyGenus Freshwater Biofilters (%)Low-Salinity Biofilters (%)
InitialFinalInitialFinal
0 ppt3 ppt20 ppt33 ppt3 ppt20 ppt33 ppt
MicroscillaceaeNA5.304.395.054.535.733.164.493.626.06
PhycisphaeraceaeSM1A021.951.712.822.553.163.233.882.343.91
HyphomonadaceaeHirschia2.361.361.541.662.201.991.861.562.03
PseudohongiellaceaePseudohongiella1.791.161.371.401.500.760.920.882.00
PirellulaceaePirellula0.870.961.581.990.980.550.710.710.37
ChitinophagaceaeTerrimonas1.121.171.031.451.210.410.470.420.41
MicroscillaceaeOLB120.350.400.400.400.751.121.241.200.60
ComamonadaceaeHydrogenophaga0.510.400.750.550.590.610.631.221.62
OceanibaculaceaeOceanibaculum0.560.380.370.380.740.660.570.481.40
Disclaimer/Publisher’s Note: The statements, opinions and data contained in all publications are solely those of the individual author(s) and contributor(s) and not of MDPI and/or the editor(s). MDPI and/or the editor(s) disclaim responsibility for any injury to people or property resulting from any ideas, methods, instructions or products referred to in the content.