Abstract
Hydropower as a flexible regulation resource is a rare choice to suppress the ever-increasing penetration of wind power in electrical power systems. The complementary characteristics and performance improvement of a hydro–wind hybrid power system based on a mathematical model of the hybrid power system is studied in this paper. This established model takes into account the stochastic variation in wind speeds in the wind power subsystem and the hydraulic–mechanical–electrical coupling characteristics of the hydropower subsystem. The complementary analysis is conducted based on the evaluation variables outputted by the established model, such as the wind power, hydro-regulation power, hydraulic power, and frequency. To make full use of the regulation capability of the hydropower system, the optimization of parameter settings is also carried out to improve complementary performances of the hybrid power system. The results from the complementary analysis show the detailed characteristics of hydro–wind coordinated operation under different types of real wind speeds. Here, 95% of installed hydro-capacity is used to complement the power shortage of the intermittent wind energy under the low wind speed. Alternatively, only around 66% of the installed hydro-capacity can be utilized to cope with the fluctuation in wind power under the medium and high wind speeds before the optimization of parameter settings. The recommended values and change rules of the control, hydraulic, and electrical parameters for the hydropower system are subsequently revealed from the analysis of parameter settings to contribute to a stable and safe hybrid power system. The results show that the optimized parameter can increase the maximal regulating capacity of the hydropower system by nearly 9 MW, approximately a sixth of the total installed hydropower capacity. The method and results obtained in this paper provide theoretical and technical guidance for the safe and economical operation of power stations.
1. Introduction
To cope with the challenge of climate change and the crisis of energy shortage, global energy generation is gradually tending towards clean renewable energy such as water energy, solar photovoltaic energy, wind energy, biomass energy, geothermal energy, and tidal energy [1]. These renewable energy resources have been applied in various sectors, such as active filters and railways, especially in the power generation industry [2,3].
Among the various energy resources, wind power has become the most rapidly developing form of renewable energy in the world owing to its easy access, non-pollution, and suitability for large-scale development [4]. However, the characteristics of volatility and intermittency of wind power have adverse impacts on the power production, operational regulation, and load tracking of hybrid power systems [5]. One way to cope with this problem is to develop different advanced control of wind approaches, such as the direct power control [6] and fuzzy control [7]. Another way is to complement the flexibility energy resources to balance the large fluctuation of power outputs. Hydropower, as the most mature clean energy in the power system, has flexible regulation ability and stable power supply, which is the best choice of complementary power sources with the advantages of storage, dispatching, quick startup, and rapid closing down [8]. As such, the hydro–wind hybrid power system becomes the most effective way to solve the current problem of the large fluctuations in wind power, since the hydraulic power of hydropower system can continuously regulate and flexibly control the stochastic wind power and finally form the continuous, stable, adjustable, and controllable power output.
To achieve a more stable and reliable hybrid power system and improve the complementary characteristics, recent studies have committed to the model of multiple energy power systems and the improvement of complementarity. Regarding the model of hybrid power systems, Xie et al. (2021) [9] proposed the hydro–wind power model that pays more attention to effectively utilizing reservoir storage. Xiong et al. (2021) [10] proposed a hybrid power model to study the regulation impact of the hydropower system on the stochastic wind power. Wang et al. (2024) [11] presented a model of the hydro–wind-based power system considering the hedging law and complementary dispatching. Liu et al. (2023) [12] established a model of a hybrid power system based on the method of multi-stage nesting and chance constraint to ensure the reliability of power generation. Zhou et al. (2023) [13] proposed a model of a grid-connected hydro–wind-based energy system by effectively using the flexible reserve. Sukah et al. (2024) [14] presented a model of a hybrid power system to search for the minimal cost under various objective functions and constraints. Lin et al. (2024) [15] proposed a multi-layer optimization model of a hybrid power system to help increase energy generation. Regarding the improvement of complementarity, the impact of system parameters on complementary performances is usually investigated in the literature since it is the simplest and the most economical way to enhance the coordinated operation quality of multiple energy power systems. For instance, He et al. (2023) [16] improved the complementary performances by optimizing the installed capacities of multiple renewable energy resources. Guo et al. (2022) [17] proposed a methodology for improving complementary performance that considers the advantages of battery storage. Wang et al. (2024) [18] aimed to optimize the system parameters of the hybrid power system by using the advanced genetic algorithm. Jiang et al. (2023) [19] investigated the effect of system parameters in hybrid power systems on complementarities based on deep network methods. Shi et al. (2024) [20] used a method of linear programming optimization to find the optimal complementary parameters. Kumar et al. (2024) [21] utilized a predictive control method to adjust the changes in power frequency and voltage to further improve the complementarities of hybrid systems. Based on these findings, there are two gaps in the studies. First, the existing models of hydro–wind hybrid systems are generally presented in terms of the objective functions and constraint conditions, while they lack the mathematical and simulation models that can reflect the hydraulic–mechanical–electrical coupling characteristics of hydropower system and the coupling characteristics of hydro and wind subsystems, especially for models in the timescale of seconds. Second, the variation impacts of the typical system parameters on the complementary performances are difficult to demonstrate due to the complex change rules of the hydraulic, mechanical, and electrical parameters along with the operating time.
Therefore, this work is committed to studying the complementary characteristics of hydro–wind hybrid power systems on the basis of a simulation model that considers the hydraulic–mechanical–electrical coupling characteristics of hydropower system and coupling characteristics of hydropower and wind subsystems. Under three types of real wind speeds, the complementary analysis is conducted to evaluate the hydro-regulation effects on adjusting fluctuations in the wind power outputs. The complementary characteristics are also revealed in this analysis to point out the non-ideal complementary operating condition and the most unfavorable type of wind speed. To improve such complementary performances, the impacts of system parameters on the complementarity are conducted to reflect the sensitivity of typical hydraulic, control, and electrical parameters to stable outputs of wind power and the reduction in the demand gap of hydro-regulation power. The recommended system parameters are also obtained in this investigation. The main contributions of this paper include the following two aspects. (i) The coordinated operating scenario regarding the lowest utilization rate of the installed hydro-capacity is identified in order to further improve the complementary performances through the optimization of parameter settings, which helps take full use of the hydropower energy and improve the power generation in power stations. (ii) The methodology of this work for improving complementary performances of hydro–wind power systems can be applied to other renewable energy power systems that use hydropower as a flexible energy source. This brings necessary knowledge to the field of the efficient use of energy.
The overall framework of this paper is as follows. A hydro–wind hybrid power model is given in Section 2. The complementary analysis is conducted in Section 3. The impacts of system parameters on the complementary characteristics are conducted in Section 4. Section 5 concludes with the main findings.
2. Hydro–Wind Hybrid Power Model
In this section, a model of the hydro–wind hybrid power system is established which considers the wind power system and hydropower system. It mainly utilizes hydropower to regulate the fluctuation of wind power. The hydropower system consists of the hydro-turbine, diversion pipeline, governor, and synchronous generator. The wind power system is made up of the doubly fed induction generator (DFIG), wind turbine, converter, and transmission system. The detailed modeling procedure is shown as follows.
2.1. Hydropower System
Figure 1 [22] describes the working mechanism of the hydro-turbine and diversion pipeline.
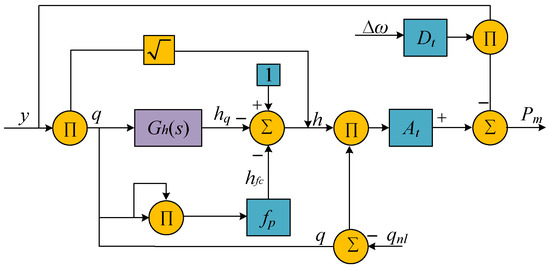
Figure 1.
Working mechanism of yjr hydro-turbine and diversion pipeline.
The dynamic characteristic of the diversion pipeline refers to the variation of turbine head caused by the change in turbine flow, represented by the flow–head transfer function. This transfer function is from the flow change Δq to the turbine transient head Δhq, and it is expressed by the following elastic water-hammer equation [23,24]:
If set:
Equation (1) is rewritten as:
On the basis of the Laplace transform initial value theorem:
The initial value of r(t) is set at 0. When the Laplace inverse transformation is performed for Equations (2) and (3), they are obtained as:
and
Define x1 = r(t), x2 = r′(t), and x3 = r″(t). Equation (6) is further converted into the flowing state-space equation [25]:
and it is also obtained as:
Meanwhile, the output power of hydro-turbine [26] is:
This paper uses a fifth-order synchronous generator model [27], and the corresponding equation is:
2.2. Model of Control System
The hydropower system mainly uses the parallel PID controller to adjust the variation in the hydraulic frequency. The parallel PID controller adopts the proportional–integral–differential (PID) control law. Correspondingly, the tuning parameters of the PID control system include the proportional, integral, and differential adjustment coefficients Kp, Ki, and Kd, respectively. The mathematical model of the PID control system [28] is:
If the coefficient of the permanent state difference bp = 0, the transfer function of the PID controller between the guide vane opening YPID(s) and input frequency ΔF(s) is:
and
Based on the above considerations, the PID governor is modeled in Figure 2.
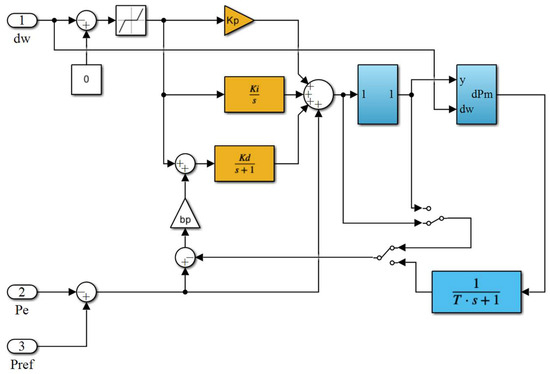
Figure 2.
Model of the PID governor.
Finally, the hydropower system considering the hydro-turbine, diversion pipeline, governor, and synchronous generator is modeled in Figure 3.
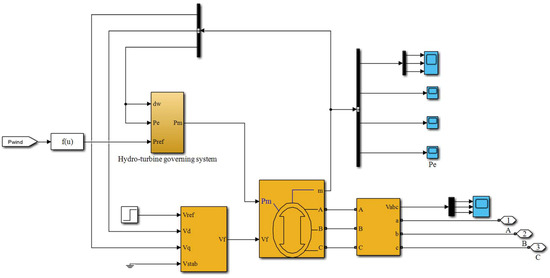
Figure 3.
Model of the hydropower system. The chart mainly involves the modules of the hydro-turbine governing system, the synchronous generator, and the excitation system. Parameters Vf, Vref, Vd, Vq, Vstab, dw, Pref, Pm, and Pe represent the field voltage, the reference voltage, the d-axis voltage, the q-axis voltage, the stabilized voltage, the variation of rotor speed, the reference power, the output power of the hydro-turbine, and the output power of the hydropower system, respectively.
2.3. Wind Power System
Kinetic energy is converted into mechanical energy through wind turbines. The wind speed through the blade cannot be fully converted by the wind turbine. The DFIG ceases to function when the wind speed surpasses the thresholds for cut-in and cut-out wind speeds. When the wind speed exceeds the cut-in threshold but remains below the cut-out threshold, the wind power system operates in maximum power tracking mode. When the wind speed exceeds the cut-out wind speed, the wind generator maintains operation at its rated power. Accordingly, the expression of output power is as follows:
The DFIG uses the conventional back-to-back converter. The converter control includes the grid-side controller and rotor-side controller. The rotor-side controller adopts vector control to realize active and reactive decoupling control. The expression of the rotor-side controller [29,30,31] is:
and
and
The grid-side controller adjusts the constant DC-side capacitor voltage of the back-to-back converter and the output of reactive power of converter. The voltage of the capacitor is controlled by the d-axis component of the grid side converter current, and the reactive power is controlled by the q-axis component of the grid-side converter current. The control equation is expressed as:
and
and
The transmission system connects the blade to the generator. The transmission is made up of the transmission shaft and hub, and it is linked with generator rotor through the gearbox and drive shaft. This study considers a rigid shaft that reflects the flexibility and damping characteristics. The transmission system is expressed as:
Based on the above considerations, Figure 4 shows the model of wind power system.
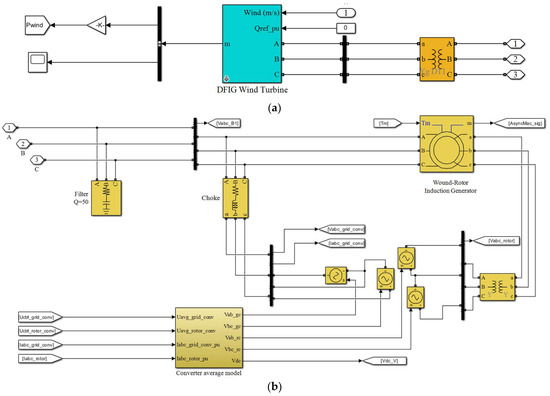
Figure 4.
Block diagram of the wind power system. (a) Model of the wind power system, and (b) details of the DFIG wind turbine in the model of the wind power system. The module of the DFIG wind turbine mainly involves the wound-rotor induction generator, filter, choke, and the converter average model.
2.4. Model of Hybrid System
According to the hydro- and wind power models, the hybrid power system is finally modeled in Figure 5. The established model is validated in Appendix A and Appendix B.
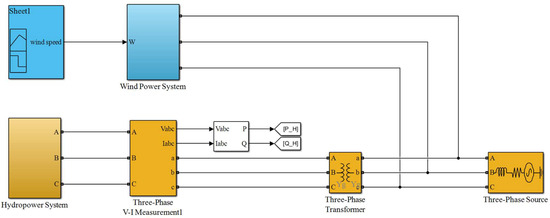
Figure 5.
Model of hydro–wind hybrid power system. In this model, the installed capacities of the hydropower and wind power are 60 MW and 84 MW, respectively. The hydropower system and wind power system connect to the three-phase source through the 380 V/25 kV and 575 V/25 kV three-phase transformers, respectively.
3. Methodology
The improvement of the complementary performances of the hybrid power system is based on the various outputs of the established model. These outputs can form four complementary evaluation criteria, including (i) complementary trends of wind power and hydraulic power, (ii) the difference in power demand and total hydro–wind power, (iii) the fluctuation features of wind power with operating time, and (iv) the stability of the hydraulic frequency. Based on these evaluation criteria, the scenario with the lowest utilization rate of installed hydro-capacity is recognized to further study the optimization of parameter settings. Note that the complementary evaluation criteria are the same so as to optimize the system parameters. The details of the methodology in this work are shown in Figure 6.
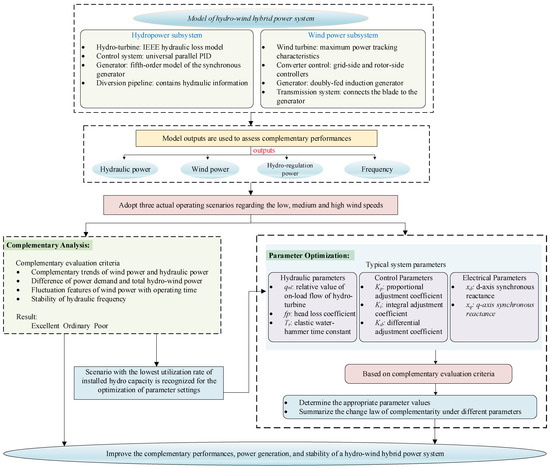
Figure 6.
The methodology in this work.
4. Complementary Analysis
This section aims to study the complementarity of hybrid systems under low, medium, and high wind speeds, and the data of these three types of real wind speeds are from National Renewable Energy Laboratory (NREL, Golden, CO, USA) [32]. The analysis is simulated based on the software of Matlab/Simulink 2023b. The variation in the low, medium, and high wind speeds is shown in Figure 7, and the results of the complementary characteristics are shown in Figure 8 and Figure 9.
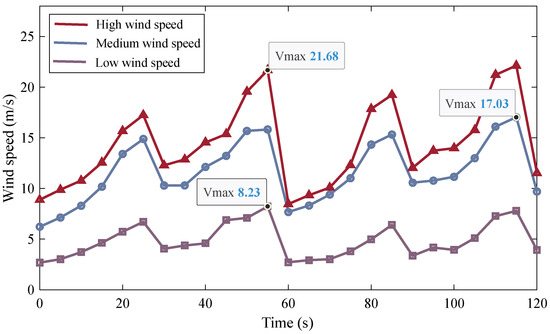
Figure 7.
Three types of real wind speeds: high wind speed, medium wind speed, and low wind speed.
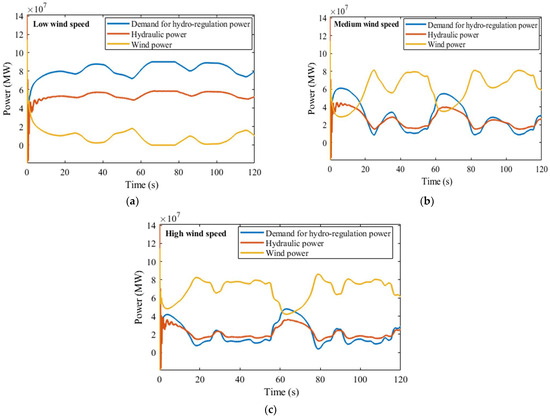
Figure 8.
Complementary performances of the power system under three types of real wind speeds. (a) Low wind speed condition. (b) Medium wind speed condition. (c) High wind speed condition.
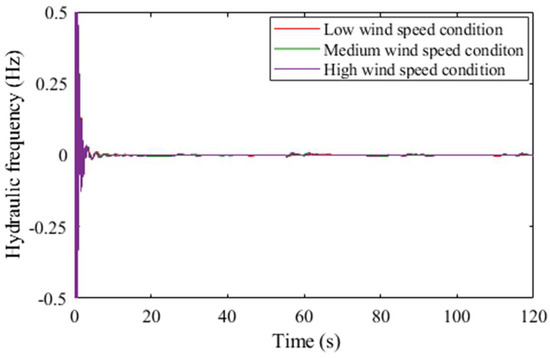
Figure 9.
Hydraulic frequency under the three types of real wind speeds.
In Figure 7, the three types of real wind speeds are obtained by using the Signal Builder module in the software Matlab/Simulink (Matlab 2023b). The variation ranges of low, medium, and high wind speeds are [2.68 m/s, 8.23 m/s], [6.22 m/s, 17.03 m/s], and [8.46 m/s, 21.68 m/s], respectively. All of three types of real wind speeds show similar characteristics of volatility and intermittency. The use of real wind speeds as the input variable enables the newly established mathematical model to output the variables of complementary characteristics, including wind power, hydraulic power, demand for hydro-regulation power, and hydraulic frequency.
Figure 8 clearly shows the differences in the complementarity of the hybrid power system under different real wind speeds. For the condition of low wind speed in Figure 8a, wind power and hydraulic power show opposite variation trends, meaning that the hydropower system is able to complement the fluctuation in wind power. However, hydraulic power cannot meet the demand for hydro-regulation power. This is due to the considerably low output of wind power under the low wind speed. The mean wind power is roughly below 20 MW, which is significantly less than the installed capacity of wind power of 84 MW. In comparison to the condition of low wind speed, there are larger fluctuations in wind power for the medium and high wind speeds in Figure 8b,c. In addition to this, hydraulic power is able to track the change in the demand for the hydro-regulation power. As such, the complementary characteristics of the system are better suited to medium and high wind speeds than to the condition of low wind speed.
Figure 9 shows the variation in hydraulic frequencies under the three types of high wind speed, medium wind speed, and low wind speed. It is found that the fluctuation in hydraulic frequency under the three types of real wind speeds is largely less than the acceptable range of ±0.5 Hz. This means that the hydropower system can suppress the large fluctuation in wind power through its regulation capabilities.
The utilization rate of the installed hydro-capacity reaches 95% under the low wind speed. Conversely, the hydraulic power is significantly less than the rated power under the medium and high wind speeds, and its maximum is roughly 66% of the installed hydro-capacity. Here, the utilization rate of installed hydro-capacity is the ratio of the average output of hydraulic power along the operating time for the installed hydro-capacity. Moreover, the maximal difference responding to the demand for hydro-regulation power is larger for the condition of medium wind speed as compared to the condition of high wind speed. Meanwhile, for the actual operation of power stations, wind power systems frequently operate in the medium wind speed. For these reasons, the following section selects the condition of medium wind speed to further study the optimization of parameter settings of a hydropower system.
5. Impact of Parameter Setting on Complementary Performances
Due to the instability of wind energy caused by the characteristics of intermittence and volatility, the hybrid system uses hydro-regulation capabilities to realize stable operation. Different system parameters of the hydropower system influence the complementarity by adjusting the outputs of hydraulic power and wind power. As such, this section concentrates on analyzing the impact of parameter setting on complementary characteristics, and also on quantifying the impacts of parameter variation on complementary performances. The system parameters mainly involve three subsystems, including the control subsystem, hydraulic subsystem, and electrical subsystem. The parameters for the control subsystem include Kp, Ki, and Kd which are the proportional, integral, and differential adjustment coefficients, respectively. The parameters for the hydraulic subsystem include the head loss coefficient fp, the relative value of on-load flow of the hydro-turbine qnl, and the elastic water-hammer time constant Tr. The parameters of electrical subsystem include the d-axis and q-axis synchronous reactances xd and xq, respectively. Based on the references [23,25,33], the recommended ranges of control parameters are Kp = (0.1, 12), Ki = (0.1, 12), and Kd = (0.1, 8). The recommended ranges of hydraulic parameters are fp = (0.002, 0.03), qn1 = (0.1, 0.4), and Tr = (0.27, 0.87). The recommended ranges of electrical parameters are xd = (0.5, 1.1), and xq = (0.2, 1).
The quantified results are estimated by the maximal difference between the hydraulic power and the demand for hydro-regulation power. The analysis results are shown in Figure 10, Figure 11, Figure 12, Figure 13 and Figure 14.
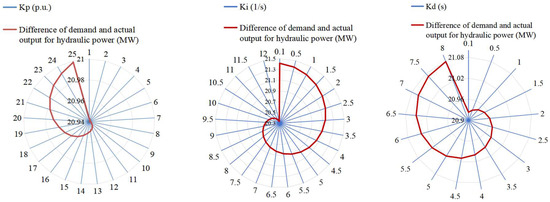
Figure 10.
Difference in demand and actual output for hydraulic power with the control parameters Kp, Ki, and Kd.
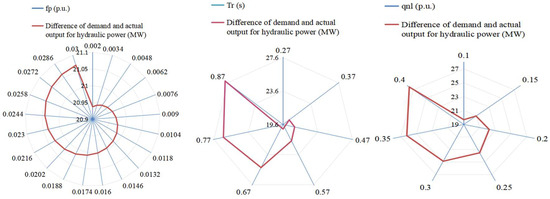
Figure 11.
Difference in demand and actual output for hydraulic power with the hydraulic parameters fp, qnl, and Tr.
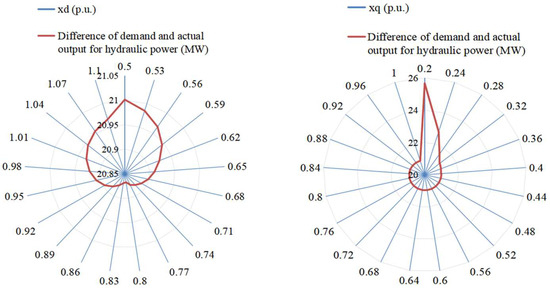
Figure 12.
Difference in demand and actual output for hydraulic power with the electrical parameters xd, and xq.
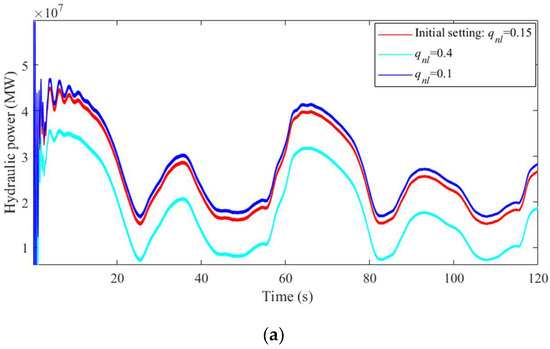
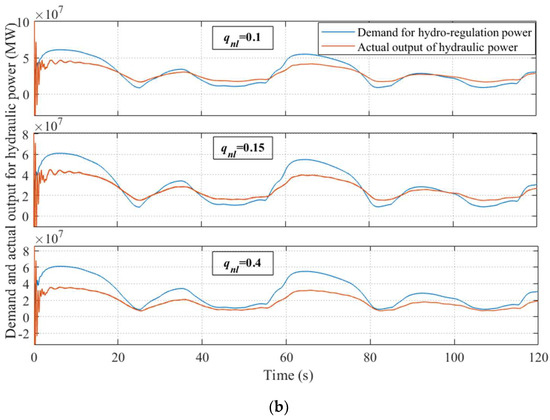
Figure 13.
Complementary characteristics of the system as qnl changes. (a) Hydraulic frequency with qnl = 0.1, 0.15, and 0.4. (b) Demand and actual output for hydraulic power with qnl = 0.1, 0.15, and 0.4.
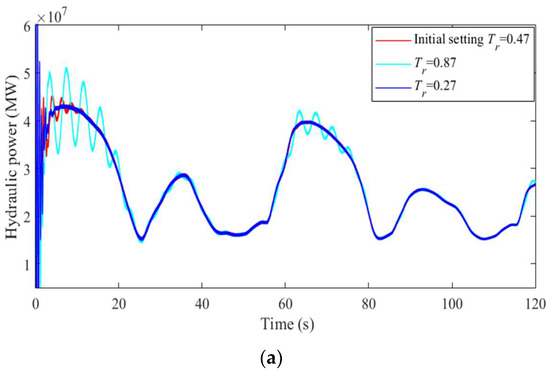
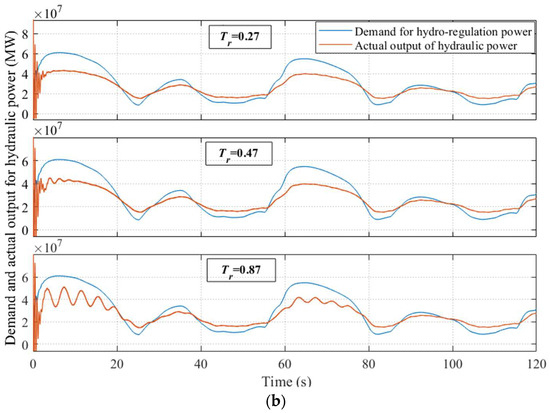
Figure 14.
Complementary characteristics of the hybrid system as Tr changes. (a) Hydraulic frequency with Tr = 0.27, 0.47, and 0.87. (b) Demand and actual output for hydraulic power with Tr = 0.27, 0.47, and 0.87.
Figure 10 shows the difference in the demand and actual output for hydraulic power with the PID control parameters Kp, Ki, and Kd. The power difference decreases slightly and then increases with the increase in Kp, and it reaches the minimum power difference at Kp = 0.2. The power difference grows as Kd increases, and it gradually decreases as Ki increases. This means that the complementarity of the hybrid power system is enhanced when properly increasing Ki and decreasing Kd and Kp. Compared with these three control parameters, the parameter Ki has the greatest influence on the complementary characteristics, while the parameter Kp has the lowest influence on the complementarity.Moreover, Appendix C describes the contradictions in the choice of control parameters.
In Figure 11, there are similar variation trends for the differences in demand and actual output for hydraulic power under different hydraulic parameters, and all power differences demonstrate increase trends with the changes in the head loss coefficient fp, relative value of on-load flow of hydro-turbine qnl, and elastic water-hammer time constant Tr. This reveals that properly decreasing the hydraulic parameters of fp, Tr, and qnl can improve the system stability. It is noticed that the variations in qnl and Tr have significant influences on the complementarity in comparison with the parameter setting of fp. Correspondingly, the regulation capacity of the system is able to increase 9 MW if the parameters of qnl and Tr are properly set.
Figure 12 shows the difference in the demand and actual output for hydraulic power with the electrical parameters xd and xq. The power difference first decrease and then increase as the parameter xd gradually increases, reaching the minimum at xd = 0.8. Differently, the power difference continuously decreases as the parameter xq gradually increases. Compared to the parameter xd, the parameter xq has relatively greater impacts on the complementary characteristics of the hybrid system.
When comparing all of the selected system parameters, it is found that the hydraulic parameters have the greatest influence on the complementary characteristics as compared to the parameters from the control and electrical subsystems. The hydraulic parameters qnl and Tr have the greatest influences among all system parameters. For this reason, Figure 13 and Figure 14 are plotted to further study the change rule of the hydraulic parameters qnl and Tr.
In Figure 13a, the output of hydraulic power obviously increases when the parameter qnl decreases from 0.4 to 0.1. Owing to the increase in hydraulic power, the gap in the demand for hydro-regulation power reduces, as shown in Figure 13b. When parameter qnl = 0.4, the hydro-regulation power cannot meet the demand of stable operation during the whole regulation time. In contrast, the actual hydraulic power exceeds the demand during 70% of the regulation time. It is worth noting that a slight vibration occurs in the hydropower generation unit during the initial operating time due to the decrease in parameter qnl, but such a vibration cannot influence the total trend of power complementation.
In Figure 14a, the variation in parameter Tr mainly influences the fluctuation of the output of hydraulic power. When the parameter Tr increases from 0.27 to 0.87, the fluctuation in hydraulic power not only becomes large, but its fluctuating time also lasts for a long period. In this state, the hydropower system generates a relatively large vibration, which threatens the stability of the system. In Figure 14b, it is clear that the difference changes between the demand and actual power due to the occurrence of a large fluctuation in terms of the hydraulic power. Moreover, the hybrid power system has an excellent complementary characteristic at Tr = 0.27, since the actual hydraulic power can roughly meet the demand for hydro-regulation power. Simultaneously, no vibration occurs in the hydropower system under this condition.
6. Conclusions and Discussion
To improve the operating performance of the hydro–wind hybrid power system, this work investigates the complementary characteristics between those different energy sources and also utilizes the optimization of the typical system parameters of the hydropower system to reduce the gap in power demand. These analyses are carried out based on an established simulation model of the hybrid power system that considers the hydraulic–mechanical–electrical coupling characteristics of the hydropower system and the interaction between hydraulic power and wind power. The complementary characteristics are reflected by the model outputs in the timescale of seconds, like the hydro-regulation power, the wind power, and the hydraulic frequency. By summarizing the laws of complementarity, the investigation of parameter settings is applied to the most significant power shortage scenario to maximize the use of the hydropower capacity. The main findings are performed as follows:
- Complementary characteristics: The utilization rate of the installed capacity for a hydropower generation unit approaches 95% under the low wind speed operating scenario, although the total power from the hybrid system is far below the power demand. As a result, there is little capacity space for improvement under the low wind speed in comparison with the operating scenarios in both the medium and high wind speeds.
- Enhanced system performance: The complementary characteristics of the hybrid power system are closely related to the typical system parameters of the hydropower system, especially for the hydraulic parameters, such as the on-load flow of hydro-turbine and the elastic water-hammer time constant. The proper setting of such hydraulic parameters can increase the regulating capacity by nearly 9 MW.
- Suggestions for parameter setting: The hybrid power system shows an excellent complementary performance and also maintains stable operation when the typical system parameters (Kp, Ki, Kd, fp, Tr, qnl, xd, and xq) are appropriately set at the values of (2, 12, 0.1, 0.002, 0.27, 0.1, 0.8, 1), respectively.
This work focuses on studying typical system parameters related to the control, hydraulic, and electrical subsystems. The operators in the hydropower station generally change these typical system parameters to achieve a stabler and safer system. However, except for the selected typical system parameters, the dynamic performances of the system are also related to other residual system parameters, such as the characteristic coefficient of the pipe and the inertia time constant of the generator. As such, future work will involve the most of the system parameters to better investigate the effect of coupling characteristics of multiple subsystems in a hydropower system on the hybrid power system. Modern intelligent algorithms, such as deep neural networks [34,35], may be used to find the sensitive parameters to ensure the stable operation of the hybrid power system. Meanwhile, some advanced correlational analysis methods, like information entropy [36] and regression analysis [37], may be employed to investigate the coupling relationship among the system parameters.
Author Contributions
Conceptualization, H.J. and H.L.; Data curation, H.L., Z.Z., and W.S.; Formal analysis, H.J., Z.Z., and W.S.; Funding acquisition, H.L.; Investigation, H.J. and H.L.; Methodology, H.J. and H.L.; Project administration, H.L.; Resources, H.L., Z.Z., and W.S.; Software, H.J.; Supervision, H.L.; Validation, H.J., H.L., Z.Z., and W.S.; Visualization, Z.Z. and W.S.; Writing—original draft, H.J. and H.L.; Writing—review and editing, H.J., H.L., Z.Z., and W.S. All authors have read and agreed to the published version of the manuscript.
Funding
This work was supported by the National Natural Science Foundation of China (No. 52309110), the China Postdoctoral Science Foundation (No. 2023M740363), and the Natural Science Basis Research Plan in Shaanxi Province of China (No. 2023-JC-QN-0388).
Data Availability Statement
Data are contained within the article.
Conflicts of Interest
Author Zhiwang Zhang was employed by the company Yalong River Hydropower Development Company, Ltd. Author Weihua Sun was employed by the company State Grid Integrated Energy Service Group Company, Ltd. The remaining authors declare that the research was conducted in the absence of any commercial or financial relationships that could be construed as a potential conflict of interest.
Nomenclature
| A | sweep area |
| bp | coefficient of the permanent state difference |
| Cp | power coefficient |
| Dsh | damping coefficient |
| Eq | the q-axis transient electromotive force |
| Ef | excitation voltage |
| fp | head loss coefficient |
| H | inertia time constant of the wind turbine |
| hω | characteristic coefficient of the pipe |
| Id | d-axis currents |
| idg | d-axis current on the grid-side |
| idg-ref | reference value of the d-axis current on the grid-side |
| idr | rotor d-axis current |
| idr_ref | current reference value of the d-axis rotor |
| Iq | q-axis currents |
| iqr | rotor q-axis current |
| iqr_ref | current reference value of the q-axis rotor |
| iqg | q-axis current on the grid-side |
| iqg_ref | reference value of the q-axis current on the grid-side |
| Kd | differential adjustment coefficient |
| Ki | integral adjustment coefficient |
| Ki1 | integration coefficient of the active power control |
| Ki2 | integration coefficient of rotor side current control |
| Ki3 | integration coefficient of the voltage control |
| Ki4 | integral coefficient of the capacitor voltage controller |
| Ki5 | integration coefficient of the grid-side current controller |
| Kp | proportional adjustment coefficient |
| Kp1 | proportional coefficient of the active power control |
| Kp2 | proportional coefficient |
| Kp3 | proportional coefficient of the voltage control |
| Kp4 | proportional coefficient of the capacitor voltage controller |
| Kp5 | proportional coefficient of the grid-side current controller |
| Ksh | strength coefficient of the drive shaft |
| Lm | winding mutual inductance of rotor and stator |
| Lrr | rotor winding inductance of rotor and stator |
| me | electromagnetic torque |
| output power of ith wind turbine at time t | |
| Pref | reference value of the active power |
| Ps | active power of the generator |
| q0 | relative value of the flow in the initial operating condition |
| Tab | inertia time constant |
| Td0 | d-axis transient time constant |
| Tm | input torque of the rotor |
| Tr | elastic water-hammer time constant |
| Tsh | mechanical torque of the drive shaft |
| Twm | input mechanical torque |
| udc | capacitor voltage |
| udc_ref | reference value of the capacitor voltage |
| udg | target values of the output voltage with respect to the d axes |
| udr | target values of the rotor-side converter output voltage with respect to the d axes |
| uqg | target values of the output voltage with respect to the q axes |
| uqr | target values of the rotor-side converter output voltage with respect to the q axes |
| us | stator voltage |
| us_ref | stator voltage reference value |
| wind speed flowing through the i wind turbine at time t | |
| ωt | wind speed at time t |
| ωr | rotor speed |
| Xd | d-axis reactances |
| Xq | q-axis reactances |
| XTg | transformer reactance connecting the converter and the grid |
| YP | proportional of the governor regulated outputs |
| YD | differential components of the governor regulated outputs |
| YI | integral of the governor regulated outputs |
| δ | rotor angle |
| θtw | twist angle of the drive shaft |
| ρ | air density |
Appendix A. Comparison between the Models and Complementary Results
To verify the results obtained by the established hybrid system, a universal model expressed by the transfer coefficients [28,38] is adopted to compare the complementary characteristics. Similarly, the installed capacities of the hydropower and wind power are 60 MW and 84 MW, respectively, and the medium wind speed condition is selected. The simulation results include the power complementarity and the hydraulic frequency, as shown in Figure A1 and Figure A2.

Figure A1.
Established model: the fluctuation in hydraulic frequency and the complementarity of the output power.

Figure A2.
Comparative model: the fluctuation in hydraulic frequency and complementarity of the output power.
From Figure A1 and Figure A2, the variation trend of wind power and hydraulic power of the established model is similar to the comparative model, and the fluctuation of hydraulic frequency is largely less than the acceptable range of ±0.5 Hz, which indicates the reliability of the established model. Compared with the comparative model, the hydraulic power in the established model has a more significant regulating effect on the fluctuations of wind power, indicating that the hydropower unit is more sensitive to the stochastic change in wind power.
Appendix B. Model Comparison from the Perspective of Power Loss
Based on the established model and comparative model described in Appendix A, a comparison between the power losses is shown in Figure A3.
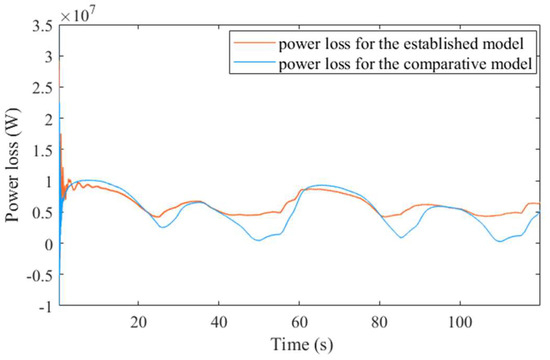
Figure A3.
Power loss comparison between the established model and the comparative model. The power loss is the difference between the generator-side power generation and the grid-side power consumption.
As shown in Figure A3, the average power loss for the established model is 6 MW, which is slightly more than the average level for the comparative model (i.e., roughly 5 MW). However, the variation in the power loss for the comparative model is significantly larger than that for the established model as the operating time changes, indicating that the output power of the hybrid system may have larger fluctuations than the comparative model. As such, the established model is reliable from the perspective of power loss.
Appendix C. Descriptions of the Emerging Limitations of the Control Parameters and the Contradictions in Their Choice
In this work, the PID controller maintains system stability by tracking and adjusting the frequency, and the detailed mechanism is shown in Figure A4. The control parameters are studied based on the recommended ranges in references [23,25,33], i.e., Kp = (0.1, 12), Ki = (0.1, 12), and Kd = (0.1, 8). Figure A5a,b are plotted to explain the emerging limitations of control parameters and the contradictions in their choice in the recommended ranges and expanded ranges. The expanded ranges of control parameters are Kp = (0.1, 700), Ki = (0.1, 700), and Kd = (0.1, 450), which are used to deeply investigate the stability of the system.

Figure A4.
Diagram of the mechanism of PID control.
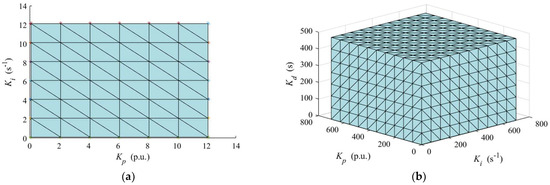
Figure A5.
The stable ranges of control parameters and the contradictions in their choice in the recommended ranges and expanded ranges. (a) Control parameters in the recommended ranges. (b) Control parameters in the expanded ranges.
As shown in Figure A5a, the power system is always stable when the three control parameters are set to any value in the recommended ranges. Note that the differential adjustment coefficient Kd is involved in the adjusting process but is not shown in Figure A5a due to its minimal effect on the stability. Similarly, the system also remains stable under the studied expanded ranges of control parameters, as shown in Figure A5b. This is because the frequency fluctuation allows a wide acceptable range of ±0.5 Hz for small power grids. The studied hybrid power system belongs to a small grid that has total installed capacities of 144 MW. In the future work, the emerging limitations of control parameters for the large power grid will continue to be studied, since the acceptable range of frequency fluctuations is relatively small, i.e., ±0.2 Hz.
References
- Zhu, F.L.; Zhong, P.A.; Xu, B.; Liu, W.F.; Wang, W.Z.; Sun, Y.M.; Chen, J.; Li, J.Y. Short-term stochastic optimization of a hydro-wind-photovoltaic hybrid system under multiple uncertainties. Energy Convers. Manag. 2020, 214, 112902. [Google Scholar] [CrossRef]
- Salem, S.; Rabeh, A.; Wafa, B.H.; Souad, C. Solar photovoltaic energy system-based shunt active filter for electrical energy quality improvement. Int. J. Simul. Process Model. (IJSPM) 2016, 11, 119–126. [Google Scholar]
- Li, F.G.; Chen, S.J.; Ju, C.Q.; Zhang, X.S.; Ma, G.W.; Huang, W.B. Research on short-term joint optimization scheduling strategy for hydro-wind-solar hybrid systems considering uncertainty in renewable energy generation. Energy Strateg. Rev. 2023, 50, 101242. [Google Scholar] [CrossRef]
- Topalovic, Z.; Haas, R. Role of Renewables in Energy Storage Economic Viability in the Western Balkans. Energies 2024, 17, 955. [Google Scholar] [CrossRef]
- Xie, T.T.; Zhang, C.B.; Wang, T.T.; Cao, W.Z.; Shen, C.H.; Wen, X.K.; Mao, C. Optimization and service lifetime prediction of hydro-wind power complementary system. J. Clean. Prod. 2021, 291, 125983. [Google Scholar] [CrossRef]
- Saidi, S.; Abbassi, R.; Amor, N.; Chebbi, S. Passivity-based direct power control of shunt active filter under distorted grid voltage conditions. Automatika 2016, 57, 361–371. [Google Scholar] [CrossRef]
- Saidi, S.; Chebbi, S.; Jouini, H. Harmonic and reactive power compensations by shunt active filter controlled by adaptive fuzzy logic. Int. Rev. Model. Simul. (IREMOS) 2011, 4, 1487–1492. [Google Scholar]
- Ding, Z.Y.; Wen, X.; Tan, Q.F.; Yang, T.T.; Fang, G.H.; Lei, X.H.; Zhang, Y.; Wang, H. A forecast-driven decision-making model for long-term operation of a hydro-wind-photovoltaic hybrid system. Appl. Energy 2021, 291, 116820. [Google Scholar] [CrossRef]
- Xiong, H.L.; Egusquiza, M.; Ostergaard, P.A.; Perez-Diaz, J.I.; Sun, G.X.; Egusquiza, E.; Patelli, E.; Xu, B.B.; Duan, H.J.; Chen, D.Y.; et al. Multi-objective optimization of a hydro-wind-photovoltaic power complementary plant with a vibration avoidance strategy. Appl. Energy 2021, 301, 117459. [Google Scholar] [CrossRef]
- Xiong, H.L.; Xu, B.B.; Kheav, K.; Luo, X.Q.; Zhang, X.J.; Patelli, E.; Guo, P.C.; Chen, D.Y. Multiscale power fluctuation evaluation of a hydro-wind-photovoltaic system. Renew. Energy 2021, 175, 153–166. [Google Scholar] [CrossRef]
- Wang, H.; Liao, S.L.; Liu, B.X.; Zhao, H.Y.; Ma, X.Y.; Zhou, B.B. Long-term complementary scheduling model of hydro-wind-solar under extreme drought weather conditions using an improved time-varying hedging rule. Energy 2024, 305, 132285. [Google Scholar] [CrossRef]
- Liu, B.X.; Liu, T.Y.; Liao, S.L.; Lu, J.; Cheng, C.T. Short-term coordinated hybrid hydro-wind-solar optimal scheduling model considering multistage section restrictions. Renew. Energy 2023, 217, 119160. [Google Scholar] [CrossRef]
- Zhou, S.Y.; Han, Y.; Zalhaf, A.S.; Chen, S.H.; Zhou, T.; Yang, P.; Elboshy, B. A novel multi-objective scheduling model for grid-connected hydro-wind-PV-battery complementary system under extreme weather: A case study of Sichuan, China. Renew. Energy 2023, 212, 818–833. [Google Scholar] [CrossRef]
- Sukah, T.; Saad, M.; Mougharbel, I. Long-term optimal coordination of hydro-wind-thermal energy generation using stochastic dynamic programming. Int. J. Green Energy 2024, 7, 1536–1549. [Google Scholar] [CrossRef]
- Lin, M.K.; Shen, J.J.; Cheng, C.T.; Lu, Q.; Wang, Y.Q. Long-term multi-objective optimal scheduling for large cascaded hydro-wind-photovoltaic complementary systems considering short-term peak-shaving demands. Energy Convers. Manag. 2024, 301, 118063. [Google Scholar] [CrossRef]
- He, Y.Y.; Hong, X.Y.; Wang, C.; Qin, H. Optimal capacity configuration of the hydro-wind-photovoltaic complementary system considering cascade reservoir connection. Appl. Energy 2023, 352, 121927. [Google Scholar] [CrossRef]
- Guo, Y.; Ming, B.; Huang, Q.; Liu, P.; Wang, Y.M.; Fang, W.; Zhang, W. Evaluating effects of battery storage on day-ahead generation scheduling of large hydro-wind-photovoltaic complementary systems. Appl. Energy 2022, 324, 119781. [Google Scholar] [CrossRef]
- Wang, J.; Zhao, Z.P.; Zhou, J.L.; Cheng, C.T.; Su, H.Y. Developing operating rules for a hydro-wind-solar hybrid system considering peak-shaving demands. Appl. Energy 2024, 360, 122762. [Google Scholar] [CrossRef]
- Jiang, W.Y.; Liu, Y.Q.; Fang, G.H.; Ding, Z.Y. Research on short-term optimal scheduling of hydro-wind-solar multi-energy power system based on deep reinforcement learning. J. Clean. Prod. 2023, 385, 135704. [Google Scholar] [CrossRef]
- Shi, Y.H.; Wang, H.L.; Li, C.J.; Negnevitsky, M.; Wang, X.L. Stochastic optimization of system configurations and operation of hybrid cascade hydro-wind-photovoltaic with battery for uncertain medium- and long-term load growth. Appl. Energy 2024, 364, 123127. [Google Scholar] [CrossRef]
- Kumar, V.; Sharma, V.; Naresh, R. Leader Harris Hawks algorithm based optimal controller for automatic generation control in PV-hydro-wind integrated power network. Electr. Power Syst. Res. 2023, 214, 108924. [Google Scholar] [CrossRef]
- Li, H.H.; Mahmud, M.A.; Arzaghi, E.; Abbassi, R.; Chen, D.Y.; Xu, B.B. Assessments of economic benefits for hydro-wind power systems: Development of advanced model and quantitative method for reducing the power wastage. J. Clean. Prod. 2020, 277, 123823. [Google Scholar] [CrossRef]
- IEEE Group. Hydraulic turbine and turbine control models for system dynamic studies. IEEE Trans. Power Syst. 1992, 7, 167–179. [Google Scholar] [CrossRef]
- Nicolet, C.; Greiveldinger, B.; Herou, J.; Kawkabani, B.; Allenbach, P.; Simond, J.J. High-order modeling of hydraulic power plant in islanded power network. IEEE Trans. Power Syst. 2007, 22, 1870–1880. [Google Scholar] [CrossRef]
- Zeng, Y.; Guo, Y.K.; Zhang, L.X.; Xu, T.M.; Dong, H.K. Nonlinear hydro turbine model having a surge tank. Math. Comput. Model. Dyn. Syst. 2013, 1, 12–28. [Google Scholar] [CrossRef]
- Wang, F.F.; Zeng, Y.; Qian, J. Nonlinear modelling and design of synergetic controllers for single penstock multi-machine hydropower system. Electr. Power Syst. Res. 2024, 234, 110584. [Google Scholar] [CrossRef]
- Zhang, T.Y.; Chen, D.Y.; Liu, J.; Xu, B.B.; Venkateshkumar, M. A Feasibility Analysis of Controlling a Hybrid Power System over Short Time Intervals. Energies 2020, 21, 5682. [Google Scholar] [CrossRef]
- Lu, X.D.; Li, C.S.; Liu, D.; Wang, H.; Zhu, Z.W.; Ta, X.; Xu, R.L. Correlating analysis and optimization between hydropower system parameters and multi-frequency oscillation characteristics. Energy 2024, 304, 131789. [Google Scholar] [CrossRef]
- Dosoglu, M.K. Nonlinear dynamic modeling for fault ride-through capability of DFIG-based wind farm. Nonlinear Dyn. 2017, 4, 2683–2694. [Google Scholar] [CrossRef]
- Shah, N.N.; Joshi, S.R. Modal analysis for selection of DFIG-based wind farms for damping and reduction of the risk of SSR. IET Energy Syst. Integr. 2019, 4, 252–268. [Google Scholar] [CrossRef]
- Li, S.H.; Zhang, H.; Yan, Y.S.; Ren, J.F. Parameter Optimization to Power Oscillation Damper (POD) Considering its Impact on the DFIG. IEEE Trans. Power Syst. 2022, 2, 1508–1518. [Google Scholar] [CrossRef]
- Measurement and Instrumentation Data Center (MIDC). Available online: https://midcdmz.nrel.gov/apps/day.pl?NWTC (accessed on 1 December 2023).
- Ling, D.J. Bifurcation and Chaos of Hydraulic Turbine Governor. Ph.D. Thesis, Hohai University, Nanjing, China, 2007. Available online: http://www.wanfangdata.com.cn/details/detail.do?_type=degree&id=Y1241732 (accessed on 1 January 2024).
- Pan, H.; Yang, J.; Yu, Y.; Zheng, Y.; Zheng, X.N.; Hang, C.Y. Intelligent Low-Consumption Optimization Strategies: Economic Operation of Hydropower Stations Based on Improved LSTM and Random Forest Machine Learning Algorithm. Mathematics 2024, 12, 1292. [Google Scholar] [CrossRef]
- Zhong, Z.W.; Zhu, L.K.; Fu, W.L.; Qin, J.F.; Zhao, M.Z.; Rixi, A. Parallel Disassembly Sequence Planning Using a Discrete Whale Optimization Algorithm for Equipment Maintenance in Hydropower Station. Processes 2024, 12, 1412. [Google Scholar] [CrossRef]
- Zhang, J.W.; Li, Z.Y.; Huang, J.L.; Cheng, M.R.; Li, H.K. Study on Vibration-Transmission-Path Identification Method for Hydropower Houses Based on CEEMDAN-SVD-TE. Appl. Energy 2022, 12, 7455. [Google Scholar] [CrossRef]
- Liu, T.; Kong, F.; Yang, L.F.; Guo, Z.Z. Operational risk assessment of hydropower units based on PSSCA-VMD-CNN-GBiLSTM and multi-feature fusion. Comput. Electr. Eng. 2024, 118, 109412. [Google Scholar] [CrossRef]
- Guo, W.C.; Qu, F.L. Stability control of dynamic system of hydropower plant with two turbine units sharing a super long headrace tunnel. J. Frankl. Inst.-Eng. Appl. Math. 2021, 358, 8506–8533. [Google Scholar] [CrossRef]
Disclaimer/Publisher’s Note: The statements, opinions and data contained in all publications are solely those of the individual author(s) and contributor(s) and not of MDPI and/or the editor(s). MDPI and/or the editor(s) disclaim responsibility for any injury to people or property resulting from any ideas, methods, instructions or products referred to in the content. |
© 2024 by the authors. Licensee MDPI, Basel, Switzerland. This article is an open access article distributed under the terms and conditions of the Creative Commons Attribution (CC BY) license (https://creativecommons.org/licenses/by/4.0/).