Abstract
Pipeline leakage, which leads to water wastage, financial losses, and contamination, is a significant challenge in urban water supply networks. Leak detection and prediction is urgent to secure the safety of the water supply system. Relaying on deep learning artificial neural networks and a specific optimization algorithm, an intelligential detection approach in identifying the pipeline leaks is proposed. A hydraulic model is initially constructed on the simplified Net2 benchmark pipe network. The District Metering Area (DMA) algorithm and the Cuckoo Search (CS) algorithm are integrated as the DMA-CS algorithm, which is employed for the hydraulic model optimization. Attributing to the suspected leak area identification and the exact leak location, the DMA-CS algorithm possess higher accuracy for pipeline leakage (97.43%) than that of the DMA algorithm (92.67%). The identification pattern of leakage nodes is correlated to the maximum number of leakage points set with the participation of the DMA-CS algorithm, which provide a more accurate pathway for identifying and predicting the specific pipeline leaks.
1. Introduction
Water distribution networks are essential infrastructure systems that ensure the delivery of clean and safe water to households, industries, and agricultural sectors. Their integrity and efficiency are paramount for sustaining urban development and environmental conservation. However, a persistent challenge in water distribution management is the occurrence of leaks within pipelines, resulting in significant water loss, elevated operational costs, and potential health risks [,]. Globally, billions of cubic meters of water are wasted annually, accounting for approximately 5% to 50% of the water distribution networks’ (WDNs) supply [,]. In China, according to the China Urban–Rural Construction Statistical Yearbook (2021), the total urban public water supply amounts to 67,334 million m3, with a leakage of 8040 million m3, yielding a comprehensive leakage rate of 11.94% []. These leaks are attributed to both internal factors, such as pipe quality, construction practices, installation duration, and water system management [,], and external factors, predominantly environmental, like temperature variations. Consequently, driven by the dual objectives of urban development and environmental sustainability, the research and optimization of methods for locating urban WDN leaks have introduced new opportunities and challenges [].
Currently, leakage localization methods primarily encompass device-based inspections and data-driven algorithms []. One the one hand, device-based manual monitoring methods, including traditional acoustic leak detection [], smart ball detection [], radar detection [], and fiber optic sensing [], are effective but constrained by limitations such as restricted detection range, high labor and economic costs, and low accuracy in leak localization []. Traditional acoustic leak detection relies on sound propagation to identify leaks, but its effectiveness decreases with distance and noise interference. Smart ball detection involves deploying a sensor-equipped ball within the pipeline to detect leaks, but it is labor-intensive and costly. Radar detection and fiber optic sensing offer advanced capabilities but are similarly limited by high costs and detection range issues. On the other hand, data-driven algorithms for leakage localization have attracted more attention in the past decade. Particularly among various data-driven algorithms, the District Metered Area (DMA) algorithm, proposed by the UK Water Industry Association (WIA), holds a fundamental position and has been globally adopted for leak control in water supply networks, transitioning from passive leak detection to proactive management. The principle of the DMA algorithm is based on spatio-temporal feature similarity. It aggregates pipe network nodes with similar pressure volatility into leakage identification regions []. These regions are then analyzed to extract spatio-temporal features, optimizing the deployment of pressure monitoring points and accurately pinpointing leakage locations.
Recent advancements in sensor technology and data analytics have significantly enhanced the capability of DMAs in detecting and localizing leaks. High-resolution pressure and flow sensors, combined with sophisticated data analysis algorithms, enable the identification of subtle changes in water consumption patterns that may indicate the presence of leaks. For instance, Kapelan et al. introduced a hybrid genetic algorithm (HGA) [] transient model for leakage detection, while Haghighi and Covas developed Backward ITA [] for leakage identification. Guan et al. discussed the pressure-driven background leakage model [] and its application in multi-population genetic algorithms for leakage localization, highlighting its practical applicability. Palau et al. studied data-driven methods for leakage detection and localization in single-entry DMA incidents [], improving the fitting accuracy of flow or pressure data at DMA zone entry points. However, the data-driven methods for leakage location suffer from issues such as insufficient accuracy and limited generalization effectiveness. Consequently, numerous scholars have introduced artificial intelligence (AI) techniques as auxiliary tools in its relative fields. For instance, integrating machine learning algorithms has been employed to enhance the model’s ability to recognize complex data patterns [,], or leveraging deep learning frameworks to automatically extract features and optimize positioning precision. However, despite these methods contributing to some advancements in leakage location technology, they still grapple with challenges like low positioning accuracy, low model generalization ability when dealing with large-scale datasets, and intricate pipe network structures, where the limitations of traditional approaches become more pronounced [,,,,,].
The complexity of water distribution networks is significantly aggravated with the urbanization process of China, and variability of specific water distribution networks is remarkable between distinct cities. To date, a variety of methods have been proposed to overcome this question, and some of them have been employed in actual engineering (detailed in Table 1). However, heavy labor force requirements and longtime response durations have hindered real-time detection. Leakage identification and detection established on an AI technique (ANN model and optimization algorithm) is a potential method to meet the request of the management of water distribution networks. After extensive investigation and research, we have created and discovered that the combination of the Cuckoo Search method and DMA method, as an emerging heuristic search algorithm, demonstrates novelty and reliability in search and location tasks.

Table 1.
Pipe network leakage localization results based on DMA-CS algorithm.
Pressure management within DMAs is a crucial strategy for reducing leak occurrence and severity [,,]. By optimizing pressure settings in different areas, water utilities can minimize pipe stress and reduce the likelihood of leaks. Advanced pressure control valves and real-time monitoring systems are employed to maintain optimal pressure levels. The UK’s efforts over the past 20 years have reduced the leakage rate of water supplies from 25.9% to less than 19%, and this approach has been replicated globally. For instance, in the Pudong district of Shanghai (China), the water supply network is divided into 34 zones and managed through stringent water balance systems. This division has led to a significant reduction in the discrepancy between water production and consumption by the water supply company, exemplifying the effectiveness of DMA-based management. These advancements underscore the importance of combining innovative sensor technologies with robust data-driven algorithms to enhance leak detection and localization in urban water supply networks. Furthermore, the Cuckoo Search (CS) algorithm, inspired by the brood parasitism behavior of some cuckoo species, is a nature-inspired metaheuristic optimization algorithm and has shown potential to enhance leak detection accuracy by optimizing the search process for the best leak detection strategies. Proposed by Yang and Deb in 2009, the CS algorithm utilizes Lévy flights, a random walk characterized by a series of straight-line moves punctuated by sudden turns, to explore the solution space efficiently. This algorithm mimics the parasitic behavior of cuckoos laying their eggs in the nests of other host birds, leading to the survival of the best solutions through natural selection mechanisms. Moreover, the CS algorithm is particularly effective in solving complex optimization problems due to its simplicity and robust search capabilities [,]. In addition to DMA methodologies, the application of the Cuckoo Search (CS) algorithm represents a significant advancement in leak detection. By integrating the CS algorithm with the DMA approach, the combined DMA-CS method leverages the strengths of both strategies, leading to improved detection accuracy and efficiency. This integration allows for the precise localization of leaks, even in complex and large-scale water distribution systems, offering a significant improvement over traditional leak detection methods. However, this combination is rarely utilized for pipeline leakage identification and prediction.
Leakage localization established on the ANN model is a novel pathway in realizing real-time prediction and detection for the management of water distribution networks. However, the process and the optimization algorithms used to realize the intelligent pipeline leakage detection are rarely reported. To overcome the bottleneck, Principal Component Analysis (PCA) is first employed to extract the feature vectors from pressure fluctuation sequences, and the Cuckoo Search (CS) algorithm is configured. Furthermore, the effectiveness of District Metered Area (DMA) partitioning via clustering is assessed using the Silhouette Coefficient (SC), the Calinski–Harabasz (CH) Index, and the Davies–Bouldin Index (DBI). Lastly, the leak localization effectiveness of the DMA-CS algorithm is compared with the traditional DMA algorithm, and the importance of optimal pressure monitoring point placement and density is certified.
2. Methods and Methodological Framework
2.1. Study Area and Basic Information
The Net2 benchmark pipe network model was utilized to obtain the experimental data necessary for the analysis. Specifically, the Net2 model provided comprehensive operational data, including hourly water demand, total head, pressure, fluoride levels, and elevation for each node within the network over a 55 h period. Based on these data, the pipe network topology was meticulously constructed for further analysis.
The topology and evaluation of the Net2 Network are illustrated in Figure 1, which shows an integration of both dendritic and ring-like systems. The network was designed to feature a primary reservoir as the main water supply source, with water distributed to various nodes through a well-defined pumping mechanism. A specific pipe section, identified as pipe Section 29 (denoted in Figure 1a), directs water flow towards a storage tank, serving as a notable aspect of this design. In the schematic representation, all components are distinctly labeled with unique IDs, clearly delineating the relationships between the primary pipe network and its subsidiary branches. Detailed attributes of these nodes, as well as their specific roles within the network, are provided in Appendix A-1, while the characteristics of the individual pipe sections are enumerated in Appendix A-2.
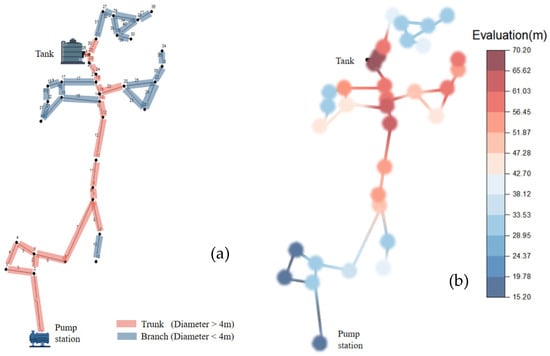
Figure 1.
Net2 pipe network basic information. (a) Topology of the pipe network system; (b) evaluation of the pipe network system.
The overall efficiency of the system is further elevated by several key elements. For instance, the pump associated with pipe Section 1 operates with a conveyance efficiency of 75%. Additionally, the storage tank, labeled as node 26, stands out due to its substantial size, with a diameter of 17.4 m, an initial water level of 19.73 m, and a maximum water level reaching 24.36 m.
Building on this detailed network setup, the DMA-CS algorithm was developed, a sophisticated leakage localization model that combines the District Metered Area (DMA) method with the Cuckoo Search (CS) algorithm. This hybrid model is designed to divide the water supply network into multiple zones for more effective monitoring and management. By simulating Cuckoo Search behavior, the algorithm strategically locates potential leakage points which enhancing the accuracy and effectiveness of leak detection within the network significantly. The methodological framework underscores the innovative integration of data-driven analysis and optimization algorithms to address the critical challenge of leakage detection in urban water supply systems.
2.2. DMA-CS Model Framework
To emphasize the precise localization of leaks, an advanced framework for leak detection in water supply networks was used to utilize the DMA-CS strategy. The methodology begins with the comprehensive acquisition of pertinent data from the water pipeline network, which provides a robust foundation for the analytical processes that follow. To enhance computational efficiency, the complexity of the network is then systematically reduced to ensure the rigorous and manageable analysis process. Based on these preparatory steps, a detailed examination of the network is conducted. The initial phase of leak site identification employs a series of sophisticated analytical techniques, including the elbow method, Principal Component Analysis (PCA), and k-means clustering. These methods are integral to the partitioning of the network into District Metered Areas (DMAs), with the elbow method being particularly instrumental in determining the optimal number of clusters through a meticulous assessment of data characteristics.
To further refine the accuracy of leak localization, the Cuckoo Search algorithm is employed, incorporating advanced techniques such as “Random Walk” and “Levy Flight”. This integration enables a more granular and precise segmentation of potential leakage points, ultimately facilitating the accurate determination of leak locations. This methodological approach is designed to significantly enhance both the efficiency and precision of leak detection in water supply networks. The model framework is illustrated in Figure 2.
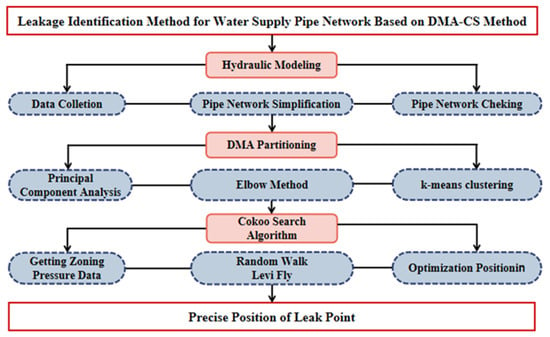
Figure 2.
Framework of DMA-CS model.
2.2.1. Hydraulic Modeling
The development of an accurate hydraulic model is crucial for the effective digital management of water supply systems. To optimize system performance, pipes that have minimal impact on hydraulic accuracy are excluded from the model. The calibration process involves precise adjustments to the distribution of water flow across nodes, along with manual fine-tuning of the pipe roughness coefficients to ensure model accuracy.
Given the complexity of the original Net2 Network, a simplification process was conducted to make the analysis more tractable and focused on key components relevant to leak detection. This simplification involved reducing the number of nodes and pipe sections in the model by removing elements that contributed minimally to the hydraulic performance or had a negligible impact on the system dynamics. By streamlining the network, critical areas that leaks were most likely to occur are focused on; thus, the accuracy of the leak detection algorithm without compromising the integrity of the network’s overall representation is enhanced.
Figure 3 illustrates the simplified topology of the Net2 benchmark network, which comprises 31 nodes and 36 pipes, with node 16 designated as the leakage node. The numbers in the figure indicate the node sequence number. Pressure monitoring points are strategically placed at critical nodes along the trunk pipes to capture essential data. Following the establishment of this topology, hydraulic simulations of the water supply network were conducted using the EPANET 2.0 software [,,] under both normal and leakage conditions. The direction of water flow within the pipes is indicated by arrows, and the pressure data recorded at the monitoring points are comprehensively documented in Appendix B.
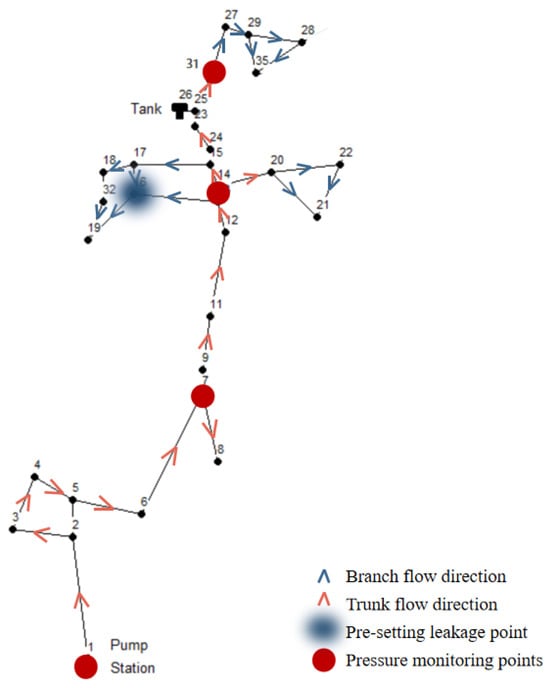
Figure 3.
Simplification of the Net2 benchmark pipe network system.
The pressure fluctuation curves at four monitoring points under normal conditions are depicted in Figure 4. These fluctuations in the network follow a cyclical pattern that aligns with typical water consumption behaviors. In practice, residential water consumption remains relatively consistent over time, which is reflected in the pressure patterns observed across different nodes in the network [,,]. Unless there is a significant reconstruction of the network, these pressure fluctuations tend to exhibit stable and predictable patterns.
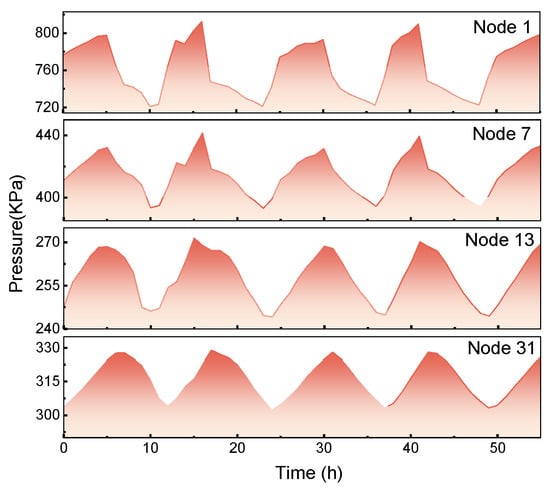
Figure 4.
Pressure fluctuation curve of the monitoring points.
Given the high sensitivity, real-time responsiveness, and accuracy of pipeline pressure data in the context of leak localization, this study primarily relies on pressure data to accurately identify the locations of leaks. Figure 5 illustrates the pressure fluctuations at adjacent nodes when a leakage coefficient of 0.2 is applied to node 16 in Network 2 using a time-delay mode. The results show that these adjacent nodes not only display similar pressure fluctuation patterns under normal conditions but also reveal a notable similarity in the pressure drop curves following a leakage event. As a result, nodes exhibiting analogous pressure fluctuation patterns can be regarded as forming the entire leak detection region, with the bubble size in the figure representing the pressure difference between normal and leakage conditions.
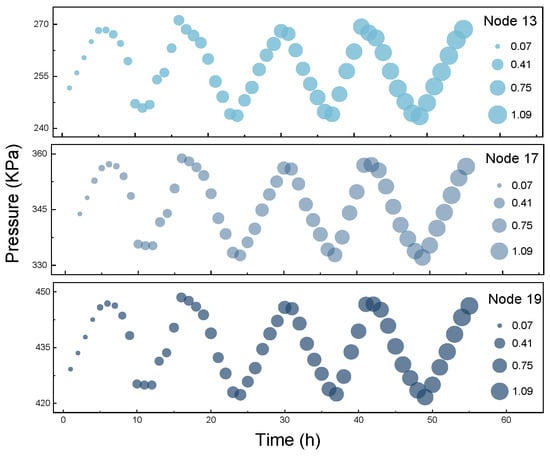
Figure 5.
Pressure fluctuations at surrounding nodes before and after the leakage.
2.2.2. DMA Partitioning
To extract meaningful features from pressure data collected at multiple stations within a metering zone, Principal Component Analysis (PCA) is utilized. PCA, an unsupervised learning technique, employs orthogonal projection to transform a set of linearly correlated observed variables into a new coordinate system. This transformation maximizes the variance of the data along the new coordinate axes, effectively reducing the dimensionality of the original variables while preserving essential information. Consider a random vector composed of p-dimensional variables, whose covariance matrix is defined as follows:
Due to the non-negative definiteness of the , it possesses non-negative eigenvalues, denoted as . These eigenvalues correspond to eigenvectors, represented as . Each eigenvector corresponds to a weight vector of a principal component, allowing for the construction of projected principal component vectors as
with representing the principal component. The formula for the cumulative variance contribution of the principal components is denoted as
where is the variance contribution rate of the principal component. To determine the optimal number of leakage area divisions, the elbow method (EM) is employed for the analysis. The core of the EM lies in the SSEs (sum of the squared errors), refs. [,] and its principle is as follows:
represents the pressure cluster, denotes the computed spatio-temporal eigenvalue of each pressure fluctuation sequence within , and is the centroid of (the mean of all samples in ). represents the clustering error of all samples, indicating the quality of clustering. With more clusters, sample partitioning becomes finer, enhancing intra-cluster aggregation. As a result, the value decreases with fewer points per cluster. Exceeding the true cluster count leads to a sharp drop in squared errors, indicating a rapid decline in regional aggregation. This forms an “elbow”-shaped relationship between squared errors and division count [].
Based on the previously determined number of clusters, k, the k-means algorithm is introduced to perform cluster analysis on the reduced data matrix. Initially, the data points are partitioned into k clusters, ensuring that each cluster represents a distinct group of similar data points as
Then, the distance from each sample to the center of mass is calculated and the sample is assigned to the nearest cluster as
The formula for updating the center of mass of each cluster to the average of the samples in the cluster is described as
Finally, it is only necessary to repeat the calculation steps of Formulas (6)–(8) until the center of mass no longer changes or the maximum number of iterations is reached.
2.2.3. CS Localization Algorithm Modeling
The Cuckoo Search (CS) algorithm is a metaheuristic optimization method inspired by the brood parasitism behavior of cuckoos []. The algorithm mimics the strategy of cuckoos laying their eggs in the nests of other bird species. These foreign eggs may either be detected and removed, or the entire nest may be abandoned and rebuilt. In the context of the CS algorithm, a detection probability (Pa) is employed to determine whether an inferior solution (represented by a “nest”) will be replaced. This approach ensures that only the most optimal solutions are retained []. The process of applying the CS algorithm to solve the leakage model in a pipe network is illustrated in Figure 6.
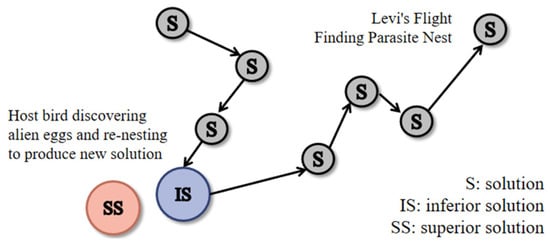
Figure 6.
Operating process of Cuckoo Search algorithm.
A Levy flight mechanism guides the search for nest locations. With few adjustable parameters, the nest position update formula is as follows:
represents the location of the cuckoo’s parasitic nest in the generation. It is an essential factor in updating the nest’s position and facilitating random wandering. represents the control step factor, while represents the search path for random wandering. The Levi’s flight mechanism is utilized to model the search process, and its formula is expressed as follows:
The Levi’s flight mechanism follows a Poisson distribution, enabling random wandering in the solution space. In the leakage detection scheme, partitioning the pipe network and generating new nest positions (solutions) enhance the algorithm’s optimization performance.
3. Results and Discussion
3.1. Net2 Pipe Network Partitioning by DMA
The Principal Component Analysis (PCA) algorithm was employed to extract feature vectors from the pressure fluctuation sequences of 36 nodes in the Net2 pipe network. The analysis indicates that two principal components were yielded: PC1, which accounted for 93.15% of the variance, and PC2, which accounted for 6.85%. Following this, the elbow method (EM) algorithm was applied to determine the optimal number of clusters for the data. For practical purposes, the data collected within 24 h after the leak event were selected for the clustering analysis.
A range of values for the cluster count k (from 1 to 6) were tested, and clustering was performed for each value of k. The relationship between the cluster count k and the sum of squared errors (SSEs) within clusters is depicted in Figure 7. The “elbow” point on the graph, which indicates a significant reduction in SSEs, identifies the optimal cluster count as k = 2 in this scenario.
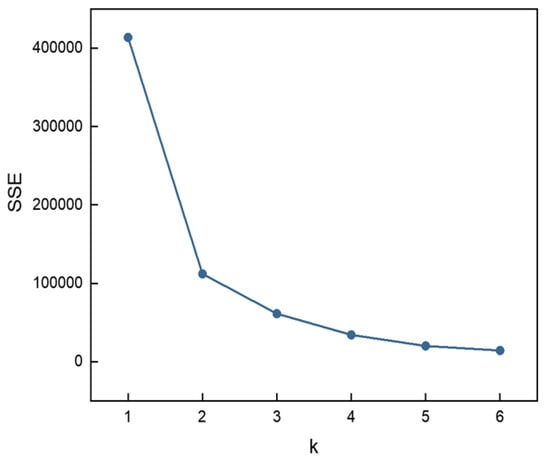
Figure 7.
The SSEs (sum of squared errors)-K curves obtained via the elbow method.
Figure 8 further illustrates the initial clustering results through a scatter plot, which uses data from the primary component variables PC1 and PC2. The plot reveals that the two clusters identified are approximately equal in frequency, demonstrating a balanced distribution of the nodes within the identified clusters. This analysis provides a clear and structured understanding of the network’s pressure data, which is crucial for accurate leak localization in the subsequent steps of the study.
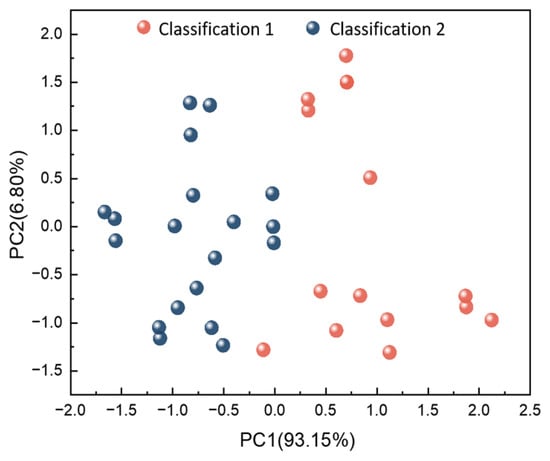
Figure 8.
Clustered scatter plot.
The results of the DMA partitioning for the Net2 Pipe Network are illustrated in Figure 9. The experimental pipe network has been effectively divided into two distinct Leakage Identification Zones. These zones are further subdivided into four geographical regions, reflecting the north-to-south alignment of the network’s nodes. Specifically, Leakage Identification Zone 1 comprises 13 nodes, while Leakage Identification Zone 2 includes 18 nodes, following the simplification of the pipe network structure.
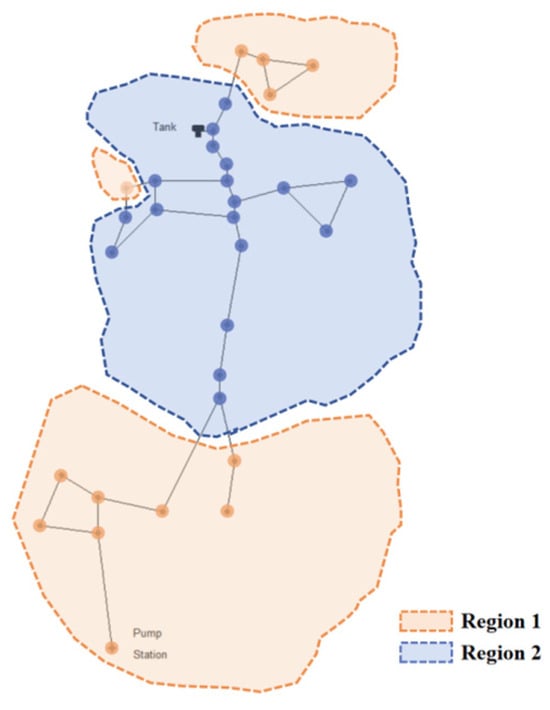
Figure 9.
DMA partition for Net2 pipe network system.
Notably, Leakage Identification Zone 1, despite being at a generally lower elevation, contains a regional flow inlet equipped with a pressurizing pump station. This configuration leads to higher pressure readings and similar pressure fluctuation patterns in the nodes closer to the water inlet. In contrast, Leakage Identification Zone 2 is positioned in the central portion of the pipe network. Although this zone has a higher overall elevation, it lacks additional hydraulic control elements such as pump stations, pressure-reducing valves, or throttling valves, apart from a water storage tank. As a result, Zone 2 exhibits a relatively consistent and uniform pattern of pressure fluctuations across its nodes, owing to the absence of varied hydraulic influences.
3.2. Leakage Localization Using the CS Algorithm
Based on the constructed model, the parameters for the Cuckoo Search (CS) algorithm were configured as follows: the population size was set to 40, the number of iterations was set to 100, and the detection probability Pa of discovering cuckoo eggs was set to 0.25. Additionally, the number of leakage nodes was set to 1, reflecting the low likelihood of multiple simultaneous leaks within the pipe network. The prediction results are visualized in Figure 10 as a heat map, which identifies node 17 as the most probable leakage point.
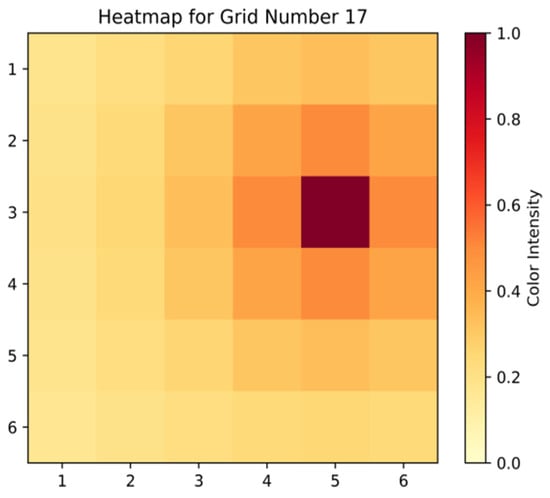
Figure 10.
Prediction for the most probable leakage point.
To enhance the accuracy of CS-based localization, the previously established leakage localization model was employed with specific parameter settings. The population size for the DMA-CS algorithm was configured to 40 [,], the number of iterations was set to 100, the crossover probability was adjusted to 0.3, and the mutation probability was set to 0.1. Additionally, the maximum number of leakage nodes was set to three. Hydraulic calculations were performed using the EPANET toolbox within the MATLAB platform, and the pressure monitoring data were input into the objective function for optimization.
Table 1 presents the effectiveness of the localization following these parameter adjustments. The results suggest a correlation between the leakage node patterns and the maximum number of leakage points specified. Although the actual number of leakage nodes in the pipe network was two, setting the maximum number of leakage nodes to three during the optimization led to solutions identifying one, two, or three potential leakage nodes.
3.3. Testing the Effectiveness of the DMA-CS Algorithm
To evaluate the effectiveness of DMA partitioning through clustering, three key metrics were employed: the Silhouette Coefficient (SC), the Calinski–Harabasz (CH) Index, and the Davies–Bouldin Index (DBI). The SC measures intra-cluster cohesion and inter-cluster separation, with values ranging from −1 to 1, where higher scores indicate better clustering quality. The DBI assesses cluster compactness and separation, with lower values reflecting superior clustering. The CH index compares inter- and intra-cluster covariance matrices, with higher scores indicating better performance. In this study, the SC, CH, and DBI scores were recorded as 0.616, 91.59, and 0.50, respectively, demonstrating that satisfactory clustering results were achieved.
To further validate the effectiveness of the DMA-CS algorithm, an additional set of 12 leakage localization experiments were conducted. The results of these experiments, as shown in Figure 11, indicate that the optimized algorithm successfully identified the leakage nodes in 8 out of the 12 trials, specifically targeting nodes 17 and 19. Additionally, under varying leakage coefficients of 0.2 and 0.3, the algorithm consistently identified nodes 17 and 19 four and five times, respectively. The predicted nodes were also found to be closely aligned with the actual geographical locations of the leaks, which indicated that the DMA-CS algorithm is highly effective in leakage localization.

Figure 11.
Plot of leakage localization results from the validation experiment.
3.4. Comparative Analysis of the DMA-CS Algorithm and the Traditional DMA Algorithm
The effectiveness of leak localization in pipe networks is significantly influenced by the strategic positioning and density of pressure monitoring points, a principle that holds true for both the DMA-CS algorithm and the traditional DMA algorithm. It is crucial to carefully select optimal locations within the pipe network for pressure sensor installation to ensure comprehensive monitoring of operational conditions in targeted areas.
A comparative analysis of the two algorithms, conducted using identical leakage points, is presented in Figure 12. The results demonstrate that, with an equivalent number of monitoring points, the CS algorithm consistently outperforms the traditional DMA approach in accurately identifying leakage nodes, particularly nodes 17 and 19. The CS algorithm exhibits superior localization precision, leading to more consistent and reliable results. This enhanced precision indicates that the CS algorithm has a higher probability of correctly pinpointing leakage nodes compared to the traditional method.
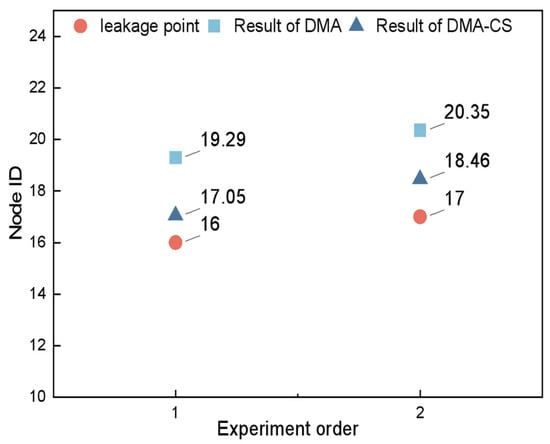
Figure 12.
Comparison of positioning accuracy between DMA-CS and traditional DMA algorithm.
Calculations reveal that while the traditional DMA zoning algorithm achieves an accuracy rate of 92.67%, the optimized DMA-CS algorithm attains a significantly higher accuracy level of 97.43%. This substantial improvement underscores the effectiveness of the DMA-CS algorithm in enhancing leak detection capabilities in pipe networks. In addition, a comparison of the pipe network leakage localization methods is depicted in Table 2.

Table 2.
Comparison amongst the pipe network leakage localization methods [,,,,,,,,,,,,,].
4. Conclusions and Recommendations
This study presents a novel and effective approach to leak detection in water supply networks by integrating the District Metered Area (DMA) method with the Cuckoo Search (CS) algorithm. The proposed DMA-CS algorithm demonstrates a significant improvement in leak localization accuracy, as evidenced by the comparative analysis against the traditional DMA algorithm. The results indicate that the optimized DMA-CS algorithm achieves an impressive accuracy of 97.43%, surpassing the 92.67% accuracy of the traditional DMA approach. This enhanced precision is attributed to the algorithm’s ability to strategically utilize pressure monitoring points, optimizing their placement and density to ensure comprehensive and accurate leak detection. The systematic integration of advanced techniques such as Principal Component Analysis (PCA) and the CS algorithm has proven to be highly effective in improving the robustness and reliability of leak localization in complex pipe networks.
However, several challenges and areas for further improvement remain. Firstly, while the algorithm has shown exceptional performance in controlled environments, its effectiveness in large-scale, real-world applications requires additional validation. The variability of network conditions, such as fluctuating demand patterns and external environmental factors, may influence the algorithm’s performance. Therefore, extensive field testing across diverse network configurations is essential to fully understand the limitations and to refine the algorithm’s adaptability to different operational scenarios.
Moreover, the computational efficiency of the DMA-CS algorithm, particularly when scaling to larger networks, should be carefully considered. As the network’s size increases, so too does the computational demand, potentially limiting the algorithm’s applicability in real-time monitoring systems. Future research should focus on optimizing the algorithm’s computational processes, possibly through parallel processing or other advanced computing techniques, to enhance its scalability and real-time applicability.
Additionally, the study’s reliance on accurate and high-resolution pressure data highlights the importance of maintaining and upgrading sensor infrastructure within water networks. The effectiveness of the DMA-CS algorithm is contingent on the quality and reliability of input data; thus, water utilities must invest in state-of-the-art pressure monitoring systems and ensure their consistent operation and maintenance.
Lastly, while the DMA-CS algorithm has shown promise in improving leak detection accuracy, integrating this approach into a broader, holistic water management strategy is crucial. This could include coupling the algorithm with predictive maintenance frameworks, real-time data analytics, and automated control systems to create a more resilient and responsive water supply network. By addressing these challenges and integrating the DMA-CS algorithm within a comprehensive management system, water utilities can significantly enhance their ability to detect and address leaks, ultimately leading to more sustainable and efficient water resource management.
Author Contributions
Conceptualization: B.L. and Y.Q.; methodology: F.X. and Y.Q.; software: L.L. and L.S.; validation: Y.Q.; formal analysis: F.X., L.L. and L.S.; investigation: F.X. and L.L.; resources: Y.Q.; data curation: L.L. and L.S.; writing—original draft preparation: F.X. and L.L.; writing—review and editing: Y.Q.; visualization: L.L. and L.S.; supervision: B.L.; funding acquisition: B.L. and Y.Q. All authors have read and agreed to the published version of the manuscript.
Funding
This research was funded by Guangdong Provincial Department of Science and Technology (2021ZT09G087), 2022 Zhuhai Social Development Science and Technology Program Project (2220004000355), and Guangdong Basic and Applied Basic Research Foundation (2023B1515040028).
Data Availability Statement
All data generated or analyzed during this study are available from the corresponding authors on request.
Acknowledgments
We greatly appreciate the Associate Professor He Kai (School of Civil Engineering, Sun Yat-sen University), who provided us with specialized guidance on modeling and provided the hardware test conditions.
Conflicts of Interest
The authors declare no conflicts of interest. The funders had no role in the design of the study; in the collection, analyses, or interpretation of the data; in the writing of the manuscript; or in the decision to publish the results.
Abbreviations
| CS algorithm | Cuckoo Search algorithm |
| CHI | Calinski–Harabasz Index |
| DBI | Davies–Bouldin Index |
| DMA algorithm | District Metering Area algorithm |
| PCA | Principal Component Analysis |
| SSEs | Sum of squared errors |
| WDNs | Water distribution networks |
Appendix A

Table A1.
Net2 pipeline node basic properties.
Table A1.
Net2 pipeline node basic properties.
| Node | Elevation (m) | Basic Water Demand (L/s) | Water Demand (L/s) | Total Water Head (m) | Pressure (KPa) |
|---|---|---|---|---|---|
| 1 | 15.24 | −43.81 | −42.05 | 19.55 | 776.42 |
| 2 | 30.48 | 0.50 | 0.64 | 19.25 | 613.08 |
| 3 | 18.29 | 0.88 | 1.11 | 19.21 | 730.71 |
| 4 | 18.29 | 0.50 | 0.64 | 19.19 | 729.47 |
| 5 | 30.48 | 0.50 | 0.64 | 19.19 | 609.84 |
| 6 | 38.10 | 0.32 | 0.40 | 19.06 | 529.10 |
| 7 | 48.77 | 0.25 | 0.32 | 18.77 | 411.13 |
| 8 | 33.53 | 0.57 | 0.72 | 18.77 | 560.47 |
| 9 | 54.86 | 0.88 | 1.11 | 18.74 | 349.50 |
| 10 | 39.62 | 0.32 | 0.40 | 18.77 | 500.77 |
| 11 | 56.39 | 2.19 | 2.76 | 18.67 | 331.50 |
| 12 | 64.01 | 1.01 | 1.27 | 18.52 | 249.66 |
| 13 | 64.01 | 0.13 | 0.16 | 18.47 | 247.52 |
| 14 | 60.96 | 0.13 | 0.16 | 18.45 | 276.48 |
| 15 | 57.91 | 0.13 | 0.16 | 18.44 | 305.78 |
| 16 | 45.72 | 1.26 | 1.59 | 18.44 | 425.34 |
| 17 | 54.86 | 1.26 | 1.59 | 18.44 | 335.57 |
| 18 | 30.48 | 1.26 | 1.59 | 18.44 | 574.61 |
| 19 | 45.72 | 0.32 | 0.40 | 18.44 | 425.20 |
| 20 | 51.82 | 1.20 | 1.51 | 18.45 | 365.97 |
| 21 | 45.72 | 1.01 | 1.27 | 18.45 | 425.68 |
| 22 | 60.96 | 0.63 | 0.79 | 18.45 | 276.27 |
| 23 | 70.10 | 0.50 | 0.64 | 18.41 | 184.99 |
| 24 | 57.91 | 0.69 | 0.87 | 18.43 | 305.37 |
| 25 | 70.10 | 0.38 | 0.48 | 18.41 | 184.50 |
| 26 | 71.63 | 0.00 | 16.40 | 18.40 | 169.40 |
| 27 | 39.62 | 0.50 | 0.64 | 18.40 | 483.25 |
| 28 | 33.53 | 0.00 | 0.00 | 18.40 | 542.96 |
| 29 | 33.53 | 0.44 | 0.56 | 18.40 | 542.96 |
| 30 | 39.62 | 0.19 | 0.24 | 18.40 | 483.18 |
| 31 | 57.91 | 1.07 | 1.35 | 18.41 | 303.99 |
| 32 | 33.53 | 1.07 | 1.35 | 18.44 | 544.69 |
| 33 | 54.86 | 0.09 | 0.12 | 18.45 | 336.05 |
| 34 | 57.91 | 0.09 | 0.12 | 18.45 | 306.20 |
| 35 | 33.53 | 0.00 | 0.00 | 18.40 | 542.96 |
| 36 | 33.53 | 0.06 | 0.08 | 18.40 | 542.96 |

Table A2.
Net2 pipeline pipe basic properties.
Table A2.
Net2 pipeline pipe basic properties.
| Pipe ID | Pipe Length (m) | Diameter (m) | Roughness Factor | Friction Factor |
|---|---|---|---|---|
| 1 | 835.20 | 4.18 | 100 | 0.035 |
| 2 | 278.40 | 4.18 | 100 | 0.036 |
| 3 | 452.40 | 2.78 | 100 | 0.043 |
| 4 | 417.60 | 2.78 | 100 | 0.045 |
| 5 | 348.00 | 4.18 | 100 | 0.048 |
| 6 | 417.60 | 4.18 | 100 | 0.035 |
| 7 | 939.60 | 4.18 | 100 | 0.035 |
| 8 | 417.60 | 4.18 | 140 | 0.032 |
| 9 | 139.20 | 4.18 | 100 | 0.036 |
| 10 | 348.00 | 2.78 | 140 | 0.036 |
| 11 | 243.60 | 4.18 | 100 | 0.036 |
| 12 | 661.20 | 4.18 | 100 | 0.036 |
| 13 | 208.80 | 4.18 | 100 | 0.036 |
| 14 | 139.20 | 4.18 | 100 | 0.038 |
| 15 | 104.40 | 4.18 | 100 | 0.038 |
| 16 | 522.00 | 2.78 | 100 | 0.045 |
| 17 | 522.00 | 2.78 | 100 | 0.058 |
| 18 | 208.80 | 2.78 | 100 | 0.051 |
| 19 | 243.60 | 4.18 | 100 | 0.056 |
| 20 | 121.80 | 4.18 | 100 | 0.075 |
| 21 | 487.20 | 2.78 | 100 | 0.055 |
| 22 | 382.80 | 4.18 | 100 | 0.050 |
| 23 | 452.40 | 2.78 | 100 | 0.057 |
| 24 | 452.40 | 2.78 | 100 | 0.082 |
| 25 | 452.40 | 2.78 | 100 | 0.057 |
| 26 | 208.80 | 4.18 | 100 | 0.039 |
| 27 | 87.00 | 4.18 | 100 | 0.039 |
| 28 | 104.40 | 4.18 | 100 | 0.039 |
| 29 | 69.60 | 4.18 | 100 | 0.040 |
| 30 | 208.80 | 4.18 | 100 | 0.052 |
| 31 | 139.20 | 2.78 | 100 | 0.054 |
| 32 | 139.20 | 2.78 | 100 | 0.059 |
| 34 | 243.60 | 2.78 | 100 | 0.035 |
| 35 | 348.00 | 2.78 | 100 | 0.072 |
| 36 | 139.20 | 2.78 | 100 | 0.068 |
| 37 | 174.00 | 2.78 | 100 | 0.057 |
| 38 | 174.00 | 2.78 | 100 | 0.021 |
| 39 | 348.00 | 2.78 | 100 | 0.072 |
| 40 | 243.60 | 2.78 | 100 | 0.082 |
| 41 | 104.40 | 2.78 | 100 | 0.135 |
Appendix B

Table A3.
Pipeline monitoring points properties pressure data.
Table A3.
Pipeline monitoring points properties pressure data.
| Time | Node 1 | Node 7 | Node 13 | Node 31 | Time | Node 1 | Node 7 | Node 13 | Node 31 |
|---|---|---|---|---|---|---|---|---|---|
| 0:00 | 776.42 | 411.13 | 247.52 | 303.99 | 28:00 | 789.10 | 425.75 | 261.66 | 317.09 |
| 1:00 | 782.21 | 416.37 | 256.07 | 307.30 | 29:00 | 788.90 | 427.47 | 264.97 | 321.30 |
| 2:00 | 787.11 | 421.06 | 260.41 | 311.37 | 30:00 | 793.17 | 431.54 | 268.69 | 324.81 |
| 3:00 | 791.45 | 425.41 | 265.10 | 315.71 | 31:00 | 754.70 | 418.44 | 267.86 | 328.05 |
| 4:00 | 796.76 | 430.51 | 268.34 | 320.05 | 32:00 | 740.22 | 411.75 | 263.17 | 324.95 |
| 5:00 | 797.72 | 432.23 | 268.48 | 324.54 | 33:00 | 734.50 | 406.10 | 257.79 | 320.33 |
| 6:00 | 766.83 | 422.72 | 267.31 | 327.71 | 34:00 | 730.50 | 402.03 | 253.45 | 315.23 |
| 7:00 | 744.91 | 416.37 | 264.62 | 327.78 | 35:00 | 726.91 | 398.38 | 249.66 | 310.88 |
| 8:00 | 742.29 | 413.69 | 259.59 | 325.16 | 36:00 | 722.71 | 394.24 | 245.59 | 307.02 |
| 9:00 | 736.22 | 407.82 | 247.38 | 322.12 | 37:00 | 749.87 | 401.27 | 244.83 | 303.30 |
| 10:00 | 721.19 | 393.35 | 246.14 | 315.71 | 38:00 | 786.62 | 417.41 | 250.62 | 305.16 |
| 11:00 | 723.40 | 394.86 | 247.11 | 307.44 | 39:00 | 795.79 | 425.68 | 257.31 | 310.26 |
| 12:00 | 762.22 | 407.14 | 254.35 | 304.06 | 40:00 | 800.83 | 430.92 | 262.97 | 316.26 |
| 13:00 | 792.21 | 422.30 | 256.35 | 307.64 | 41:00 | 809.86 | 439.40 | 270.14 | 322.26 |
| 14:00 | 788.28 | 420.44 | 263.38 | 312.95 | 42:00 | 748.70 | 418.24 | 268.41 | 328.12 |
| 15:00 | 801.86 | 431.82 | 271.52 | 316.33 | 43:00 | 744.50 | 415.96 | 266.97 | 327.64 |
| 16:00 | 812.48 | 441.61 | 268.90 | 322.67 | 44:00 | 739.81 | 411.34 | 262.76 | 324.47 |
| 17:00 | 747.87 | 418.37 | 267.17 | 328.95 | 45:00 | 734.02 | 405.62 | 257.38 | 319.92 |
| 18:00 | 745.05 | 416.44 | 267.17 | 327.16 | 46:00 | 729.26 | 400.86 | 252.49 | 314.68 |
| 19:00 | 742.70 | 414.17 | 265.10 | 325.57 | 47:00 | 725.88 | 397.41 | 248.62 | 309.92 |
| 20:00 | 737.19 | 408.79 | 260.41 | 322.61 | 48:00 | 722.78 | 394.24 | 245.32 | 306.20 |
| 21:00 | 730.15 | 401.90 | 254.00 | 317.43 | 49:00 | 751.60 | 401.14 | 244.42 | 303.16 |
| 22:00 | 726.50 | 398.03 | 249.59 | 311.57 | 50:00 | 774.56 | 411.62 | 248.28 | 304.33 |
| 23:00 | 721.40 | 393.00 | 244.56 | 306.82 | 51:00 | 780.97 | 417.48 | 253.04 | 308.20 |
| 24:00 | 740.84 | 399.00 | 244.14 | 302.47 | 52:00 | 784.69 | 421.41 | 257.31 | 312.75 |
| 25:00 | 774.35 | 411.55 | 248.56 | 304.89 | 53:00 | 789.93 | 426.44 | 262.00 | 317.16 |
| 26:00 | 778.62 | 415.68 | 252.35 | 308.40 | 54:00 | 794.55 | 430.99 | 266.62 | 321.71 |
| 27:00 | 786.07 | 422.37 | 257.52 | 312.26 | 55:00 | 798.55 | 433.27 | 269.65 | 326.12 |
References
- Shahra, E.Q.; Wu, W.; Gomez, R. Human Health Impact Analysis of Contaminant in IoT-Enabled Water Distributed Networks. Appl. Sci. 2021, 11, 3394. [Google Scholar] [CrossRef]
- Bello, O.; Abu-Mahfouz, A.M.; Hamam, Y.; Page, P.R.; Adedeji, K.B.; Piller, O. Solving Management Problems in Water Distribution Networks: A Survey of Approaches and Mathematical Models. Water 2019, 11, 562. [Google Scholar] [CrossRef]
- Tornyeviadzi, H.M.; Seidu, R. Leakage detection in water distribution networks via 1D CNN deep autoencoder for multivariate SCADA data. Eng. Appl. Artif. Intell. 2023, 122, 106062. [Google Scholar] [CrossRef]
- Barros, D.; Almeida, I.; Zanfei, A.; Meirelles, G.; Luvizotto, E., Jr.; Brentan, B. An Investigation on the Effect of Leakages on the Water Quality Parameters in Distribution Networks. Water 2023, 15, 324. [Google Scholar] [CrossRef]
- China Statistical Yearbook; China Statistical Press: Beijing, China, 2021.
- Xu, Q.; Liu, R.; Chen, Q.; Li, R. Review on water leakage control in distribution networks and the associated environmental benefits. J. Environ. Sci. 2014, 26, 955–961. [Google Scholar] [CrossRef]
- Morais, D.C.; de Almeida, A.T. Group decision-making for leakage management strategy of water network. Resour. Conserv. Recycl. 2007, 52, 441–459. [Google Scholar] [CrossRef]
- Zhang, D.; Sial, M.S.; Ahmad, N.; Filipe, A.J.; Thu, P.A.; Zia-Ud-Din, M.; Caleiro, A.B. Water Scarcity and Sustainability in an Emerging Economy: A Management Perspective for Future. Sustainability 2021, 13, 144. [Google Scholar] [CrossRef]
- Gao, L.; Cao, J. Review of diagnostic technique for pipe leakage. Mod. Manuf. Eng. 2022, 2, 154–162. [Google Scholar]
- Datta, S.; Sarkar, S. A review on different pipeline fault detection methods. J. Loss Prev. Process Ind. 2016, 41, 97–106. [Google Scholar] [CrossRef]
- Zhang, W.; Luo, J.; Luo, W.; Wang, L. Leakage diagnostic method for water supply pipeline based on ground penetrating radar and image correlation algorithm. Measurement 2024, 237, 115233. [Google Scholar] [CrossRef]
- Li, R.; Huang, H.; Xin, K.; Tao, T. A review of methods for burst/leakage detection and location in water distribution systems. Water Supply 2015, 15, 429–441. [Google Scholar] [CrossRef]
- Wong, L.; Deo, R.; Rathnayaka, S.; Shannon, B.; Zhang, C.; Chiu, W.K.; Kodikara, J.; Widyastuti, H. Leak Detection in Water Pipes Using Submersible Optical Optic-Based Pressure Sensor. Sensors 2018, 18, 4192. [Google Scholar] [CrossRef] [PubMed]
- Abd Rahman, N.; Muhammad, N.; Mohtar, H.W. Evolution of research on water leakage control strategies: Where are we now? Urban Water J. 2018, 15, 812–826. [Google Scholar] [CrossRef]
- Korkana, P.; Kanakoudis, V.; Patelis, M.; Gonelas, K. Forming District Metered Areas in a Water Distribution Network Using Genetic Algorithms. Procedia Eng. 2016, 162, 511–520. [Google Scholar] [CrossRef]
- Kapelan, Z.; Savic, D.; Walters, G. A hybrid inverse transient model for leakage detection and roughness calibration in pipe networks. J. Hydraul. Res. 2003, 41, 481–492. [Google Scholar] [CrossRef]
- Gupta, A. A Selective Literature Review on Leak Management Techniques for Water Distribution System. Water Resour. Manag. 2018, 32, 3247–3269. [Google Scholar] [CrossRef]
- Guan, Y.; Lv, M.; Dong, S. Pressure-driven Background Leakage Models and their Application for Leak Localization Using a Multi-population Genetic Algorithm. Water Resour. Manag. 2023, 37, 359–373. [Google Scholar] [CrossRef]
- Nimri, W.; Wang, Y.; Zhang, Z.; Deng, C.; Sellstrom, K. Data-driven approaches and model-based methods for detecting and locating leaks in water distribution systems: A literature review. Neural Comput. Appl. 2023, 35, 11611–11623. [Google Scholar] [CrossRef]
- Li, H.; Yang, Z.; Zhou, Y.; Hu, Y.; Feng, D.; Ji, Y.; Wu, F. Machine learning algorithm based identification method for leakage current types of multiple earthing system Identification method for leakage current types of multiple earthing system. In Proceedings of the 2023 3rd International Conference on Electrical Engineering and Mechatronics Technology 2023, Nanjing, China, 21–23 July 2023; pp. 742–746. [Google Scholar]
- Mosaheb, M.; Zeidouni, M. Above zone pressure interpretation for leaky well characterization and its identification from leaky caprock/fault. J. Pet. Sci. Eng. 2018, 171, 218–228. [Google Scholar] [CrossRef]
- Chen, J.; Feng, X.; Xiao, S. Leakage zone identification for water distribution networks based on the alarm levels of pressure sensors. J. Civ. Struct. Health Monit. 2024, 14, 15–27. [Google Scholar] [CrossRef]
- Daniel, I.; Pesantez, J.; Letzgus, S.; Fasaee, M.A.K.; Alghamdi, F.; Berglund, E.; Mahinthakumar, G.; Cominola, A. A Sequential Pressure-Based Algorithm for Data-Driven Leakage Identification and Model-Based Localization in Water Distribution Networks. J. Water Resour. Plan. Manag. 2022, 148, 04022025. [Google Scholar] [CrossRef]
- Li, J.; Yang, L.; Liu, K.; Xiao, X.; Xue, C. Research on micro leakage aperture recognition algorithm based on ultrasonic eigenvalue. Transducer Microsyst. Technol. 2022, 41, 42–45. [Google Scholar]
- Song, W.; Wang, S.; Tao, T. A leakage zone identification method for water distribution networks based on virtual pressure partition. Environ. Eng. 2023, 41, 184–191. [Google Scholar]
- Su, W.; Chai, K. Warship Pipeline Leakage Identification and Location Based on VMD and RBF. Ship Eng. 2020, 42, 105–112. [Google Scholar]
- Chen, J.; Feng, X.; Xiao, S. An iterative method for leakage zone identification in water distribution networks based on machine learning. Struct. Health Monit.-Int. J. 2021, 20, 1938–1956. [Google Scholar] [CrossRef]
- Chen, J.; Feng, X.; Xiao, S. A leakage zone identification method for water distribution networks based on the alarm level of pressure sensors. Water Wastewater Eng. 2022, 48, 173–179. [Google Scholar]
- Li, X.; Cao, C.-S.; Hung, S.-F.; Lu, Y.-R.; Cai, W.; Rykov, A.I.; Miao, S.; Xi, S.; Yang, H.; Hu, Z.; et al. Identification of the Electronic and Structural Dynamics of Catalytic Centers in Single-Fe-Atom Material. Chem 2020, 6, 3440–3454. [Google Scholar] [CrossRef]
- Mohseni, U.; Pathan, A.I.; Agnihotri, P.G.; Patidar, N.; Zareer, S.A.; Kalyan, D.; Saran, V.; Patel, D.; Prieto, C. Design and Analysis of Water Distribution Network Using Epanet 2.0 and Loop 4.0—A Case Study of Narangi Village. In Intelligent Computing & Optimization; Springer International Publishing: Cham, Switzerland, 2022. [Google Scholar]
- Zhang, F.E.; Yin, Z.N.; Li, H. Application of the EPANET hydraulic model in water supply network optimization. Water Wastewater Eng. 2007, 33, 200–202. [Google Scholar]
- Wu, Z.Y.; Sage, P.; Turtle, D. Pressure-Dependent Leak Detection Model and Its Application to a District Water System. J. Water Resour. Plan. Manag. 2010, 136, 116–128. [Google Scholar] [CrossRef]
- Zheng, Y.W. Genetic algorithm plays a role in municipal water systems. ACM Sigevolution 2006, 1, 2–8. [Google Scholar]
- Wang, J.; Li, Z.; Huang, C.; Li, Z.; Xin, K. leakage location methods of water distribution network based on temporal and pressure spatial features with physical experiment verification. Environ. Eng. 2022, 40, 233–240. [Google Scholar]
- Aranganayagi, S.; Thangavel, K. Clustering categorical data using silhouette coefficient as a relating measure. In Proceedings of the International Conference on Computational Intelligence and Multimedia Applications 2007, Sivakasi, India, 13–15 December 2007; pp. 13–17. [Google Scholar]
- Brusco, M.J.; Steinley, D. A comparison of heuristic procedures for minimum within-cluster sums of squares partitioning. Psychometrika 2007, 72, 583–600. [Google Scholar] [CrossRef]
- Marutho, D.; Handaka, S.H.; Wijaya, E.; Muljono. The Determination of Cluster Number at k-Mean Using Elbow Method and Purity Evaluation on Headline News. In Proceedings of the 2018 International Seminar on Application for Technology of Information and Communication, Semarang, Indonesia, 21–22 September 2018; pp. 533–538. [Google Scholar]
- Yang, X.S.; Deb, S. Engineering optimisation by cuckoo search. Int. J. Math. Model. Numer. Optim. 2010, 1, 330. [Google Scholar] [CrossRef]
- Sedighkia, M.; Datta, B.; Fathi, Z. Linking ecohydraulic simulation and optimization system for mitigating economic and environmental losses of reservoirs. AQUA—Water Infrastructure. Ecosyst. Soc. 2022, 71, 229–247. [Google Scholar]
- Trivedi, M.; Shrivastava, R.K. Reservoir operation management using a new hybrid algorithm of Invasive Weed Optimization and Cuckoo Search Algorithm. AQUA—Water Infrastructure. Ecosyst. Soc. 2023, 72, 1607–1628. [Google Scholar]
- Valian, E.; Tavakoli, S.; Mohanna, S.; Haghi, A. Improved cuckoo search for reliability optimization problems. Comput. Ind. Eng. 2013, 64, 459–468. [Google Scholar] [CrossRef]
Disclaimer/Publisher’s Note: The statements, opinions and data contained in all publications are solely those of the individual author(s) and contributor(s) and not of MDPI and/or the editor(s). MDPI and/or the editor(s) disclaim responsibility for any injury to people or property resulting from any ideas, methods, instructions or products referred to in the content. |
© 2024 by the authors. Licensee MDPI, Basel, Switzerland. This article is an open access article distributed under the terms and conditions of the Creative Commons Attribution (CC BY) license (https://creativecommons.org/licenses/by/4.0/).