Article

The Impact of Major Ecological Projects on the Water Yield of Mountain Basins, Northern China

by
Xianglong Hou
1,
Miwei Shi
1,
Jianguo Zhao
2,
Lingyao Meng
1,
Yan Zhang
1,
Rongzhi Zhang
1,
Hui Yang
3,* and
Jiansheng Cao
3,*
1
Hebei Technology Innovation Center for Geographic Information Application, Institute of Geographical Sciences, Hebei Academy of Sciences, Shijiazhuang 050011, China
2
Baiyangdian Basin Ecological Environment Monitoring Center, Baoding 071000, China
3
Key Laboratory of Agricultural Water Resources, Hebei Key Laboratory of Agricultural Water-Saving, Center for Agricultural Resources Research, Institute of Genetics and Developmental Biology, Chinese Academy of Sciences, Shijiazhuang 050001, China
*
Authors to whom correspondence should be addressed.
Water 2024, 16(20), 2900; https://doi.org/10.3390/w16202900
Submission received: 14 September 2024 / Revised: 5 October 2024 / Accepted: 11 October 2024 / Published: 12 October 2024

Abstract

:
Water yield, one of the most valuable and important ecological indicators, reflects the renewable capacity of regional water resources. The Taihang Mountains are a natural ecological barrier and an important source of water production for the North China Plain. Two large-scale projects involving returning farmland to forest and grassland have significantly changed the distribution of land use in the Taihang Mountains, and also affect the water production characteristics of the Taihang Mountains. Taking the Hutuo River Basin, a typical river in the Taihang Mountainous region, as the study area, the InVEST model is utilized to calculate the spatial and temporal changes in water yield capacity in the Hutuo River basin, and four scenarios were set to judge the impact of different ecological projects on the water yield of the mountainous watershed of the Hutuo River. The results showed that the water yield in the five study periods was 218.58–376.44 mm. The interannual variations in both precipitation and water yield of the study area in the last decade were large. The water yield is mainly concentrated in the northeast region of the upper reaches of the basin, and the smallest is the northwest and central regions of the upper reaches. The water yield in each year in the study area is mainly less than 400 mm, accounting for more than 60% of the study area, and the water yield has shown a large regional expansion in the past 10 years. Grassland has the largest water yield capacity of all land use types, and climate change has basically no effect on the water yield capacity of different land use types. The ecological project of returning farmland to forestland has a negative impact on the water yield capacity, whereas the water yield capacity increases after returning farmland to grassland. The water conservancy project of river training has a negative impact on the water yield capacity of the Hutuo River mountainous basin. The research results provide theoretical data for judging the relationship between vegetation restoration and water yield in mountainous watersheds, a scientific basis for evaluating the implementation effect of major projects, and strong data support for water resource management in the North China Plain.

1. Introduction

For water-scarce areas, water is a vital natural resource, which determines the development of local economic and social and ecological security [1,2]. Economic development and anthropogenic activities have changed the land use and land cover of the region, in turn affecting the way water resources are recycled [3]. The contradiction between supply and demand for water resources has become more prominent in the context of intensifying climate change and population growth. In order to better harmonize regional development with water security and stability, a comprehensive survey of water resource dynamics at the regional scale is necessary [4], as such an investigation can help to reveal the dynamics of water resources and formulate appropriate water management strategies.
As an important component of ecosystems, water yield reflects the renewable capacity of regional water resources [5] and is one of the most valuable and significant ecological indicators [6,7]. Water yield is critical for maintaining biodiversity, supporting agricultural production and meeting human drinking water needs, and is of great significance for key ecological functions such as river recharge and hydrological regulation [6,8,9,10,11,12].
The most common method of calculating water yield is the water balance method [13]. Water yield is often calculated on a regional (watershed) scale, and water yield can be subtracted from precipitation by actual evapotranspiration [14], assuming no change in soil moisture content between years. The calculation process of water yield needs to take into account factors such as precipitation, evaporation, land use/land cover, topography, soil characteristics, and vegetation transpiration, which makes the computation of water yield complex and highly uncertain [14,15].
The two most significant influencing factors of water yield are land use and climate change [6,15,16]. Anthropogenic activities are the main way to change land use [17]. In addition, the impact of climate change on water yield in the context of global warming is rapidly increasing [18], and rising temperatures affect evaporation, thereby altering the water balance [19]; increased rainfall and flooding can also significantly increase regional water yield [20]. In conclusion, the calculation of regional water yield needs to fully consider the influence mechanisms of both land use and climate change factors.
With the development of geographic information systems (GISs) and remote sensing (RS), several distributed hydrological models have emerged that can be used to calculate regional water yield, such as the SWAT model [21], the MIKE SHE model [22], the PRMS model [23], the MODFLOW model [24,25] and the InVEST model, among others [26]. The InVEST (Integrated Valuation of Ecosystem Services and Tradeoffs) model developed by the Natural Capital Project Team to support environmental decision-making is more widely used in the field of water yield calculations because it is applicable to areas where data are scarce [27]. The InVEST model also has the advantages of simple data input, strong spatial expressiveness, flexible parameter setting, and convenient operation [15,28].
Global dependence on water resources from mountains is increasing [29]; mountains are considered as water towers, and water produced by mountains often accounts for a significant portion of watershed water production, up to 90% in some cases [30]. The North China Plain (NCP) is one of the most water-scarce regions in the world, as household, industrial and agricultural water use exceeds the availability of natural renewable water resources [31]. The Taihang Mountains on the western side of the NCP are a natural ecological barrier and a significant source of water production for the NCP, where more than 60% of the rivers of the plain originate. The Taihang Mountains supply about 3.6 billion m3 of water resources to the NCP annually [32,33]. In the past 25 years, China has carried out two major nationwide projects to return farmland to forest and grassland, the first of which began in 1999 and the second in 2014 [34]. Two large-scale projects of returning farmland to forest and grassland have significantly changed the distribution of land use in the Taihang Mountains and also affected the water production characteristics of the Taihang Mountains.
Therefore, combined with the above two major projects of returning farmland to forest and grassland on a national scale, in this paper, we select five periods—the non-implementation period (2000), early implementation period (2005), mid-implementation period (2010), late implementation period (2015) and end implementation period (2020)—as the study period, and take the Hutuo River Basin, a typical river in the Taihang Mountainous region, as the research object, utilizing the InVEST model to calculate the spatial and temporal changes in water yield capacity in the Hutuo River basin, so as to ascertain the impact of the implementation of major ecological projects (short-term high-intensity change in land use types) on the water yield of typical basins in the Taihang Mountainous Region. The research results provide theoretical data for judging the relationship between vegetation restoration and water yield in mountainous watersheds, a scientific basis for evaluating the implementation effect of major projects, and strong data support for water resource management in the North China Plain.

2. Materials and Methods

2.1. Study Area

The mountainous watershed of the Hutuo River is located at E 111°30′–114°30′ and N 37°30′–39°30′, with a watershed area of 2.3 × 10⁴ km2 and an elevation of −18–3091 m (Figure 1). The Hutuo River basin has a temperate continental monsoon climate. It is hot and rainy in summer and cold and dry in winter. Precipitation is unevenly distributed throughout the year, with an average annual precipitation of 500 mm, with about 75% of precipitation occurring between June and October [35]. The dominant soil types are loess and brown soil, while the main rock types are schist, sandstone, and limestone. The three primary land use types are forest, grassland, and cropland, with the main crops being winter wheat and summer corn. The forest is composed of deciduous broadleaf, coniferous, and shrub species [36].

2.2. Data and Processing

The annual water yield module of InVEST 3.14.1 is used to quantify and map water yield from 2000 to 2020 in the study area [37]. The data required for the model include precipitation data, potential evapotranspiration data, root restricting layer depth data, plant available water content (PAWC) data, land use/land cover (LULC) data, watershed boundaries, the biophysical table, and the Z parameter. The sources and processing of each data type are listed below.
The DEM data were obtained from Geospatial Data Cloud (https://www.gscloud.cn/, accessed on 13 September 2024) with a resolution of 30 m. Arc GIS 10.5 was utilized to obtain the topographic data of the study area and generate the watershed boundaries, among others.
The daily meteorological data from five weather stations in and around the study area (Figure 1), including air temperature and precipitation, were obtained from the China Meteorological Data Network (http://data.cma.cn/, accessed on 13 September 2024), spanning from 2000 to 2020. These data were used to calculate potential evapotranspiration (ET0) using the modified Hargreaves equation [38]. The following equation was derived:
E T 0 = 0.0013 × 0.408 × R A × ( T a v + 17 ) × ( T D 0.0123 P ) 0.76
where T a v denotes the average of the mean daily maximum and minimum temperatures, TD denotes the difference between the two in °C, RA denotes the amount of astronomical radiation in MJ/m2/d, and P denotes the amount of precipitation, in mm/month.
The ET0 data from each meteorological station were used to generate raster data with the ordinary Kriging interpolation method using Arc GIS10.5 to obtain the spatial distribution of ET0 in the study area from 2000 to 2020.
The precipitation data were obtained from six rainfall stations in the watershed in addition to five meteorological stations, as well as hydrological data, which were obtained from the hydrological yearbook provided by the Haihe River Water Conservancy Commission. Similarly, the precipitation data from 11 stations were used to generate raster data with the ordinary Kriging interpolation method using Arc GIS10.5 to obtain the spatial distribution of yearly precipitation in the study area from 2000 to 2020.
The soil data including soil depth data, texture data and soil organic matter data were obtained from the 1:1,000,000 Soil Database of China downloaded from the Nanjing Institute of Soil Science, Chinese Academy of Sciences (http://www.issas.cas.cn/, accessed on 13 September 2024). If root restricting layer depth or rootable depth by soil type is not available, soil depth can be used as a proxy.
Plant available water content is a fraction obtained from some standard soil maps. It is defined as the difference between the fraction of volumetric field capacity and permanent wilting point. Based on the texture data and soil organic matter data, plant available water content (PAWC) was calculated using SPAW software 6.02.75 with the value range of 0–1 fraction. The shapefile format of the original soil data was converted into raster using Arc GIS10.5 to obtain the spatial distribution of root restricting layer depth and PAWC in the study area.
The LULC data were obtained from National Cryosphere Desert Science Data Centre, China (http://www.ncdc.ac.cn/portal/, accessed on 13 September 2024), with a resolution of 30 m. Based on the boundary of the study area, the spatial distribution of LULC from 2000 to 2020 was extracted using Arc GIS 10.5.
The biophysical table includes model information corresponding to each of the land use classes in the LULC raster (LULC class (Lucode), LULC_veg, root_depth and Kc) in .csv table format, where Lucode is the same as the land use raster map, LULC_veg is 1 for vegetated land use except wetlands and 0 for all other land uses, root_depth is the value of root restricting depth (values must be integer, converted to mm), and Kc is the value of root restricting depth, in the range of 0 to 1.5 decimals. Root depth and Kc are values of different LULC according UN FAO Irrigation and Drainage paper 56.
The Z parameter is a floating point value on the order of 1 to 30 corresponding to the seasonal distribution of precipitation. Z could be estimated as 0.2× N, where N is the number of rain events per year [39]. The definition of a rain event is the one used by the authors of the study, characterized by a minimum period of 6 h between two storms. Therefore, based on the average number of rainfall events from 2000 to 2020 at the 11 stations in the study area, we determined a range of Z values of 8.28–9 for this study.
For computational uniformity, the resolution of all raster data was 30 m, and Albers_Conic_Equal_Area was chosen as the projection coordinate. The rest of the data were analyzed and plotted on graphs using Microsoft Excel 2016 and IBM SPSS Statistics 20 software.

2.3. Scenario Setting and Simulation

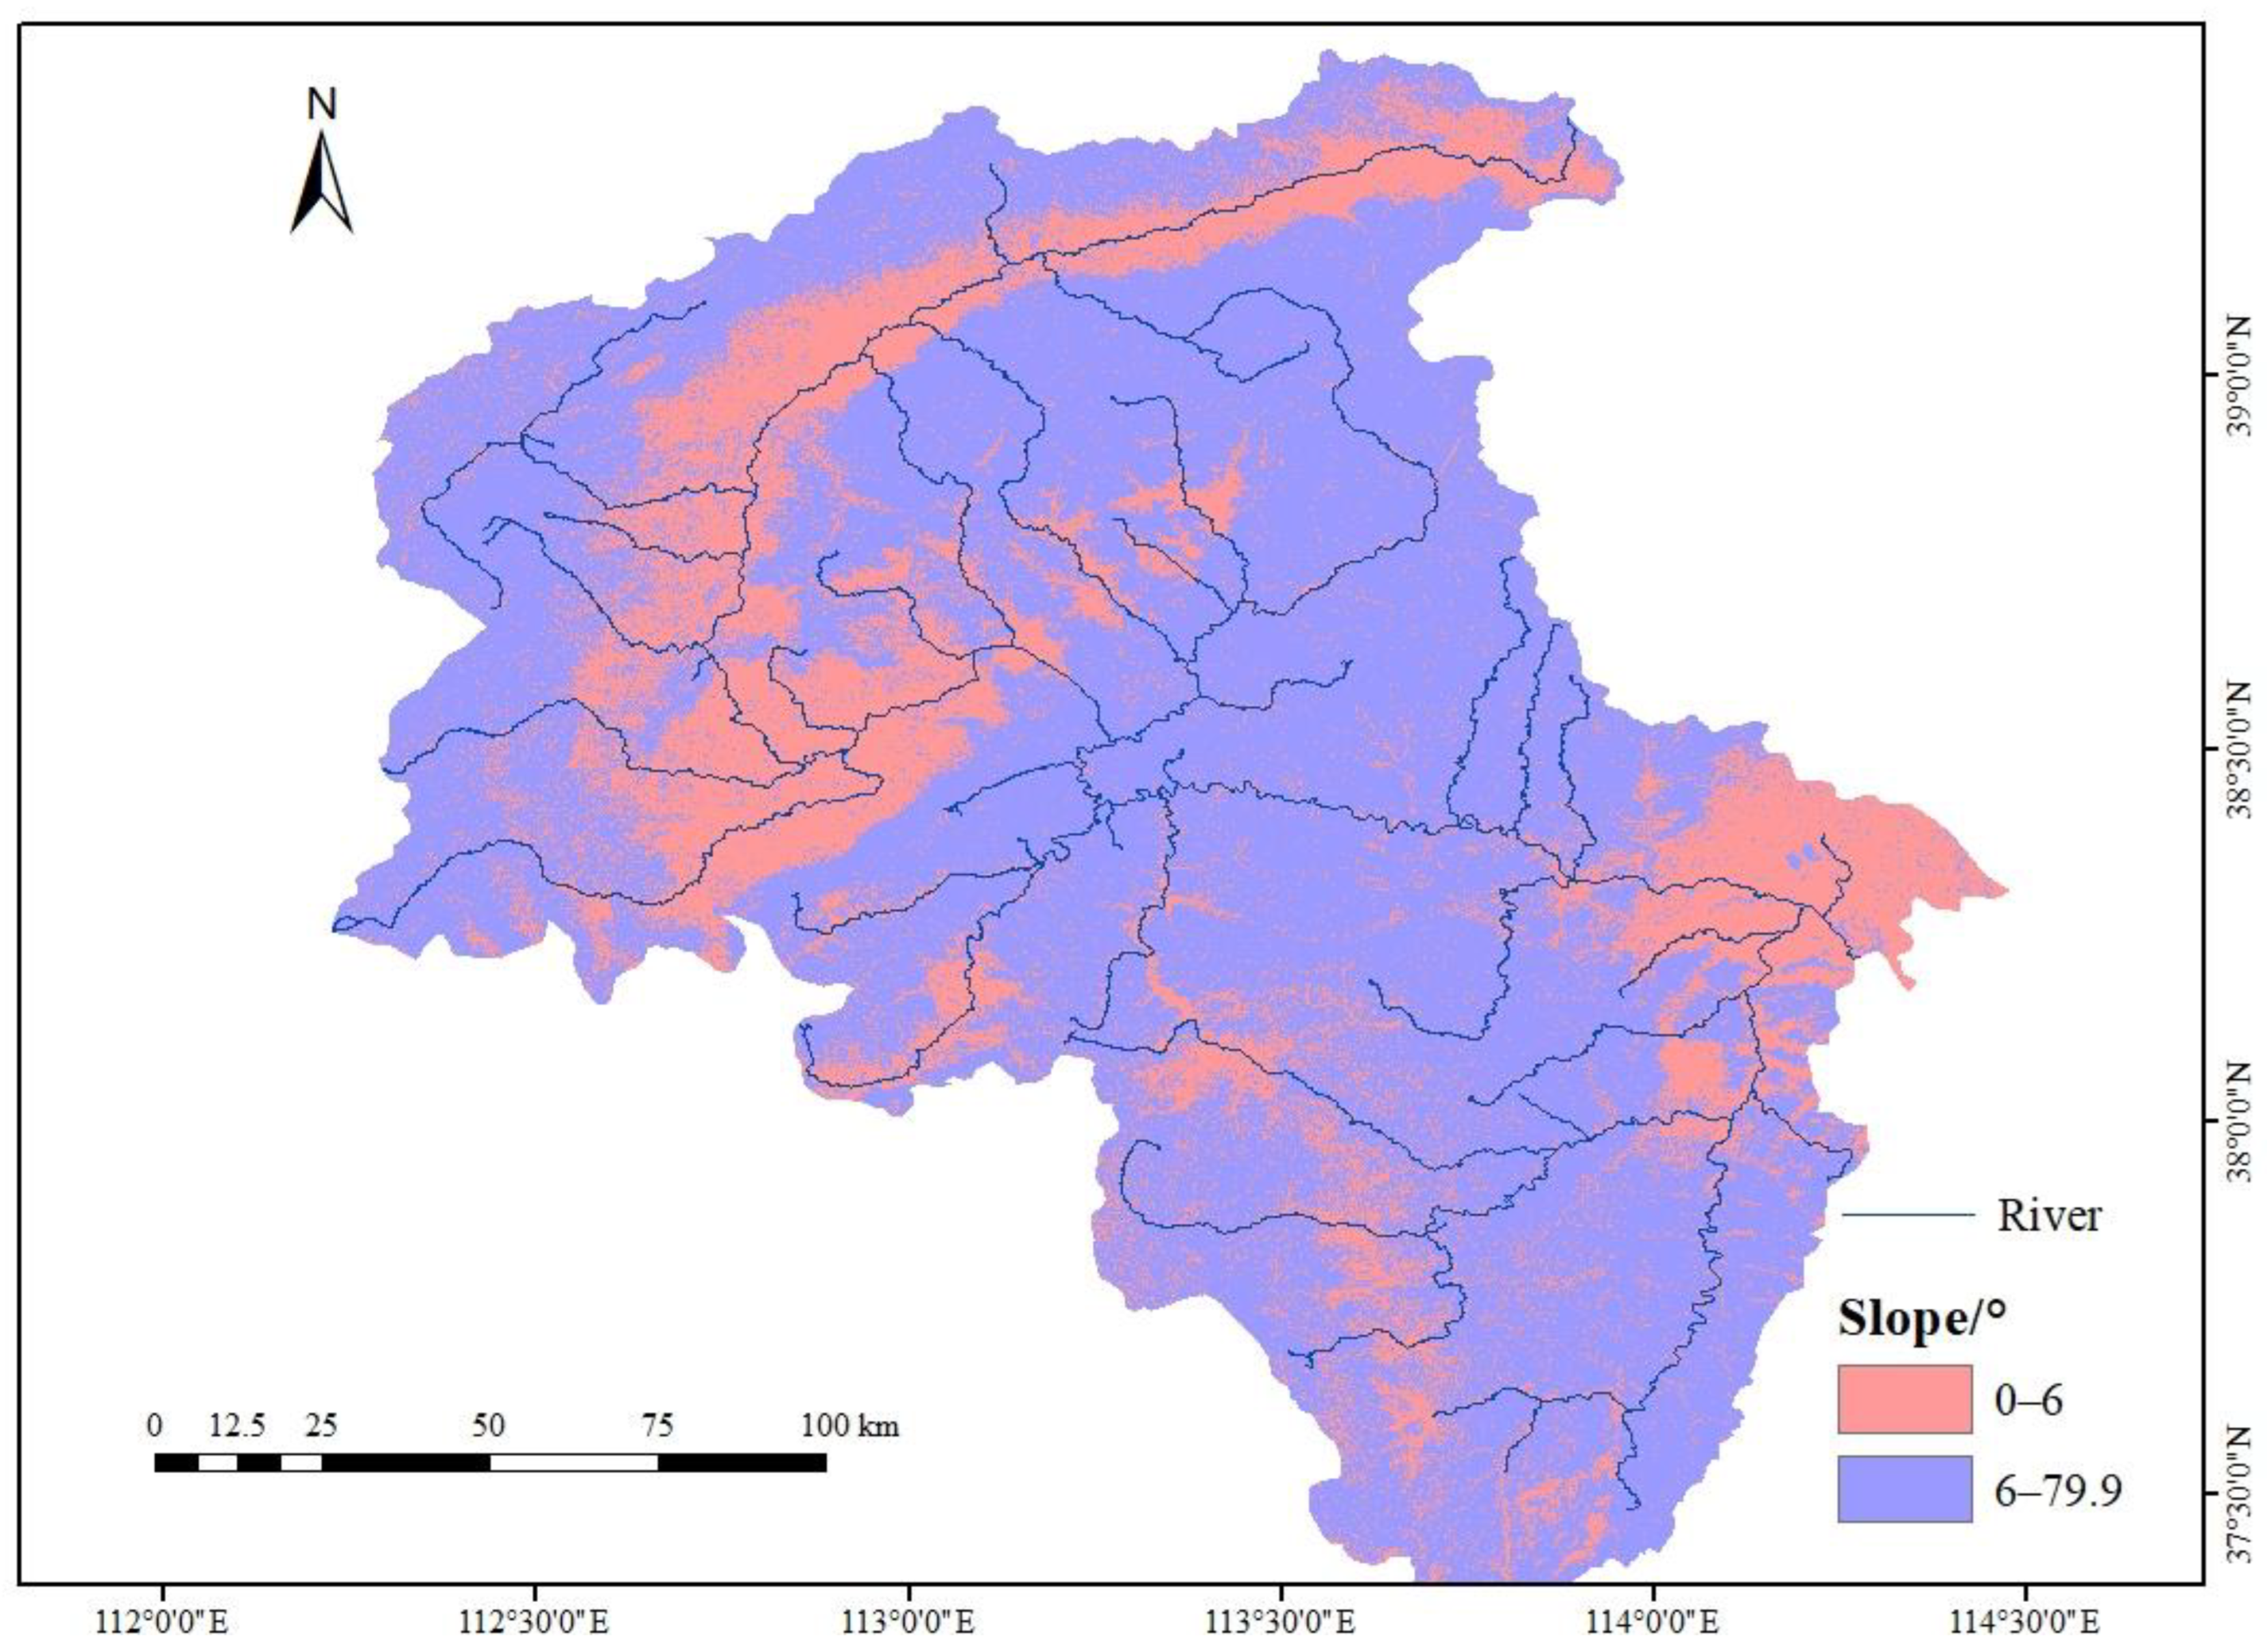
Returning farmland to forest and grassland refers to sloping cropland and sandy cropland with serious soil erosion and low and unstable yield, and its standard is sloping cropland with a slope of more than 6° in mountainous and hilly areas [34]. Therefore, in order to judge the impacts of the ecological project of returning farmland to forest and grassland at different stages on the water yield in the mountainous watershed of the Hutuo River, three scenarios involving returning farmland to forest and grassland were set up to transform sloping cropland with a slope of more than 6° to forest and grassland with the years 2000 and 2015 as the baseline period, respectively. S1 involved turning cropland into forest land, S2 involved turning cropland into shrub land, and S3 involved turning cropland into grassland, and the comparisons were made between the years 2000 and 2015 changes in measured and simulated water yield. Thus, the contribution of cropland into forest and grassland to water yield in the watershed was obtained. In addition, at present, it is a common phenomenon that the mountain rivers are occupied and converted into cropland, which is very unfavorable to river flooding, and the water conservancy department has spent a lot of manpower and material resources to mitigate this issue. For this reason, according to the actual slope distribution location of the river stream, the cropland located in the slope interval is changed into water, and a fourth scenario, S4, involving returning cropland to water, was set up to compare the difference in water yield before and after the cropland occupation, so as to obtain the impact of cropland occupation water on the water yield in the study area, with 2020 as the base period, for the difference between the simulated and actual water yield in 2020. The settings of each scenario are shown in Table 1.

3. Results

3.1. Temporal and Spatial Variation in Water Yield Capacity

Temporally, the water yield ranged from 218.58 to 376.44 mm over the five study periods, with more pronounced inter-annual variations, among which the largest water yield was in 2020 and the smallest was in 2005 (Figure 2). There was a significant positive correlation between water yield and precipitation, and the relationship between ywater yield = 0.84xprecipitaion − 142.63 (R = 0.998, p < 0.01). During the period 2000–2010, the interannual variation in precipitation and water yield was 2.72 mm and 1.89 mm, respectively, and the interannual variation in precipitation and water yield during the period from 2010 to 2020 was 12.75 mm and 10.86 mm, respectively. It seems that compared with the previous decade (2000–2010), the interannual variations in precipitation and water yield in the mountainous watershed of the Hutuo River in the last decade (2010–2020) are larger, although the interannual variations in water yield are not as large as the variations in precipitation.
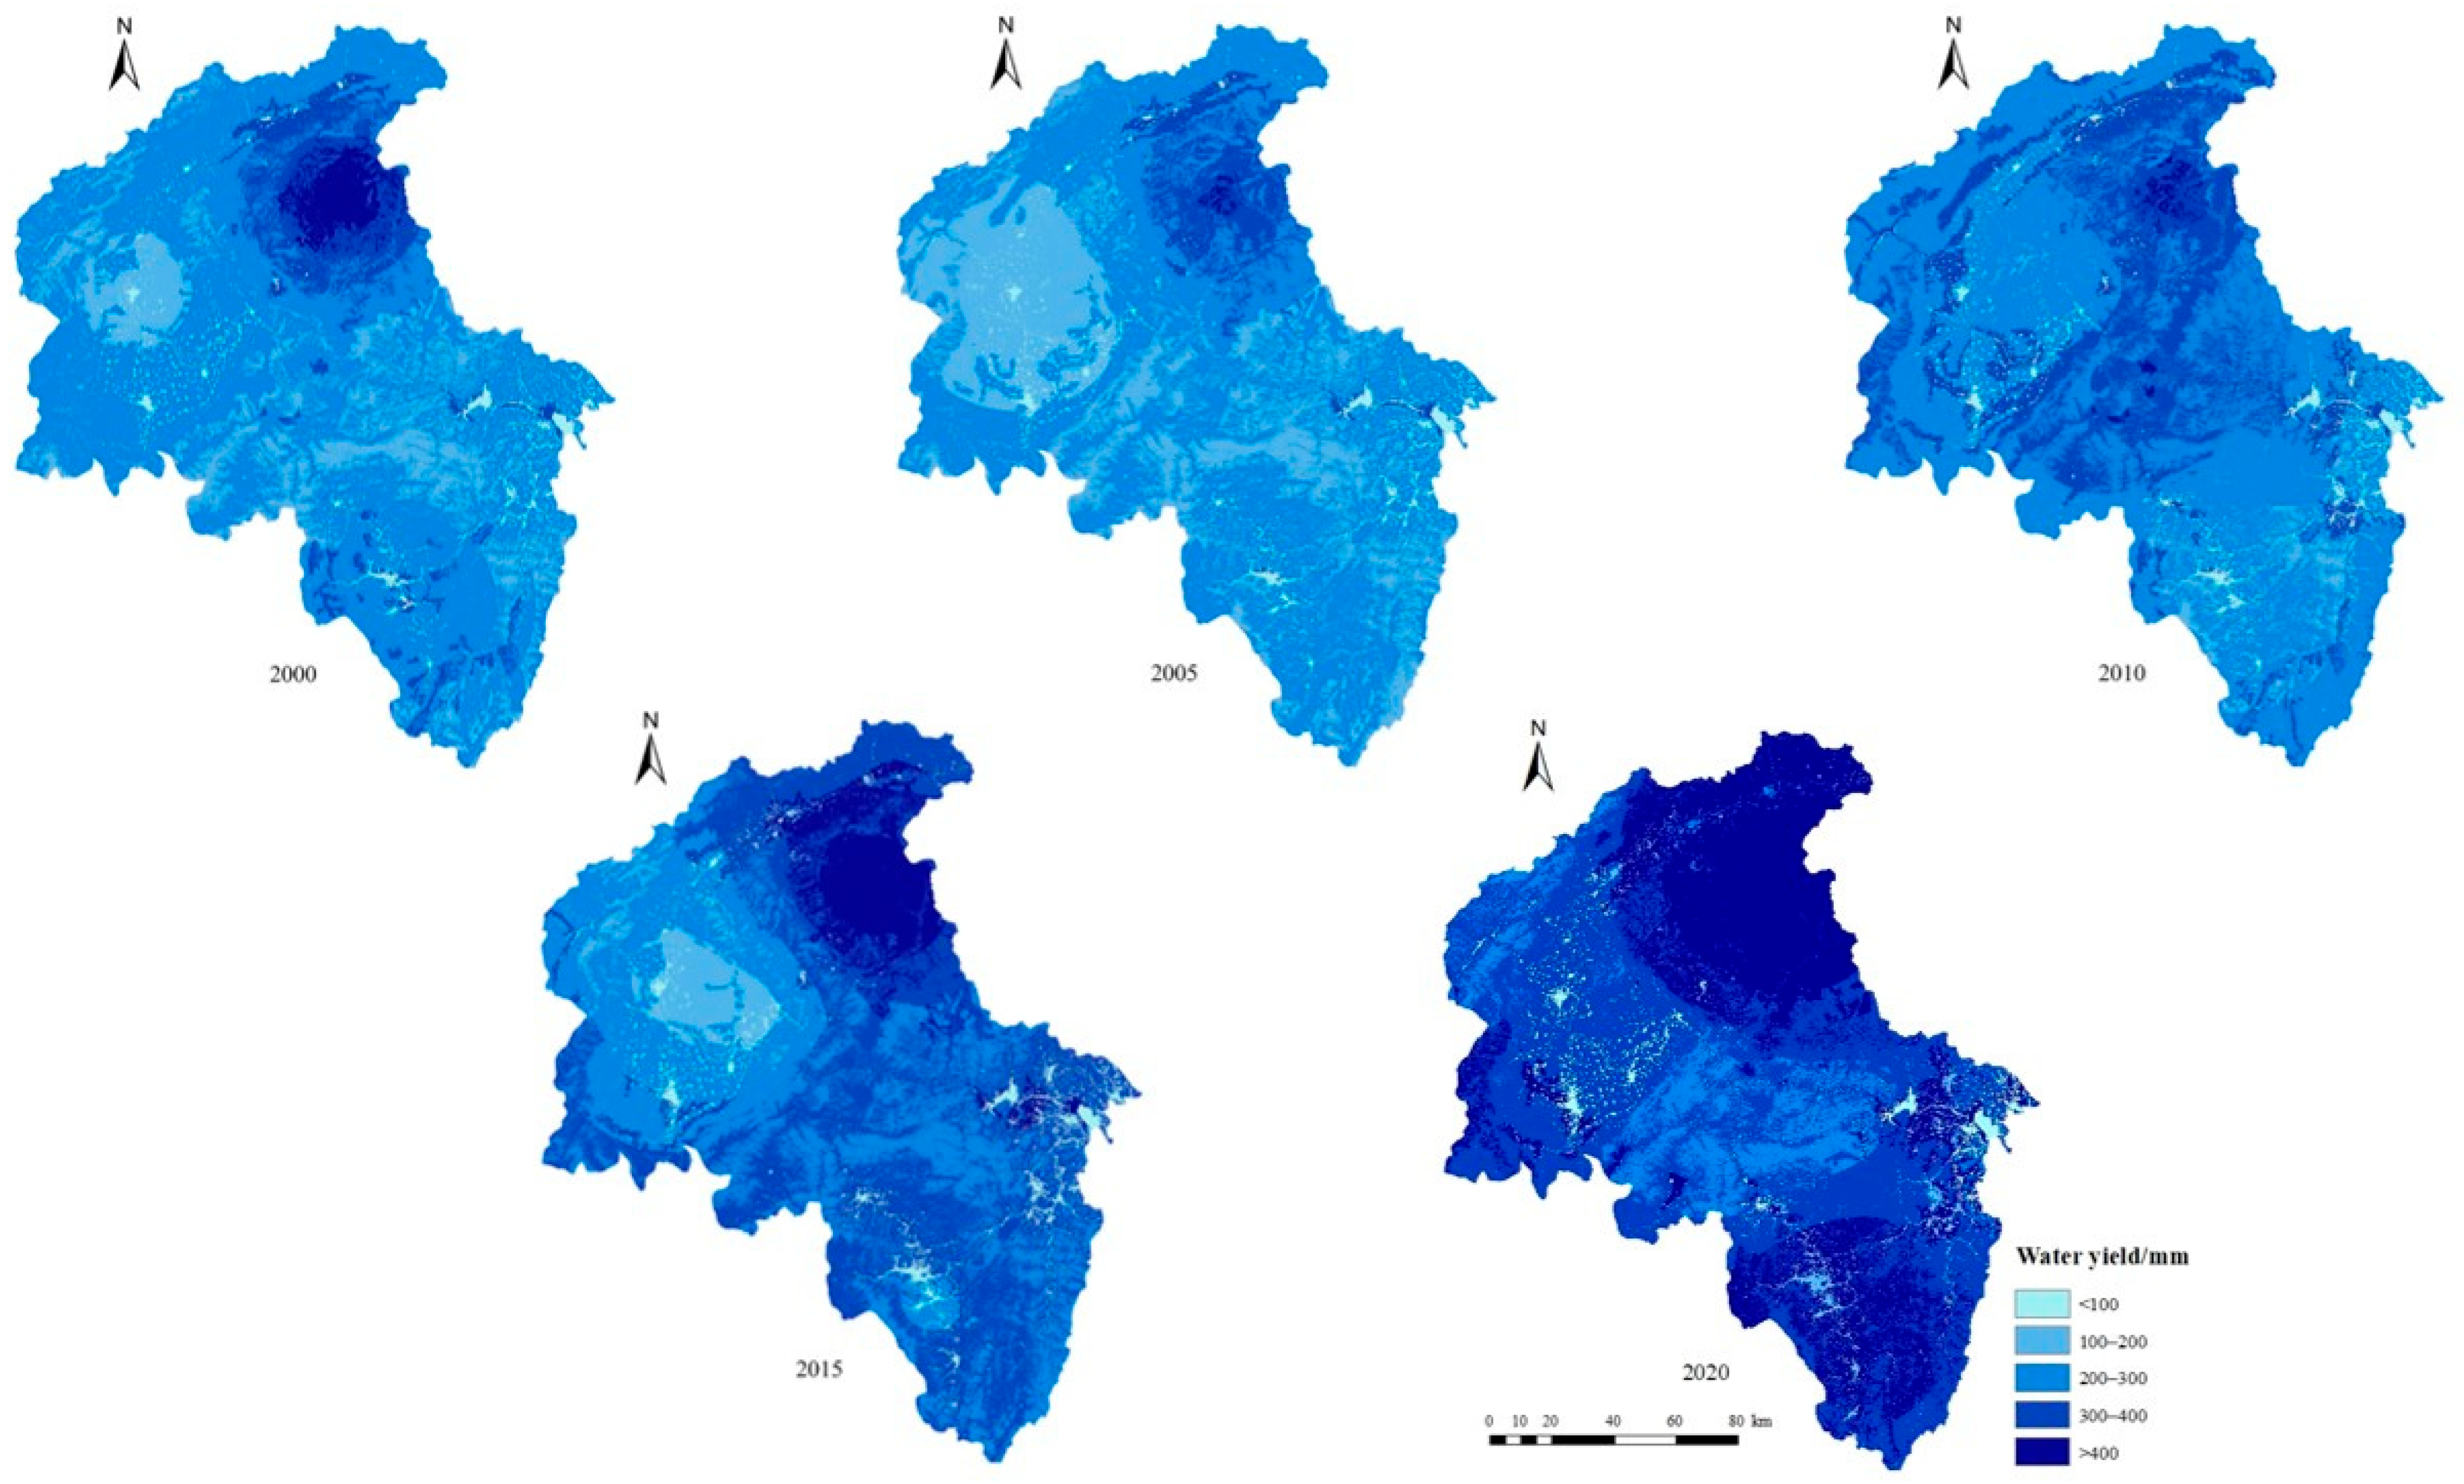
Spatially, there are certain differences in water yield during different years (Figure 3). The water yield was mainly concentrated in the northeast region of the upper reaches of the basin, with the smallest being the northwest and central regions of the upper reaches, which was especially obvious in 2000, 2015 and 2020, while the low water yield in the northwest of the upper reaches increased in 2000, but the spatial difference in water yield decreased in 2010. At the same time, unlike 2000 and 2015, the water yield in the southern region of the basin increased more in 2020 compared to the other years. From the viewpoint of the distribution area of different water yield intervals, the study area was dominated by areas with a water yield of less than 400 mm in each year, which accounted for 60% or more of the study area, among which the distribution area with a water yield of 200–300 mm was the main distribution area from 2000 to 2010, and the distribution area with a water yield of 300–400 mm was greatly increased after 2015, from less than 10% of the distribution area in 2000 to 50% in 2020; in 2020, the area with a water yield greater than 400 mm accounted for 36% of the entire study area. In contrast, the average value of the region with a water yield greater than 400 mm in the whole study area was 1.3% from 2000 to 2010 and 15.2% from 2010 to 2020, inferring that the water yield of the mountainous watershed of the Hutuo River has shown an enlargement of the region with high values in the past 10 years.

3.2. Water Yield Capacity of Different LULC

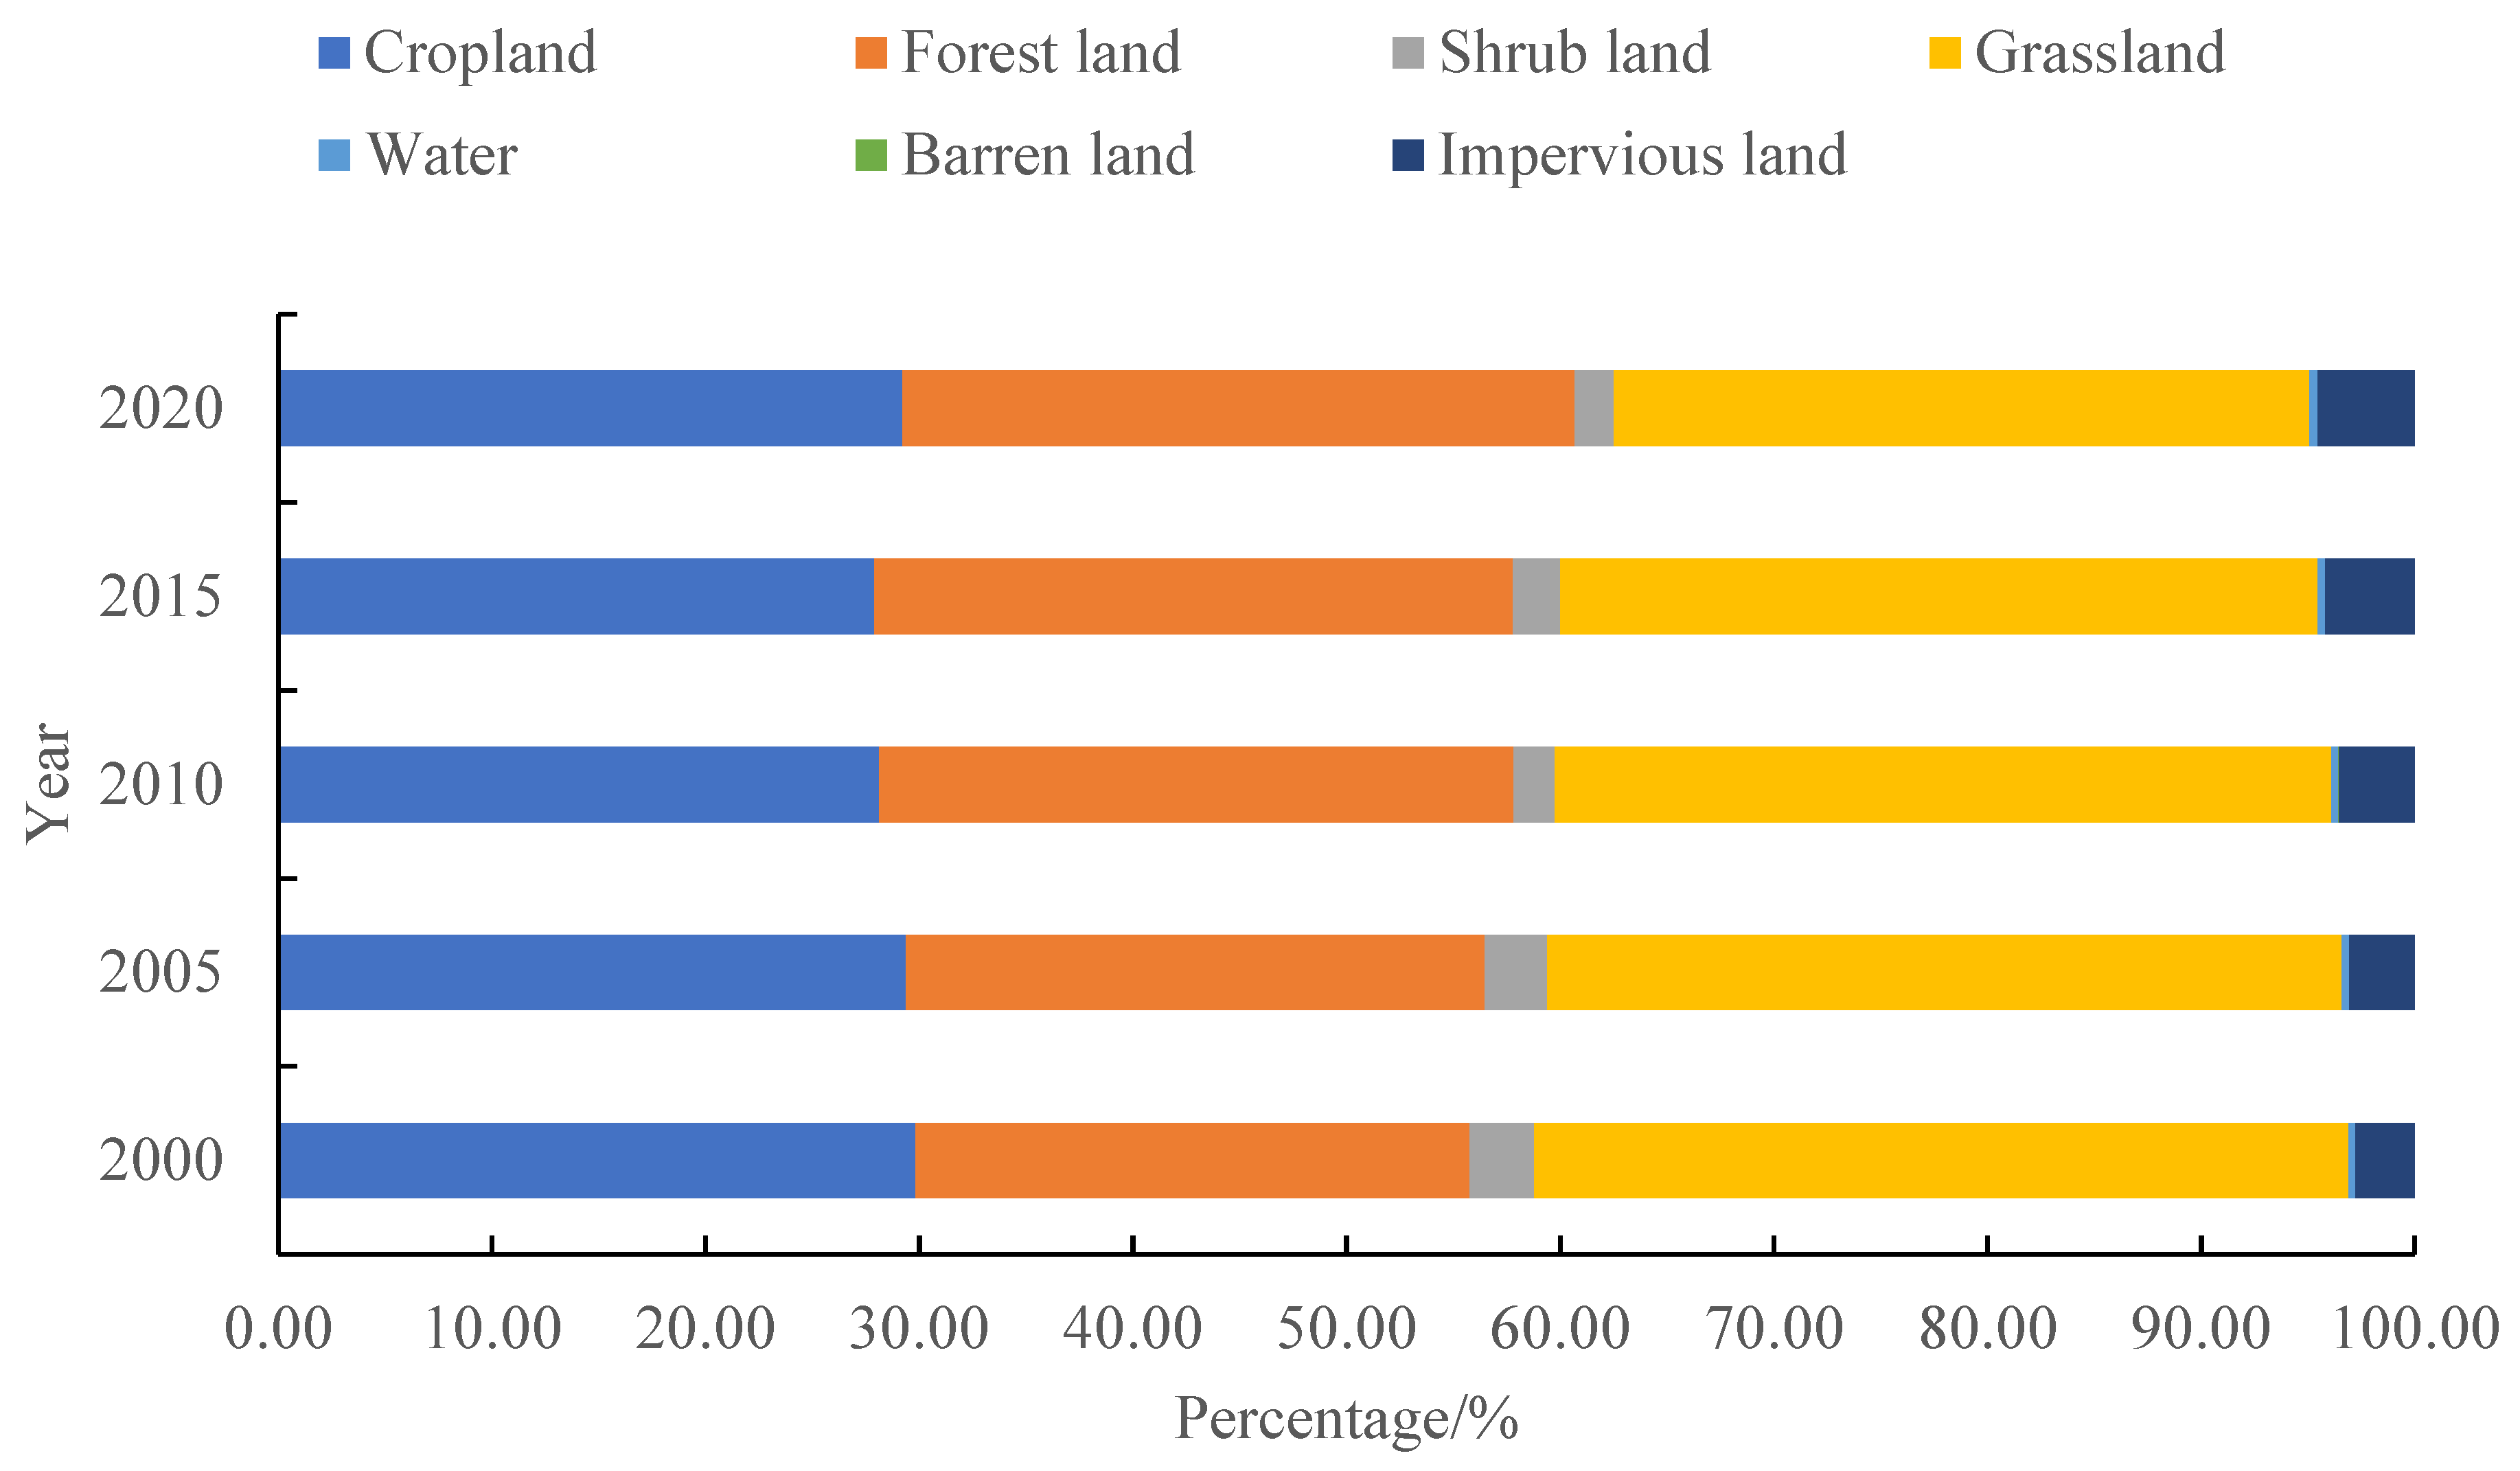
There are seven types of LULC in the study area, including cropland, forest land, shrub land, grassland, water, barren land and impervious land (Figure 4). Among them, the main LULC types are grassland, cropland, and forest land, which account for 94% of the entire study area, while water and barren land account for less than 1% of the entire study area. From 2000 to 2020, the area of cropland remained basically unchanged, at around 28%, with a change rate of 2.1%. Forest land increased slightly year on year, from 26% in 2000 to 31% in 2020, with a growth rate of 21.5%, while grassland decreased slightly year on year, from 38% in 2000 to 33% in 2020, with a reduction rate of 14.6%. It is worth mentioning that although the area of shrub land and impervious land is small, the rate of change in the area occupied by both of them is large from 2000 to 2020, with a decrease rate of 40.3% for shrub land and a growth rate of 64.1% for impervious land. Therefore, from the perspective of the area of different LULC types, the implementation effect of the project involving returning farmland to forest and grassland in the mountainous basin of Hutuo River is not noticeable, and the increase in forest land mainly comes from the transformation of shrub land and grassland.
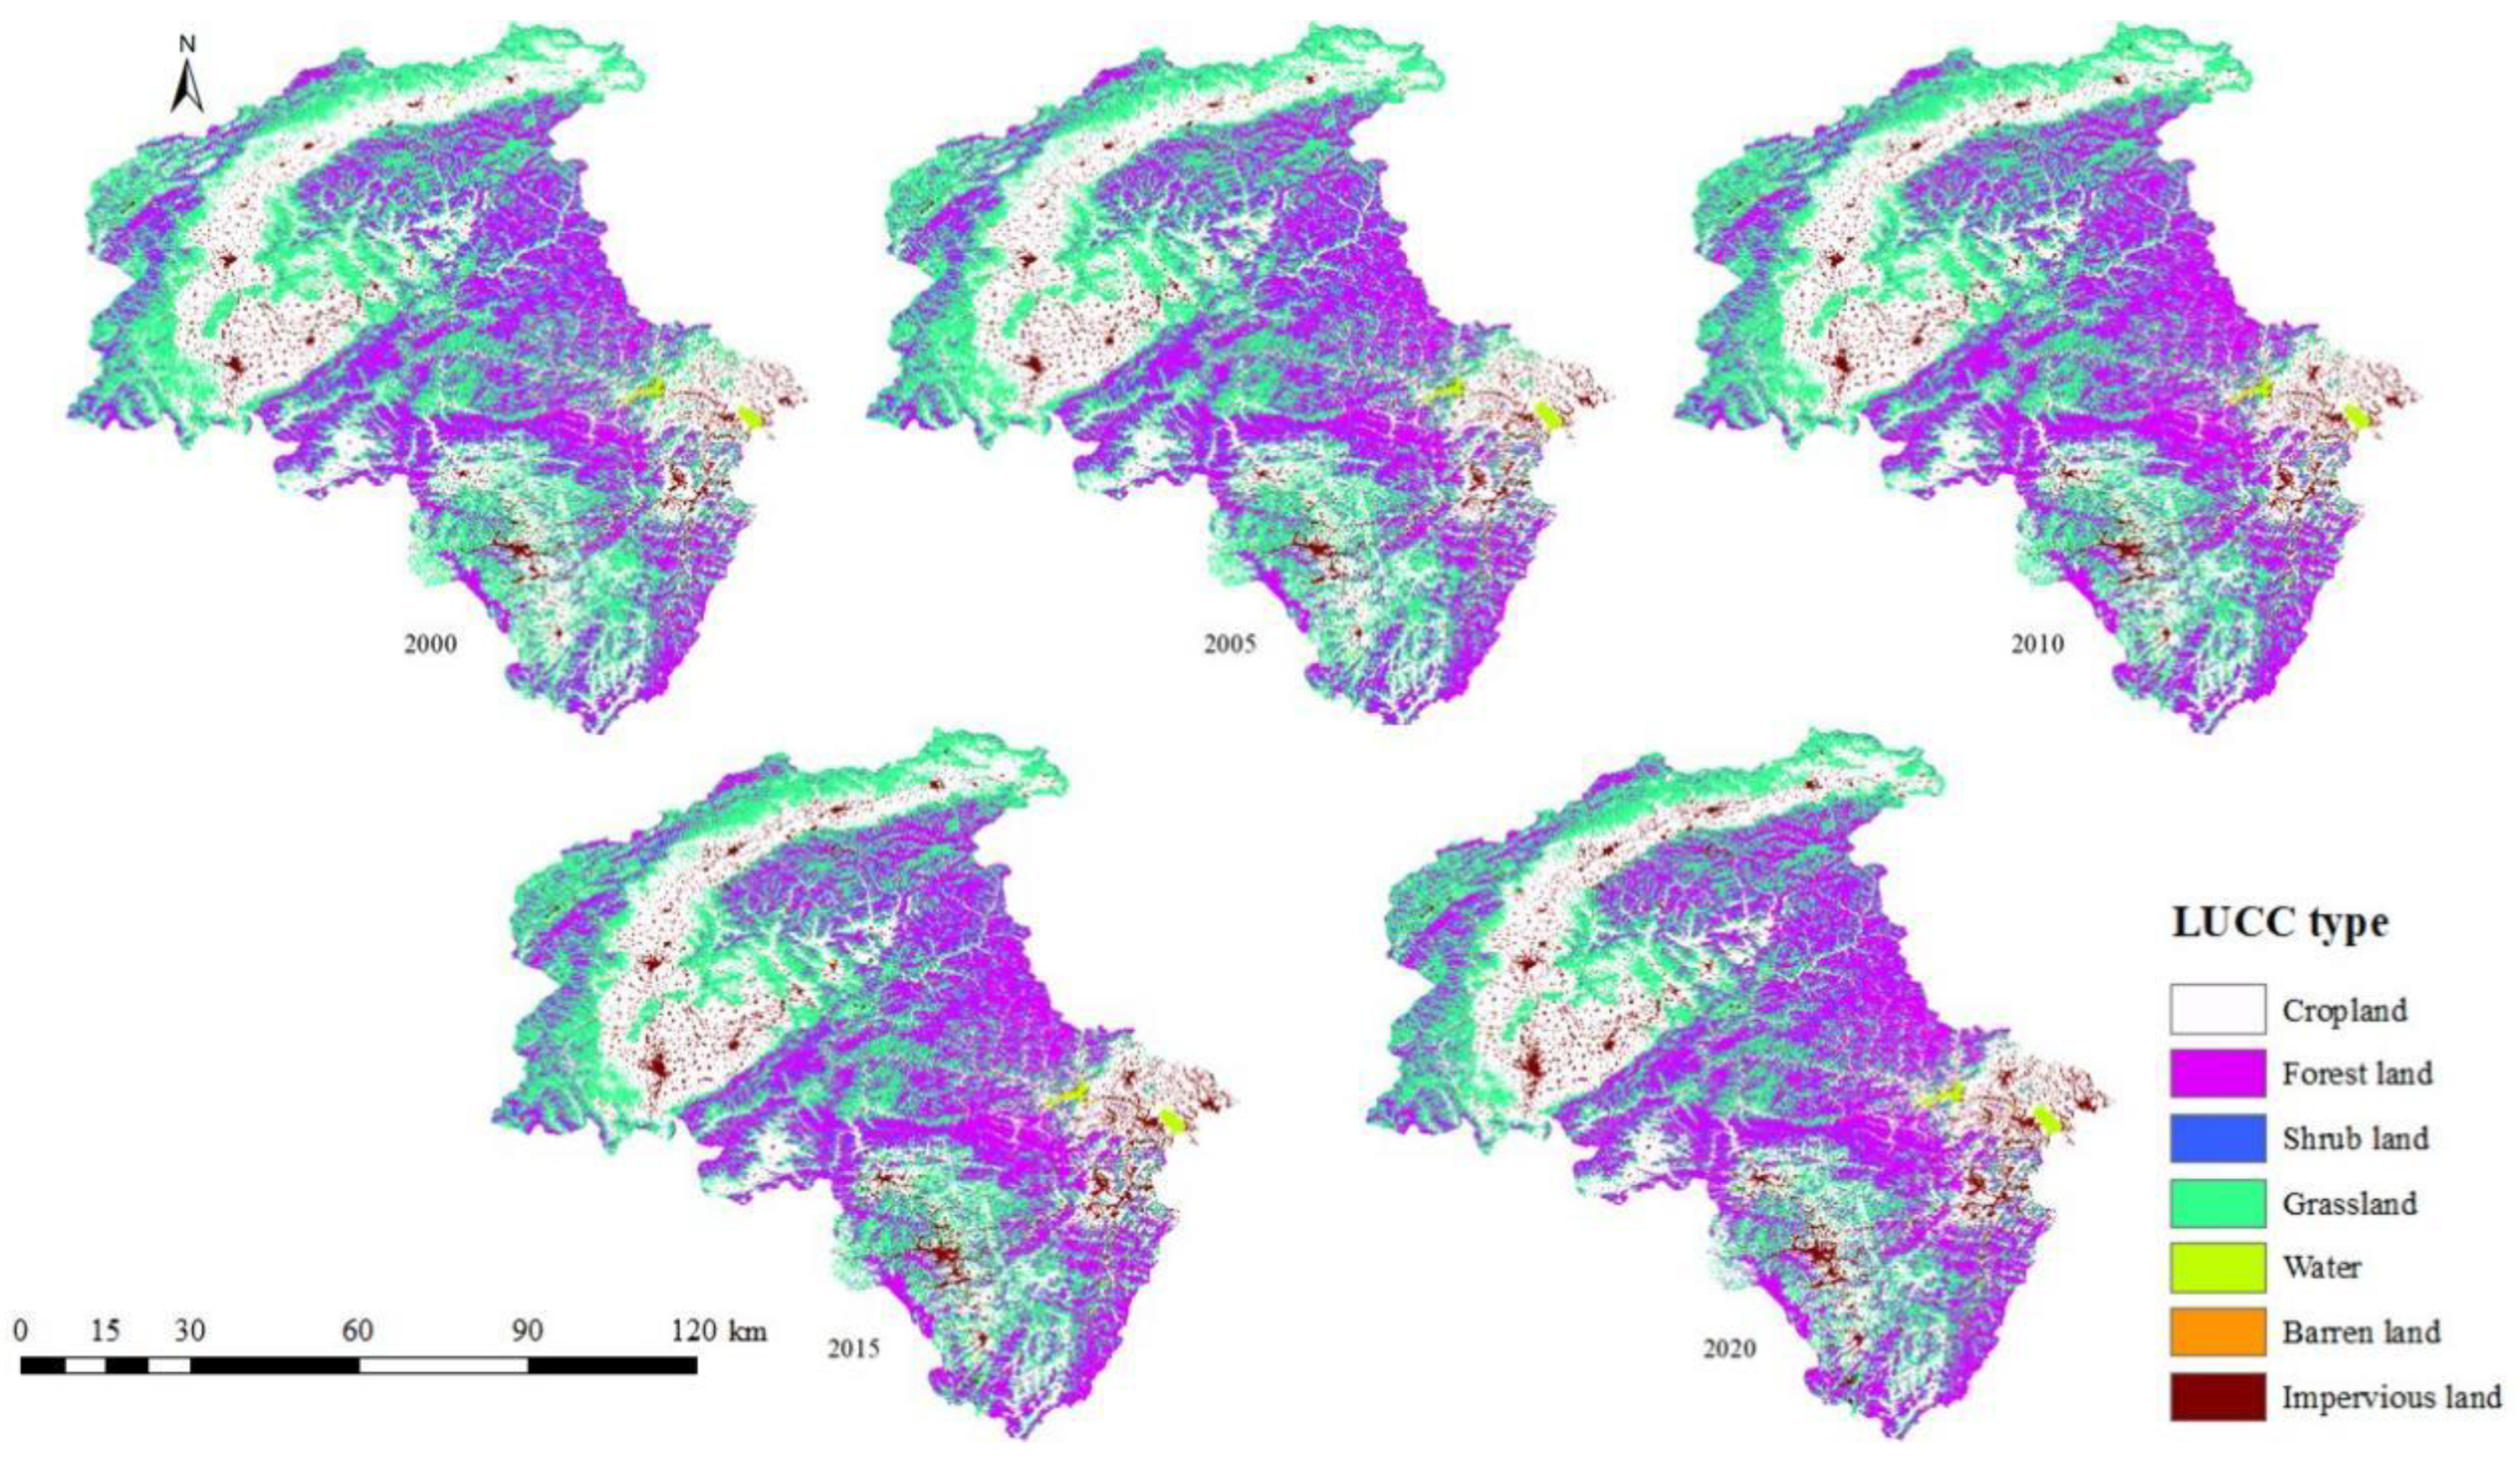
Further, we obtained the spatial distribution of LULC types in each year (Figure 5). It can be seen that from 2000 to 2020, there is no significant difference in the spatial distribution of each LULC type. Cropland is mainly distributed on both sides of the river and beside the reservoirs at the junction of the mountainous areas and the plains. Grassland is distributed along the river in the northern part of the river at higher elevations and in the southwestern part of the watershed. Forest land is mainly located in the eastern and southeastern part of the watershed. Impervious land is patchily distributed in the area where cropland is located, water is shown where the two reservoirs in the basin are located, and the spatial distribution of shrub land and barren land is basically not shown.
Zonal analysis of the water yield for different LULC types in each year (Figure 6) reveals that grassland has the largest water yield capacity, ranging from 244 to 418 mm. This is followed by cropland, shrub land and forest land, while water bodies essentially do not yield water. This distribution is consistent across the years. It is inferred that climate change has basically no effect on the water yield capacity of different LULC types, bringing about changes in the high and low water yield of the same LULC type, especially for barren land and impervious land, where the increase in precipitation in 2020 led to a relatively large increase in the water yield of the two compared to 2000–2010.

3.3. Assessment of the Contribution of Engineering Measures to Water Yield

By converting all sloping cropland greater than 6° to forest land, shrub land and grassland in 2000 and 2015, the distribution of each LULC type under different scenarios in 2000 and 2015 is shown in Figure 7.
As can be seen from Figure 7, for S1, 9.2% of the cropland was converted into forest land in 2000, but the LULC type in the study area was still dominated by grassland, accounting for 38.1% of the total area, followed by forest land, accounting for 35.1%. In 2015, 8.4% of the cropland was converted into forest land, and the LULC type in the study area was mainly forest land, accounting for 38.3% of the total area, followed by grassland, accounting for 35.5%. The simulated water yield capacity in 2000 and 2015 was 243.4 mm and 287.3 mm, which decreased by 5.5 mm and 5.4 mm, respectively, compared with the current scenario in 2000 and 2015 (Table 2).
For S2, 9.2% of the current cropland was converted into shrub land in 2000, and the area occupied by shrub land increased to 12.2%; however, the LULC type in the study area was still dominated by grassland. After the conversion from cropland in 2015, the area occupied by shrub land accounted for 10.4% of the study area, and grasslands were still the dominant LULC type in the study area. The simulation water yield capacities were 243.4 and 287.3 mm in 2000 and 2015, matching those simulated for the S1 scenario, with decreases of 5.5 mm and 5.4 mm relative to the current scenarios in 2000 and 2015, respectively (Table 2).
For S3, grassland occupied 47.3% and 43.9% after the shift in cropland in 2000 and 2015, respectively, and all land use types in the study area were dominated by grassland. The simulated water yield capacities were 249.1 and 293.0 mm in 2000 and 2015, which increased by 0.2 mm and 0.3 mm, respectively, compared with the current scenario in 2000 and 2015 (Table 2).
In summary, it can be seen that the ecological project of returning farmland to forest has a negative impact on the water yield capacity of the Hutuo River mountainous watershed, and there is no difference between the return of forest land and shrub land, whereas the water yield capacity of the Hutuo River mountainous watershed increases after the return of farmland to grassland, but the distribution of cropland is lower in the area with a slope greater than 6° and the area of returning cropland to grassland is relatively small, so the increase in water yield capacity is not significant.
For S4, it can be seen from Figure 5 and Figure 8 that the slopes of the cropland distributed in the river channel are mainly less than 6°, and as a result, all the cropland located in the river channel that is less than or equal to 6° is transformed into water. Consequently, the area of cropland in 2020 changes from 29.2% to 9.40%, and the proportion of water area increases to 20.2%. The simulated water yield capacity in 2020 is 376.4 mm, which is 80.2 mm lower than the current scenario in 2020, and it seems that the water conservancy project of river training has a negative impact on the water yield capacity of the mountainous watershed of the Hutuo River.

4. Discussion

According to the principle of water balance, precipitation and actual evapotranspiration are two important links in determining water yield. In this study, it was found that in the mountainous watershed of the Hutuo River, the grassland ecosystem had the highest water yield with an average value of 313 mm, followed by cropland, with an average value 298 mm, and forestland and shrub land, which had average water yield of 269 mm and 260 mm, respectively. Both forestland and shrub land yields were slightly lower than those of grassland and cropland, and the water yield of each ecosystem was not affected by rainfall during different years. According to Sharp et al. [14], the water yield of different ecosystem types is mainly affected by evapotranspiration, the infiltration process, and water holding patterns. The forest ecosystem redistributes rainfall and reduces surface runoff by retaining precipitation in the forest canopy, absorbing precipitation in the litter layer, and storing and infiltrating precipitation in the soil layer [40], so the water yield is low. The regulatory effect of farmland and grassland ecosystems on rainfall is similar to that of forest ecosystems, but farmland and grassland may each have a lower regulating effect than forests due to plant density and root depth, so the amount of infiltration water in farmland and grassland is less than that of forests, and the water yield is relatively high. This also explains the reasons for the reduction in water yield by transferring farmland to forest under the simulated scenario of returning farmland to forest and grassland, so the formulation of the plan for returning farmland to forest and grassland should take into account the sustainable development of natural ecosystems and the water demand of human activities.
In addition, the comparison of measured runoff from 2000 to 2020 at the basin outlet hydrological station shows that the average runoff coefficient for the basin is only 3.65%, whereas the average runoff coefficient calculated using the water yield obtained from the model was found to be 55.1%. The runoff coefficient is commonly used to indicate how much of the precipitation becomes runoff, and it combines the effects of the natural geographic elements of the watershed on runoff, while the rest of the water is lost to plant retention, puddle filling, infiltration, and evapotranspiration. The reason for such a big difference between the two is that, on one hand, the InVEST model calculates water yield only from precipitation minus part of the evapotranspiration. The model does not differentiate between surface, subsurface and baseflow, while the runoff of the watershed measured by hydrological stations is only the average flow through the control section, and if there is artificial pumping of water upstream of the control section, it will greatly affect the measured flow. However, on the other hand, it also reflects that if there is no interference from human activities, the water yield of the watershed ecosystem in the mountainous watershed of the Hutuo River is considerable under the current climatic conditions. This can also be seen in the simulation of the scenario of returning cropland to water, where the water yield drops significantly after turning the cropland into water, and the anthropogenic river training project produces more water surface evaporation, which has a negative impact on the river’s water yield. Therefore, how to effectively utilize precipitation and improve the effective supply of water resources is the key to the problem.

5. Conclusions

Using the water yield module of the InVEST model, we calculated the spatial and temporal changes in water yield capacity in the mountainous watershed of the Hutuo River from 2000 to 2020, compared and analyzed the differences in water yield of different LULC types, and set scenarios to judge the impact of the project of returning farmland to forest and grassland and water conservancy projects on the water yield of the mountainous watershed of the Hutuo River. The conclusions are as follows: temporally, the water yield in the five study periods was 218.58–376.44 mm, with more obvious interannual variations, of which the largest water yield was in 2020 and the smallest in 2005. The interannual variations in both precipitation and water yield in the mountainous basin of the Hutuo River in the last decade (2010–2020) were large. Spatially, there are certain differences in water yield during different years. The water yield is mainly concentrated in the northeast region of the upper reaches of the basin, and the smallest is the northwest and central regions of the upper reaches. From the perspective of the distribution area of different water yield intervals, the water yield in each year in the study area is mainly less than 400 mm, accounting for more than 60% of the study area, and the water yield in the mountainous watershed of the Hutuo River has shown a large regional expansion in the past 10 years.
The LULC types in the study area include seven categories, and the main LULC types are grassland, cropland and forest land. From 2000 to 2020, the spatial distribution of each LULC type does not vary much, cropland is mainly distributed on both sides of the river and next to the reservoirs at the junction of the mountains and plains, while the grassland is distributed at higher elevations in the north and in the southwestern part of the watershed, and forest land is mainly located in the eastern and southeastern parts of the watershed. As far as water yield capacity is concerned, grassland has the largest water yield capacity of all LULC types, and climate change has basically no effect on the water yield capacity of different land use types.
The ecological project of returning farmland to forestland has a negative impact on the water yield capacity of the mountainous watershed of the Hutuo River, and there is no difference between forestland and shrub land, whereas the water yield capacity of the mountainous watershed of the Hutuo River has been increased after returning farmland to grassland. The water conservancy project of river training has a negative impact on the water yield capacity of the Hutuo River mountainous basin.

Author Contributions

Data curation, M.S., J.Z., Y.Z. and R.Z.; Writing—original draft, X.H.; Writing—review & editing, H.Y.; Project administration, J.C.; Funding acquisition, L.M. All authors have read and agreed to the published version of the manuscript.

Funding

This work was supported by the Science &Technology Fundamental Resources Investigation Program (2022FY100104), the National Natural Science Foundation of China (42371048), the Natural Science Foundation of Hebei Province (D2021503001), the Science and Technology Program of Hebei Academy of Sciences (23104, 24104) and the Hebei Academy of Sciences High-level Talent Cultivation and Sponsorship Program (2023G01).

Data Availability Statement

Data will be made available on the request.

Conflicts of Interest

The authors declare that they have no known competing financial interests or personal relationships that could have appeared to influence the work reported in this paper.

References

  1. Xu, J.; Wang, C.; Li, W.; Zuo, J. Multi-temporal scale modeling on climatic-hydrological processes in data-scarce mountain basins of Northwest China. Arab. J. Geosci. 2018, 11, 423. [Google Scholar] [CrossRef]
  2. Schröeter, D.; Cramer, W.; Leemans, R.; Prentice, I.C.; Araújo, M.B.; Arnell, N.W.; Bondeau, A.; Bugmann, H.; Carter, T.R.; Gracia, C.A.; et al. Ecosystem service supply and vulnerability to global change in Europe. Science 2005, 310, 1333–1337. [Google Scholar] [CrossRef] [PubMed]
  3. Wang-Erlandsson, L.; Tobian, A.; van der Ent, R.J.; Fetzer, I.; te Wierik, S.; Porkka, M.; Staal, A.; Jaramillo, F.; Dahlmann, H.; Singh, C.; et al. A planetary boundary for green water. Nat. Rev. Earth Environ. 2022, 3, 380–392. [Google Scholar] [CrossRef]
  4. Bastian, O.; Grunewald, K.; Syrbe, R.-U. Space and time aspects of ecosystem services, using the example of the EU Water Framework Directive. Ecosyst. People 2012, 8, 5–16. [Google Scholar] [CrossRef]
  5. Xia, X.; Yang, Z.; Wu, Y. Incorporating eco-environmental water requirements in integrated evaluation of water quality and quantity—A study for the Yellow River. Water Resour. Manag. 2009, 23, 1067–1079. [Google Scholar] [CrossRef]
  6. Bai, Y.; Ochuodho, T.O.; Yang, J. Impact of land use and climate change on water-related ecosystem services in Kentucky, USA. Ecol. Indic. 2019, 102, 51–64. [Google Scholar] [CrossRef]
  7. Wang, H.; Wang, W.J.; Liu, Z.; Wang, L.; Zhang, W.; Zou, Y.; Jiang, M. Combined effects of multi-land use decisions and climate change on water-related ecosystem services in Northeast China. J. Environ. Manag. 2022, 315, 115131. [Google Scholar] [CrossRef]
  8. Jansson, Å.; Folke, C.; Rockström, J.; Gordon, L.; Falkenmark, M. Linking freshwater flows and ecosystem services appropriated by people: The case of the baltic sea drainage basin. Ecosystems 1999, 2, 351–366. [Google Scholar] [CrossRef]
  9. Brauman, K.A.; Daily, G.C.; Duarte, T.K.; Mooney, H.A. The nature and value of ecosystem services: An overview highlighting hydrologic services. Annu. Rev. Environ. Resour. 2007, 32, 67–98. [Google Scholar] [CrossRef]
  10. Liu, Y.; Yang, Y.; Wang, Z.; An, S. Quantifying water provision service supply, demand, and spatial flow in the Yellow River Basin. Sustainability 2022, 14, 10093. [Google Scholar] [CrossRef]
  11. Liang, J.; Li, S.; Li, X.; Li, X.; Liu, Q.; Meng, Q.; Lin, A.; Li, J. Trade-off analyses and optimization of water-related ecosystem services (WRESs) based on land use change in a typical agricultural watershed, southern China. J. Clean. Prod. 2021, 279, 123851. [Google Scholar] [CrossRef]
  12. Xia, H.; Kong, W.; Zhou, G.; Sun, O.J. Impacts of landscape patterns on water-related ecosystem services under natural restoration in Liaohe River Reserve, China. Sci. Total Environ. 2021, 792, 148290. [Google Scholar] [CrossRef]
  13. Long, D.; Longuevergne, L.; Scanlon, B.R. Uncertainty in evapotranspiration from land surface modeling, remote sensing, and GRACE satellites. Water Resour. Res. 2014, 50, 1131–1151. [Google Scholar] [CrossRef]
  14. Sharp, R.; Tallis, H.T.; Ricketts, T.; Guerry, A.D.; Wood, S.A.; Chapin-Kramer, R.; Nelson, E.; Ennaanay, D.; Wolny, S.; Olwero, N.; et al. InVEST 3.2.0 User‘s Guide; The Natural Capital Project, Stanford University, University of Minnesota, The Nature Conservancy, and World Wildlife Fund: San Francisco, CA, USA, 2015. [Google Scholar]
  15. Dennedy-Frank PJMuenich RLChaubey, I.; Ziv, G. Comparing two tool for ecosystem service assessments regarding water resources decisions. J. Environ. Manag. 2016, 177, 331–340. [Google Scholar] [CrossRef]
  16. Balist, J.; Malekmohammadi, B.; Jafari, H.R.; Nohegar, A.; Geneletti, D. Modeling the supply, demand, and stress of water resources using ecosystem services concept in Sirvan River Basin (Kurdistan-Iran). Water Supply 2022, 22, 2816–2831. [Google Scholar] [CrossRef]
  17. Foley, J.A.; DeFries, R.; Asner, G.P.; Barford, C.; Bonan, G.; Carpenter, S.R.; Chapin, F.S.; Coe, M.T.; Daily, G.C.; Gibbs, H.K.; et al. Global consequences of land use. Science 2005, 309, 570–574. [Google Scholar] [CrossRef]
  18. Vörösmarty, C.J.; Green, P.; Salisbury, J.; Lammers, R.B. Global water resources: Vulnerability from climate change and population growth. Science 2000, 289, 284–288. [Google Scholar] [CrossRef]
  19. Dai, A. Drought under global warming: A review. Wiley Interdiscip. Rev. Clim. Chang. 2011, 2, 45–65. [Google Scholar] [CrossRef]
  20. Trenberth, K.E. Changes in precipitation with climate change. Clim. Res. 2011, 47, 123–138. [Google Scholar] [CrossRef]
  21. Jayakrishnan, R.; Srinivasan, R.; Santhi, C.; Arnold, J.G. Advances in the application of the SWAT model for water resources management. Hydrol. Process. 2005, 19, 749–762. [Google Scholar] [CrossRef]
  22. Thompson, J.R.; Sorenson, H.R.; Gavin, H.; Refsgaard, A. Application of the coupled MIKE SHE/MIKE 11 modelling system to a lowland wet grassland in southeast England. J. Hydrol. 2004, 293, 151–179. [Google Scholar] [CrossRef]
  23. Markstrom, S.L.; Niswonger, R.G.; Regan, R.S.; Prudic, D.E.; Barlow, P.M. GSFLOW—Coupled ground-water and surface-water flow model based on the integration of the Precipitation-Runoff Modeling System (PRMS) and the Modular Ground-Water Flow Model (MODFLOW-2005). In US Geological Survey Techniques and Methods; Techniques and Methods 6–D1; U.S. Geological Survey: Reston, VA, USA, 2008; 240p. [Google Scholar]
  24. Liu, W.; Park, S.; Bailey, R.T.; Molina-Navarro, E.; Andersen, H.E.; Thodsen, H.; Nielsen, A.; Jeppesen, E.; Jensen, J.S.; Trolle, D.; et al. Quantifying the streamflow response to groundwater abstractions for irrigation or drinking water at catchment scale using SWAT and SWAT–MODFLOW. Environ. Sci. Eur. 2020, 32, 113. [Google Scholar] [CrossRef]
  25. Khan, M.A.; Stamm, J. Assessment of the hydrological and coupled soft computing models, based on different satellite precipitation datasets, to simulate streamflow and sediment load in a mountainous catchment. J. Water Clim. Chang. 2023, 14, 610–632. [Google Scholar] [CrossRef]
  26. Zhang, C.Q.; Li, W.H.; Zhang, B.; Liu, M.C. 2012 Water yield of Xitiaoxi River basin based on InVEST modeling. J. Resour. Ecol. 2012, 3, 50–54. [Google Scholar]
  27. Hamel, P.; Chaplin-Kramer, R.; Sim, S.; Mueller, C. A new approach to modeling the sediment retention service (InVEST 3.0): Case study of the Cape Fear catchment, North Carolina, USA. Sci. Total Environ. 2015, 524, 166–177. [Google Scholar] [CrossRef]
  28. Cong, W.; Sun, X.; Guo, H.; Shan, R. Comparison of the SWAT and InVEST models to determine hydrological ecosystem service spatial patterns, priorities and trade-offs in a complex basin. Ecol. Indic. 2020, 112, 106089. [Google Scholar] [CrossRef]
  29. Viviroli, D.; Kummu, M.; Meybeck, M.; Kallio, M.; Wada, Y. Increasing dependence of lowland populations on mountain water resources. Nat. Sustain. 2020, 3, 917–928. [Google Scholar] [CrossRef]
  30. Liniger, H.; Weingartner, R. Mountains and Freshwater Supply. Environmental Science, Geography. 1998, 195. Available online: https://www.fao.org/4/w9300e/w9300e08.htm (accessed on 13 September 2024).
  31. Vörösmarty, C.J.; McIntyre, P.B.; Gessner, M.O.; Dudgeon, D.; Prusevich, A.; Green, P.; Glidden, S.; Bunn, S.E.; Sullivan, C.A.; Liermann, C.R.; et al. Global threats to human water security and river biodiversity. Nature 2010, 467, 555–561. [Google Scholar] [CrossRef]
  32. Liu, L.; Wang, Z.; Wang, Y.; Zhang, Y.; Shen, J.; Qin, D.; Li, S. Trade-off analyses of multiple mountain ecosystem services along elevation, vegetation cover and precipitation gradients: A case study in the Taihang Mountains. Ecol. Indic. 2019, 103, 94–104. [Google Scholar] [CrossRef]
  33. Liu, M.; Pei, H.; Shen, Y. Evaluating dynamics of GRACE groundwater and its drought potential in Taihang Mountain Region, China. J. Hydrol. 2022, 612, 128156. [Google Scholar] [CrossRef]
  34. National Forestry and Grassland Administration. White Book, Twenty Years of Returning Farmland to Forest and Grassland in China (1999–2019); Chinese National Forestry and Grassland Administration: Beijing, China, 2020. [Google Scholar]
  35. Cheng, S.; Wang, H.; Liu, J. Variation of runoff in Hutuo River. South-North Water Transf. Water Sci. Technol. 2014, 12, 96–99. [Google Scholar]
  36. Tian, F.; Yang, Y.; Han, S. Using runoff slope-break to determine dominate factors of runoff decline in Hutuo River Basin, North China. Water Sci. Technol. 2009, 60, 2135–2144. [Google Scholar] [CrossRef]
  37. Natural Capital Project. InVEST 3.14.1; Stanford University, University of Minnesota, Chinese Academy of Sciences, The Nature Conservancy, World Wildlife Fund, Stockholm Resilience Centre and the Royal Swedish Academy of Sciences: San Francisco, CA, USA, 2023. [Google Scholar]
  38. Droogers, P.; Allen, R.G. Estimating reference evapotranspiration under inaccurate data conditions. Irrig. Drain. Syst. 2002, 16, 33–45. [Google Scholar] [CrossRef]
  39. Donohue, R.J.; Roderick, M.L.; McVicar, T.R. Roots, storms and soil pores: Incorporating key ecohydrological processes into Budyko’s hydrological model. J. Hydrol. 2012, 436–437, 35–50. [Google Scholar] [CrossRef]
  40. Hou, G.R.; Bi, H.J.; Wei, X.; Zhou, Q.Z.; Kong, L.X.; Wang, J.S.; Jia, J.B. Deadfall and soil water-holding functions of three types of woodlands in loess plateau gully areas. J. Soil Water Conserv. 2018, 32, 357–371. [Google Scholar]
Figure 1. Location of the study area.
Water 16 02900 g001
Figure 2. Changes in water yield and precipitation in the study area during the five study periods from 2000 to 2020.
Water 16 02900 g002
Figure 3. Spatial distribution of water yield in the study area during the five study periods from 2000 to 2020.
Water 16 02900 g003
Figure 4. Temporal changes in LUCC in the study area during the five study periods from 2000 to 2020.
Water 16 02900 g004
Figure 5. Spatial distribution of LULC in the study area during the five study periods from 2000 to 2020.
Water 16 02900 g005
Figure 6. Water yield of different LULC types in the study area during the five study periods from 2000 to 2020.
Water 16 02900 g006
Figure 7. Proportion of LULC types under different scenarios in the study area in 2000 and 2015.
Water 16 02900 g007
Figure 8. Spatial distribution of slope and river in the study area.
Water 16 02900 g008
Table 1. Scenario settings and descriptions.
Scenario SimulationScenario Description
Ecological scenarioCurrent scenarioLULC in 2000 and 2015
S1Turn cropland into forest land
S2Turn cropland into shrub land
S3Turn cropland into grassland
Water conservancy scenarioCurrent scenarioLULC in 2020
S4Turn cropland into water
Table 2. Water yield capacity in 2000 and 2015 under different ecological scenarios (mm).
Type of Scenario20002015
Current248.9292.7
S1243.4287.3
S2243.4287.3
S3249.1293.0
Disclaimer/Publisher’s Note: The statements, opinions and data contained in all publications are solely those of the individual author(s) and contributor(s) and not of MDPI and/or the editor(s). MDPI and/or the editor(s) disclaim responsibility for any injury to people or property resulting from any ideas, methods, instructions or products referred to in the content.