Article

Study on the Optimization of Wujiang’s Water Resources by Combining the Quota Method and NSGA-II Algorithm

1
Changjiang Survey, Planning, Design and Research Co., Ltd., Wuhan 430010, China
2
School of Naval Architecture and Civil Engineering, Jiangsu University of Science and Technology, Zhangjiagang 215600, China
3
School of Hydrology and Water Resources, Nanjing University of Information Science and Technology, Nanjing 210044, China
4
China Institute of Water Resources and Hydropower Research (IWHR), Beijing 100038, China
*
Authors to whom correspondence should be addressed.
Water 2024, 16(2), 359; https://doi.org/10.3390/w16020359
Submission received: 1 December 2023 / Revised: 28 December 2023 / Accepted: 18 January 2024 / Published: 22 January 2024

Abstract

:
Recently, the Chinese government has implemented stringent water requirements based on the concept of ‘Basing four aspects on water resources’. However, existing research has inadequately addressed the constraints of water resources on population, city boundaries, land, and production, failing to adequately analyze the interplay between water resource limitations and urban development. Recognizing the interconnectedness between urban water use and economic development, a multi-objective model becomes crucial for optimizing urban water resources. This study establishes a nonlinear multi-objective water resources joint optimization model, aligning with the “Basing four aspects on water resources” requirement to maximize urban GDP and minimize total water use. A genetic algorithm (NSGA-II Algorithm) is applied to solve this complex nonlinear multi-objective model and obtain the Pareto solution set, addressing information loss inherent in the traditional water quota method. The model was tested in Wujiang District, an area located in China’s Jiangsu Province that has been rapidly urbanizing over the past few decades, and yielded 50 non-inferior water resource optimization schemes. The results reveal that the Pareto solution set visually illustrates the competition among objectives and comprehensively displays the interplay between water and urban development. The model takes a holistic approach to consider the relationships between water resources and urban population, land use, and industries, clearly presenting their intricate interdependencies. This study serves as a valuable reference for the rational optimization of water resources in urban development.

1. Introduction

As a major component of water resource planning, water demand forecasting is crucial in guiding the allocation and utilization of regional water resources [1]. Water demand forecasting is primarily used to determine regional water resource needs during different periods to scientifically develop water resource planning schemes [2]. In recent years, with the rapid development of industrialization and urbanization in China, there has been a significant shift in water use methods and structure. This change has led to increasing problems of water scarcity and pollution. In 2012, the Chinese government introduced the “Opinions on Implementing the Strictest Water Resources Management System” [3], aimed at controlling overall water use, improving water use efficiency, and enhancing the water environment in China. However, as China’s industrialization and urbanization progress, the contradictions between water and urban population, agricultural land, city scale, and industrial development remain severe. In 2021, the “basing four aspects on water resources” control strategy was proposed by the Chinese government. This concept implies that the growth in urban population, city scale, agricultural land use, and urban industrial development should be matched with the local water resource situation. The core of this strategy is “defining city, land, population, and production with water”. It establishes the regionally available water quantity as the primary rigid constraint, optimizing allocating limited water resources to various water users. By controlling the total consumption and intensity of water resources, this strategy addresses bottlenecks caused by water scarcity, aiming to sustain regional ecological conservation and foster economic and social development within the limits of finite water resources. This strategy will guide China in formulating regional water resource planning and future water resource demand predictions [4]. Therefore, improving the accuracy and scientific nature of water resource demand forecasting is a critical issue currently faced by water resource planning in China.
Currently, the most commonly used methods for water demand forecasting in water resource planning include the water quota method, macroeconomic model, regression model, and artificial neural network (ANN) model [5,6]. The water quota method is the primary approach currently used for water demand forecasting in China [1,7]. This method involves forecasting future changes in agriculture, industry, and residential water quotas based on existing norms and predicting changes in the economy’s industrial structure. It analyzes the future water use variations across various industries, residents, and ecologies. Shi Jiao et al. used the per capita and comprehensive water quotas to forecast the rural and urban domestic water demand in Taigu District, Shanxi [8]. Similarly, Yang Lianhai employed the comprehensive water quota method to predict the domestic water demand in Ganzhou District, Zhangye, Gansu [9]. The advantage of the water quota method is its simplicity and ease of calculation, with relatively low data requirements. Although this method considers factors such as total water use and water efficiency when forecasting water demand, it overlooks the interplay between economic development and water use constraints.
The macroeconomic model method utilizes models like input–output and computable general equilibrium models to establish relationships between water and industry and residential demand within a specific region. These models make future predictions of regional industrial development and residents’ income, and changes in regional water demand are observed. This method is generally suitable for long-term simulations. Lenzen et al. utilized the input–output model to forecast water use in Australia [10]. Their results indicated that if Australia’s population grows to 25 million by 2050 and per capita expenditure doubles, the annual water demand would increase by more than double. Hassan et al. employed the Computable General Equilibrium (CGE) model to study the impact of selected macroeconomic and water resource-related policy reforms on water resource use and distribution in South Africa [11]. The advantage of the macroeconomic model lies in its consideration of various aspects of economic development, leading to more accurate regional economic forecasts. The relationship between industries, residents, and water in the model is also more in line with the actual water use scenario. However, a drawback is that the model requires complex data and sophisticated statistical analysis.
The regression model uses historical data to predict future trends, cyclical patterns, and seasonal variations [12,13,14]. The regression model primarily encompasses linear and nonlinear models. Wang et al., integrating grey correlation analysis and multiple linear regression models, have considered the interactions among socio-economic factors, water resources, and water environment. They quantitatively predicted the water supply and demand for different planning years in the Changji Economic Circle in Northeast China [15]. Haque et al., using data from the city of Aquidauana in Brazil, explored the application of Independent Component Regression (ICR) technology in mid-term urban water demand forecasting. The study also compared the performance of the ICR model with traditional Multiple Linear Regression models [16]. The linear regression model is good at capturing and exploiting seasonal, climate, and policy characteristics in the data, and model parameters can be adjusted to accommodate various types of data [17,18]. However, a sufficiently long time series is required to ensure the model can learn the data’s inherent structure. The artificial neural network (ANN) model, a nonlinear regression model based on machine learning, can simulate the structure and functions of the human brain biologically using computers and is widely used in water demand forecasting [19,20]. The literature on water demand forecasting using the ANN model frequently evaluates the predictive performance between regression and neural network models [21,22,23,24,25,26,27,28]. Awad et al. employed two practical ANN models to forecast the future water demand of Jenin City in Palestine, achieving relatively accurate predictions [29]. Adamowski et al. compared multivariate linear regression, time series analysis, and ANN forecasting models to analyze Ottawa, Canada’s water demand data. The results indicated that the ANN model was more effective in predicting peak daily water demand during the summer than multivariate linear regression and time series analysis [30]. The ANN model, however, is relatively complex and demands high-quantity data. Therefore, it is primarily suitable for short-term simulations. Additionally, combining multiple methods can improve accuracy and robustness [31]. For example, integrating regression models with machine learning models [32] or combining traditional statistical models with ANNs can improve the precision and robustness of forecasts [33].
All the methods above provide essential means for water demand forecasting. Unfortunately, these methods usually only yield a fixed set of solutions, and it is difficult to provide comprehensive optimal results for urban water use and urban development. The essence of “basing four aspects on water resources” is long-term water demand forecasting under multiple constraints. Several optimization methods, such as the Non-dominated Sorting Genetic Algorithm II (NSGA-II), can effectively solve multiple objective equations. In this study, we combine the NSGA-II with an elite strategy and the quota method to consider the water demand based on actual behavior and multi-objective optimization needs and provide a more comprehensive and practical forecast, and a series of solution sets can be obtained that harmonize economic development requirements and water use requirements. Additionally, obtaining optimal solutions under given boundary conditions and constraints can enhance the accuracy and adaptability of the forecast. This approach offers a more flexible and comprehensive decision-support tool for scientifically formulating water resource planning schemes under the “basing four aspects on water resources” policy.

2. Materials and Methods

2.1. Water Quota Model

The water quota model predicts future water use for different industries, residential living, and ecological uses based on the specific water quotas for these categories and the future development trends of each industry and population. It uses the official published industrial and residential water quotas as a basis. It forecasts future water quotas and industrial situations based on long-term regional water use trends and national or regional development plans. This combination ultimately calculates the total regional water use for the planning year.
Q i = i = 1 T e i × V i
where ei represents the water use per unit area for agriculture (m3/hm2) or per CNY 10,000 of value-added for industry or services (m3/CNY 10,000) and residents’ water quota (m3/capita); Vi is the agricultural land area (hm2), industrial or the tertiary industry value-added, and population number.
This paper calculates ecological water use outside river channels (water for urban greening, road sprinkling) as 0.15 times the water used for services and residents.
Q e = 0.15 × V 3 × e 3 + n × e 4
where V3 represents the value-added of the service industry, e3 is the water use efficiency of the service industry, n is the number of people, and e4 is the residential water quota.
Based on the water quota model, the ranges of each decision variable can be determined. These ranges serve as data inputs for the multi-objective genetic algorithm (MOGA).

2.2. NAGA-II Model

2.2.1. Decision Variables

This model aims to optimize the total water use and water use efficiency of different regional industries for the planning year. The decision variables include the secondary industry and tertiary industry value-added (V1, V2, and V3), the secondary industry and tertiary industry water use efficiency (e2, e3), residential water use efficiency (e4), population (n), agricultural irrigation area (A), and water use per unit area of agriculture (e1).

2.2.2. Objective Function

(1)
Regional Gross Domestic Product
The superficial meaning of “Basing four aspects on water resources” is to treat water resources as the primary constraint, keeping urban scale and industrial development within the carrying capacity of water resources. However, the core objective is not to restrict the growth of cities and industries but to seek a balance between high-quality socio-economic development and the conservation and protection of water resources. Therefore, this paper sets maximizing the regional Gross Domestic Product (GDP) as one of the objective functions.
m a x ( f 1 ) = V 1 + V 2 + V 3
where V1, V2, and V3 are the value-added of the primary, secondary, and tertiary industries in the planning year, respectively.
(2)
Total regional water use
The rational and efficient use of water resources is essential for the sustainable development of society and the ecosystem. The core idea of “Basing four aspects on water resources” is to implement total quantity control of water resources. Therefore, this paper sets minimizing regional water use as another objective function.
m i n ( f 2 ) = A × e 1 + V 2 × e 2 + V 3 × e 3 + n 2 × e 4 + Q e
where A is agricultural irrigation area in the planning year; e1, e2, and e3 are the water efficiency of the primary, secondary, and tertiary industries in the planning year, respectively.

2.2.3. Constraints

The main components of “Basing four aspects on water resources” are “Defining land with water, Defining population with water, Defining industries with water, and Defining cities with water”.
(1)
Defining land with water
“Defining land with water” mainly involves strictly regulating land use based on water resource availability, ensuring that primary agricultural lands adapt to the rigid constraints of regional water resources. This paper aims to achieve the goal of “Defining land with water” by imposing limitations on the amount of agricultural land and the efficiency of agricultural water use. According to China’s farmland protection policy and the “14th Five-Year Plan”, it is essential to ensure that the area of primary farmland does not decrease and that the efficiency of water use in agriculture is improved during the planning year.
V 1 × e 1 e f 1 A 1  
1 + 1 V 2 × e 2 + V 3 × e 3 + n × e 4 + μ × ( V 3 × e 3 + n 2 × e 4 ) 1 φ
where ef1 is the water use per unit area of agriculture, A1 is the effective irrigation area, and φ is the proportion of agricultural water use in the current year.
(2)
Defining population with water
“Defining population with water” emphasizes managing the size and urbanization rate of the population, determining the population scale at each stage according to the maximum utilizable amount of water resources. This study achieves the goal of “Defining population with water” by constraining the regional per capita GDP and population growth rate for the planning year.
V 1 + V 2 + V 3 n 2 P  
( n 2 n 1 ) 1 y 1 I p
where P is the forecast value of the minimum GDP per capita in the planning year, n1 is the number of permanent residents in the current year, y is the year, and Ip is the minimum predicted population growth rate.
(3)
Defining industries with water
“Defining industries with water” highlights that regional development industries’ scale and structural adjustment must conform to the rigid constraints of water resources, phasing out outdated production capacities and pursuing a path of green development and industrial transformation. This paper realizes the “Defining industries with water” objective by constraining the scale of water-intensive and tertiary industries.
V 2 w × e 2 w V 2 × e 2 ρ  
( V 2 p V 2 c ) 1 y 1 I i
V 3 V 1 + V 2 + V 3 θ  
where, V2w is the annual water-intensive industrial value-added in the planning year, e2w is the planned annual water-intensive industrial water efficiency, ρ is the ratio of current annual water-intensive industrial water use to the total industrial water use, Ii is the maximum growth rate of industrial value-added, and θ is the proportion of the tertiary industry in GDP in the current year.
(4)
Defining cities with water
“Defining cities with water” focuses on addressing the issue of urban overexpansion, strengthening constraints on ecological environments and water resources, and controlling urban development boundaries to prevent disorderly city growth. This paper aims to achieve the “Defining cities with water” goal by setting constraints on the scale of city water use and the tertiary industry.
V 3 × e 3 + n × e 4 Q c
μ × ( V 3 × e 3 + n 2 × e 4 ) Q Q e
where Qc is the total water use of the service industry and residents in the current year and Qe is the total ecological water supply outside the river channel in the current year.

2.3. Model Solution

The genetic algorithm, a widely applied evolutionary algorithm based on swarm intelligence, possesses a strong capability for global optimization [34]. The internal operational mechanism and global optimization characteristics of the Multi-Objective Genetic Algorithm (MOGA) are well suited to solving multi-objective optimization problems. This compatibility makes MOGA particularly effective in addressing complex issues where multiple objectives must be balanced and optimized simultaneously. With the successive introduction of algorithms like the Vector Evaluated Genetic Algorithm (VEGA) [35], Non-dominated Sorting Genetic Algorithm [36], and Non-dominated Sorting Genetic Algorithm II with an elitist strategy (NSGA-II) [37], genetic algorithms have rapidly gained widespread application in solving multi-objective optimization problems, particularly in finding Pareto solutions (non-inferior solutions) [38].
In this study, the quota method is initially used to determine the range of each variable. Then, optimization is conducted using the NSGA-II [39]. The specific implementation steps are illustrated in Figure 1. The feasible solution transformation method [40] is used to handle the conditions in this model, which involves numerous variables and complex constraints. In generating the initial population, selection, crossover, and mutation, the model verifies whether each individual is within the feasible domain after each step, ensuring that the entire optimization process occurs within this domain. For variables of different types or magnitudes, separate procedures should be followed when generating the initial population and during mutation operations. The optimization algorithm is iteratively executed several times until the Pareto front stabilizes.

2.4. Study Area

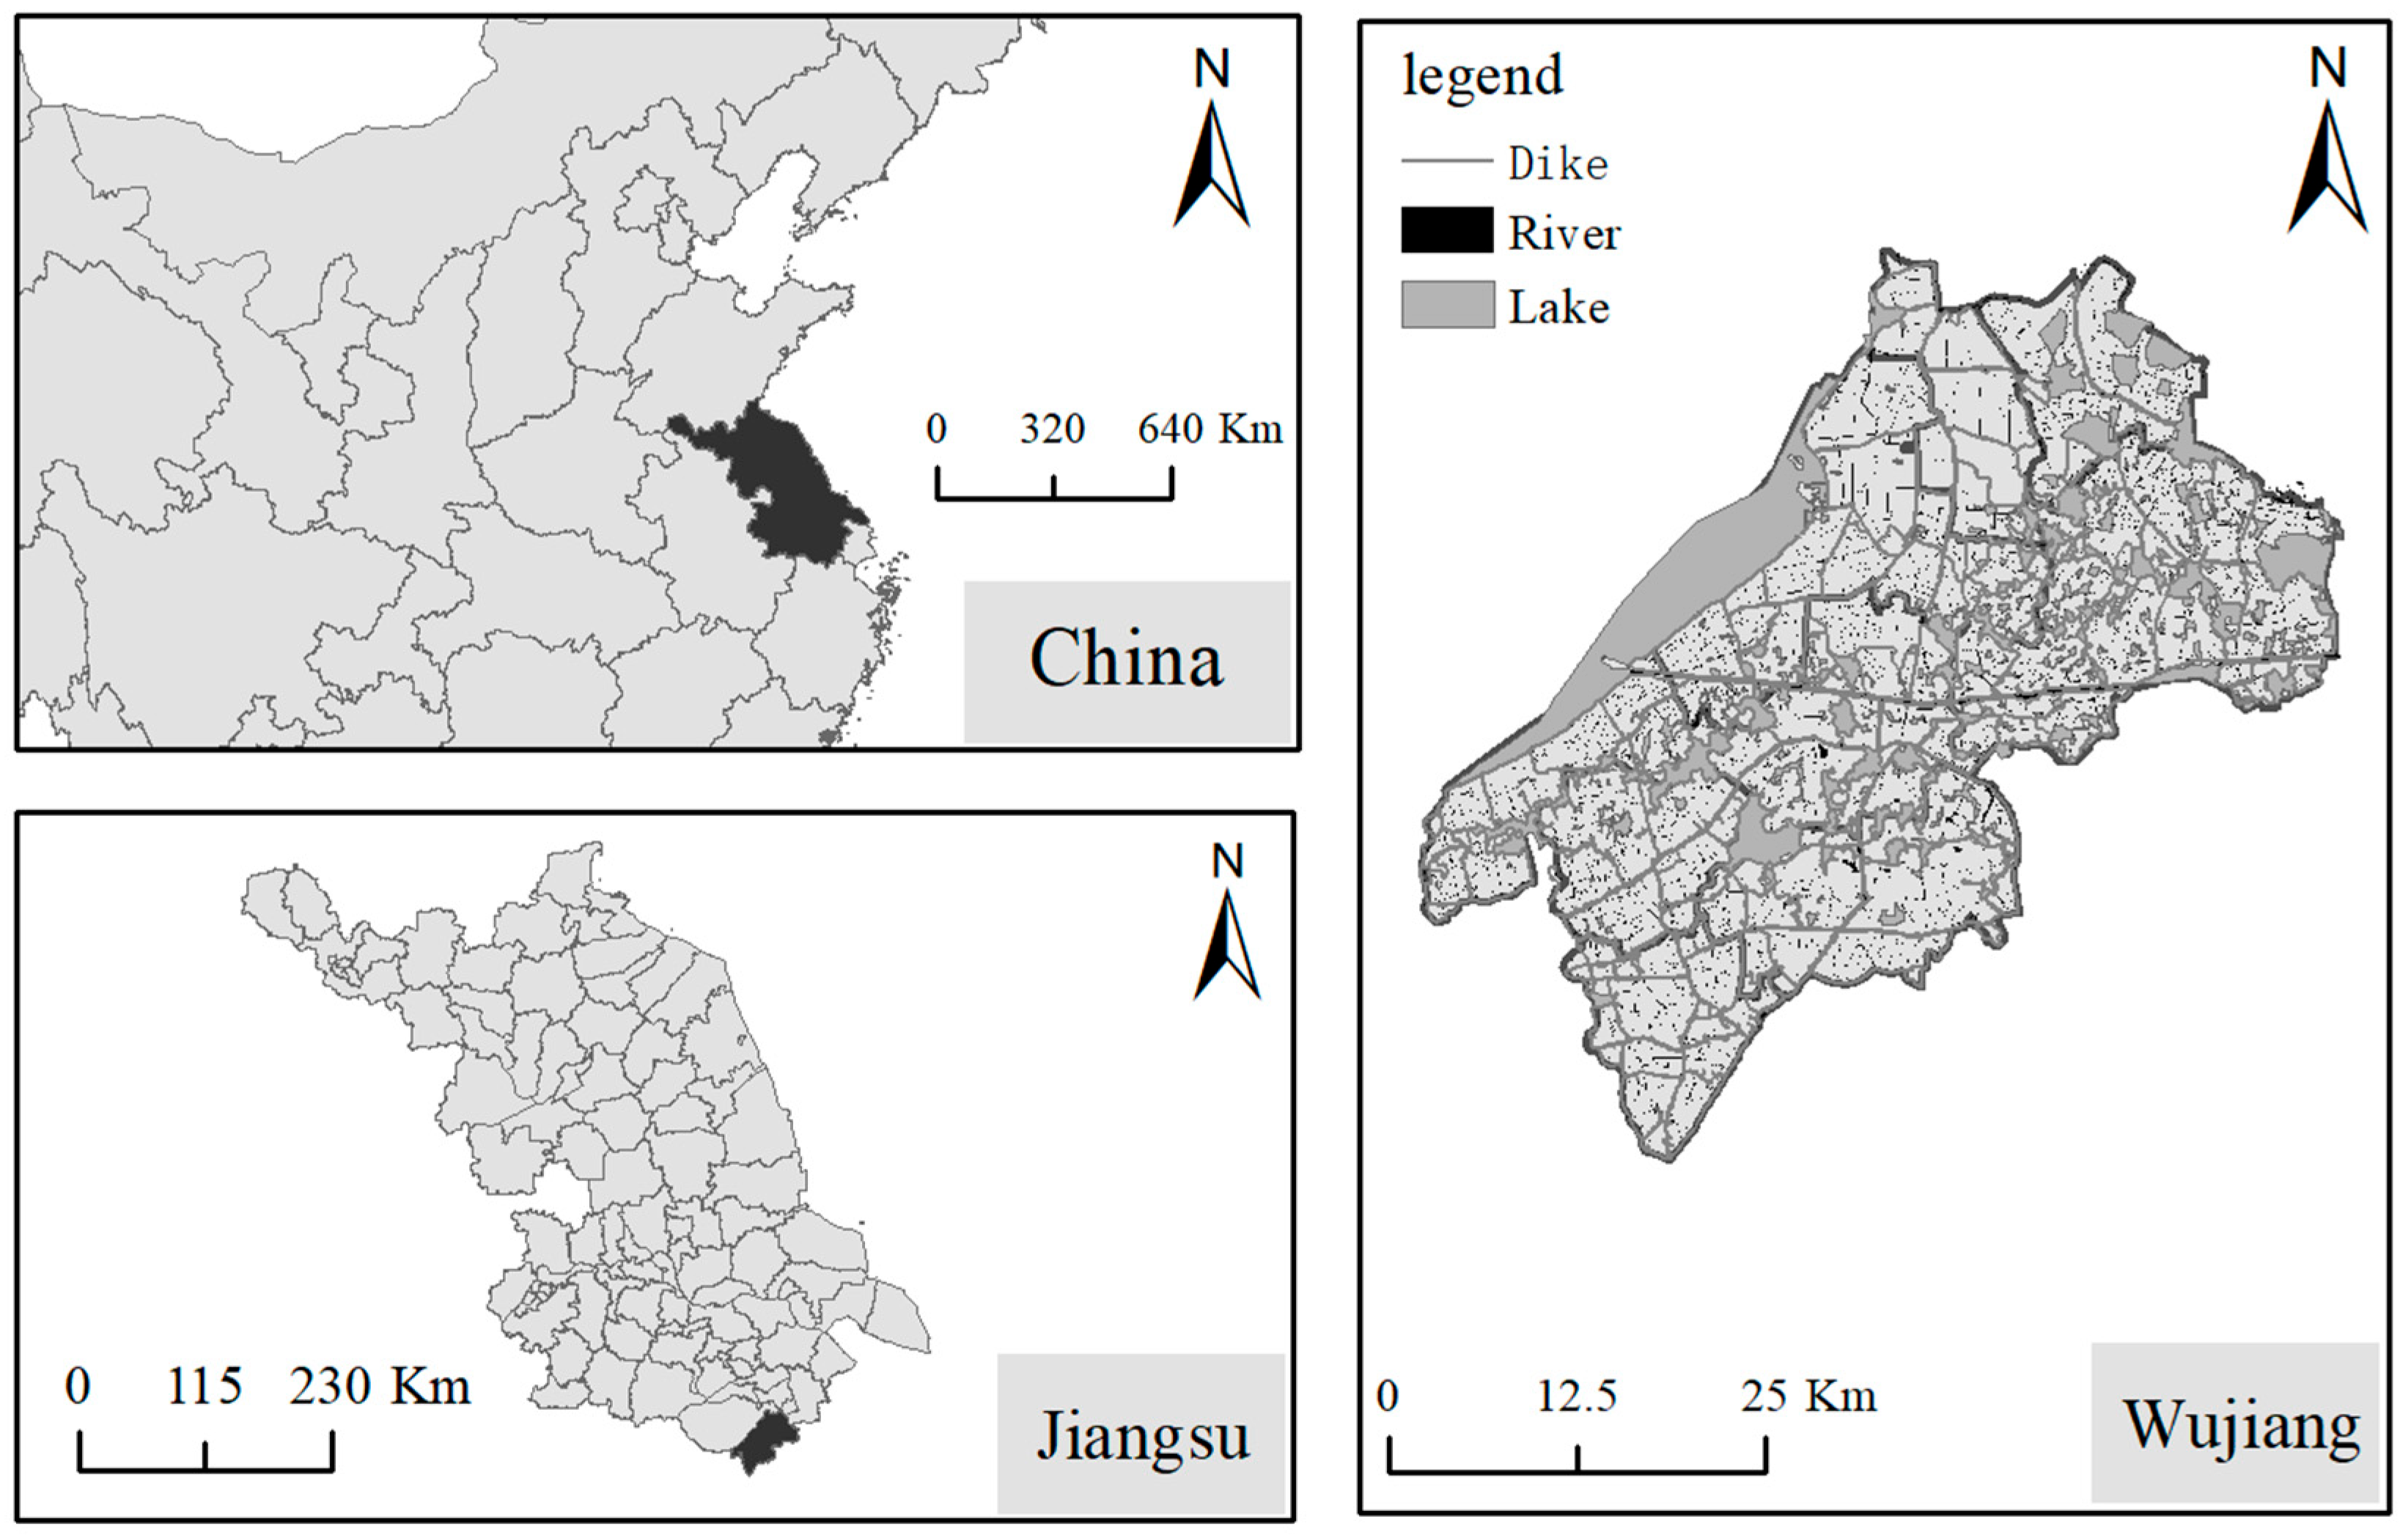
Suzhou’s Wujiang District is located in the southeastern part of Jiangsu Province, directly bordering Shanghai City, as shown in Figure 2. Leveraging its unique geographical advantages and comparative strengths, Wujiang has always been a significant recipient of various high-end elements overflowing from Shanghai. In 2020, the region’s gross domestic product (GDP) reached CNY 200.3 billion, with the value-added in the primary industry being CNY 3.75 billion, the secondary industry being CNY 100 billion, and the tertiary industry being CNY 96.51 billion, see Table 1. Wujiang District, situated in an area with abundant water flow, faces water pollution challenges. In 2020, the precipitation in Wujiang District amounted to 1413.2 mm, with a total water resource quantity of 837 million m3. The total water supply, mainly sourced from surface water, reached 602 million m3, the total water use was 602 million m3, comprising 251 million m3 for agricultural use, 209 million for industrial use, 124 million for domestic use, and 0.17 million for ecological benefit.
Wujiang District has a significant proportion of water-intensive industries. Notably, the total output value of eight water-intensive drives, including chemicals, textiles, and papermaking, has been increasing as a percentage of the total industrial output value over the years. In 2020, the water use of these industries accounted for 83.60% of the unlimited industrial water use. Additionally, while Wujiang District is rich in water resources, the locally available water resources are limited, and their distribution is uneven over time and space. The local water resources exhibit significant inter-annual variations, with an average annual surface water resource of 400 million cubic meters. However, yearly water use exceeds 600 million cubic meters, indicating a reliance on transboundary water resources to meet the demand.
In 2020, the total water use in Wujiang District reached 602 million m3, as shown in Table 2, approaching the red line for current water use control. This highlights the contradiction between economic development and water resources in Wujiang District, an economically developed area downstream of the Yangtze River Basin in China. The region faces water scarcity issues, making Wujiang District a typical and representative case for studying the “Basing four aspects on water resources” policy, showcasing the challenges of balancing economic growth and water use.
According to the 14th Five-Year Plan of Suzhou City, the average annual growth rate of the regional gross domestic product (GDP) is projected to be between 4% and 6% by 2035, with this study adopting the mid-range value of 5%. The average annual growth rate of the value-added in the secondary industry is expected to be between 5% and 7%. By 2035, the per capita GDP in the region is anticipated to be more than double that of 2020. The total water use is projected to increase by a maximum of 150 million cubic meters on the current basis, with a continuous increase in ecological water use. Over the past five years, the average annual growth rate of the resident population in Wujiang District has been approximately 0.2% to 0.3%, according to the Jiangsu Statistical Yearbook. Future population growth rates in China are predicted to range from −0.1% to 0.3%, as shown in Table 3.

3. Results and Discussion

This study applied the water resource optimization model to Wujiang District. It implemented a multi-objective genetic algorithm program in Python to solve this nonlinear multi-objective water resource optimization model. A total of 50 non-dominated water resource optimization schemes were obtained through the optimization process.

3.1. Water Quota Model Results

Using the water quota model, this paper initially forecasts economic development and total water use in Wujiang District. Different water use efficiencies were distinguished across three scenarios in the water demand prediction: general water-saving, intensified water-saving, and ultra water-saving. Under each water-saving scenario, subdivisions were made based on different economic growth rates, forming nine water scenarios. The forecast results are shown in Table 4 and Table 5.
According to the results, under the low development scenario (regional GDP growth rate between 4.8% and 6.1%), the regional GDP in 2035 is projected to be CNY 442.1 billion. The regional water use is between 663 million m3 and 737 million m3. In the medium development scenario (regional GDP growth rate between 5.6% and 7.0%), the 2035 regional GDP is expected to reach CNY 500.2 billion, with water use ranging from 694 million m3 to 774 million m3. Under the high development scenario (regional GDP growth rate between 6.6% and 8.2%), the 2035 regional GDP is forecasted to be CNY 574.9 billion, and the regional water use is projected to be between 739 million m3 and 826 million m3.

3.2. Pareto Solution Set

The Pareto front obtained through the solution includes 50 non-dominated solutions, as shown in Figure 3. For ease of representation, the solutions on the Pareto front are numbered in increasing order of water use. The solution with the most minor water use and the lowest regional GDP is labeled the 1st solution. In contrast, the solution with the highest water use and regional GDP is the 50th solution. This numbering scheme provides an apparent reference to the trade-off options along the Pareto front, allowing decision-makers to analyze and choose from the diverse set of solutions for sustainable water resource management in Wujiang District.
The Pareto front chart shows that the solution set exhibits a clear boundary during the water resource optimization process in Wujiang District. This indicates a certain degree of trade-off between the two objectives. As water resource use increases, the regional GDP increases, but the growth rate is nonlinear. This reflects the complex game relationship between improving water resource efficiency and economic growth under the constraint of water scarcity.
“Spacing” and “Hyper-volume” are crucial indicators for evaluating the performance of multi-objective genetic algorithms. “Spacing” measures the standard deviation of the minimum distances from each solution to the others. A smaller spacing value indicates a more uniform distribution of the solution set. On the other hand, “Hyper-volume” calculates the region’s volume in the objective space enclosed by the non-dominated solution set and a reference point. A more considerable HV value indicates better overall algorithm performance. The “Hyper-volume” and “Spacing” indicator plots (Figure 3b,c) show that the algorithm rapidly identifies a solution set with high hyper-volume values in the initial stages, indicating good diversity and coverage. However, in subsequent iterations, the hyper-volume value decreases rapidly and stabilizes, implying a balanced state has been reached in the optimization process. New iterations contribute limited improvements to refining the Pareto front. This suggests that the algorithm effectively explores the solution space and identifies a set of solutions evenly distributed across the objective functions.
On the Pareto front, the non-dominated water resources optimization configurations exhibit a trade-off where an increase in one objective value inevitably leads to a decrease in the other. From solution 1 to solution 50, the model optimization results transition from a tendency towards minimizing water use to maximizing regional GDP. Water use increased from 617 million cubic meters to 664 million cubic meters, while the regional GDP rose from CNY 468.2 billion to CNY 500 billion. No solution simultaneously achieves optimal values for both objectives, indicating a trade-off between the two goals.
Table 6 shows the comparison between the optimization results and water quota forecast results. As shown in the table, under the water demand forecast of the water quota model, in the lower development scenario, the water use in Wujiang District in 2035 is projected to be between 663 and 737 million cubic meters, with a regional GDP of CNY 442.2 billion. In the medium development scenario, the water use is estimated to be between 694 and 774 million cubic meters, with a regional GDP of CNY 500.2 billion. Through coordinated optimization of water efficiency and industrial structure, the model demonstrates significant improvements: (1) the regional GDP decreases water use by 7.46% to 19.45%, with a 5.66% higher GDP than the water quota model; (2) under a constant total water use and GDP (0.04% reduction compared to the medium development scenario), the optimized model reduces water use by 4.52% to 16.57%, indicating significant optimization effects.
Points on the Pareto frontier represent the optimal solution set for the multi-objective optimization problem. Traditional methods that transform multi-objective problems into single-objective ones can only yield a single point on the Pareto frontier, neglecting the rich interplay of information among objectives. By solving for the entire Pareto optimal solution set, the game relationship between objectives can be revealed, providing more decision-support information, and there is no need to pre-determine the weights of each goal. A plethora of non-inferior configurations can offer diverse choices in the decision-making process, catering to the different preferences of decision-makers. When decision preferences change, there is no need for recalculations; a new selection can be made from the Pareto solution set.

3.3. Results of Optimization of Water Resources

Figure 4a,b depict the game process between the three industries’ value-added and water use. From the graphs, as the solution progresses, the water use and value-added for the primary industry remain relatively stable. This aligns with the constraint set in the model, where the agricultural land area remains unchanged. Given the primary industry’s relatively lower water use efficiency, maintaining stable agricultural water use at a lower limit to minimize total water use meets the overall optimization requirements.
The variations in water use and value-added for the secondary industry show a trend towards higher efficiency and lower water use. This trend may result from improving the water use efficiency of water-intensive industries and reducing the proportion of the GDP contributed by water-intensive industries. While the value-added of the secondary industry decreases in some scenarios, it aligns with the model’s objective to reduce dependence on water-intensive industries through industrial structure optimization, lowering water use under constant total output and achieving Pareto optimality.
As the solution progresses, the value-added of the tertiary industry shows an overall fluctuating upward trend while water use remains stable or slightly decreases. This trend is primarily due to adjustments in the industrial structure, leading to an increase in the GDP contributed by the tertiary industry and a decrease in the proportion contributed by water-intensive industries. The tertiary industry typically involves less direct water use, and shifting towards a service-oriented economic model can reduce overall water demand while increasing regional GDP. However, due to numerous constraints, the changes in value-added and water use for the three industries are relatively stable. The fluctuations in the data in the graph also indicate that, despite the overall positive trend, there are complex internal game processes during the optimization process.
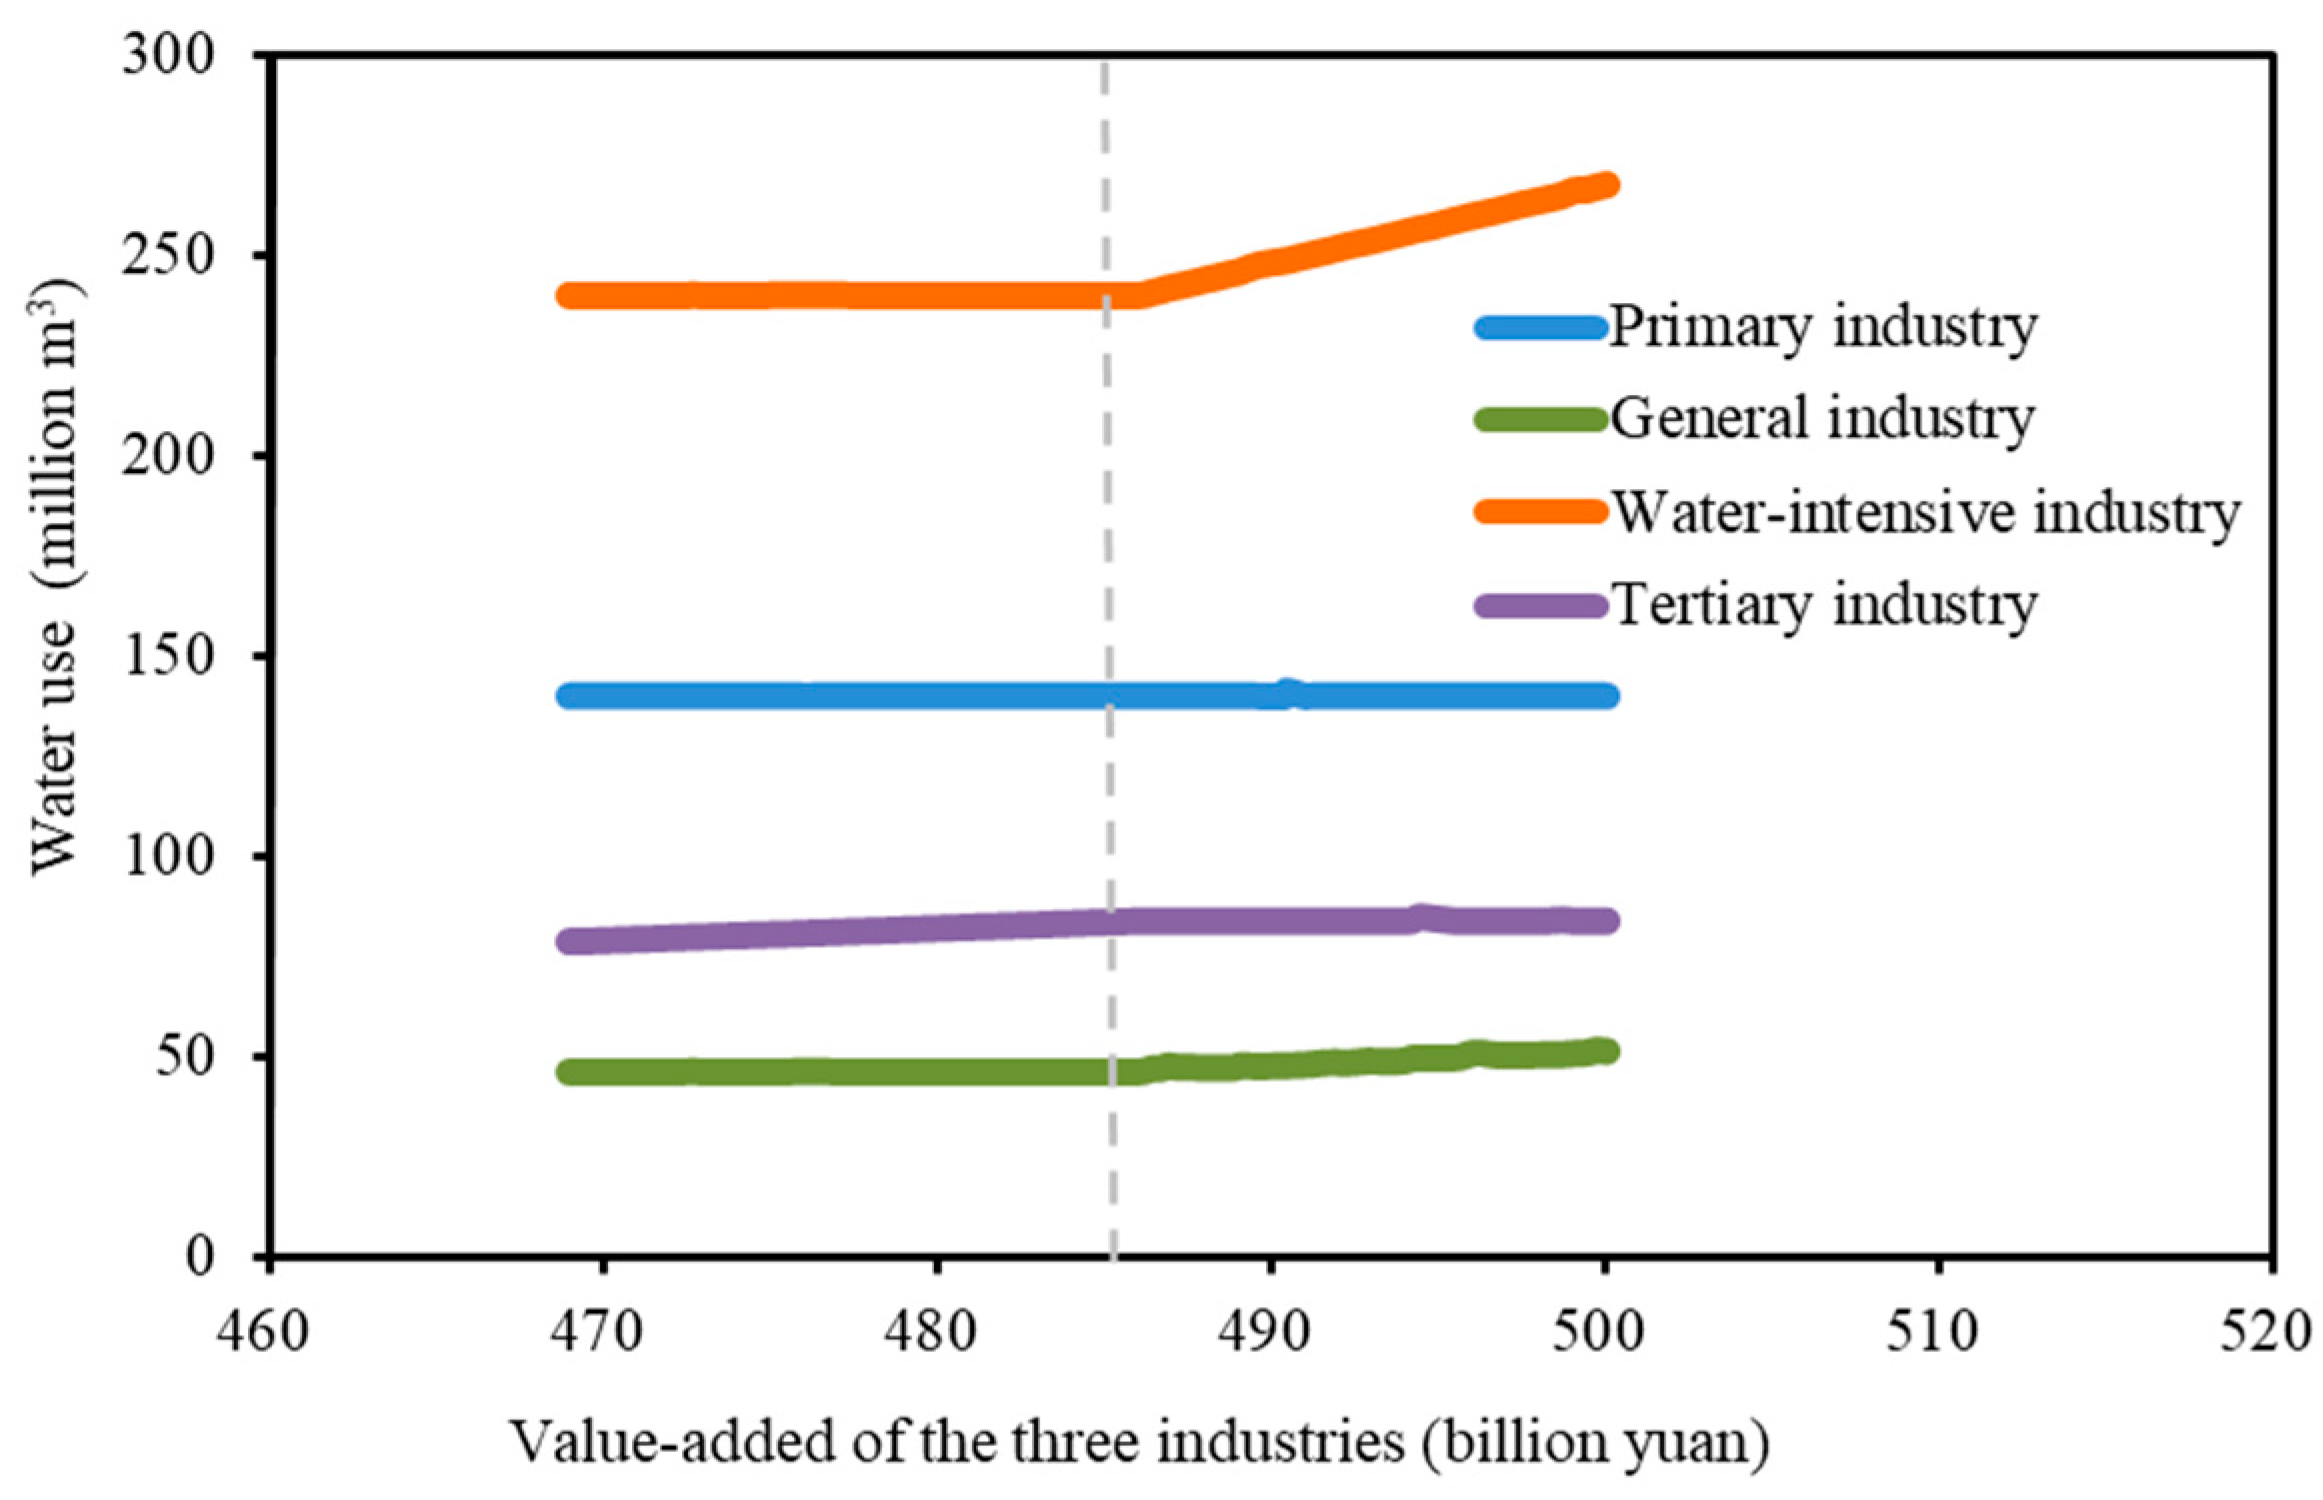
Figure 5 illustrates the relationship between the three industries’ GDP and different industries’ water use. The graph shows that the changes in the value-added of the primary industry are relatively flat, reflecting minimal variations in water use under different optimization solutions. The main reason is the constraint set in the model to maintain the essential farmland area as unchanged. Additionally, the primary industry’s value-added accounts for a low proportion of the three industries’ GDP, and its water efficiency is relatively quiet. Therefore, the optimization process in the model chooses to limit the water efficiency of the primary industry to the specified lower limit. The optimization results also indicate significant water-saving potential in agricultural water use.
The water use of the general industry gradually increases with the growth of the three industries’ GDPs but at a slower rate compared to the water-intensive industry. The results suggest that there is some water-saving potential in improving the water efficiency of the general industry. However, its potential is less significant than that of the water-intensive industry. The graph for the water-intensive sector shows an increase in total water use with the growth of the three industries’ GDPs, and there is a significant change in the slope of the line when the GDP reaches CNY 48.6 billion. This indicates that strict control of industrial water use will somewhat limit regional economic development. The water-intensive industry is critical in Wujiang District, and compromising to some extent above the water use line is necessary if economic growth is a top priority. Promoting water conservation in the region can be achieved by improving water efficiency or reducing the economic contribution of water-intensive industries under certain conditions of constant economic output. For areas heavily reliant on water-intensive industries, such as Wujiang District, ensuring economic growth while adjusting the industrial structure limits water-saving opportunities. In the future, promoting water conservation through investments and advancements in water-saving technologies will remain essential to enhance overall water efficiency.
The water use of the tertiary industry shows a trend of first increasing and then decreasing with the growth of the three industries’ GDPs. Due to future adjustments in the industrial structure, the proportion of the service industry’s GDP will further increase. As the service industry has relatively low water efficiency, its water-saving potential is limited. The service industry will primarily promote regional water conservation through adjustments in the industrial structure.
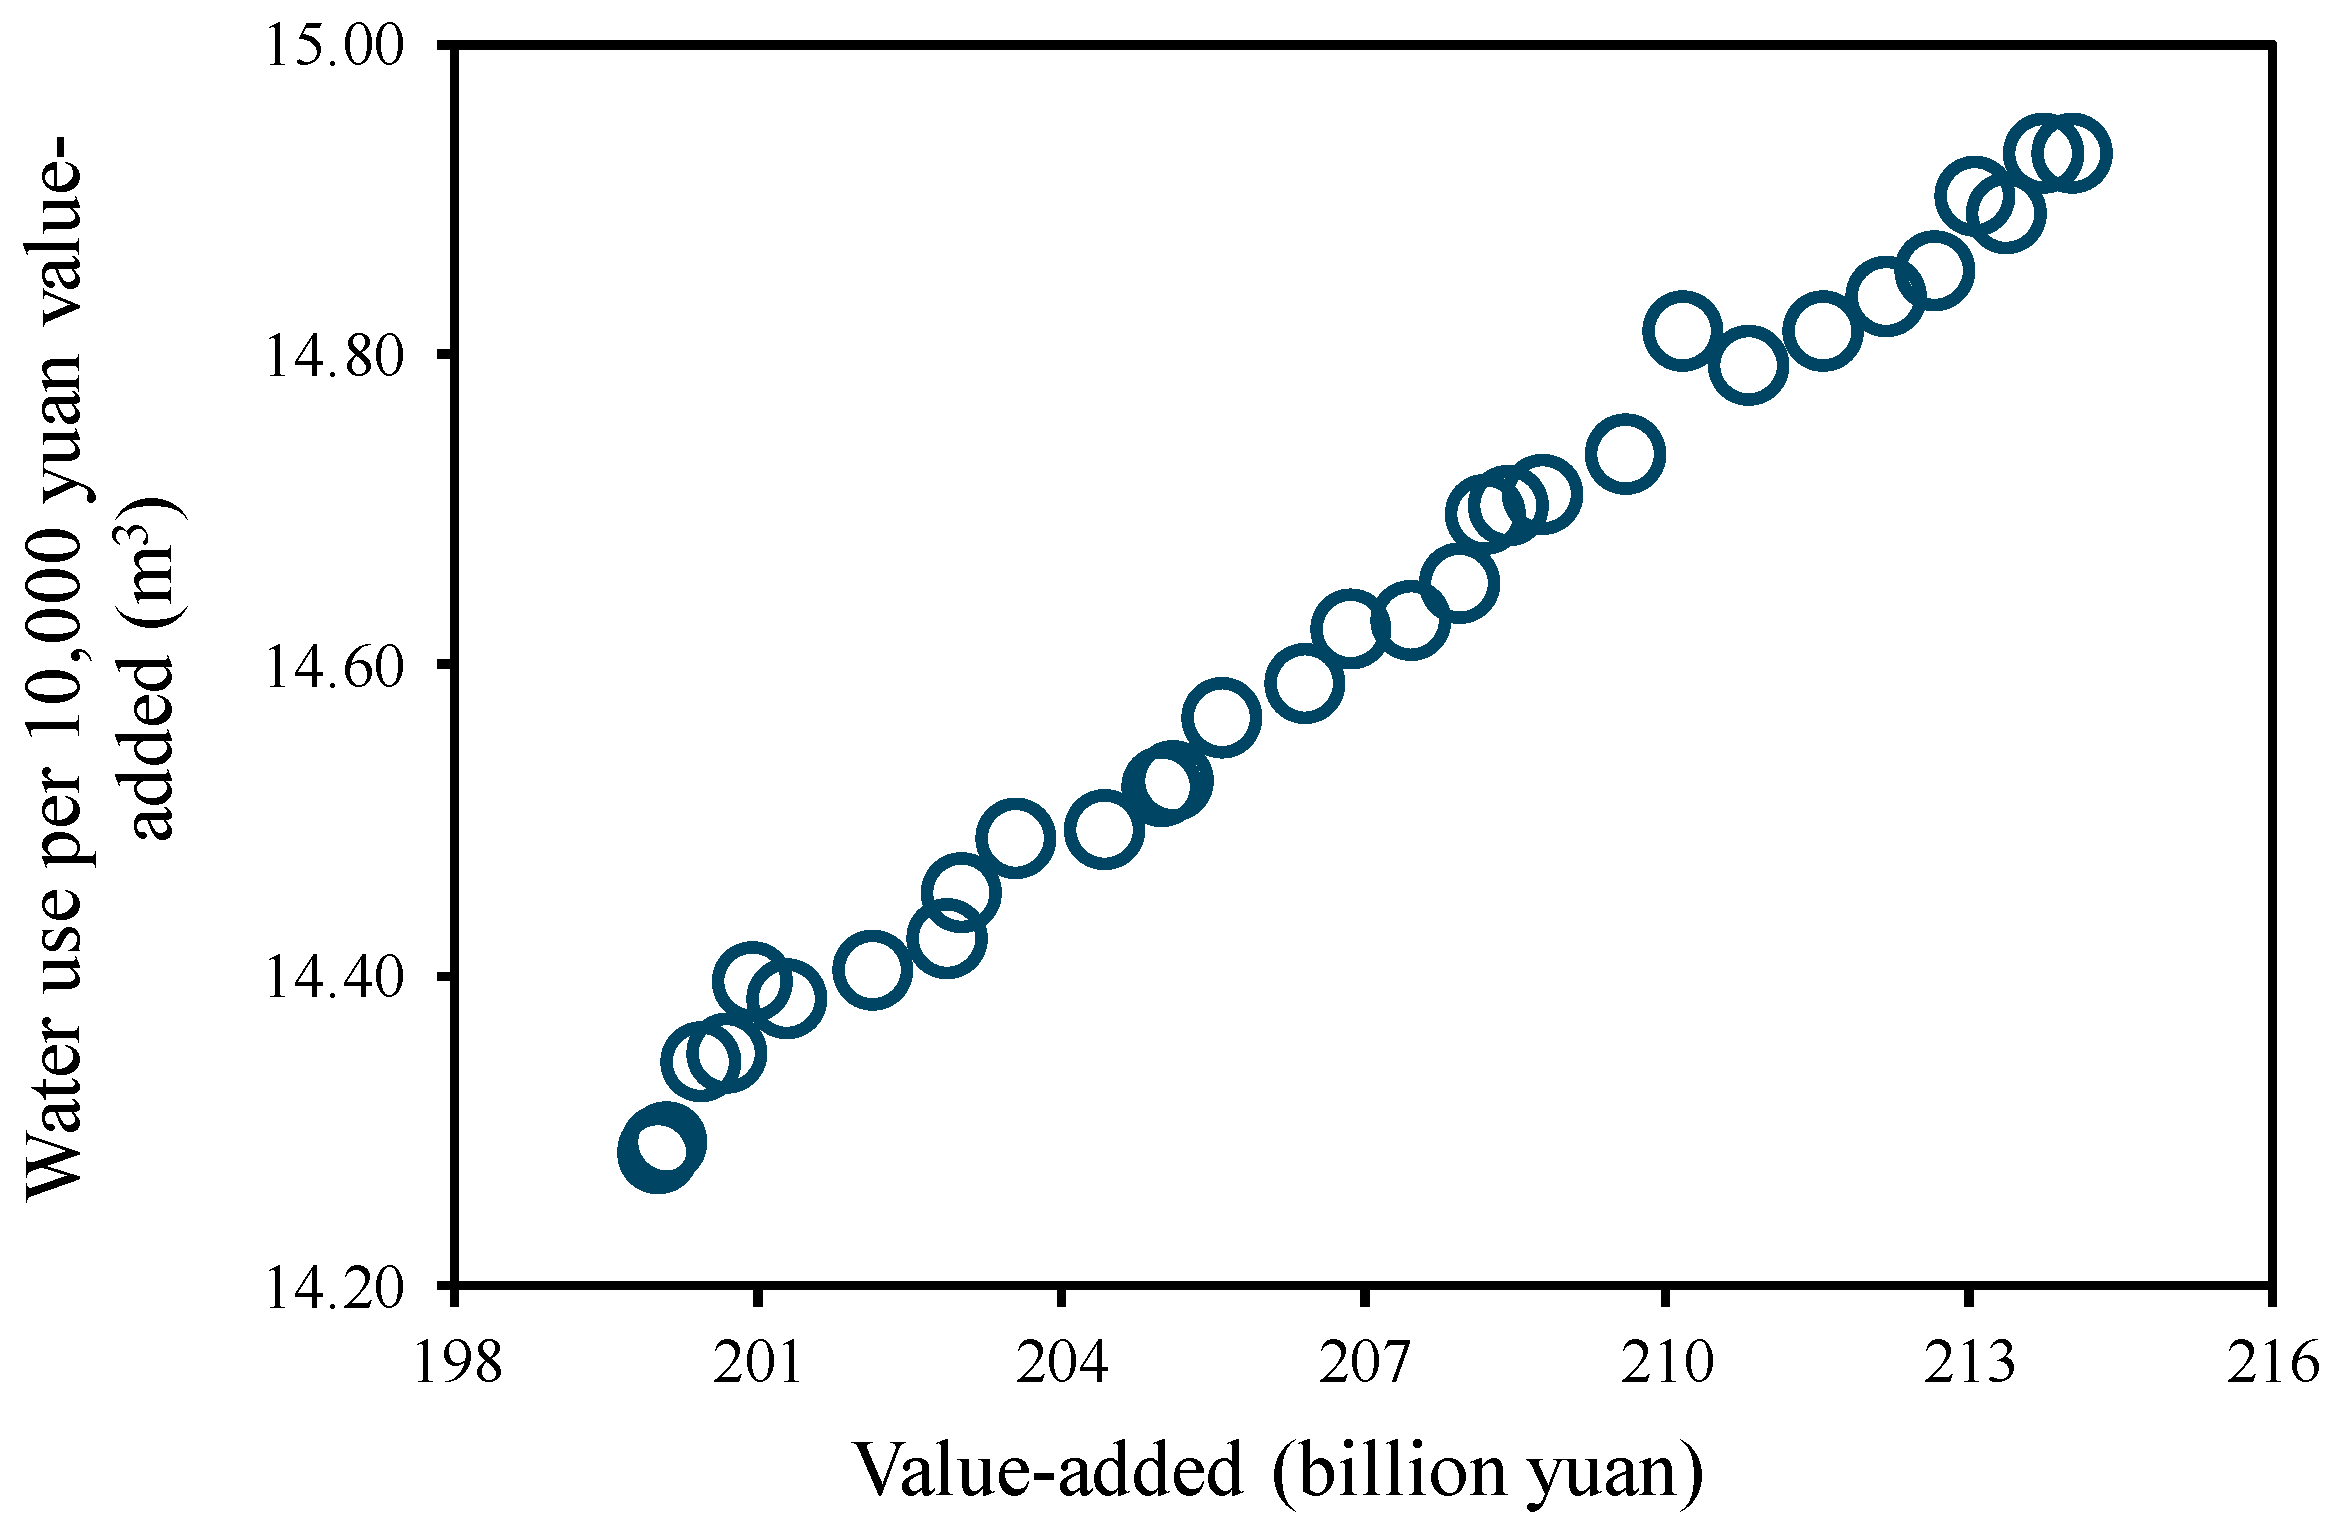
Figure 6 depicts the relationship between the value-added and the water use per CNY 10,000 value-added (the amount of water used to generate CNY 10,000 of industrial value-added is considered more favorable when the value is smaller) under the non-inferior solution. The graph shows that compared to the primary and tertiary industries, there is significant room for improving water efficiency in the secondary industry. The water use per CNY 10,000 value-added in the secondary industry exhibits a linear growth trend with the increase in value-added. As the value-added in the secondary industry increases from CNY 200 billion to CNY 214 billion, the water use per CNY 10,000 value-added rises from 14.3 cubic meters to 14.9 cubic meters. Water efficiency will inevitably be reduced if the objective is to achieve a higher value-added in the secondary industry. As the decision preference shifts from minimizing total water use to maximizing regional GDP, the water efficiency in the secondary industry tends to decrease.

4. Conclusions

Traditional water quota-based water demand forecasting methods have overlooked the interaction between economic development and water resource constraints. This study establishes a nonlinear multi-objective water resource optimization model based on China’s latest “Basing four aspects on water resources” principle. The model aims to maximize urban GDP and minimizing total water use. In addition, the NAGA-II Model was used to solve this complex nonlinear multi-objective problem. The main conclusions are as follows:
  • Compared to modeling results based on the traditional water quota method, the optimized regional water use, under constant GDP, is reduced by 4.52% to 16.57%. This significant improvement indicates that the water use structure of the study area can be further optimized to achieve more efficient economic development. The water resources optimization model constructed in this study can effectively address the multi-objective optimization problem between water resources and economic growth.
  • The Pareto solution set reveals more insights into the trade-offs involved in the multi-objective optimization problem. In contrast to models like the water quota prediction model that yield a few fixed compromise solutions, the non-inferior solution set is more versatile. This optimization model provides decision-makers greater flexibility and a broader range of choices. It allows decision-makers to select the most suitable solution based on different scenarios and preferences, enhancing the adaptability of the decision-making process.
  • Optimization of water resources and economic growth is highly constrained under the multiple restrictions of “Defining land with water”, “Defining population with water”, “Defining industries with water”, and “Defining cities with water”. Therefore, administrators need to employ more refined regulatory measures, such as precise control of water efficiency and rational optimization of water resources, to ensure the maximization of comprehensive benefits in the region. Simultaneously, reinforcing land management and vigorously promoting water-saving irrigation to enhance agricultural irrigation efficiency is essential.
  • Optimizing industrial structure by increasing the proportion of the service industry’s GDP and reducing the economic share of water-intensive industries can effectively reduce water use while maintaining a certain level of economic value. This approach represents a practical pathway for China to achieve coordinated development of water resources and economic growth. However, for regions heavily dependent on water-intensive industries, ensuring economic growth through industrial structural adjustments poses limited opportunities for water conservation. Future efforts should focus on water-saving investments, promoting technological advancements, and enhancing overall water use efficiency to sustain economic development.
In addition, there is significant uncertainty in values such as regional GDP, water use efficiency, and existing available water supply in actual water resource management. The results of this study have specific deficiencies in the practical application. Therefore, future work should incorporate the uncertainty of hydrological and managerial elements in reality into the multi-objective water resource optimization model presented in this paper.

Author Contributions

Conceptualization, Y.Q., B.S. and P.R.; methodology, Y.Q. and S.C.; software, Y.Q. and X.L.; formal analysis, Y.Q. and S.C.; writing—original draft preparation, Y.Q. and B.S.; writing—review and editing, B.S. and P.R.; visualization, Y.Q. and S.C. All authors have read and agreed to the published version of the manuscript.

Funding

This research was supported by the Funding Project: The Independent Innovation Fund of Changjiang Survey, Planning, Design and Research Corporation for the Integrated Development Planning Technology of Wind, Solar, Water, and Storage Facing New Energy Consumption (grant no. CX2021214—1), the National Key Research and Development Program of China (grant no. 2021YFC3000200), National Foundation Guidance Project, Jiangsu University of Science and Technology (grant no. ZJGQN2023001), and Wujiang District Water Bureau, Jiangsu Province, China.

Data Availability Statement

The datasets supporting the results of this article are included within the article.

Conflicts of Interest

Author Yongyu Qu and Shubing Cai were employed by the company ChangJiang Survey, Planning, Design and Research Co., Ltd. The remaining authors declare that the research was conducted in the absence of any commercial or financial relationships that could be construed as a potential conflict of interest.

References

  1. Li, Q.; Liu, Z.; Xiao, S.; Meng, J. Forecast of national economic water demand in the Yellow River Basin. Yellow River 2011, 33, 61–63. [Google Scholar]
  2. Luan, Q.; Pang, T.; Wang, Z.; Gao, H.; He, L.; He, S.; Dong, S. Revew and bibliometrics analysis of prediction technology and method of water demand. Yellow River 2022, 44, 62–66. [Google Scholar]
  3. State Council of People’s Republic of China. Opinions on Implementing the Strictest Water Resources Management System; State Council of People’s Republic of China: Beijing, China, 2012.
  4. Xi, J. Speech at a symposium on ecological protection and high-quality development in the Yellow River Basin. China Water Resour. 2019, 20, 1–3. [Google Scholar]
  5. Niknam, A.; Zare, H.K.; Hosseininasab, H.; Mostafaeipour, A.; Herrera, M. A critical review of short-term water demand forecasting tools—What method should I use? Sustainability 2022, 14, 5412. [Google Scholar] [CrossRef]
  6. He, L.; Xia, J.; Zhang, L. Present research and development trend on water resources demand forecast. J. Yangtze River Sci. Res. Inst. 2007, 24, 61. [Google Scholar]
  7. Li, Q.; Yang, L.; Jiang, G.; Zhang, Y. Water Damand of National Economy Forecasting Methord and Its Application. In Proceedings of the Academic Annual Meeting of the Chinese Hydraulic Society; Hohai University Press: Tianjing, China, 2014. [Google Scholar]
  8. Shi, J.; Yun, H.; Wei, Q.; Zhen, Z. Analysis of long-term water resources planning in Taigu area of Shanxi Province based on quota method. China Water Transp. 2021, 21, 102–104. [Google Scholar]
  9. Yang, L. Research on the Rational Allocation of Water Resources in Ganzhou District Based on Sustainable Development. China Rural. Water Hydropower 2020, 2, 6–10. [Google Scholar]
  10. Lenzen, M.; Foran, B. An input–output analysis of Australian water usage. Water Policy 2001, 3, 321–340. [Google Scholar] [CrossRef]
  11. Hassan, R.; Thurlow, J. Macro–micro feedback links of water management in South Africa: CGE analyses of selected policy regimes. Agric. Econ. 2011, 42, 235–247. [Google Scholar] [CrossRef]
  12. Zhou, S.L.; Mcmahon, T.A.; Walton, A.; Lewis, J. Forecasting daily urban water demand: A case study of Melbourne. J. Hydrol. 2000, 236, 153–164. [Google Scholar] [CrossRef]
  13. Kitessa, B.D.; Ayalew, S.M.; Gebrie, G.S.; Teferi, S.T. Long-term water-energy demand prediction using a regression model: A case study of Addis Ababa city. J. Water Clim. Chang. 2021, 12, 2555–2578. [Google Scholar] [CrossRef]
  14. Donkor, E.A.; Mazzuchi, T.A.; Soyer, R.; Alan Roberson, J. Urban water demand forecasting: Review of methods and models. J. Water Resour. Plan. Manag. 2014, 140, 146–159. [Google Scholar] [CrossRef]
  15. Wang, G.; Xiao, C.; Qi, Z.; Liang, X.; Meng, F.; Sun, Y. Water resource carrying capacity based on water demand prediction in Chang-Ji economic circle. Water 2020, 13, 16. [Google Scholar] [CrossRef]
  16. Haque, M.M.; De Souza, A.; Rahman, A. Water demand modelling using independent component regression technique. Water Resour. Manag. 2017, 31, 299–312. [Google Scholar] [CrossRef]
  17. Bakchan, A.; Roy, A.; Faust, K.M. Impacts of COVID-19 social distancing policies on water demand: A population dynamics perspective. J. Environ. Manag. 2022, 302, 113949. [Google Scholar] [CrossRef] [PubMed]
  18. Buck, S.; Auffhammer, M.; Soldati, H.; Sunding, D. Forecasting residential water consumption in California: Rethinking model selection. Water Resour. Res. 2020, 56, e2018WR023965. [Google Scholar] [CrossRef]
  19. Shirkoohi, M.G.; Doghri, M.; Duchesne, S. Short-term water demand predictions coupling an artificial neural network model and a genetic algorithm. Water Supply 2021, 21, 2374–2386. [Google Scholar] [CrossRef]
  20. Yılmaz, V. The use of band similarity in urban water demand forecasting as a new method. Water Supply 2022, 22, 1004–1019. [Google Scholar] [CrossRef]
  21. Jain, A.; Kumar Varshney, A.; Chandra Joshi, U. Short-term water demand forecast modelling at IIT Kanpur using artificial neural networks. Water Resour. Manag. 2001, 15, 299–321. [Google Scholar] [CrossRef]
  22. Jain, A.; Ormsbee, L.E. Short-term water demand forecast modeling techniques—Conventional methods versus AI. J.-Am. Water Work. Assoc. 2002, 94, 64–72. [Google Scholar] [CrossRef]
  23. Bougadis, J.; Adamowski, K.; Diduch, R. Short-term municipal water demand forecasting. Hydrol. Process. Int. J. 2005, 19, 137–148. [Google Scholar] [CrossRef]
  24. Jentgen, L.; Kidder, H.; Hill, R.; Conrad, S. Energy management strategies use short-term water consumption forecasting to minimize cost of pumping operations. J.-Am. Water Work. Assoc. 2007, 99, 86–94. [Google Scholar] [CrossRef]
  25. Herrera, M.; Torgo, L.; Izquierdo, J.; Pérez-García, R. Predictive models for forecasting hourly urban water demand. J. Hydrol. 2010, 387, 141–150. [Google Scholar] [CrossRef]
  26. Firat, M.; Yurdusev, M.A.; Turan, M.E. Evaluation of artificial neural network techniques for municipal water consumption modeling. Water Resour. Manag. 2009, 23, 617–632. [Google Scholar] [CrossRef]
  27. Cutore, P.; Campisano, A.; Kapelan, Z.; Modica, C.; Savic, D. Probabilistic prediction of urban water consumption using the SCEM-UA algorithm. Urban Water J. 2008, 5, 125–132. [Google Scholar] [CrossRef]
  28. Adamowski, J.; Karapataki, C. Comparison of multivariate regression and artificial neural networks for peak urban water-demand forecasting: Evaluation of different ANN learning algorithms. J. Hydrol. Eng. 2010, 15, 729–743. [Google Scholar] [CrossRef]
  29. Awad, M.; Zaid-Alkelani, M. Prediction of water demand using artificial neural networks models and statistical model. Int. J. Intell. Syst. Appl. 2019, 11, 40. [Google Scholar] [CrossRef]
  30. Adamowski, J.F. Peak daily water demand forecast modeling using artificial neural networks. J. Water Resour. Plan. Manag. 2008, 134, 119–128. [Google Scholar] [CrossRef]
  31. Candelieri, A. Clustering and support vector regression for water demand forecasting and anomaly detection. Water 2017, 9, 224. [Google Scholar] [CrossRef]
  32. Bata, M.T.; Carriveau, R.; Ting, D.S.-K. Short-term water demand forecasting using hybrid supervised and unsupervised machine learning model. Smart Water 2020, 5, 2. [Google Scholar] [CrossRef]
  33. Lopez Farias, R.; Puig, V.; Rodriguez Rangel, H.; Flores, J.J. Multi-model prediction for demand forecast in water distribution networks. Energies 2018, 11, 660. [Google Scholar] [CrossRef]
  34. Lai, H.; Dong, P.; Zhu, G. A pareto multi-objective genetic algorithm for multi-objective programming problem. Syst. Eng. 2003, 21, 24–28. [Google Scholar]
  35. Schaffer, J.D. Multiple Objective Optimization with Vector Evaluated Genetic Algorithms. In Proceedings of the First International Conference on Genetic Algorithms and Their Applications, Pittsburgh, PA, USA, 24–26 July 1985; Psychology Press: Abingdon, UK, 2014. [Google Scholar]
  36. Srinivas, N.; Deb, K. Muiltiobjective optimization using nondominated sorting in genetic algorithms. Evol. Comput. 1994, 2, 221–248. [Google Scholar] [CrossRef]
  37. Deb, K.; Pratap, A.; Agarwal, S.; Meyarivan, T. A fast and elitist multiobjective genetic algorithm: NSGA-II. IEEE Trans. Evol. Comput. 2002, 6, 182–197. [Google Scholar] [CrossRef]
  38. Wang, X.; Chang, J.; Wang, Y. Research on multi-objective operation based on improved NSGA-II for the cascade reservoirs in the Lower Yellow River. J. Hydraul. Eng. 2017, 48, 135–145. [Google Scholar]
  39. Yu, Z.; Shang, S. Multi-objective optimization method for irrigation scheduling of crop rotation system and its application in North China. J. Hydraul. Eng. 2016, 47, 1188–1196. [Google Scholar]
  40. Pan, J.; Yoshikawa, A.; Yamamura, M. Genetic Algorithm-Based Reproduction of Certainty Effect: From the Perspective of Survival Environments. In Proceedings of the 2022 4th International Conference on Communications, Information System and Computer Engineering (CISCE), Shenzhen, China, 27–29 May 2022; pp. 458–561. [Google Scholar]
Figure 1. Water Resources Optimization Model.
Water 16 00359 g001
Figure 2. Geographical location map of Wujiang District.
Water 16 00359 g002
Figure 3. Pareto front, (a) Pareto frontier of water resources optimization model, (b) hyper-volume indicator, (c) spacing indicator.
Water 16 00359 g003aWater 16 00359 g003b
Figure 4. (a) Value-added, (b) water use of different industries under the non-inferior scenario.
Water 16 00359 g004
Figure 5. Relationship between water use and value-added in the three industries.
Water 16 00359 g005
Figure 6. Relationship between value-added and water use per CNY 10,000 value-added in the secondary industry.
Water 16 00359 g006
Table 1. Wujiang District’s GDP by industries in recent years.
YearPrimary IndustrySecondary IndustryTertiary IndustryGDP per Capita
(Billion CNY)(Billion CNY)(Billion CNY)(Thousand CNY)
20164.2883.4975.07125.42
20174.3891.5183.01137.42
20184.3198.6889.51142.70
20193.74100.8291.25149.34
20203.75100.0296.51129.87
Table 2. Water use by industries in Wujiang District in recent years (Million m3).
YearPrimary IndustrySecondary IndustryResidentialEcologyTotal
20162631951293591
20172642031313601
20182402151294588
20192492171316603
202025120912417602
Table 3. Wujiang’s long-term goals in 2035.
Index2035 Goals
Average annual growth rate of regional GDP4%~6%
Average annual growth rate of secondary industry’s value-added5%~7%
GDP per capita≥200%
Red line of total water use750 million m3
Ecological water useContinue growth
Population growth rate (resident population)Not higher than 0.3%
Table 4. Forecast of Wujiang District’s future economy (billion CNY).
YearLow ScenarioMedium ScenarioHigh Scenario
2025269.56281.17296.49
2030350.23380.33418.34
2035442.15500.23574.91
Table 5. Forecast of future water use situation in Wujiang District (million m3).
YearGeneral Water-SavingIntensified Water-SavingUltra Water-Saving
Low Medium High LowMediumHighLowMediumHigh
2025651662683618628647589599617
2030694717751657677709626645675
2035737774826696730778663694739
Table 6. Comparison between optimization results and water quota forecast results.
ItemLow ScenarioMedium ScenarioHigh Scenario
GDP forecast using quota model (billion CNY)442.2500.2574.9
Total water use (million m3)663–737694–774739–826
Optimized GDP468.2–500.0
Optimized total water use (million m3)617–664
ComparisonOptimization results in a 5.88% increase in GDP and 7.46% to 19.45% less water use than the low scenario.
Optimization results in 0.04% less GDP and 4.52% to 16.57% less water use than the medium scenario.
Disclaimer/Publisher’s Note: The statements, opinions and data contained in all publications are solely those of the individual author(s) and contributor(s) and not of MDPI and/or the editor(s). MDPI and/or the editor(s) disclaim responsibility for any injury to people or property resulting from any ideas, methods, instructions or products referred to in the content.