Article

Occurrence and Formation Mechanisms of High-Fluoride Groundwater in Xiong’an New Area, Northern China

1
School of Water Resources and Environment, China University of Geosciences (Beijing), Beijing 100083, China
2
China Institute of Geo-Environmental Monitoring, Beijing 100081, China
3
Stake Key Laboratory of Environmental Aquatic Chemistry, Research Center for Eco-Environmental Science Chinese Academy of Sciences, Beijing 100085, China
4
University of Chinese Academy of Sciences, Beijing 100049, China
5
Hydrological Engineering and Geological Prospecting Institute of Hebei Province, Shijiazhuang 050021, China
6
Hebei Key Laboratory of Geological Resources and Environment Monitoring and Protection, Shijiazhuang 050021, China
7
Hebei Cangzhou Groundwater and Land Subsidence National Observation and Research Station, Cangzhou 061000, China
*
Authors to whom correspondence should be addressed.
Water 2024, 16(2), 358; https://doi.org/10.3390/w16020358
Submission received: 21 December 2023 / Revised: 17 January 2024 / Accepted: 18 January 2024 / Published: 22 January 2024

Abstract

:
While extant research has predominantly focused on elucidating the mechanisms of fluorine (F) enrichment in groundwater within the North China Plain, the occurrence and formation mechanisms of high-F groundwater in Xiong’an New Area remain unexplored. Consequently, 365 groundwater samples (172 from shallow groundwater, 193 from deep groundwater) were collected from Xiong’an New Area. Hydrochemical analysis, geochemical modeling, and statistical analysis were used to explore the occurrence and formation mechanisms of high-F groundwater. The results reveal that the highest F concentrations in shallow and deep groundwater were up to 3.22 mg/L and 1.79 mg/L, respectively. High-F groundwater was primarily located at the eastern part of the study area. The distribution area of high-F shallow groundwater was much greater than that of deep groundwater. F-bearing minerals dissolution and ion exchange were the principal formation mechanisms of high-F groundwater in both shallow and deep aquifers. Moreover, competitive adsorption, evaporation, and the impacts of Ca2+ and Mg2+ dissolution equilibrium on F-bearing dissolution were crucial to the formation of high-F groundwater in shallow aquifers. Desorption in an alkaline environment, evaporites dissolution and salt effects were vital to the formation of high-F groundwater in deep aquifers. These findings can contribute to the support of local groundwater security and management.

1. Introduction

The occurrence of natural inferior groundwater, particularly high-fluoride (high-F) groundwater, is a significant issue to the health of residents who rely on groundwater as their primary drinking water source [1,2,3,4]. Excessive intake of fluoride from groundwater that exceeds standard levels can lead to fluorosis, triggering dental fluorosis and skeletal fluorosis [5,6,7]. As mentioned in the study of Hossain and Patra [8], over 260 million people are currently affected by the intake of F contaminated groundwater as drinking water, including United States [9], Pakistan [10], Iran [11], India [12], South Africa [13], China [14,15] and other countries. To reduce the impacts of F contaminated groundwater, the guideline value of F in groundwater, proposed by the WHO, is 1.5 mg/L [16]. For China, both the standard for drinking water quality (GB/T5749-2022) [17] and standard for groundwater quality (GB/T14848-2017) [18] recommend that the F concentration should be no more than 1.0 mg/L. In the arid and semi-arid regions of northern and northwestern China, high-fluoride groundwater is extensively found, influenced by climatic and geological conditions [19,20,21]. Simultaneously, F containing pollutants from relevant industrial and agricultural processes act as exogenous inputs, directly or indirectly releasing into the aquifers, further resulting in the degradation of groundwater quality in these regions.
Typically, the geogenic sources of fluoride in groundwater are intricate and varied. These sources are primarily linked to the mineral composition of the underlying bedrocks, encompassing magmatic and metamorphic rocks, with sedimentary deposits playing a lesser role [22,23]. Rashid et al. [24] investigated the pollution source desorption and health risks caused by high-F groundwater in an industrial and mining mixed zone at the Dargai region in northern Pakistan. Parvaiz et al. [10], using stable isotopes and geochemical modeling, found that mineral dissolution and ion exchange processes were the primary cause of F enrichment in groundwater in the central region of the Indus river basin. High-F groundwater is widely distributed in various regions in China, such as northwest and northern China, and its distribution is often associated with climatic conditions, topographical features, and geochemical processes [25,26,27,28]. Su et al. [29] utilized isotope hydrochemical methods to elucidate the mechanism of fluoride release in the groundwater of Datong basin in Shanxi. They highlight the way in which the F enrichment in their study area was primarily governed by long-term water–rock reactions and significant evaporation. Li et al. [30] selected three profiles to explore the occurrence and migration mechanisms of fluoride in groundwater across the North China Plain by using hydrochemical analysis and geochemical inversion models. Their findings indicate high salinity and that the increase in some ion concentrations (such as Mg2+) are the primary causes of fluoride enrichment in the North China Plain and its coastal areas. In addition, human activities can exacerbate F pollution in groundwater through their related processes, such as by their effects on precipitation, agricultural irrigation, the leakage of industrial waste residues, and their effects on the infiltration of surface water [14,31,32].
On 1 April 2017, the Chinese government announced the establishment of the Xiong’an New Area, aiming to alleviate non-capital functions from Beijing and explore an innovative urban development model prioritizing ecological conservation [33,34,35]. Located in the semi-arid North China Plain, Xiong’an New Area is the largest alluvial plain in east Asia, and faces serious water scarcity issues [36]. Groundwater has consistently served as the primary source for drinking, agricultural activities, and industrial processes [37]. Excessive groundwater extraction has led to significant changes in groundwater flow conditions and chemical characteristics [38], resulting from a combination of declining groundwater levels and the mixing of groundwater from different aquifers [39]. Furthermore, Xiong’an New Area boasts the largest natural freshwater wetland in China—Baiyangdian. Baiyangdian plays a crucial role in the region by providing drinking water, supporting agriculture, climate regulation, flood control, and other functions [40]. Groundwater holds significant importance in the maintenance of the ecological functions of Baiyangdian and in meeting the anticipated water demand for Xiong’an New Area. Currently, the analysis for genesis and migration patterns of high-F groundwater in NCP has been primarily focused on regions such as Shijiazhuang city [41], Zhangjiakou region [42], Cangzhou city [43], and Hengshui city [44]. For example, F concentration in the groundwater of Cangzhou city was up to 5.59 mg/L [45] and 0.05–9.71 mg/L in Zhangjiakou region [46]. However, the occurrence and formation mechanisms of high-F groundwater in Xiong’an New Area is still unknown. It is crucial to understand the mechanisms of high-F groundwater formation in Xiong’an New Area. The findings are vital to revealing the health risks faced by local residents in Xiong’an New Area, and also contribute to the development of the groundwater ecological environment in the Beijing–Tianjin–Hebei urban agglomeration.
Thus, the objectives of this study are (1) to identify the range of various hydrogeochemical processes and the distribution of high-F groundwater in the study area, and (2) to reveal the formation mechanisms responsible for high-F groundwater in the Xiong’an New Area. In total, 365 groundwater samples from shallow and deep aquifers were collected. Hydrogeochemical analysis, geochemical modeling, and statistical analysis were conducted to illustrate the high-F groundwater formation mechanisms in Xiong’an New Area. These findings can contribute to the provision of a scientific proof for local groundwater security and management.

2. Research Area

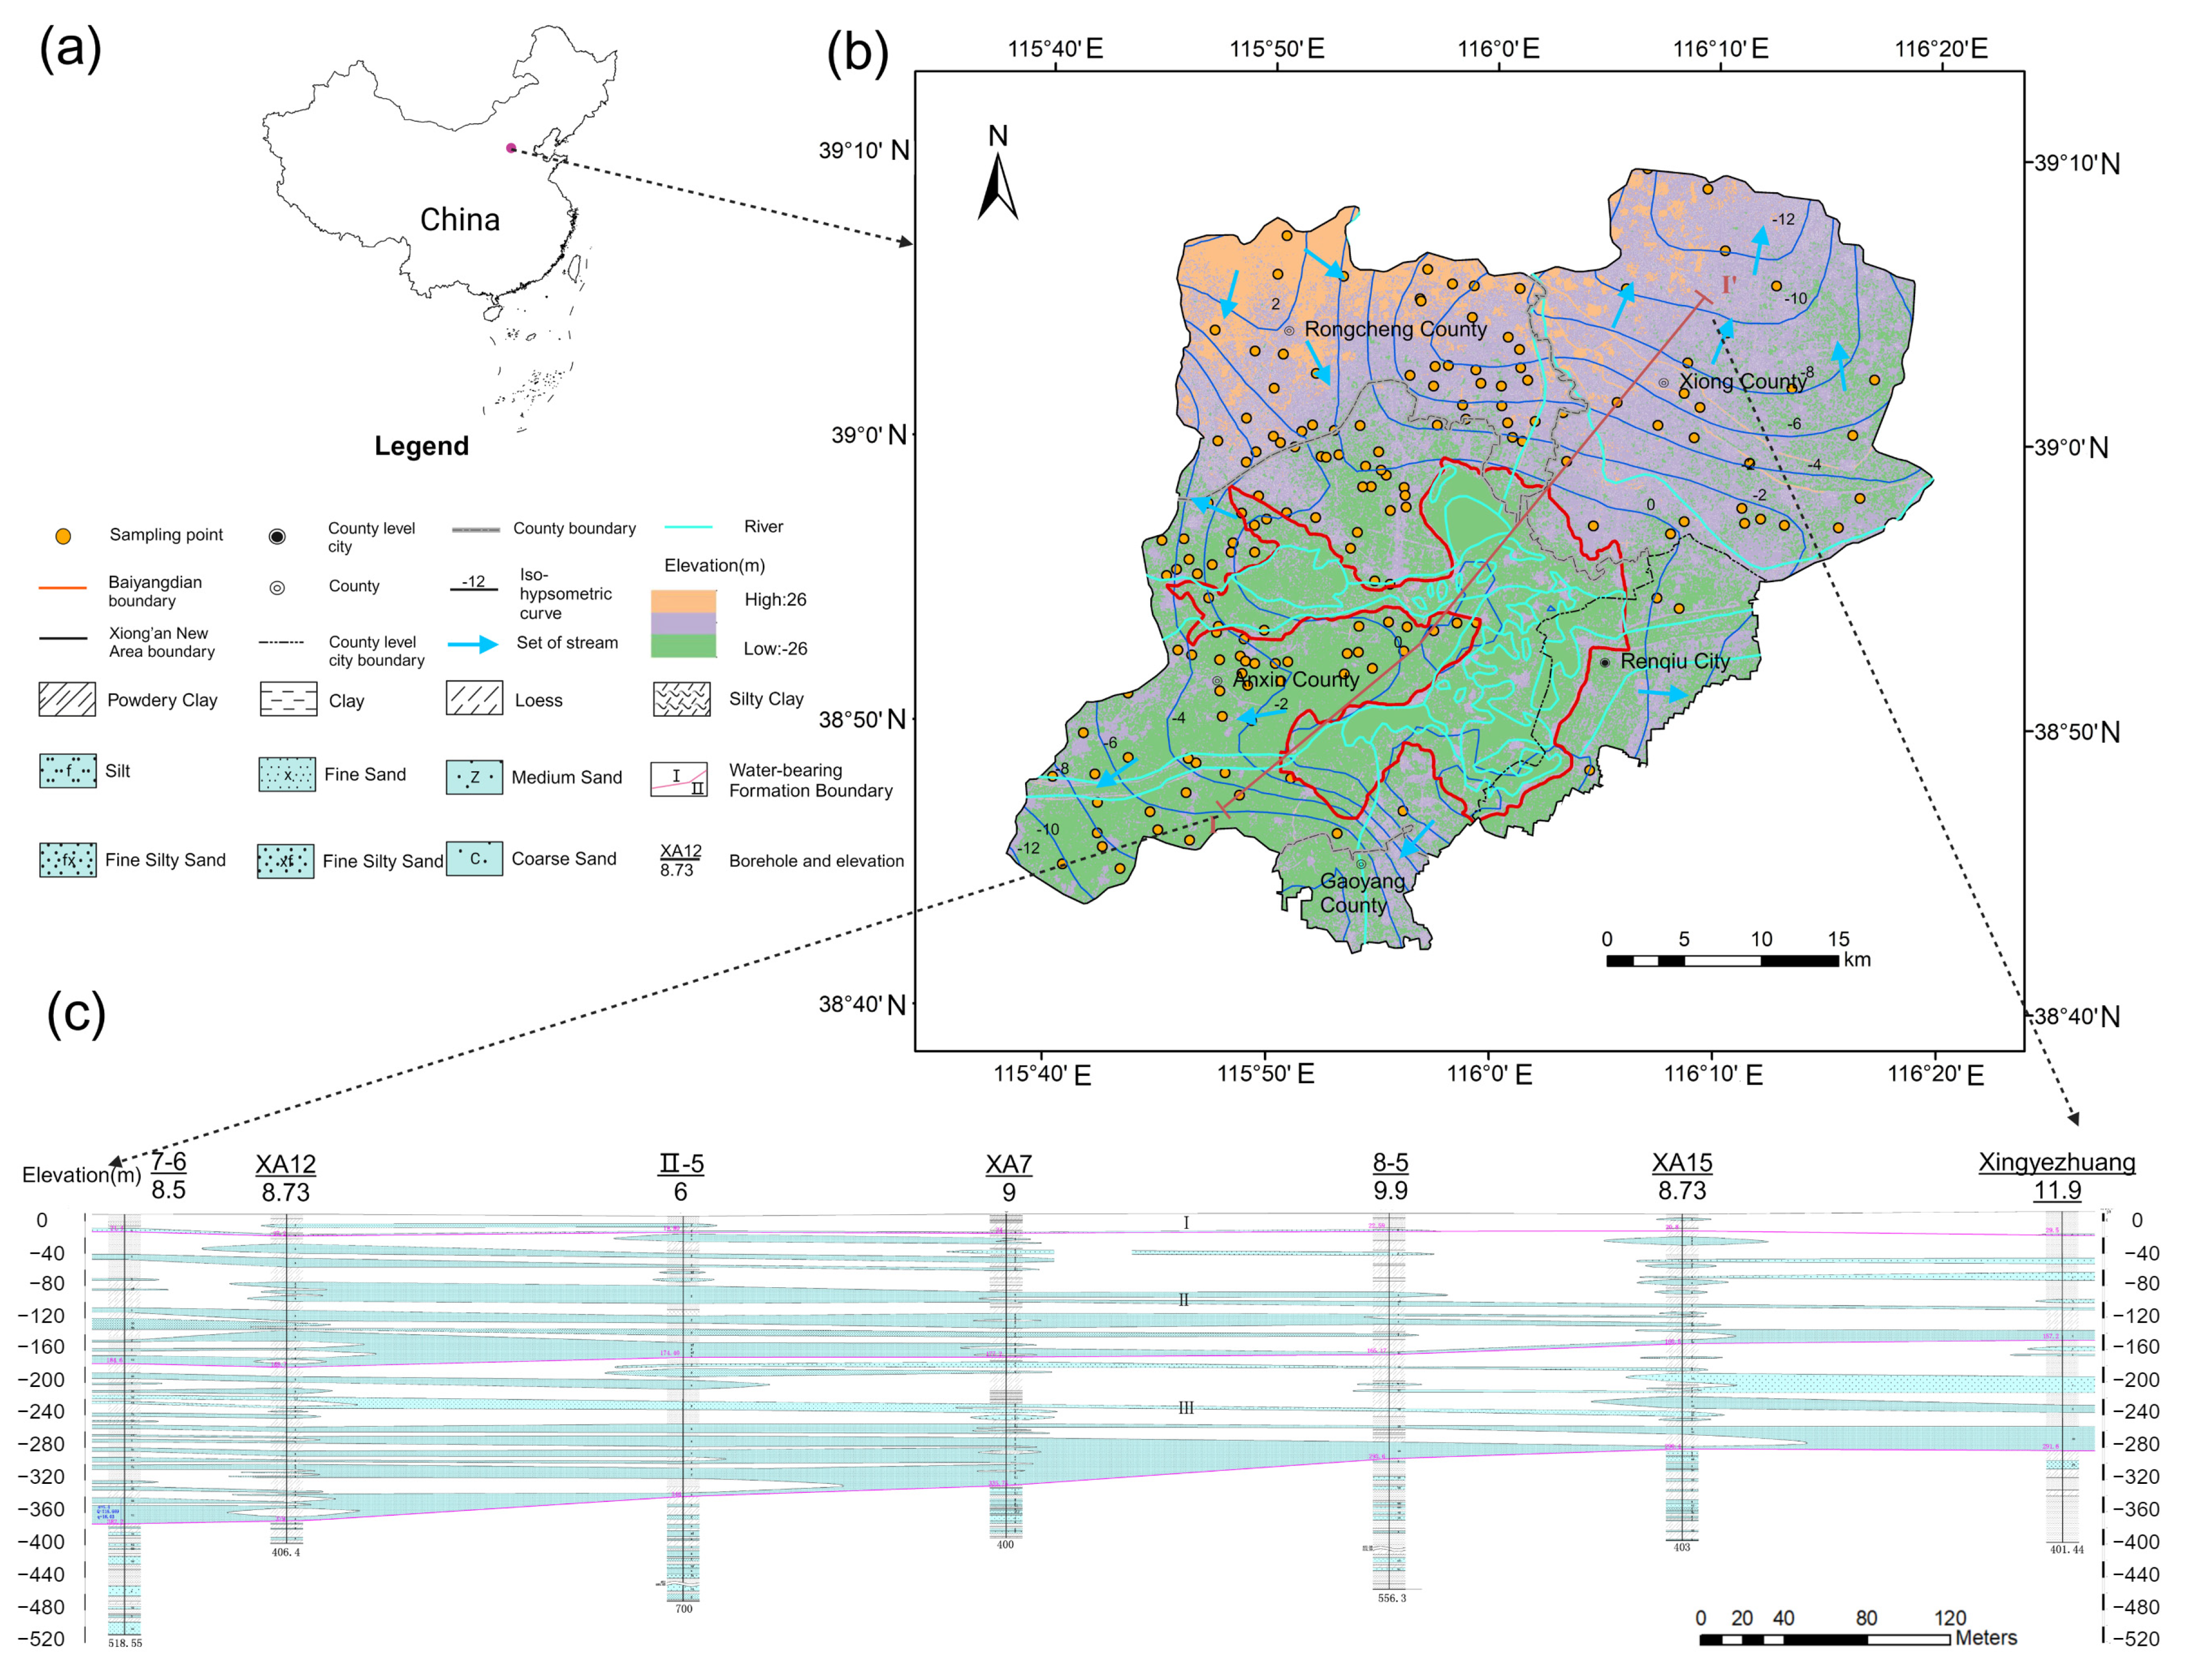
2.1. Overview of the Research Area

Xiong’an New Area is located in the plain terrain east of the Taihang mountains (38°41′55″–39°10′16″ N, 115°37′51″–116°19′39″ E). It includes Rongcheng county, Xiongxian county, Anxin county and some areas of Renqiu city and Gaoyang county (Figure 1). The terrain gradually slopes from the northwest to the southeast, with elevations ranging from 5 to 26 m. The ground slope ranges from 0.2 to 0.7‰, and the topography is generally flat. Due to the Jizhong depression, the diversion of the Yellow river, and the historical presence of alluvial fans from the Yongding river and the Hutuo river in the eastern foot of the Taihang mountains, the southern part of the Xiong’an New Area has formed Baiyangdian, the largest freshwater lake in the NCP. The study area experiences a warm temperate monsoon continental climate, characterized by semi-humid and semi-arid conditions. The average annual temperature is 12.7 °C, accompanied by an average annual precipitation (2013–2023) of 522.9 ± 75.7 mm. In the Baiyangdian area, the annual average evaporation from the water surface is approximately 1761.7 mm. The water system in Xiong’an New Area is well developed, featuring rivers and canals crisscrossing the landscape, along with numerous lakes scattered throughout, all constituting the Daqing river system within the Haihe river basin.

2.2. Stratum Lithologic and Main Mineral Composition

The study area predominantly distributes in the pre-Quaternary strata and Quaternary strata. The lithology characteristics of the stratigraphy, from older to newer formations, are summarized as follows: the main lithology of the Archean is gneiss, with burial depths typically exceeding 3500 m, and limited exposure in drilling activities. The middle–upper Proterozoic includes the Qingbaikou system, the Jixian system and the Great Wall system. Among these, the Wumishan formation of the Jixian system has a large distribution area and thick strata, which is the main karst aquifer and thermal reservoir in this area. The lithology of the Wumishan formation is mainly dolomite and mudstone with a total thickness of 1045–2620 m. The Paleozoic comprises Ordovician and Cambrian formations, with less distribution in Xiong county and more widespread occurrence in Rongcheng county and Anxin county. The main lithology is dolomite limestone, limestone and mudstone. The Paleogene strata primarily consist of lacustrine and fluvial facies sandstone and mudstone, occasionally featuring conglomerate and shale. The Neogene, including the Minghuazhen formation and the Guantao formation, serves as a sandstone-type thermal reservoir in this area. Minghuazhen group is distributed in the whole area and is about 1000 m thick, while the Guantao formation is widely distributed in Xiong county and Anxin county and in the southeast of Rongcheng county and is about 800 m thick. The rivers in the Taihang mountain area in the west of Xiong’an New Area are well-developed. The basin mainly involves the Gaoyuzhuang formation, the Wumishan formation, the Hongshuizhuang formation and the Tieling formation of the Jixian system, and the rocks are mainly dolomite. According to the Quaternary geological map of Hebei province, the total thickness of the Quaternary strata in this area is less than 430 m, predominantly consisting of fine sand and silt.
Xia et al. [47] have confirmed that the silicate minerals in the aquifer of the study area are mainly albite and contribute Na and HCO3 to the groundwater. Fluorite and gypsum are the main salt minerals. Fluorite contributes F and Ca2+ to groundwater, and gypsum contributes Ca2+ and SO42−. Carbonate minerals are mainly dolomite and calcite. In the mineral–water–gas system, Na+, Ca2+, Mg2+, HCO3 and other substances in the water can arise from the dissolution of isosoluble minerals (no intermediate products) or the weathering of non-isosoluble minerals (intermediate products, such as kaolinite).

2.3. Hydrogeology

The entire terrain of Xiong’an New Area lies within the plain region of the Daqing river basin’s groundwater system. The prevailing groundwater type comprises porous water from the unconsolidated rock formations of the Quaternary period, featuring aquifer lithology predominantly composed of medium-to-fine sand. Shallow groundwater (SG) in the region includes both unconfined and shallow confined water. The aquifer primarily consists of medium-to-fine silt and fine sand. The water inflow of a single well in most areas of the SG aquifer is 1000–2000 m3/d, classifying them as moderately water-rich areas. The aquifer system’s thickness is typically less than 40 m, with the depth to the bottom boundary ranging from 120 to 200 m. In the southern part of Xiong’an New Area, there is the notable presence of a saline water zone. Deep groundwater (DG) is characterized as confined water, with the aquifer lithology mainly consisting of coarse, medium, and fine sand. The aquifer’s lithology is predominantly composed of medium-to-fine silt and fine sand. The water inflow of a single well in most areas of the SG aquifer is 2000–3000 m3/d, classifying them as strong water-rich areas. The deep aquifer system’s thickness typically varies between 100 and 180 m, with a depth to the bottom boundary of 385–550 m. SG aquifer recharge in the study area primarily results from precipitation infiltration, river (pond) water infiltration, irrigation return flow, and lateral flow recharge. The primary method for groundwater discharge is human extraction, followed by lateral flow and overland flow discharge. Near Baiyangdian, the groundwater depth is no more than 4 m, experiencing a minor amount of evaporation, and with depths ranging from 5 to 20 m. As for DG in Xiong’an New Area, this mainly receives lateral flow and overland flow recharge, and its main discharge methods are human extraction and lateral flow. The water table depth for DG typically ranges from 25 to 35 m.
The SG in Xiong’an New Area can be directly exchanged with the external water, and the update rate is fast [48]. Numbers of water resources evaluation studies have shown that precipitation infiltration recharge in the North China Plain accounts for 70–80% of SG recharge. In its natural state, as far as the plain area of the whole basin is concerned, the direction of SG and DG runoff in the north is from north to south, and in the south is from south to northeast. Due to extensive groundwater exploitation, the study area has developed several large-scale funnels, including the Xiongxian shallow groundwater level depression funnel, the Gaoyang–Lixian–Qingyuan shallow groundwater level depression funnel (Gaoliqing funnel), and the groundwater level depression funnel at the junction of Xushui and Anxin (Xushui funnel). These funnels change the direction of groundwater flow in the study area, causing groundwater around the funnel to converge toward the center. However, the DG is deeply buried and cannot be directly recharged by external water. The water cycle undergoes slow alternations. Isotope information shows that DG primarily consists of water supplied during the last glacial period, and its renewal capacity is notably limited. The average resident time of groundwater in the aquifer in Xiong’an New Area is 30–40 years [49,50].

3. Methods and Materials

3.1. Water Sampling and Detection

In June–July 2019, there were 365 samples obtained from the monitoring wells for hydrochemical analysis, as depicted in Figure 1. In total, 172 of these were derived from the SG, with the water extraction occurring at depths of 15–80 m. Additionally, 193 of them came from the DG, with extraction depths of 200–320 m. In a similar manner to the study of Hu et al. [50], F-containing groundwater was divided in to the following three groups, dependent on the recommended guideline values of F in the drinking water standards of the WHO and of China (GB/T5749-2006) [51]: low-F ([F] ≤ 1.00 mg/L); moderate-F (1.00 < [F] ≤ 1.50 mg/L); and high-F ([F] > 1.50 mg/L).
The shallow aquifer mainly exists in the form of ancient rivers, and the wells used to collect samples are mostly residential drinking water wells and irrigation wells. During field investigations, the HACH SL1000 was employed to measure the physical and chemical parameters of groundwater, including pH, temperature, and TDS. Alkalinity and CO2 content were measured by titration methods. Subsequently, samples were transported to the designated laboratory at the China Institute of Geo-Environmental Monitoring for analysis. The laboratory conducted analyses of major ions, including K+, Ca2+, Na+, Mg2+, Cl, NO3, SO42− and silicates, using titration for some ions, flame photometry for sodium and potassium, and spectrophotometry for others. All analyses were completed within 48 h of sample collection. The detection limits of the target parameters (Table S1) and the details of quality assurance and quality control (QA/QC) analysis (Text S1) are shown in the Supplementary Materials.

3.2. Data Analysis

Statistical analysis of the target physicochemical parameters was undertaken using SPSS 23.0. The spatial distribution maps depicting fluoride concentration in groundwater across the study area were generated through the inverse distance weight (IDW) interpolation method in ArcGIS 10.4 [52].
AQqa 1.1 software was used to identify the hydrochemical type of each of the groundwater samples. Hydrochemical diagrams, Gibbs diagrams, and bivariate analysis were employed to assess the geochemical processes influencing the distribution and enrichment of F in groundwater [3,29,46]. Additionally, saturation index (SI) values for the typical minerals (e.g., fluorite, dolomite, gypsum, and halite) were calculated by SUPCRTBL [53], PHREEQC 3.0 [54], and the latest database [55].
Furthermore, to investigate the impacts of cation exchange processes, we employed linear relationships between HCO3+SO42−-Ca2+-Mg2+ and Cl-Na+-K+ [56], as well as Schoeller’s chloride–alkalinity indices (CAI-1 and CAI-2) to assess the influence of cation exchange on the formation of high-F groundwater [57]. Specifically, a slope closer to −1 in the linear fitting between HCO3+SO42−-Ca2+-Mg2+ and Cl-Na+-K+ indicates a more significant impact of cation exchange on ion composition of groundwater.

4. Results

4.1. General Hydrochemistry of Groundwater

Generally, the pH values of SG and DG were 6.88–8.60 (average value of 7.58) and 6.79–8.90 (average value of 7.91) in the study area, respectively (Table 1). The groundwater was under weak alkaline condition. For SG, there was a quantitative relationship among the average concentrations of typical hydrochemical parameters: HCO3 > Cl > Na+ > NO3 > Ca2+ > Mg2+ > SiO2 > SO42− > CO32− > K+ > F. TDS concentration ranged from 7.06–3913.60 mg/L (average value: 920.27 mg/L). F concentration had a range of 0.17–3.22 mg/L (average value of 0.70 mg/L), and 19.1% and 7.0% of the SG samples were higher than 1.00 mg/L and 1.50 mg/L, respectively (Table 1 and Table S2). For DG, the average concentrations of the typical hydrochemical parameters were in the order of HCO3 > Na+ > Cl > NO3 > Ca2+ > SiO2 > Mg2+ > SO42− > CO32− > K+ > F, and the TDS concentration ranged from 35.70–3836.43 mg/L (average value of 397.63 mg/L). F concentration ranged from 0.11 to 1.79 mg/L (average value: 0.46 mg/L), and 13.5% and 2.1% of the DG samples were higher than 1.00 mg/L and 1.50 mg/L, respectively (Table 1 and Table S2).
As shown in the Gibbs diagrams, the majority of samples from SG were in the rock-weathering dominance zone (Figure S1a,b). Some SG samples, especially moderate- and high-F groundwater samples, belonged to evaporation–crystallization dominant zones (Figure S1a,b). This illustrates that rock weathering is the major mechanism governing groundwater chemistry; however, evaporation–crystallization could also govern the groundwater hydrochemistry characteristics, particularly for the moderate- and high-F groundwater samples. For DG samples, almost all of the samples were within the rock-weathering dominance zone, signifying that DG chemistry characteristics were primarily affected by rock-weathering processes (Figure S1c,d).
The predominant hydrochemical type of the SG was HCO3, transitioning from HCO3-Ca·Mg towards HCO3-Na·Mg and SO4(SO4·HCO3)-Na·Mg(Na·Ca) in the direction from northwest to southeast. The predominant hydrochemical type of DG was HCO3-Na (Ca·Mg) (Figure 2).
Most groundwater samples were situated within or close to the silicate-dominant area (Figure S2). Some samples, especially those with moderate F concentrations, were located within or near the evaporate-dominant area. Additionally, there was a higher occurrence of SG samples falling within or near the evaporates-dominant area compared with the deep groundwater samples (Figure S2), demonstrating that evaporation did affect the groundwater chemistry in the moderate-F areas, especially for the shallow aquifers. Due to the better fitting of the contribution of carbonate and dolomite dissolution, the contributions of calcite, dolomite and gypsum dissolution to DG formation were more significant than they were to the SG (Figure S3a,b,d,e). Most of the moderate- and high-F groundwater samples were located above the halite dissolution equilibrium line (Na+:Cl = 1:1), indicating that the formation mechanisms of those groundwater samples involved more than halite dissolution (Figure S3c,f). Moreover, according to the Spearman correlation analysis results, positive correlation relationships between F and HCO3 existed in the SG samples (R2 = 0.41, p < 0.05) (Figure S4a) and the DG samples (R2 = 0.21, p < 0.05) (Figure S4b). This reveals that the impacts of competitive adsorption on SG geochemistry were more significant than they were on DG geochemistry, while positive correlation between F and Na+ (SG: R2 = 0.44, p < 0.05; DG: R2 = 0.68, p < 0.05) and SO42− (SG: R2 = 0.21, p < 0.05; DG: R2 = 0.19, p < 0.05) were more significant than competitive adsorption. This might illustrate the way in which the dissolution of evaporites and the salt effect could be major reasons for DG chemistry formation in the study area.

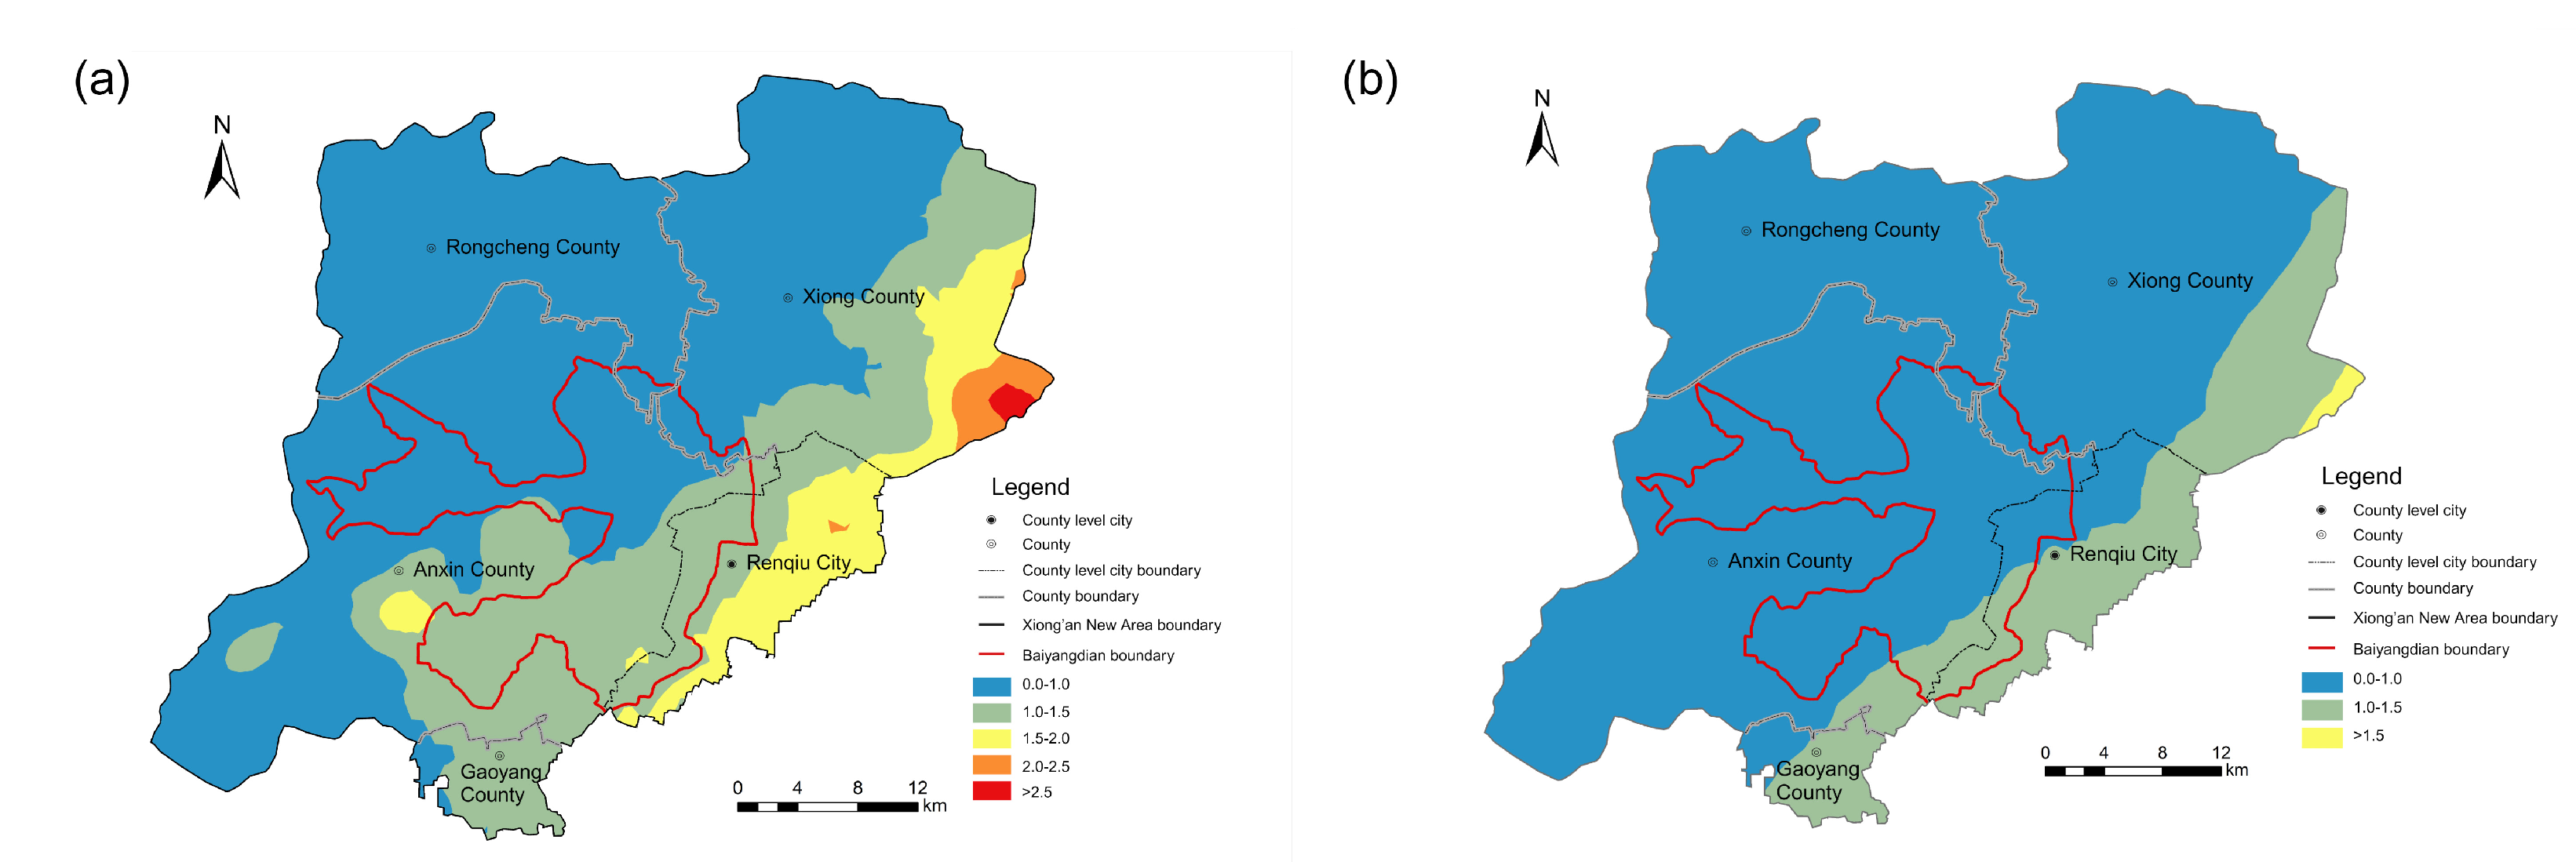
4.2. Distribution of Fluoride-Bearing Groundwater

Figure 3 shows the spatial distribution of F-bearing groundwater in the study area. Overall, the low F area in the shallow aquifers covered 62.2% of the study area and deep aquifers took up 83.3% of the study area. The regions of moderate- and high-F groundwater in the shallow aquifers were larger than those in the deep aquifers. For SG, the moderate- and high-F regions covered 28.1% and 9.7%, respectively. Specifically, the moderate-F area was mainly located in the eastern and southeastern parts of the study area, including Xiong county (1.27–1.45 mg/L), Anxin county (1.00–1.49 mg/L), and Renqiu city (1.30–1.45 mg/L). Meanwhile, SG in Gaoyang county also belonged to the moderate-F area (1.00–1.50 mg/L) (Figure 3a). High-F areas were mainly located in the eastern part of the study area (Xiong county, 1.87–3.22 mg/L). For DG, the moderate- and high-F areas covered 16.3% and 0.4%, respectively. Among these, moderate-F area were mainly distributed in the eastern and southeastern parts of the study area, including Xiong county (1.32–1.50 mg/L), Renqiu city (1.00–1.38 mg/L), and Gaoyang county (1.00–1.49 mg/L); high-F areas were only located in Xiong county (1.54–1.79 mg/L) (Figure 3b).

4.3. Hydrochemical Processes for Fluoride Enrichment

There is no doubt that F-bearing minerals dissolution is the principle geochemical process for F release. As shown in Table 1, Table S1 and S2, whether for the SG or DG samples, the saturation index (SI) of fluorite consistently remained below 0. Meanwhile, most low- and moderate-F SG samples, and almost all DG samples were under the fluorite dissolution line (Figure 4a,b). A significant positive correlation between F concentration and SIfluorite was shown in SG and DG samples (Figures S5 and S6). All of these results indicate that the hydrolysis of fluorite is the predominant controlling factor for F enrichment in the study area. Noting that, the majority of high-F SG samples were above the fluorite dissolution line (Figure 4a), illustrating that the genesis of high-F groundwater was complex in the shallow aquifers.
For the hydrolysis of other minerals, the average SIcalcite values of low-, moderate-, and high-F groundwater in the SG samples were 0.36, 0.24 and 0.29, respectively and the average SIdolomite values of low-, moderate-, and high-F groundwater in SG samples were 1.25, 1.09 and 1.52, respectively (Table S2). For the DG samples, SIcalcite values in low-, moderate-, and high-F groundwater were −1.01, 0.21, 0.26, respectively and the average SIdolomite values of low-, moderate-, and high-F groundwater were −1.92, 0.71 and 1.09, respectively (Table S3). In all groundwater samples, both SIcalcite and SIdolomite exhibited a simultaneous transition from negative to positive values. Meanwhile, SIgypsum values consistently remained below zero, regardless of whether calcite and dolomite were undersaturated or not (Figures S5 and S6). Additionally, regions characterized by calcite dissolution dominance (above the 1:1 line) were predominantly associated with low-F SG and DG samples. Conversely, areas with dolomite dominance (below the 1:1 line) were mainly attributed to moderate- and high-F SG and DG samples (Figures S5e and S6e).
Notably, 93.6% of SG samples and 98.4% of DG samples were located in the CAI-1 and CAI-2 negative zone, respectively (Figure 5a,c). Moreover, the negative relationship between Cl-Na+-K+ and HCO3+SO42−-Ca2+-Mg2+ in the SG samples with a slope of −0.96 (R2 = 0.98) was similar to that in the DG samples with a slope of −0.94 (R2 = 0.98) (Figure 5b,d). According to Figure S7, most low- and moderate F SG samples and DG samples were distributed along the F-bearing mineral dissolution line and halite dissolution line. The numbers of moderate- and high-F SG samples located at the evapotranspiration line were more than those in DG samples.

5. Discussion

5.1. Genesis Analysis of Groundwater Hydrochemistry

The formation of SG and DG in Xiong’an New Area is likely different due to the discrepancy in hydrogeochemical processes. Overall, the mechanisms of SG formation are more complex than those of DG. The formation of SG and DG in the study area is mostly influenced by silicate weathering. According to Figure 2 and Figure 5, ion exchange has occurred between the dissolved Mg2+ and Ca2+ in the groundwater and the adsorbed Na+ and K+ in the sediments, resulting in the HCO3-Ca·Mg, HCO3-Na·Mg, SO4(SO4·HCO3)-Na·Mg(Na·Ca) types of groundwater in shallow aquifers, and HCO3-Na (Ca·Mg) types of groundwater in deep aquifers. Furthermore, halite dissolution contributes to the enrichment of Na+ and Cl in both SG and DG (Figure S3c,f). In shallow aquifers, dolomite and gypsum dissolution have also impacted the groundwater formation due to the deviation of groundwater samples from the dissolution equilibrium line (Figure S3a,b); however, this was not the major reason for DG formation. Due to the discrepancy in the depth of aquifers, the evaporation–crystallization process only governed the groundwater hydrochemistry of moderate- and high-F in the SG samples (Figures S1 and S2). Noting that, although halite dissolution contributes to the formation of SG and DG in the study area, the deviation of SG samples from the halite dissolution is more clear than that of DG samples (Figure S3c,f). Halite, as a significant evaporite, plays a crucial role in identifying the source of salinization in groundwater [58]. The distinct deviation of SG samples from the halite dissolution line (Figure S3c) is potentially attributed to processes including silicate dissolution, alkaline inputs, and/or cation exchange [56].
Thus, a mixed process of silicate weathering, hydrolysis of sedimentary rocks (dolomite, gypsum), evaporites dissolution, evaporation–crystallization and ion exchange are the principal mechanisms for SG formation in the study area, while silicate weathering, ion exchange and evaporites dissolution are the major mechanisms for DG formation in the study area.

5.2. Formation Mechanisms of High Fluoride Groundwater

5.2.1. Alkaline Environment

An alkaline environment can promote the desorption of F into groundwater, leading to a subsequent increase in F concentration. In the study area, the average pH values for SG and DG were 7.58 and 7.91, respectively. Under weak alkaline conditions, chemically active F readily undergoes substitution with OH within the mineral lattices [59]. This is because the ion radii of F and OH are similar (ROH = 0.136 nm, RF = 0.133 nm) [60], as are their charges, resulting in the mutual exchange between F and OH.
Fluoride is typically dispersed in aluminosilicate minerals [61], further facilitating F release. The desorption processes involving Fe-oxides, Al-oxides, and oxyhydroxides can contribute to an increase in F concentration [62]. Additionally, hydroxy minerals, including muscovite and biotite, are prevalent in Xiong’an New Area, serving as potential sources for the release of F by providing abundant exchangeable F [63].

5.2.2. Competitive Adsorption

The impacts of competitive adsorption on high-F SG formation are more significant than they are on DG formation. As mentioned in Section 3.1, there is a positive relationship between F and HCO3 in SG samples (R2 = 0.41, p < 0.05) and DG samples (R2 = 0.21, p < 0.05). For shallow aquifers, the average concentration of HCO3 in high- F groundwater samples (555.72 mg/L) is more than that observed in low-F groundwater samples (393.55 mg/L) (Table S2). Similarly, for deep aquifers, the average HCO3 concentration in high-F groundwater samples (358.18 mg/L) exceeds that found in low-F samples (234.66 mg/L) (Table S3). HCO3 functions as a robust competitor, competing with F for available adsorption sites and impeding the adsorption of F by sediments. The adsorbed F can subsequently be released into groundwater, particularly in an alkaline environment with elevated HCO3 concentrations. These processes are substantiated by other studies on the formation of high-F groundwater [56,64].

5.2.3. Evaporation

According to the Gibbs diagram result (Figure S1), the evaporation–crystallization process mainly governs the groundwater hydrochemistry of high-F groundwater samples in shallow aquifers. For the DG formation, almost none of the samples fall in the evaporation–crystallization zone, demonstrating that evaporation is not the groundwater formation mechanism in the deep aquifer. Under the impact of evaporation, the concentrations of Ca2+, HCO3 and other species escalate, leading to the oversaturation of calcite and dolomite [27,65]. This ultimately triggers the dissolution of fluorite. The SIcalcite and SIdolomite values in the study area support this (Tables S2 and S3).
Similarly, F/Cl ratio vs. [F] is also used to explain the impacts of evaporation on high-F groundwater formation (Figure S7). The results indicate that the impacts of evaporation processes on the high-F groundwater formation in shallow aquifers are also more significant than those in deep aquifers. Previous studies have relied on two assumptions to explain the variation between F and F/Cl:
(1)
The enrichment of F and F/Cl through evaporation is presumed to be equal, maintaining an unchanged F/Cl ratio [66];
(2)
The dissolution of F-bearing minerals/evaporites (such as halite) is believed not to contribute additional Cl or F to the groundwater [65].
There are two assumptions in the previous studies that are relied upon to interpret the variation between F and F/Cl:
(1)
Evaporation enriches F and F/Cl equally, so the F/Cl ratio is expected to remain unchanged [66];
(2)
F-bearing mineral/evaporite (halite) dissolution does not provide additional Cl or F into the groundwater [65].
As shown in Table 1, SIhalite and SIfluorite values are all less than 0. The first assumption should be more applicable to this study. Therefore, while evaporation plays a significant role in the formation of high-F groundwater in shallow aquifers, it is not the predominant mechanism for the formation of high-F groundwater in deep aquifers in the study area.

5.2.4. Evaporite Dissolution and Salt Effect

Evaporites dissolution (e.g., gypsum and halite) can enhance the enrichment of F in groundwater while concurrently promoting the precipitation of F in combination with other salts in crystalline form [65]. As shown in Figures S5–S7, gypsum and halite dissolution to SG is more obvious than they are to DG. This highlights the way in which the significance of fluoride originating from the dissolution and leaching of evaporites is more substantial in SG compared with DG.
Additional dissolution of NaCl or Na2SO4 can increase salt concentration and induce a decrease in SIfluorite [67]. In this study, there are positive relationships between F concentration and Cl concentration (R2 = 0.33) and SO42− concentration (R2 = 0.21) in SG and positive relationships between F concentration and Cl concentration (R2 = 0.48) and SO42− concentration (R2 = 0.59) in DG (Figure S4). The results of the correlation analysis suggest the possible existence of a salt effect on F release in both SG and DG in the study area. Additionally, the salt effect has the potential to increase the ionic strength, lower the SI values of fluorite, and consequently enhance the solubility of F in groundwater. As a result, the impacts of the salt effect on F enrichment in deep aquifers appear to be more pronounced than in shallow aquifers.

5.2.5. Ion Exchange

Fluoride release can occur through the cation exchange process, where Na+ is adsorbed on the clay minerals with Mg2+ and Ca2+ in groundwater [68]. The noteworthy negative correlation between (HCO3 + SO42−-Ca2+-Mg2+) and (Cl-Na+-K+) is significant for both shallow (R2 = 0.96) and deep (R2 = 0.96) groundwater samples, as shown in Figure 5b,d. This indicates that cation exchange is important to dissolved Na+ enrichment and therefore motivates F release in groundwater. According to the results of CAI-1 vs. CAI-2 (Figure 5a,c), 93.6% of SG samples and 98.4% of the DG samples have fallen in the negative zone, demonstrating the existence of a strong ion exchange process between dissolved Ca2+ and Mg2+in groundwater and adsorbed K+ and Na+ in the aquifer media.
After the cation exchange mentioned above, the Ca2+ concentration can be decreased, promoting the fluorite hydrolysis process in the direction of dissolution, finally resulting in F enrichment in groundwater. As stated in Section 2.1, Xiong’an New Area belongs to the NCP, and therefore, the mechanism for the formation of high-F groundwater through ion exchange in the study area is consistent with the findings of Li et al. [42]. The potential ion exchange processes can unfold as follows (Equations (1)–(4)):
Anion exchange (mentioned in Section 5.2.1):
CaF 2   +   2 OH = Ca ( OH ) 2   +   2 F
Cation exchange:
CaF 2   +   Na 2 CO 3   =   CaCO 3   +   2 Na +   +   2 F
CaF 2   +   2 NaHCO 3   =   CaCO 3   +   2 Na +   +   2 F   + H 2 O + CO 2
( Na +   +   K + ) - dissolved   +   ( Mg 2 +   +   Ca 2 + ) absorbed °   ° Ca 2 + + ( Mg 2 + + Ca 2 + ) - dissolved   + ( Na + +   K + ) absorbed

5.2.6. Dissolution Equilibrium of the Typical Minerals

Dissolution equilibrium and Ca2+ removal are two key factors for interpreting high-F groundwater formation during the dissolution of F-bearing minerals.
(1)
F-bearing minerals dissolution equilibrium
In Figure S5f and S6f, the positive correlations between F concentration and SIfluorite reveal that fluorite dissolution is a crucial governing factor for F enrichment in both SG and DG in the study area (Equation (5)).
CaF 2 Ca 2 +   + 2 F
The reaction rate constant (k) (pH = 8, at 22 °C) is 5.90 × 10⁻¹¹ mol/m2/s, and the log value of equilibrium constant (Ksp) of fluorite is −10.059 [54,55,69]. Whether it is a shallow aquifer or a deep aquifer, low-, medium- and high- fluorine groundwater samples are located below the fluorite dissolution line (Figure S5f and S6f). This demonstrates that, in the study area, the concentration of F in groundwater is predominantly controlled by the dissolution of fluorite. Additionally, the hydrolysis of other F-bearing minerals, such as muscovite and biotite, can contribute to an increase in F within aquifers. The log values of Ksp for muscovite and biotite (replaced by Fluorphlogopite in SUPCRTBL) [54] are −13.862 and −23.860, respectively. The hydrolysis reactions for these minerals are as follows (Equations (6) and (7)).
Fluorphlogopite (replace the biotite):
KMg 3 AlSi 3 O 10 F 2   +   8 H + Al 3 + +   3 Mg 2 +   +   K +   +   2 F   + 4   H 2 O + 3 SiO 2
Muscovite:
KAl 3 Si 3 O 10 ( OH , F ) 2   +   9 H + 3 Al 3 +   +   K +   +   F   +   5 H 2 O + 3 SiO 2
(2)
Calcium and magnesium dissolution equilibrium
In this study, calcite is oversaturated in 94.2% of SG samples and 81.3% of DG samples, while, dolomite is oversaturated in 98.2% of SG samples and 83.4% of DG samples (Figures S5c,d and S6c,d). Simultaneously, the molar ratio between Ca2+ and Mg2+ is employed to estimate the hydrolysis of calcite and dolomite. In Figures S5e and S6e, 93.9% of moderate- and high-F groundwater samples from shallow aquifers fall below the 1:1 line, whereas only 26.9% of moderate- and high-F groundwater samples from deep aquifers exhibit a similar trend. Under neutral or slightly alkaline conditions, the precipitation of MgCO3 is limited due to the inert kinetics of dolomite [70]. According to the studies conducted by Schafer et al. [71] and Turner et al. [72], the dissolution of calcite and dolomite results in the release of Ca2+ and Mg2+ into groundwater. This induces the precipitative removal of Ca2+ as calcite, while Mg2+ remains dissolved in groundwater, concurrently stimulating fluorite dissolution. Consequently, the impact of Ca2+ and Mg2+ dissolution on F-bearing minerals dissolution in SG is more significant than in DG.
The dissolution of gypsum is also crucial for the excessive release and removal of Ca2+ in groundwater. SIgypsum values for all groundwater samples consistently remain below zero, irrespective of whether calcite and dolomite are unsaturated or not (Figures S5c,d and S6c,d). Clearly, both gypsum dissolution and calcite precipitation occur simultaneously in both SG and DG. Concurrently, the oversaturation of calcite (SIcalcite > 0) and dolomite (SIdolomite > 0) leads to a reduction in dissolved Ca2+ and further stimulates gypsum dissolution. Meanwhile, this also contributes to the fluorite hydrolysis process in the direction of dissolution.

5.3. Practical Implication

This study reveals that geological and hydrogeochemical conditions influence the mechanisms of high-F groundwater formation across varying depths of aquifers. Thus, defluoridation and water improvement measures should differ depending on the mechanisms of F enrichment. Generally, water treatment methods, such as ion exchange, reverse osmosis, and electrodialysis, prove effective in significantly reducing F contamination in both SG and DG prior to water supply [73,74]. Additionally, relying on natural purification processes, such as aquifer recharge management, can further contribute to the mitigation of F contamination. Artificial percolation, slow sand filtration, and bank filtration are additional methods for improving groundwater quality, especially for shallow aquifers, offering new options [75,76,77].

6. Conclusions

In this study, the occurrence and formation mechanisms of high-F groundwater were investigated in Xiong’an New Area. In general, for SG, 19.1% and 7.0% of the samples exceed 1.00 mg/L and 1.50 mg/L, respectively. Correspondingly, 13.5% and 2.1% of the DG samples surpass the thresholds of 1.00 mg/L and 1.50 mg/L thresholds, respectively. In SG, the regions with moderate- and high-F account for 28.1% and 9.7%, respectively. Specifically, the areas with moderate F are predominantly situated in the eastern and southeastern parts of the study area, encompassing Xiong county (1.27–1.45 mg/L), Anxin county (1.00–1.49 mg/L), and Renqiu city (1.30–1.45 mg/L); high-F areas were mainly located in the eastern part of the study area, including Xiong county, (1.87–3.22 mg/L). For DG, the areas with moderate- and high-F account for 16.3% and 0.4%, respectively. Among these, moderate-F areas were mainly distributed in the east and southeast of the study area, including Xiong county (1.32–1.50 mg/L), Renqiu city (1.00–1.38 mg/L), and Gaoyang county (1.00–1.49 mg/L). High-F areas were distributed to the east of the study area, including Xiong county (1.54–1.79 mg/L).
In general, the dissolution of F-bearing minerals and ion exchange constitute fundamental mechanisms for the formation of moderate- and high-F groundwater in both SG and DG, within the study area. Additionally, competitive adsorption, evaporation, and the impacts of Ca2+ and Mg2+ dissolution equilibrium on F-bearing dissolution are the predominant mechanisms responsible for the formation and enrichment of moderate- and high-F groundwater in shallow aquifers. Desorption in an alkaline environment, the salt effect and evaporite dissolution play important roles in the formation of moderate- and high-F groundwater in deep aquifers. Regarding groundwater management, projects related to defluoridation and water improvement in the study area should be developed with customized strategies that account for variations in the mechanisms underlying the formation of high-F groundwater. These findings are crucial for understanding the occurrence and enrichment mechanisms of fluoride in aquifers at different depths in the Xiong’an New Area. They will also contribute to the improvement of ecological and groundwater environmental conservation in the Beijing–Tianjin–Hebei urban agglomeration and NCP.

Supplementary Materials

The following supporting information can be downloaded at: https://www.mdpi.com/article/10.3390/w16020358/s1, Figure S1: Gibbs diagrams of groundwater samples in the study area, (a) and (b) denote TDS vs. Na+/(Na+ + Ca2+) and TDS vs. Cl/(Cl + HCO3) in SG samples, respectively and (c) and (d) denote TDS vs. Na+/(Na+ + Ca2+) and TDS vs. Cl/(Cl + HCO3) in DG samples. Figure S2: Scatterplots of major ions to explain the formation of groundwater, (a) denotes Na+-normalized Ca2+ vs. Mg2+, (b) denotes Na+-normalized Ca2+ vs. HCO3 in SG samples, (c) denotes Na+-normalized Ca2+ vs. Mg2+, and (d) denotes Na+-normalized Ca2+ vs. HCO3 in DG samples, respectively. Figure S3: Scatterplots (a) and (d) show (HCO3 + SO42−) vs. (Ca2+ + Mg2+) to verify the contribution of carbonate and dolomite dissolution in shallow and DG samples, respectively; (b) and (e) show (Ca2+ + Mg2+-HCO3) vs. SO42− to illustrate gypsum dissolution in shallow and DG samples, respectively; and (c) and (f) show Na+ vs. Cl to explore halite dissolution in shallow and DG samples, respectively. Figure S4: The results of Spearman correlation analysis for typical hydrogeochemical parameters in shallow and DG samples are shown in (a) and (d) respectively. The asterisk marks represent the p < 0.05. Figure S5: Scatterplots for evaluating fluorite dissolution and other mineral hydrolysis in SG samples. Scatterplots of (a) and (b) denote SIcalcite vs. SIfluorite and SIdolomite, respectively; (c) and (d) denote SIgypsum vs. SIcalcite and SIdolomite, respectively; (e) denotes Ca2+ vs. Mg2+; and (f) denotes SIfluorite vs. [F]. Figure S6: Scatterplots for evaluating fluorite dissolution and other minerals hydrolysis in DG samples. Scatterplots of (a) and (b) denote SIcalcite vs. SIfluorite and SIdolomite, respectively; (c) and (d) denote SIgypsum vs. SIcalcite and SIdolomite, respectively; (e) denotes Ca2+ vs. Mg2+; and (f) denotes SIfluorite vs. [F]. Figure S7: Evaluation of the impacts of evaporation on F by the scatterplots for F/Cl ratio vs. [F]. Text S1: Quality control (QC) and quality assurance (QA). Table S1: Summary of measurement methods and detection limits for the groundwater samples. Table S2: Minimum, maximum and average values of the chemical compositions of low-, moderate- and high-F shallow groundwater in Xiong’an new area. Table S3: Minimum, maximum and average values of the chemical compositions of low-, moderate- and high-F deep groundwater in Xiong’an New Area. References [24,78,79,80] are cited in Supplementary Materials file.

Author Contributions

Conceptualization, B.H.; methodology, Y.D.; software, Y.D.; validation, Y.D. Z.W., D.W., K.Z. and B.H.; writing—original draft preparation, B.H. and Y.D.; writing—review and editing, B.H., Y.D., Z.W. K.Z. and D.W.; supervision, K.Z. and D.W.; project administration, K.Z. and B.H.; funding acquisition, K.Z. and B.H. All authors have read and agreed to the published version of the manuscript.

Funding

This research was financially supported by the National Natural Science Foundation of China (No. 42207264 and 41807220), the Open Fund Project of Hebei Key Laboratory of Geological Resources and Environment Monitoring and Protection (No. JCYKT201903), and the projects of the China Geological Survey (No. DD20189142 and DD20230430).

Data Availability Statement

The data that support the findings of this study are available from the corresponding author, K.Z. and B.H., upon reasonable request.

Conflicts of Interest

The authors declare no conflict of interest.

References

  1. Podgorski, J.; Berg, M. Global analysis and prediction of fluoride in groundwater. Nat. Commun. 2022, 13, 4232. [Google Scholar] [CrossRef]
  2. Li, C.; Gao, X.; Zhang, X.; Wang, Y.; Howard, K. Groundwater fluoride and arsenic mobilization in a typical deep aquifer system within a semi-arid basin. J. Hydrol. 2022, 609, 127767. [Google Scholar] [CrossRef]
  3. Rashid, A.; Ayub, M.; Bundschuh, J.; Gao, X.; Ullah, Z.; Ali, L.; Li, C.; Ahmad, A.; Khan, S.; Rinklebe, J. Geochemical control, water quality indexing, source distribution, and potential health risk of fluoride and arsenic in groundwater: Occurrence, sources apportionment, and positive matrix factorization model. J. Hazard. Mater. 2023, 460, 132443. [Google Scholar] [CrossRef] [PubMed]
  4. Kumar, M.; Goswami, R.; Patel, A.K.; Srivastava, M.; Das, N. Scenario, perspectives and mechanism of arsenic and fluoride co-occurrence in the groundwater: A review. Chemosphere 2020, 249, 126126. [Google Scholar] [CrossRef] [PubMed]
  5. Mukherjee, I.; Singh, U.K. Exploring a variance decomposition approach integrated with the Monte Carlo method to evaluate groundwater fluoride exposure on the residents of a typical fluorosis endemic semi-arid tract of India. Environ. Res. 2022, 203, 111697. [Google Scholar] [CrossRef] [PubMed]
  6. Sunkari, E.D.; Abu, M.; Zango, M.S. Geochemical evolution and tracing of groundwater salinization using different ionic ratios, multivariate statistical and geochemical modeling approaches in a typical semi-arid basin. J. Contam. Hydrol. 2021, 236, 103742. [Google Scholar] [CrossRef]
  7. Mwiathi, N.F.; Gao, X.; Li, C.; Rashid, A. The occurrence of geogenic fluoride in shallow aquifers of Kenya Rift Valley and its implications in groundwater management. Ecotox. Environ. Saf. 2022, 229, 113046. [Google Scholar] [CrossRef]
  8. Hossain, M.; Patra, P.K. Hydrogeochemical characterisation and health hazards of fluoride enriched groundwater in diverse aquifer types. Environ. Pollut. 2020, 258, 113646. [Google Scholar] [CrossRef]
  9. McMahon, P.B.; Brown, C.J.; Johnson, T.D.; Belitz, K.; Lindsey, B.D. Fluoride occurrence in United States groundwater. Sci. Total Environ. 2020, 732, 139217. [Google Scholar] [CrossRef]
  10. Parvaiz, A.; Khattak, J.A.; Hussain, I.; Masood, N.; Javed, T.; Farooqi, A. Salinity enrichment, sources and its contribution to elevated groundwater arsenic and fluoride levels in Rachna Doab, Punjab Pakistan: Stable isotope (δ2H and δ18O) approach as an evidence. Environ. Pollut. 2021, 268, 115710. [Google Scholar] [CrossRef]
  11. Yousefi, M.; Najafi Saleh, H.; Yaseri, M.; Jalilzadeh, M.; Mohammadi, A.A. Association of consumption of excess hard water, body mass index and waist circumference with risk of hypertension in individuals living in hard and soft water areas. Environ. Geochem. Health 2019, 41, 1213–1221. [Google Scholar] [CrossRef] [PubMed]
  12. Dhakate, R.; More, S.; Duvva, L.K.; Enjamuri, S. Groundwater chemistry and health hazard risk valuation of fluoride and nitrate enhanced groundwater from a semi-urban region of South India. Environ. Sci. Pollut. R. 2023, 30, 43554–43572. [Google Scholar] [CrossRef] [PubMed]
  13. Elumalai, V.; Nwabisa, D.P.; Rajmohan, N. Evaluation of high fluoride contaminated fractured rock aquifer in South Africa–Geochemical and chemometric approaches. Chemosphere 2019, 235, 1–11. [Google Scholar] [CrossRef]
  14. Xiao, Y.; Hao, Q.; Zhang, Y.; Zhu, Y.; Yin, S.; Qin, L.; Li, X. Investigating sources, driving forces and potential health risks of nitrate and fluoride in groundwater of a typical alluvial fan plain. Sci. Total Environ. 2022, 802, 149909. [Google Scholar] [CrossRef]
  15. Ministry of Health of China. China Health Statistical Yearbook; Peking Union Medical College Press: Beijing, China, 2010. [Google Scholar]
  16. World Health Organization. Guidelines for Drinking-Water Quality. World Health Organ. 2011, 216, 303–304. [Google Scholar]
  17. GB 5749-2022[S/OL]; Sanitary Standard for Drinking Water; State Administration for Market Regulation, Standardization Administration. Standards Press of China: Beijing, China, 2022.
  18. GB/T 14848-2017[S/OL]; Groundwater Quality Standard; General Administration of Quality Supervision, Inspection and Quarantine of the People’s Republic of China, Standardization Administration of China. Standards Press of China: Beijing, China, 2017.
  19. Gao, Z.; Shi, M.; Zhang, H.; Feng, J.; Fang, S.; Cui, Y. Formation and in situ treatment of high fluoride concentrations in SG of a semi-arid region: Jiaolai Basin, China. Int. J. Environ. Res. Public Health 2020, 17, 8075. [Google Scholar] [CrossRef]
  20. Yin, S.; Xiao, Y.; Han, P.; Hao, Q.; Gu, X.; Men, B.; Huang, L. Investigation of groundwater contamination and health implications in a typical semiarid basin of North China. Water 2020, 12, 1137. [Google Scholar] [CrossRef]
  21. Huang, L.; Sun, Z.; Zhou, A.; Bi, J.; Liu, Y. Source and enrichment mechanism of fluoride in groundwater of the Hotan Oasis within the Tarim Basin, Northwestern China. Environ. Pollut. 2022, 300, 118962. [Google Scholar] [CrossRef] [PubMed]
  22. Berger, T.; Mathurin, F.A.; Drake, H.; Åström, M.E. Fluoride abundance and controls in fresh groundwater in Quaternary deposits and bedrock fractures in an area with fluorine-rich granitoid rocks. Sci. Total Environ. 2016, 569, 948–960. [Google Scholar] [CrossRef]
  23. Zango, M.S.; Sunkari, E.D.; Abu, M.; Lermi, A. Hydrogeochemical controls and human health risk assessment of groundwater fluoride and boron in the semi-arid North East region of Ghana. J. Geochem. Explor. 2019, 207, 106363. [Google Scholar] [CrossRef]
  24. Rashid, A.; Farooqi, A.; Gao, X.; Zahir, S.; Noor, S.; Khattak, J.A. Geochemical modeling, source apportionment, health risk exposure and control of higher fluoride in groundwater of sub-district Dargai, Pakistan. Chemosphere 2020, 243, 125409. [Google Scholar] [CrossRef] [PubMed]
  25. Liu, H.; Guo, H.; Yang, L.; Wu, L.; Li, F.; Li, S.; Ni, P.; Liang, X. Occurrence and formation of high fluoride groundwater in the Hengshui area of the North China Plain. Environ. Earth Sci. 2015, 74, 2329–2340. [Google Scholar] [CrossRef]
  26. Cao, W.; Zhang, Z.; Guo, H.; Fu, Y.; Gao, Z.; Nan, T.; Ren, Y.; Li, Z. Spatial distribution and controlling mechanisms of high fluoride groundwater in the coastal plain of Bohai Rim, North China. J. Hydrol. 2023, 617, 128952. [Google Scholar] [CrossRef]
  27. Xiao, S.; Fang, Y.; Chen, J.; Zou, Z.; Gao, Y.; Xu, P.; Jiao, X.; Ren, M. Assessing the Hydrochemistry, Groundwater Drinking Quality, and Possible Hazard to Human Health in Shizuishan Area, Northwest China. Water 2023, 15, 1082. [Google Scholar] [CrossRef]
  28. Wu, C.; Wu, X.; Qian, C.; Zhu, G. Hydrogeochemistry and groundwater quality assessment of high fluoride levels in the Yanchi endorheic region, northwest China. Appl. Geochem. 2018, 98, 404–417. [Google Scholar] [CrossRef]
  29. Su, C.; Wang, Y.; Xie, X.; Zhu, Y. An isotope hydrochemical approach to understand fluoride release into groundwaters of the Datong Basin, Northern China. Environ. Sci.-Process. Impacts 2015, 17, 791–801. [Google Scholar] [CrossRef] [PubMed]
  30. Li, J.; Wang, Y.; Zhu, C.; Xue, X.; Qian, K.; Xie, X.; Wang, Y. Hydrogeochemical processes controlling the mobilization and enrichment of fluoride in groundwater of the North China Plain. Sci. Total Environ. 2020, 730, 138877. [Google Scholar] [CrossRef]
  31. Teng, Y.; Zheng, J.; Wang, J.; Zhai, Y.; Hu, B.; Zhu, C. Water quality responses to the interaction between surface water and groundwater along the Songhua River, NE China. Hydrogeol. J. 2018, 26, 1591–1607. [Google Scholar] [CrossRef]
  32. Li, Y.; Bi, Y.; Mi, W.; Xie, S.; Ji, L. Land-use change caused by anthropogenic activities increase fluoride and arsenic pollution in groundwater and human health risk. J. Hazard. Mater. 2021, 406, 124337. [Google Scholar] [CrossRef]
  33. Song, C.; Ke, L.; Pan, H.; Zhan, S.; Liu, K.; Ma, R. Long-Term Surface Water Changes and Driving Cause in Xiong’an, China: From Dense Landsat Time Series Images and Synthetic Analysis. Sci. Bull. 2018, 63, 708–716. [Google Scholar] [CrossRef]
  34. Zhu, M.; Wang, S.; Kong, X.; Zheng, W.; Feng, W.; Zhang, X.; Yuan, R.; Song, X.; Sprenger, M. Interaction of Surface Water and Groundwater Influenced by Groundwater Over-Extraction, Waste Water Discharge and Water Transfer in Xiong’an New Area, China. Water 2019, 11, 539. [Google Scholar] [CrossRef]
  35. Zhao, K.; Qi, J.; Chen, Y.; Ma, B.; Yi, L.; Guo, H.; Wang, X.; Wang, L.; Li, H.; Hebei Key Laboratory of Geological Resources and Environment Monitoring and Protection; et al. Hydrogeochemical Characteristics of Groundwater and Pore-Water and the Paleoenvironmental Evolution in the Past 3.10 Ma in the Xiong’an New Area, North China. China Geol. 2021, 4, 480–491. [Google Scholar] [CrossRef]
  36. Wang, S.; Song, X.; Wang, Q.; Xiao, G.; Liu, C.; Liu, J. Shallow Groundwater Dynamics in North China Plain. J. Geogr. Sci. 2009, 19, 175–188. [Google Scholar] [CrossRef]
  37. Xing, L.; Guo, H.; Zhan, Y. Groundwater Hydrochemical Characteristics and Processes along Flow Paths in the North China Plain. J. Asian Earth Sci. 2013, 70–71, 250–264. [Google Scholar] [CrossRef]
  38. Liu, H.; Guo, H.; Xing, L.; Zhan, Y.; Li, F.; Shao, J.; Niu, H.; Liang, X.; Li, C. Geochemical Behaviors of Rare Earth Elements in Groundwater along a Flow Path in the North China Plain. J. Asian Earth Sci. 2016, 117, 33–51. [Google Scholar] [CrossRef]
  39. Guo, W.; Zhang, H.; Huo, S. Organochlorine Pesticides in Aquatic Hydrophyte Tissues and Surrounding Sediments in Baiyangdian Wetland, China. Ecol. Eng. 2014, 67, 150–155. [Google Scholar] [CrossRef]
  40. Li, X.; Cui, B.; Yang, Q.; Lan, Y. Impacts of Water Level Fluctuations on Detritus Accumulation in Lake Baiyangdian, China. Ecohydrology 2016, 9, 52–67. [Google Scholar] [CrossRef]
  41. Lin, D.; Jin, M.; Liang, X.; Zhan, H. Estimating groundwater recharge beneath irrigated farmland using environmental tracers fluoride, chloride and sulfate. Hydrogeolo. J. 2013, 21, 1469–1480. [Google Scholar] [CrossRef]
  42. Jiang, W.; Sheng, Y.; Liu, H.; Ma, Z.; Song, Y.; Liu, F.; Chen, S. Groundwater quality assessment and hydrogeochemical processes in typical watersheds in Zhangjiakou region, northern China. Environ. Sci. Pollut. R. 2022, 29, 3521–3539. [Google Scholar] [CrossRef]
  43. Sun, D.; Li, J.; Li, H.; Liu, Q.; Zhao, S.; Huang, Y.; Wu, Q.; Xie, X. Evolution of groundwater salinity and fluoride in the deep confined aquifers of Cangzhou in the North China plain after the South-to-North Water Diversion Project. Appl. Geochem. 2022, 147, 105485. [Google Scholar] [CrossRef]
  44. Han, D.; Currell, M.J.; Guo, H. Controls on distributions of sulphate, fluoride, and salinity in aquitard porewater from the North China Plain: Long-term implications for groundwater quality. J. Hydrol. 2021, 603, 126828. [Google Scholar] [CrossRef]
  45. Li, J.; Zhou, H.; Qian, K.; Xie, X.; Xue, X.; Yang, Y.; Wang, Y. Fluoride and iodine enrichment in groundwater of North China Plain: Evidences from speciation analysis and geochemical modeling. Sci. Total Environ. 2017, 598, 239–248. [Google Scholar] [CrossRef] [PubMed]
  46. Hu, B.; Song, X.; Lu, Y.; Liang, S.; Liu, G. Fluoride enrichment mechanisms and related health risks of groundwater in the transition zone of geomorphic units, northern China. Environ. Res. 2022, 212, 113588. [Google Scholar] [CrossRef] [PubMed]
  47. Xia, Y.; Wang, B.; Li, H.; Ma, Z.; Guo, X.; Zhao, K.; Zhao, C.; Zhang, X.; Wang, X. Study on Hydrochemical Origins and Health Geology Regionalization of Shallow Groundwater in Xiong’an New Area. Geol. China 2022, 1–18. (In Chinese) [Google Scholar]
  48. Chen, M.; Ma, F. Groundwater Resources and Environment in China; Earthquake Press: Beijing, China, 2002. (In Chinese) [Google Scholar]
  49. Wang, K. Research on Commonjunctive Sustainability of Groundwater Resources and Wetlands in Xiong’an New Area. Ph.D. Dissertation, China University of Geosciences (Beijing), Beijing, China, 2020. (In Chinese). [Google Scholar]
  50. Zhang, Z.; Luo, G.; Wang, Z.; Liu, C.; Li, Y.; Jiang, X. Study on sustainable utilization of groundwater resources in North China Plain. Resour. Sci. 2009, 31, 355–360. (In Chinese) [Google Scholar]
  51. GB 5749-2006[S/OL]; Hygienic Standard of Drinking, Water; Ministry of Health of People’s Republic of China, Standardization Administration of China. Standards Press of China: Beijing, China, 2006.
  52. Liu, J.; Peng, Y.; Li, C.; Gao, Z.; Chen, S. A characterization of groundwater fluoride, influencing factors and risk to human health in the southwest plain of Shandong Province, North China. Ecotoxicol. Environ. Saf. 2021, 207, 111512. [Google Scholar] [CrossRef] [PubMed]
  53. Zimmer, K.; Zhang, Y.; Lu, P.; Chen, Y.; Zhang, G.; Dalkilic, M.; Zhu, C. SUPCRTBL: A revised and extended thermodynamic dataset and software package of SUPCRT92. Comput. Geosci. 2016, 90, 97–111. [Google Scholar] [CrossRef]
  54. Parkhurst, D.L.; Appelo, C. Description of input and examples for PHREEQC version 3—A computer program for speciation, batch-reaction, one-dimensional transport, and inverse geochemical calculations. U. S. Geol. Surv. Tech. Methods 2013, 6, 497. [Google Scholar]
  55. Zhang, Y.; Hu, B.; Teng, Y.; Tu, K.; Zhu, C. A library of BASIC scripts of reaction rates for geochemical modeling using phreeqc. Comput. Geosci.-UK 2019, 133, 104316. [Google Scholar] [CrossRef]
  56. Su, H.; Wang, J.; Liu, J. Geochemical factors controlling the occurrence of high-fluoride groundwater in the western region of the Ordos basin, northwestern China. Environ. Pollut. 2019, 252, 1154–1162. [Google Scholar] [CrossRef]
  57. Schoeller, H. Geochemistry of groundwater. In Groundwater Studies-an International Guide for Research and Practice; UNESCO: Paris, France, 1977; pp. 1–18. [Google Scholar]
  58. Jia, Y.; Guo, H.; Xi, B.; Jiang, Y.; Zhang, Z.; Yuan, R.; Yi, W.; Xue, X. Sources of groundwater salinity and potential impact on arsenic mobility in the western Hetao Basin, Inner Mongolia. Sci. Total Environ. 2017, 601, 691–702. [Google Scholar] [CrossRef] [PubMed]
  59. Singh, C.K.; Kumari, R.; Singh, N.; Mallick, J.; Mukherjee, S. Fluoride enrichment in aquifers of the Thar Desert: Controlling factors and its geochemical modelling. Hydrol. Process. 2013, 27, 2462–2474. [Google Scholar] [CrossRef]
  60. Vithanage, M.; Rajapaksha, A.U.; Bootharaju, M.; Pradeep, T. Surface complexation of fluoride at the activated nano-gibbsite water interface. Colloid. Surface. A 2014, 462, 124–130. [Google Scholar] [CrossRef]
  61. Xiao, J.; Jin, Z.; Zhang, F. Geochemical controls on fluoride concentrations in natural waters from the middle Loess Plateau, China. J. Geochem. Explor. 2015, 159, 252–261. [Google Scholar] [CrossRef]
  62. Currell, M.; Cartwright, I.; Raveggi, M.; Han, D. Controls on elevated fluoride and arsenic concentrations in groundwater from the Yuncheng Basin, China. Appl. Geochem. 2011, 26, 540–552. [Google Scholar] [CrossRef]
  63. Jacks, G.; Bhattacharya, P.; Chaudhary, V.; Singh, K. Controls on the genesis of some high-fluoride groundwaters in India. Appl. Geochem. 2005, 20, 221–228. [Google Scholar] [CrossRef]
  64. Zabala, M.E.; Manzano, M.; Vives, L. Assessment of processes controlling the regional distribution of fluoride and arsenic in groundwater of the Pampeano Aquifer in the Del Azul Creek basin (Argentina). J. Hydrol. 2016, 541, 1067–1087. [Google Scholar] [CrossRef]
  65. Li, D.; Gao, X.; Wang, Y.; Luo, W. Diverse mechanisms drive fluoride enrichment in groundwater in two neighboring sites in northern China. Environ. Pollut. 2018, 237, 430–441. [Google Scholar] [CrossRef]
  66. Olaka, L.A.; Wilke, F.D.; Olago, D.O.; Odada, E.O.; Mulch, A.; Musolff, A. Groundwater fluoride enrichment in an active rift setting: Central Kenya Rift case study. Sci. Total Environ. 2016, 545, 641–653. [Google Scholar] [CrossRef]
  67. Gao, X.; Wang, Y.; Li, Y.; Guo, Q. Enrichment of fluoride in groundwater under the impact of saline water intrusion at the salt lake area of Yuncheng basin, northern China. Environ. Geol. 2007, 53, 795–803. [Google Scholar] [CrossRef]
  68. Su, C.; Wang, Y.; Xie, X.; Li, J. Aqueous geochemistry of high-fluoride groundwater in Datong Basin, Northern China. J. Geochem. Explor. 2013, 135, 79–92. [Google Scholar] [CrossRef]
  69. Palandri, J.L.; Kharaka, Y.K. A Compilation of Rate Param of Water-Mineral Interaction Kinetics for Application to Geochemical Modeling; United States Geological Survey: Reston, VA, USA, 2004.
  70. Daniele, L.; Vallejos, Á.; Corbella, M.; Molina, L.; Pulido-Bosch, A. Hydrogeochemistry and geochemical simulations to assess water–rock interactions in complex carbonate aquifers: The case of Aguadulce (SE Spain). Appl. Geochem. 2013, 29, 43–54. [Google Scholar] [CrossRef]
  71. Schafer, D.; Sun, J.; Jamieson, J.; Siade, A.; Atteia, O.; Seibert, S.; Higginson, S.; Prommer, H. Fluoride release from carbonate-rich fluorapatite during managed aquifer recharge: Model-based development of mitigation strategies. Water Res. 2021, 193, 116880. [Google Scholar] [CrossRef] [PubMed]
  72. Turner, B.D.; Binning, P.; Stipp, S. Fluoride removal by calcite: Evidence for fluorite precipitation and surface adsorption. Environ. Sci. Technol. 2005, 39, 9561–9568. [Google Scholar] [CrossRef] [PubMed]
  73. Bhatnagar, A.; Kumar, E.; Sillanpää, M. Fluoride removal from water by adsorption—A review. Chem. Eng. J. 2011, 171, 811–840. [Google Scholar] [CrossRef]
  74. Palahouane, B.; Drouiche, N.; Aoudj, S.; Bensadok, K. Cost-effective electrocoagulation process for the remediation of fluoride from pretreated photovoltaic wastewater. J. Ind. Eng. Chem. 2015, 22, 127–131. [Google Scholar] [CrossRef]
  75. Hu, B.; Teng, Y.; Zhai, Y.; Zuo, R.; Li, J.; Chen, H. Riverbank filtration in China: A review and perspective. J. Hydrol. 2016, 541, 914–927. [Google Scholar] [CrossRef]
  76. Kalpana, L.; Brindha, K.; Elango, L. FIMAR: A new Fluoride Index to mitigate geogenic contamination by Managed Aquifer Recharge. Chemosphere 2019, 220, 381–390. [Google Scholar] [CrossRef]
  77. Liu, G.; Zhang, Y.; Knibbe, W.-J.; Feng, C.; Liu, W.; Medema, G.; van der Meer, W. Potential impacts of changing supply-water quality on drinking water distribution: A review. Water Res. 2017, 116, 135–148. [Google Scholar] [CrossRef]
  78. HJ/T 164-2020; The Technical Specification for Environmental Monitoring of Groundwater. China Environmental Science Press: Beijing, China, 2020.
  79. Matthess, G. The Properties of Groundwater; John Wiley: New York, NY, USA, 1982. [Google Scholar]
  80. Singhal, B.B.S.; Gupta, R.P. Applied Hydrogeology of Fractured Rocks; Springer: Dordrecht, The Netherland, 2010. [Google Scholar]
Figure 1. Location of the study area (a) within China (No. GS (2019) 1822), (b) sampling sites in the Xiong’an New Area, and (c) representative hydrogeological profile.
Water 16 00358 g001
Figure 2. Piper plots of SG and DG samples. (a) The hydrochemical types of SG samples. (b) The hydrochemical types of DG samples.
Water 16 00358 g002
Figure 3. Spatial distribution of F in groundwater at the Xiong’an New Area. (a) The spatial distribution of F in SG. (b) The spatial distribution of F in DG.
Water 16 00358 g003
Figure 4. Scatterplots for the variation of F concentration vs. Ca2+ concentration in (a) SG samples and (b) DG samples.
Water 16 00358 g004
Figure 5. Scatterplots explaining the ion exchange in groundwater. (a,c) CAI-1 vs. CAI-2 in SG and DG, respectively and (b,d) (HCO3+SO42−-Ca2+-Mg2+) vs. (Cl-Na+-K+) in SG and DG, respectively.
Water 16 00358 g005
Table 1. Statistical summary of the chemical composition of groundwater samples in Xiong’an New Area.
ParamUnitSG * (n = 172)DG ** (n = 193)
MinMaxAvgSD ***MinMaxAvgSD
pH-6.888.607.580.336.798.907.910.48
TDSmg/L7.063913.60920.27627.7735.703836.43397.63300.33
K+mg/L0.072.990.750.480.192.640.910.44
Ca2+mg/L6.40203.0063.2135.561.60128.1023.5618.25
Na+mg/L12.54818.32152.31140.8218.251085.8992.0682.66
Mg2+mg/L0.01225.9053.7838.210.01269.2013.6922.93
SiO2mg/L2.3837.2624.964.8114.2336.9421.854.57
Fmg/L0.173.220.700.530.111.790.460.40
HCO3mg/L115.00827.60418.01141.78154.30446.30238.5660.45
Clmg/L7.201864.50218.84339.244.102328.7054.54170.20
NO3mg/L0.72448.2092.7483.252.80812.4038.9463.96
SO42−mg/L0.01188.1712.3021.600.0149.157.588.05
CO32−mg/L0.0111.901.342.140.0129.804.424.36
SIfluorite-−6.80−0.99−2.501.21−7.37−1.35−3.411.44
SIcalcite-−1.370.850.340.26−1.871.120.070.59
SIgypsum-−3.19−0.54−1.940.57−3.64−0.71−2.680.41
SIdolomite-−3.172.421.250.63−3.662.920.401.33
SIhalite-−8.39−5.19−6.780.74−8.70−4.75−7.240.54
Notes: * SG: shallow groundwater. ** DG: deep groundwater. *** SD: standard deviation.
Disclaimer/Publisher’s Note: The statements, opinions and data contained in all publications are solely those of the individual author(s) and contributor(s) and not of MDPI and/or the editor(s). MDPI and/or the editor(s) disclaim responsibility for any injury to people or property resulting from any ideas, methods, instructions or products referred to in the content.

