Abstract
In order to safeguard the ecological health of Changxinggang River’s water environment, conducting research on ecological discharge, including establishing reasonable ecological discharge control values, is of great importance. This study utilized monthly hydro-ecological data from the Xintang section of the Changxinggang River that spanned the years 2016 to 2020. It defined the water quality control indicators for both non-flood and flood periods in the Changxinggang River and utilized the MIKE 11 software to construct the MIKE 11 one-dimensional hydrodynamic–water quality coupling model. A comparison between simulated values and measured values showed that the model exhibits a relative error of less than 17%, indicating its suitability for practical use. The results indicate that the water quality control indicators for the non-flood period in the Changxinggang River encompass ammonium nitrogen (NH3-N), chemical oxygen demand (manganese) (CODMn), and biochemical oxygen demand (BOD), while those for the flood period include NH3-N, total phosphorus (TP), and CODMn. Reasonable ecological discharge control values for both non-flood and flood periods in the Changxinggang River are calculated to be 2.59 m3/s and 2.63 m3/s, respectively. The model developed in this study is applicable for ecological discharge calculations in the Changxinggang River, and the proposed ecological discharge control values are achievable.
1. Introduction
In recent years, with the rapid population growth and high-speed economic development, human activities have had a significant impact on the stability of the ecosystems in some cities, leading to emerging ecological and environmental issues [1,2]. Urban rivers, as vital carriers of resources and ecological environments, provide essential ecological and social services to people and play a crucial role in ensuring a normal human life [3,4]. However, over the years, the water-related ecological environmental issues of urban rivers have become increasingly prominent due to the influence of both natural and anthropogenic factors [5]. To undertake the ecological and environmental construction of urban rivers, it is necessary to comprehensively consider the organic connections between water ecology, the water environment, and water resources [6]. In this context, the ecological discharge of rivers has gained increasing attention as an important indicator that can safeguard the health of water ecological environments. The ecological discharge of rivers refers to the quantity, process, and quality of water within a river that maintains the health of the aquatic ecosystem, facilitates pollutant dilution and dispersion, and ensures a habitable environment for humans [7,8]. In other words, determining suitable control values for the ecological discharge of rivers allows rivers to maintain specific discharge and water volume conditions, thereby sustaining the health of aquatic ecosystems, improving hydrodynamic conditions, enhancing the pollutant dilution capacity, and ensuring the health of water ecological environments [9,10]. Therefore, conducting calculations to determine the ecological discharge of urban rivers, developing ecological discharge calculation models applicable to urban rivers, and establishing suitable ecological discharge control values are of significant importance for safeguarding the health of water ecological environments in urban rivers [11,12].
In the ongoing exploration of ecological discharge theory and watershed aquatic ecological issues worldwide, research on ecological discharge calculation methods has become essential for determining scientifically sound ecological discharge control values. Presently, there are approximately 200 calculation methods related to ecological discharge, which can be broadly categorized as hydrological methods, hydraulic methods, habitat-based methods, comprehensive methods, hydro-biological analysis methods, and other approaches [13,14]. In 1976, Tennant [15] initiated the use of hydrology methods by suggesting that 10% of the long-term average natural discharge should be considered the minimum discharge necessary to maintain healthy aquatic habitats, based on field investigations. Subsequently, in 1996 and 1997, Richter et al. [16] proposed the Indicators of Hydrologic Alteration (IHA) and Range of Variability Approach (RVA) methods, respectively. In 1979, Nehring et al. [17] introduced a hydraulic method called R2CROSS based on the Manning equation, which was used to determine habitat water demand in Colorado. In 2007, Liu et al. [18] proposed the well-known hydraulic method called the Ecological Hydraulic Radius method. In 2021, Chen et al. [19] determined the minimum ecological discharge of the urban artificial river Zhoushan River using the Tennant method, the Wet Perimeter method, and the Physical Habitat Simulation (PHABSIM) method. In the same year, Meng et al. [20] used the MIKE 11 model to determine the suitable ecological discharge of artificial river channels in the plain river network area. In 2023, Tao et al. [21] employed the Water Quality Analysis Simulation Program (WASP) model to establish a water quality prediction model for Lushui, which analyzed the fine management of pollution load reduction allocation in various river sections. In 2021, Jiang et al. [22] established a two-dimensional water quality model using the Environmental Fluid Dynamics Code (EFDC) software (EPA version 1.01) to predict and analyze the factors related to chemical oxygen demand (COD), ammonium nitrogen (NH3-N), and total phosphorus (TP) during the dry period in the Malian River Reservoir, providing a basis for reservoir construction and ecological discharge control. In 2014, Liang et al. [23] used the Computational Environment for Water Quality (CE-QUAL-W2) model to predict and analyze the distribution of annual water temperature, discharge velocity, nutrients, and chlorophyll-a (Chl-a) concentration in the Longchuanjiang tributary of the Wudongde hydropower station in the Jinsha River. They evaluated the risk of eutrophication and its influencing factors and conducted a preliminary study on eutrophication control measures in the tributary. In summary, the ongoing research into ecological discharge calculation methods has led to an increasing variety of approaches. Researchers should select the most appropriate method based on the characteristics of their study subject to ensure scientifically sound results.
In current practice, simulation software packages with hydrodynamic and water quality modules include WASP (WASP 8.0), EFDC (EPA version 1.01), CE-QUAL-W2 (CE-QUAL-W2 4.0), and the MIKE series (MIKE ZERO 2014). WASP is widely used for hydro-ecological environmental analysis and simulation studies as it is capable of simulating the variation of pollutants in one-dimensional to three-dimensional spatial dimensions. It can also simulate aquatic environmental disaster processes and predict accidental changes, thus exhibiting strong analytical capabilities. However, due to the small time step, small spatial grid, large spatial generalization, and complex configuration of the WASP simulation software (WASP 8.0), its model operation and debugging pose challenges and limitations [21]. After years of development, the EFDC model is primarily used for hydrodynamics, sediment transport, pollutant migration, and water quality prediction and assessment in one-dimensional to three-dimensional spatial dimensions. It is applicable to water bodies such as rivers, lakes, and estuaries. While the EFDC model can simulate multiple environmental factors and has a wide range of applications, it still faces challenges such as extensive data requirements and high difficulties in model operation [22]. The CE-QUAL-W2 model is suitable for lakes and reservoirs with narrow water features and is used to study the two-dimensional vertical and longitudinal changes in water bodies. It can simulate various water quality indicators. However, the CE-QUAL-W2 model is more suitable for long and narrow water bodies and has limited applicability to other types of water bodies [23]. The MIKE series software (MIKE ZERO 2014) is primarily used for research in aquatic ecology, hydrodynamics, and water resources, including MIKE 11, MIKE 21, MIKE 3 (MIKE ZERO 2014), and other models. The MIKE series software (MIKE ZERO 2014) has long been used in river simulation research, both domestically and internationally, and has a wide range of applications and powerful functionalities. It is one of the mainstream software used for studying aquatic ecological environmental issues. The MIKE series software (MIKE ZERO 2014) is compatible with the Windows system, has user-friendly interactive interfaces, requires minimal data, facilitates parameter debugging, and can be integrated with GIS technology [20].
The Changxinggang River is an important urban river located in Changxing County, Zhejiang Province, China. It serves as a typical river network in the Taihu Basin and performs various functions, including flood control, water regulation, and navigation. However, the Changxinggang River features a relatively gentle slope, insufficient hydrodynamics, a slow water discharge, and occasional issues with water quality, with standards being exceeded and algal blooms occurring. Moreover, limited hydrological data are available for the Changxinggang River, and the model data requirements for the ecological discharge calculations should be reasonable, operationally straightforward, and accurate [24]. After a thorough comparison, the MIKE software (MIKE ZERO 2014) series was found to best meet these requirements. Given Changxinggang River’s long and narrow river shape, MIKE 11 was selected as the foundational software for this study. Furthermore, the dynamics and water quality of Changxinggang River are interrelated, and only considering the hydrodynamics or water quality alone cannot effectively characterize the river’s characteristics. Hence, it was essential to construct a one-dimensional hydrodynamic–water quality coupling model that was suitable for the Changxinggang River.
This study aimed to construct a one-dimensional hydrodynamic–water quality coupled model using MIKE 11 and to perform ecological discharge calculations for the Changxinggang River. This study utilizes the hydrodynamic and water quality modules of the MIKE 11 software as a foundation. By integrating relevant hydrological data from the Changxinggang River and coupling the newly developed water dynamics and water environment modules through data transfer and information exchange, this study establishes the MIKE 11 one-dimensional hydrodynamic–water environment coupling model. The research area is the Changxinggang River in the Taihu Basin, China, and the study focuses on monthly hydro-ecological data from the Xintang section of the Changxinggang River for the years 2016–2020. This study aims to analyze and determine the water quality control indicators for non-flood and flood periods in the Changxinggang River by conducting research on the calculation of suitable ecological discharge control values for the Changxinggang River during different time periods from various perspectives and analyzing the scientific and attainable aspects of the results. This study aims to provide a more scientific and efficient tool for river ecological discharge research and offer more valuable technical support for ecological discharge control efforts.
2. Materials and Methods
2.1. Study Area
Changxing County (30°43′—31°11′ N, 119°33′—120°06′ E), Huzhou City, Zhejiang Province, is located in the Hangjiahu Plain within the Changjiang River Delta. It is situated adjacent to the southwestern shore of Taihu Lake. Changxing County covers an area of 1431.2 square kilometers (km2) and had a permanent population of approximately 674,000 in 2020. Its regional gross domestic product (GDP) reaches CNY 70.239 billion. The terrain gradually descends from west to east, and the climate is characterized by a subtropical marine monsoon climate. The annual average precipitation is 1347.7 mm, with the majority occurring from April to October. The average number of rainy days per year is 144, accounting for 39.45% of the total annual days. The three major water systems in Changxing County are the He Xi River System, the Si An Tang River System, and the Wu Xi River System [25]. The distribution of these important water systems in Changxing County is shown in Figure 1.
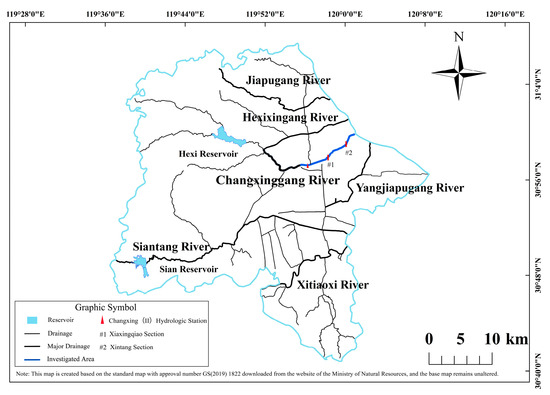
Figure 1.
Distribution map of the key water systems in Changxing County.
Changxinggang River is located in the northern part of Changxing County, flowing through the central plain area and the urban district before entering Taihu Lake. It has a total length of approximately 31.58 km (kilometers). Due to variations in the timing of precipitation, the period from May to October is designated as the flood period, the period until 15 July is the Meiyu period, and the period after that is the Typhoon period. The months of January to April and November to December are designated as the non-flood period. The flat terrain and low slopes of the plain river network area that Changxinggang River is located in result in inadequate hydraulic conditions [24]. Pollutants tend to accumulate in the water, and disruptions caused by shipping activities release pollutants from riverbed sediments, leading to internal pollution and the occasional backflow of cyanobacteria from Taihu Lake. These factors collectively contribute to water quality issues, such as the exceedance of standards and the occurrence of algal blooms in the Changxinggang River.
Based on data collection and field surveys, this study utilized the primary hydrological station on the Changxinggang River, specifically the Changxing (II) hydrological station. Discharge and water level monitoring data from 2016 to 2020 were employed to analyze the daily variations in water level and discharge, as well as the monthly average discharge and water level in the Changxinggang River. The details are presented in Figure 2, Table 1 and Table 2.
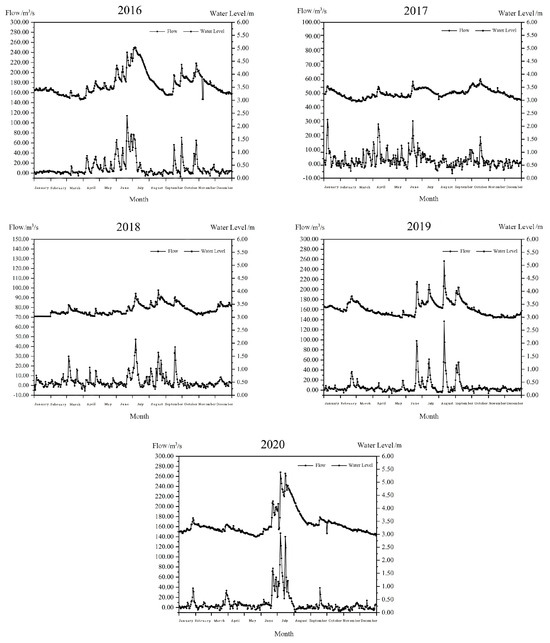
Figure 2.
Annual variations in discharge and water level in the Changxinggang River (2016−2020).

Table 1.
Monthly average discharge for the Changxinggang River from 2016 to 2020 (m³/s).
Table 2.
Monthly average water levels for the Changxinggang River from 2016 to 2020 (m).
Currently, the Changxinggang River has a nationally controlled Xintang section, a provincially controlled Xiashenqiao section, and three municipal and county-level controlled sections [24]. According to the “Changxing County Watershed Protection Planning Revision Report” obtained from the Changxing County Water Resources Bureau, the Xintang section is classified as an area for agricultural and industrial water use, with water environmental control standards adhering to Grade III standards, as per the “Surface Water Environmental Quality Standards” (Standard) [26]. Furthermore, the Xintang section is located at the end of the Changxinggang River and serves as the only nationally controlled section. It is the most representative section for evaluating the environmental quality of the water and analyzing the aquatic ecological environment in the Changxinggang River. An analysis of the current water ecological environment in the Changxinggang River reveals that the common water quality parameters that exceed the standards include the chemical oxygen demand (manganese) (CODMn), biochemical oxygen demand (BOD), NH3-N, chemical oxygen demand (chromium reduction) (CODCr), and TP.
2.2. Research Methodology Flowchart
The MIKE 11 one-dimensional hydrodynamic–water quality coupled model was built on the foundation of MIKE 11 software’s hydrodynamic and water quality modules. Integrated with relevant hydrological data from the Changxinggang River, the new hydrodynamic and water quality modules were coupled through data transfer and information exchange. The detailed development process of the model is illustrated in Figure 3.
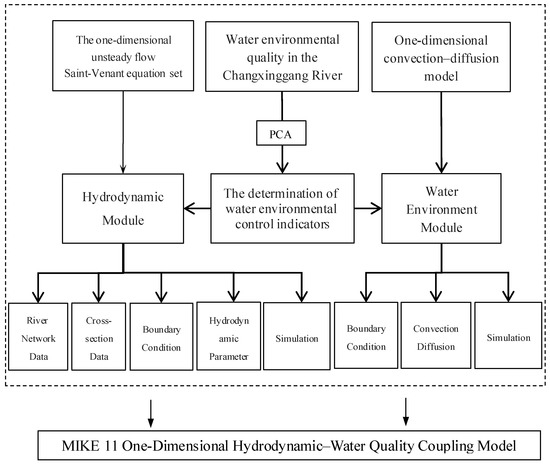
Figure 3.
Flowchart of the research methodology.
2.3. Data and Materials
Due to the varying water pollution levels in the Changxinggang River during the non-flood period (November to April) and the flood period (May to October), this study determines the primary water environmental control indicators for these two periods. The selection of the primary water environmental control indicators is based on principal component analysis (PCA), using monthly monitoring data from the nationally controlled Xintang section of the Changxinggang River from 2016 to 2020.
The monthly data for the Changxinggang River Xintang section from 2016 to 2020 were primarily obtained via on-site monitoring conducted by our research team and via the provision of monitoring data by the hydrological station in Changxing County, Zhejiang Province. The monitoring of initial parameters is typically conducted by collecting water samples from rivers and performing laboratory analyses. In this study, the monitored initial parameters primarily include dissolved oxygen (Table 3), water temperature (Table 4), chemical oxygen demand (manganese) (CODMn), biochemical oxygen demand (BOD), ammonium nitrogen (NH3-N), chemical oxygen demand (chromium reduction) (CODCr), and total phosphorus (TP). The following are the methods for monitoring each parameter: Dissolved oxygen: Iodometric method, Electrochemical Probe method; Temperature: Thermometer method; CODMn: Potassium Permanganate method; BOD: Dilution and Seeding method; NH3-N: Nessler’s Reagent Colorimetric method, Salicylic Acid Spectrophotometric method; CODCr: Dichromate method; TP: Ammonium Molybdate Spectrophotometric method. The monitoring of initial parameter data follows the standard [26] and relevant national and local water quality monitoring standards in China.
Table 3.
Dissolved oxygen concentration data for the Xintang Section of the Changxinggang River.
Table 4.
Water temperature data for the Xintang Section of the Changxinggang River.
PCA is a statistical analysis method used to reduce the dimensionality of data and to extract features. It is primarily employed to transform the original data into a set of linearly independent variables, thereby compressing the original variables and simplifying their complexity. The variables generated through this transformation reflect the main information represented by the original variables [27]. Its advantages include its ability to reduce dimensionality, remove secondary features, perform decorrelation to reduce the redundancy between data, increase interpretability to facilitate the understanding of the structure of the original data, and enhance the ease of data visualization by mapping high-dimensional data to two or three dimensions. The drawbacks of PCA include the potential loss of some data information during the dimensionality reduction process, its suboptimal performance for nonlinear relationships in the data, its sensitivity to outliers that may affect the calculation of principal components if significant errors are present, and its increased computational complexity and time consumption for large-scale datasets. In this study, considering the abundance of data information, the need to remove secondary features, and the relatively low prevalence of outliers in the data, PCA was considered a suitable choice. The computational steps for PCA are as follows:
- Kaiser–Meyer–Olkin (KMO) and Bartlett’s sphericity test:
It is generally thought that PCA is applicable to a dataset when the KMO verification coefficient is greater than 0.500 and when the significance probability (Sig.) from Bartlett’s sphericity test is less than 0.050.
- 2.
- Standardization of raw data:
The raw data were standardized by applying the z-score normalization method, ensuring that the mean of each variable was 0 and that the standard deviation was 1. The mathematical principle of the z-score normalization method is represented by Equation (1):
where xij represents the ith sample and jth indicator, is the mean of the jth indicator, and Si denotes the standard deviation of the jth indicator. Zij represents the standardized result for the ith sample and jth indicator.
- 3.
- The establishment of the correlation matrix R:
Compute the correlation matrix for the standardized data using the formula given in Equation (2):
where R is the correlation matrix, n is the number of samples, and Z is the matrix of the standardized data.
- 4.
- Calculation of eigenvalues, contribution ratios of eigenvalues, and cumulative contribution ratios for the correlation matrix:
The determination of the number of principal components depends on the calculation results of the eigenvalues, the contribution ratio of eigenvalues, and the cumulative contribution ratio of the correlation matrix. The criterion is as follows: if the cumulative contribution ratio of the first n eigenvalues reaches 85%, the first n eigenvalues corresponding to the principal components cover most of the information in the dataset. If there are m eigenvalues greater than 1.000 among the first n eigenvalues, these m eigenvalues, along with their corresponding principal components, can explain the dataset. The eigenvalue decomposition of the correlation matrix R is performed to obtain the eigenvalues and their corresponding eigenvectors. The calculation is as follows:
- 5.
- Calculation of principal component loadings.
Principal component loadings are used to reflect the correlation between principal components and the original variables. Generally, a higher correlation coefficient indicates that the variable is more representative of the corresponding principal component. Principal component loadings can be calculated using the following method:
where Pij represents the loading of the ith principal component on the jth variable, λi is the ith eigenvalue, and vij is the corresponding eigenvector.
By comparing the water environmental data obtained from Changxinggang River for the years 2016 to 2020 with the “Standard” [26] Class III water standard, it was found that the water environmental indicators exceeding the standard in the Xintang section were CODMn, BOD, NH3-N, CODCr, and TP. The “Standard” [26] is a standard that is used in China to assess and monitor surface water quality. This standard categorizes surface water quality into different grades, with the “Class III standard” representing the minimum water quality standard required for centralized drinking water sources. Different grades of standards define the allowed pollutant types and concentration limits. Specifically, for the Class III standards, the permissible values are as follows: the CODMn standard value is 6 mg/L, the BOD standard value is 4 mg/L, the NH3-N standard value is 1 mg/L, the CODCr standard value is 20 mg/L, and the TP standard value is 0.2 mg/L. The monthly water quality indicators for the Xintang section are illustrated in Figure 4. Based on Figure 4, it is observed that from 2016 to 2020, CODMn exceeded the standard value three times, with relatively heavier pollution present during the non-flood period. BOD exceeded the standard value three times, with relatively heavier pollution present during the flood period. NH3-N and CODCr exceeded the standard value five times, with relatively heavier pollution present during the non-flood period. TP exceeded the standard value once, indicating relatively lighter pollution among the five water quality indicators. The monthly compliance status of the water environmental indicators can be seen in Figure 4.
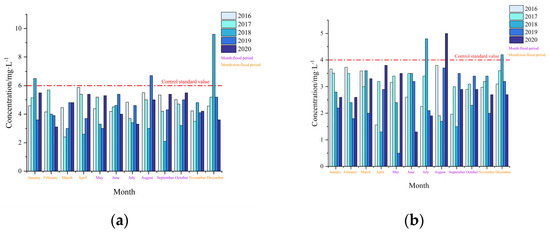
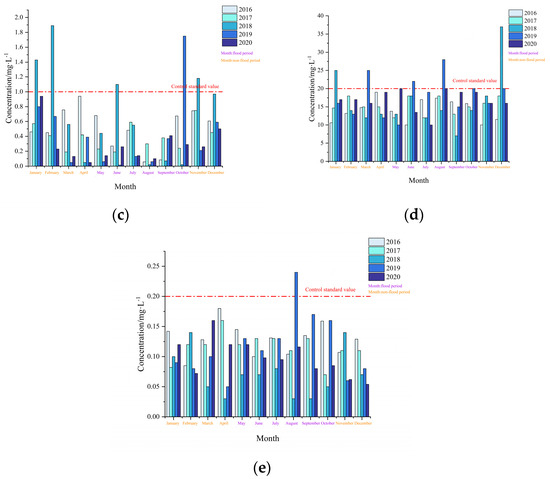
Figure 4.
The monthly compliance status of water quality indicators at the national control Xintang Section of the Changxinggang River: (a) chemical oxygen demand (manganese) (CODMn); (b) biochemical oxygen demand (BOD); (c) ammonium nitrogen (NH3−N); (d) chemical oxygen demand (chromium reduction) (CODCr); (e) total phosphorus (TP).
As shown in Figure 5, the calculation of the average concentrations of pollutants during the flood and non-flood periods from 2016 to 2020 indicated a significant difference between the concentrations of pollutants during these two periods. Moreover, the concentrations of pollutants during the non-flood period were consistently and significantly higher than those during the flood period. This suggests that there was a statistically significant difference in the pollutant concentrations between different hydrological periods.
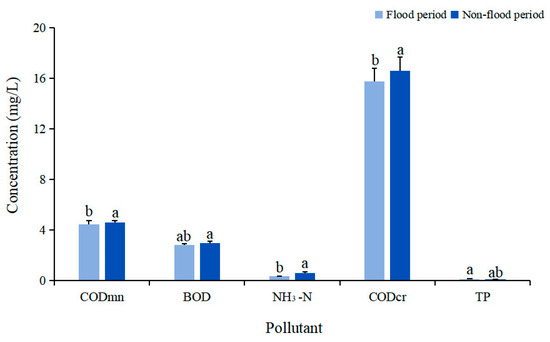
Figure 5.
Disparities in pollutant concentrations during different hydrological periods (a and b represent significant differences in pollutant concentrations in different water periods, while ab represents no significant differences with either a or b).
To establish the control objectives, this study employed PCA to analyze the five indicators mentioned above, thus obtaining the principal component loadings for the Changxinggang River during non-flood and flood periods, as detailed in Table 5 and Table 6. Table 5 reveals that the indicators most correlated with principal component 1 were CODMn, CODCr, and BOD, while those most correlated with principal component 2 were NH3-N and TP. Table 6 indicates that CODMn, CODCr, and TP contributed significantly to principal component 1, whereas NH3-N had a higher contribution to principal component 2. Considering the high correlation between CODMn and CODCr and the absence of TP exceedances during non-flood periods, this study determined that NH3-N, CODMn, and BOD were the water quality control indicators for non-flood periods and that CODMn, TP, and NH3-N were the indicators for flood periods. Furthermore, due to the issue of algal blooms in the Changxinggang River, it was determined that NH3-N is an indicator for algal bloom nutrient conditions, accounting for the conditions that occur during algal blooms.
Table 5.
Principal component loadings of pollutants during the non-flood period in the Changxinggang River.
Table 6.
Principal component loadings of pollutants during the flood period in the Changxinggang River.
2.4. MIKE 11 One-Dimensional Hydrodynamic–Water Quality Coupling Model
2.4.1. Model Principles
MIKE 11 is primarily used for simulating one-dimensional water bodies, such as elongated rivers and river networks. It encompasses multiple foundational modules and is characterized by its ease of operation, high precision, and minimal parameter requirements [28]. The Changxinggang River is a typical elongated river, and given the relatively short duration of water quality data observations and the limited length of river sections, the determination of ecological discharge control values for the Changxinggang River requires the consideration of factors related to improving hydraulic conditions, ensuring water quality, and preventing algal blooms. To address these requirements, this study selected the water dynamics and water environment modules from MIKE 11 as the foundational components. These modules account for vertical mass and momentum conservation and are based on one-dimensional unsteady discharge Saint-Venant equations and one-dimensional convection–diffusion models. This enabled the development of the MIKE 11 one-dimensional hydrodynamic–water quality coupled model, which comprehensively considers both hydraulic conditions and water quality; it thus provides a more objective reflection of river characteristics. The model constructed is represented by Equations (7) to (9), as shown below:
where Q represents the cross-sectional flow rate (m2/s), S denotes the cross-sectional area (m2), x stands for the distance change along the discharge direction (m), t is the time variable for the calculation point (s), q signifies the lateral inflow rate (m/s), and h and g are the river water level (m) and gravitational acceleration (m/s2), respectively. R represents the hydraulic radius of the river (m), α and U are the momentum correction coefficient and Chezy coefficient, C is the concentration of the parameter (mg/L), u denotes the average water discharge velocity (m/s), Ex is the longitudinal diffusion coefficient (m2/s), K represents the comprehensive attenuation coefficient (mg/d), s signifies the spatial coordinate (m), and v is the time coordinate (s).
2.4.2. The Solution of the Equations
The model employed the Abbott–Ionescu six-point implicit difference scheme to solve for the water level (h) and flow rate (Q) at different locations sequentially. The coupled model is capable of simulating discharge parameters such as the flow rate and water level in the water body and can subsequently yield concentration results for various water quality control indicators. The Abbott–Ionescu six-point implicit difference scheme is a numerical method that is used for solving partial differential equations. It is known for its high precision and stability, and is suitable for handling high-order spatial derivatives, nonlinearity, and multidimensional problems. It can also be combined with other numerical methods, such as finite element methods, to enhance its computational accuracy and stability. The schematic diagram of the equations is shown in Figure 6, Figure 7 and Figure 8.

Figure 6.
Implicit finite difference scheme for continuity equation at six points.
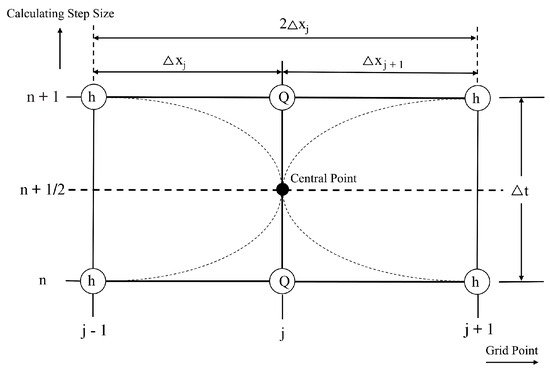
Figure 7.
Implicit finite difference scheme for momentum equation at six points.
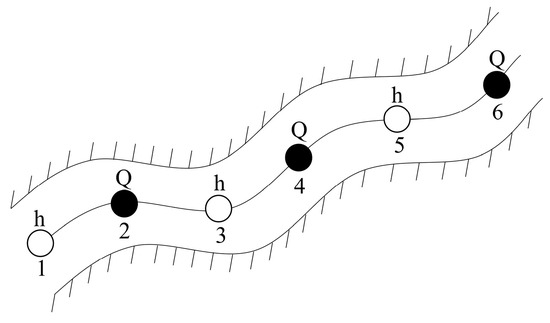
Figure 8.
Watershed computational grid.
2.4.3. Establishment of the Hydrodynamic Module
The hydrodynamic module is primarily composed of river network files, cross-section files, boundary condition files, hydrodynamic parameter files, and simulation files.
Establishment of River Network Files
Based on the existing data and research requirements, this study redefined the research area using the upstream and downstream boundaries set at the Changxing (II) hydrological station and at the downstream end of Changxinggang River, covering a total length of approximately 12 km. Additionally, there are few tributaries within the study area, and their contributions to the water discharge are relatively small. Therefore, the hydrodynamic conditions of these tributaries and their impact on the aquatic ecological environment are considered negligible and are not taken into account.
Establishment of Cross-Section Files
To capture the longitudinal variations in the cross-sections of the study area, cross-section files for the research area were established.
Establishment of boundary condition files
The boundary condition file is primarily used for inputting external and internal boundary conditions. External boundary conditions refer to the upstream discharge and downstream water level of the study area. The internal boundary conditions involve the inflow or outflow within the model. In this study, the external boundary conditions include the upstream discharge from the Changxing (II) hydrological station and the downstream water level at the end of the Changxinggang River. The internal conditions primarily involve the discharge of pollutants into the research section of the river.
Establishment of Hydrodynamic Parameter Files
The configuration of relevant parameters for the hydrodynamic module was performed in the hydrodynamic parameter settings file. Among the numerous hydrodynamic parameters, this study needed to determine the initial conditions (water level, discharge) and Manning’s roughness coefficient.
Generation of Model Files
Based on the hydrodynamic module-related files mentioned above, this study created simulation files. Firstly, this study selected the hydrodynamic module and opted for the non-steady discharge mode. Subsequently, this study imported the river network file, cross-section file, boundary condition file, and hydrodynamic parameter file. The simulation period was set according to the boundary conditions, with a time step of 5 s. Following these steps, this study also determined the output file and output frequency according to the research requirements, with an output frequency of once per day.
2.4.4. Establishment of the Water Environment Module
The water environment module was built on the foundation of the hydrodynamic module; thus, this study needed to set the water environment boundary conditions and establish advection–diffusion parameter files and simulation files based on the hydrodynamic module.
Establishment of Water Environment Boundary Files
The water environment boundary conditions were established based on hydrodynamic boundary conditions. In this study, the corresponding upstream and downstream water environment data and corresponding input pollution data needed to be imported. The upstream and downstream water environment data were imported in the form of time series files, while the input pollution data were set as a constant.
Establishment of Advection–Diffusion Files
Advection–diffusion files are primarily used to set advection–diffusion parameters to ensure that the simulation of the water environment control indicators in the model closely resembles real-world conditions. The main parameters include the simulation object, the longitudinal dispersion coefficient, the initial conditions of the water environment control indicators, and the comprehensive attenuation coefficient.
Generation of Simulation Files
The water environment module simulation files were established based on the hydrodynamic module simulation files. This study needed to import the configured advection–diffusion files into the simulation files and set the simulation time step, output file, and output frequency. In this study, the time was set to 5 s, and the simulation result output frequency was once per day. Using these steps, the one-dimensional MIKE 11 hydrodynamic–water environment coupled model required for this study was established.
2.4.5. Parameter Calibration
To ensure the accuracy of the simulation results, the model needed to calibrate the roughness coefficient of the river section, the longitudinal dispersion coefficient of the pollutants, and the comprehensive attenuation coefficient of the pollutants.
To determine the river section’s roughness coefficient, this study used the years 2018 to 2019 as the calibration period. Using an empirical method, the initial roughness coefficient for the entire river section was set to 0.033. Daily water level and discharge data from the provincially controlled Xiashenqiao section were used as reference data. The roughness coefficient was calibrated using a trial-and-error approach until the accuracy of the simulation results met the requirements. The final calibrated roughness coefficient for the river section was determined to be 0.037. Additionally, the simulated water levels and the discharge results based on Manning’s roughness coefficient were compared with the observed water level and discharge data at the Xiashen Bridge. The comparison results are shown in Figure 9 and Figure 10. The empirical method involves selecting the roughness coefficients for the study area by referring to previous research findings with a high degree of similarity to the target river section or by consulting relevant tables. The trial-and-error method is a software testing approach that involves the manual execution of application functions and operations to discover potential issues and defects and is typically performed without automated scripts.
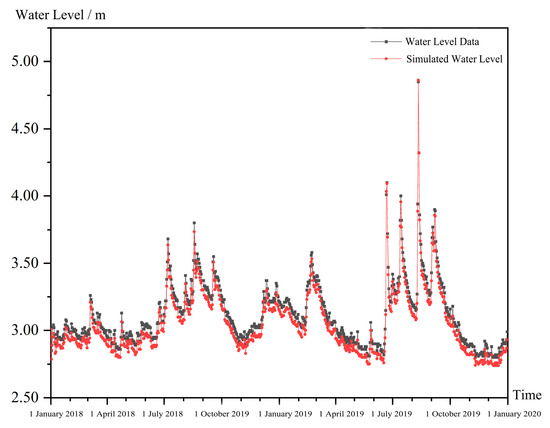
Figure 9.
Water level comparison results.
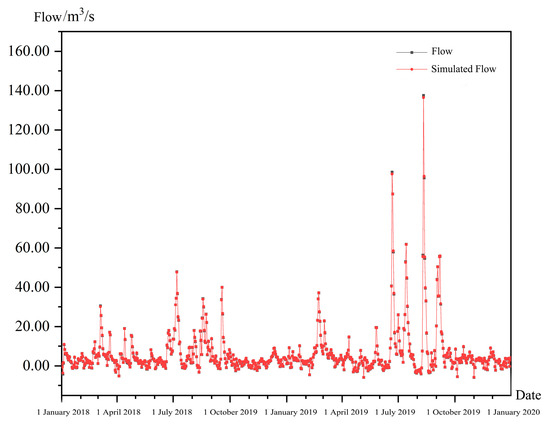
Figure 10.
Discharge comparison results.
Regarding the longitudinal dispersion coefficient of the river section, considering that Changxinggang River is a typical river in the Taihu Basin, this study used an empirical method to obtain a typical value of 8.00 m²/s for the longitudinal dispersion coefficient of the Taihu Basin, which was used as the value for the Changxinggang River. Via the literature review, this study collected the longitudinal dispersion coefficient values for some domestic rivers; please refer to Table 7 for details.
Table 7.
Longitudinal dispersion coefficient values for some rivers in China.
The comprehensive attenuation coefficient reflects the ability of water to degrade pollutants and is influenced by several factors, including water temperature, hydrological conditions, and river conditions. Therefore, this study employed the period from May 2018 to October 2019 as the calibration period and used the analysis-by-borrowing method to calibrate the comprehensive attenuation coefficients for NH3-N, TP, CODMn, and BOD during both the non-flood and flood periods. The analysis-by-borrowing method, based on data in the literature, involved setting the comprehensive attenuation coefficients for similar rivers as the initial values for this study. The values were then iteratively calibrated to determine the appropriate values. Based on some rivers in China, this study obtained values for the comprehensive attenuation coefficient of the water environment control indicators considered. Please refer to Table 8 for details.
Table 8.
Comprehensive attenuation coefficient values for water environment control indicators in some rivers in China.
By adjusting the values of the comprehensive attenuation coefficients, the simulation results of the water environment control indicators for each corresponding water period were compared with the actual monitoring data obtained from the Xintang section. The values with the lowest average relative errors were selected as the comprehensive attenuation coefficients for each water period. The calibrated results for the comprehensive attenuation coefficients of each water environment control indicator are shown in Table 9.
Table 9.
Statistical summary of the calibration results for the comprehensive attenuation coefficients of the control indicators in the waters of the Changxinggang River.
2.4.6. Model Validation
Based on the parameter calibration results mentioned above, a comparison was made between the simulation results for the water level and discharge in the Xiashenqiao section and the observed data. The relative mean error (), correlation coefficient (R2), and Nash–Sutcliffe coefficient values are presented in Table 10.
Table 10.
List of parameter calibration results for the Xiashenqiao water level and discharge.
From Table 10, it can be observed that the water level calibration results had a relative error of less than 10.00%, an R2 value greater than 0.600, and a Nash–Sutcliffe coefficient greater than 0.900. Similarly, the discharge calibration results also show a relative error of less than 10.00%, an R2 value greater than 0.600, and a Nash–Sutcliffe coefficient greater than 0.900. It is evident that the model developed in this study, along with the calibrated parameters, effectively reflects the water level and discharge conditions in the Changxinggang River.
Additionally, based on the parameter values calibrated in the previous section, the simulation results for the water environmental control indicators in the Xintang section and the average relative error compared to the measured data are shown in Table 11.
Table 11.
Statistical summary of relative errors in the calibration of comprehensive attenuation coefficients for water quality control indicators in the water body.
It is evident from Table 11 that, based on the parameter values calibrated in the previous sections, the relative errors for the simulated water quality control indicators during both the non-flood period and flood period in the Changxinggang River’s Xintang section are all less than 17%.
In a study conducted by Zhang et al. [29], a two-dimensional hydrodynamic–water quality coupling model was developed for Honghu Lake. The model’s simulation accuracy was verified by comparing the measured pollutant values with the simulated values. The average relative errors for TP, total nitrogen (TN), ammonium nitrogen (NH4+-N), and CODMn were 15.9%, 18.5%, 18.5%, and 8.7%, respectively, and were thus all within a reasonable range (less than 20%). This indicates that the parameter selection for the water quality model was reasonable and met the requirements regarding the simulation accuracy.
In comparison to the aforementioned study, the relative errors in this research are also less than 20%, demonstrating that the model exhibits a high level of simulation accuracy and can effectively represent the actual conditions of water quality control indicators. Therefore, it can be concluded that the parameter values calibrated in this study are reasonable and suitable for use in research on ecological discharge control values for Changxinggang River.
3. Results
From the perspective of safeguarding water quality in the ecosystem, this study employed the Xintang section as the control segment for the aquatic ecological environment. Using the MIKE 11 one-dimensional hydrodynamic–water quality coupling model, this research simulated the water environment in the study area under various hypothetical conditions, thereby calculating the appropriate ecological discharge control values for the Changxinggang River during both non-flood and flood periods.
3.1. The Calculation of Ecological Discharge Control Values during Non-Flood Period
The Standard [26] is a set of standards established in China for assessing and monitoring the quality of surface water. This standard categorizes surface water quality into different classes, with “Class III standards” being one of the classifications, typically representing the minimum water quality standards for centralized domestic water supply. Each class specifies allowable types of pollutants and concentration limits. In this study, the Class III standards of the aforementioned criteria are adopted as the indicator concentration standards, with concentration standard values set at 1 mg/L for NH3-N, 6 mg/L for CODMn, and 4 mg/L for BOD.
Via the use of frequency distribution statistics, the daily average discharge in the Changxinggang River during the non-flood period was found to be concentrated between 0.00 to 5.00 m3/s in the past 10 years, with a relative frequency of 63.76%. Therefore, three discharge hypothetical values of 1.50 m3/s, 3.00 m3/s, and 4.50 m3/s were selected as the discharge hypothetical values for the Changxinggang River during the non-flood period and set as the upper boundary discharge. The downstream boundary water level was set at an average water level of 3.21 m during the non-flood period in 2018–2019. Using the period from November 2018 to April 2019 as the simulation period, the MIKE 11 one-dimensional hydrodynamic–water environment coupling model was used to simulate the water environmental control indicators for the Changxinggang River during the non-flood period. An analysis of the concentration compliance of the control indicators in the Xintang section was conducted and discussed. The simulation results are presented in Figure 11.
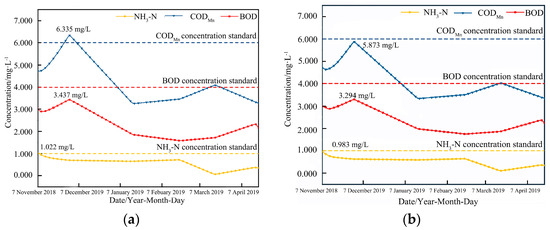
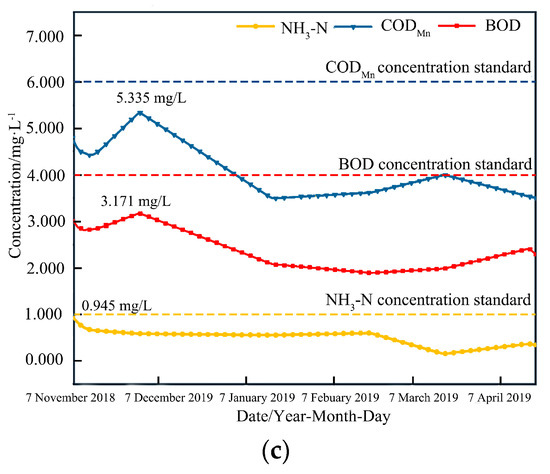
Figure 11.
Variations in NH3−N, CODMn, and BOD concentrations during the non−flood period: (a) hypothetical value 1 (1.50 m3/s); (b) hypothetical value 2 (3.00 m3/s); (c) hypothetical value 3 (4.50 m3/s).
From Figure 11, it can be observed that the BOD can consistently meet the water environmental control standard value for the Xintang section at all three discharge hypothetical conditions. NH3-N and CODMn have concentration exceedance issues under the hypothetical value 1 condition, but can stably meet the Xintang section’s water environmental control standard values under the hypothetical value 2 and 3 conditions. Therefore, further studies used the range from hypothetical value 1 (1.50 m3/s) to hypothetical value 2 (3.00 m3/s) as the interval and used the achievement of the NH3-N and CODMn concentrations meeting the standard values for the Xintang section as the control criteria. The trial-and-error method was applied to determine the discharge from the Changxing (II) Hydrological Station. The maximum variations in the concentration of NH3-N and CODMn under each hypothetical discharge condition are shown in Table 12.
Table 12.
Maximum changes in concentration of NH3-N and CODMn under different discharge hypothetical value conditions.
Table 12 shows that with the gradual increase in the discharge hypothetical values, the maximum concentrations of NH3-N and CODMn gradually decreased, and the nutrient conditions for cyanobacterial blooms were alleviated. When the discharge hypothetical value was 2.33 m3/s, the maximum NH3-N concentration met the water environmental standard value for the Xintang section for the first time. When the discharge hypothetical value was 2.54 m3/s, the maximum CODMn concentration was 6.000 mg/L, meeting the water environmental standard value for the Xintang section for the first time. In summary, when the flow control value was set at 2.54 m3/s, the concentrations of NH3-N, CODMn, and BOD all met the water quality standards. Thus, from the perspective of ensuring the quality of environmental water and alleviating the nutrient conditions that promote cyanobacterial blooms, the suitable ecological discharge control value for the Changxinggang River during non-flood periods should be 2.54 m3/s.
3.2. The Calculation of Ecological Discharge Control Values during Flood Period
According to the Standard [26], the concentration standard values for NH3-N, CODMn, and TP are 1 mg/L, 6 mg/L, and 0.2 mg/L, respectively.
The frequency distribution statistics show that, over the past 10 years, the daily average discharge data for the Changxinggang River during the flood period are concentrated in the range of 0.00 to 10.00 m3/s, with a relative frequency of 65.82%. Therefore, this study selected three discharge hypothetical values for the Changxinggang River during the flood period: 2.50 m3/s, 4.00 m3/s, and 5.50 m3/s, and set them as the upstream boundary discharge. The downstream boundary water level was set to the average water level during the flood period from 2018 to 2019, which was 3.43 m. All other conditions remained the same as those present during the non-flood period. Based on the available data, this study used the period from May to October 2018 to simulate NH3-N during the flood period and the period from May to October 2019 to simulate TP and CODMn during the flood period. The MIKE 11 one-dimensional hydrodynamic–water quality coupled model was used to simulate the water environmental control indicators for Changxinggang River during the flood period, and the simulation results are shown in Figure 12 (left scale is for TP and CODMn concentrations, the right scale is for NH3-N concentration, the top scale is for May to October 2018, and the bottom scale is for May to October 2019).
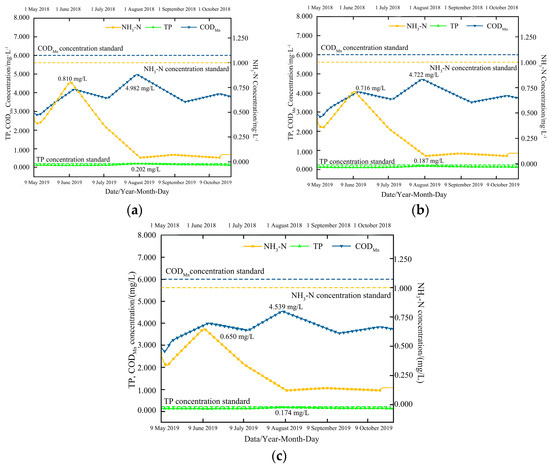
Figure 12.
Variations in NH3−N, TP, and CODMn concentrations during the flood period: (a) hypothetical value 1 (2.50 m3/s); (b) hypothetical value 2 (4.00 m3/s); (c) hypothetical value 3 (5.50 m3/s).
From Figure 12, it can be observed that NH3-N and CODMn under all three hypothetical discharge conditions can consistently meet the water environmental standard values in the Xintang section and alleviate the nutrient conditions for blue–green algae outbreaks. The TP exceeded the concentration limits under discharge hypothetical value 1, but it could stably meet the water environmental standard value in the Xintang section under discharge hypothetical values 2 and 3. Therefore, this study considered the range from discharge hypothetical value 1 (2.50 m3/s) to discharge hypothetical value 2 (4.00 m3/s), and used a trial-and-error approach to determine the suitable ecological discharge control value for the Changxinggang River during the flood period; this was dependent on the TP concentration meeting the standard value in the Xintang section. The maximum changes in the TP concentration under various discharge hypothetical conditions are shown in Table 13.
Table 13.
Maximum TP concentration changes under different discharge hypothetical value conditions.
From Table 13, it is evident that as the discharge hypothetical values increase, the TP concentration in the Xintang Section gradually decreased. When the upstream boundary discharge at the Changxing (II) hydrological station was set to 2.63 m3/s, the TP concentration in the Xintang section decreased to 0.200 mg/L, meeting the environmental standard value for water in the Xintang section for the first time. In summary, when the hypothetical flow rate was 2.63 m3/s, the concentrations of NH3-N, CODMn, and TP all met the water environmental standards. Thus, from the perspective of safeguarding the quality of environmental water, the suitable ecological discharge control value for the Changxinggang River during the flood period should be 2.63 m3/s.
4. Discussion
This study constructed a MIKE 11 one-dimensional hydrodynamic–water quality coupling model using MIKE 11 software. Utilizing this model, the ecological discharge control values for the Changxinggang River were determined, with a focus on safeguarding the quality of the water ecosystem and suppressing the occurrence of algal blooms, using the Xintang section as a representative section.
MIKE11 is a one-dimensional hydrodynamic model designed to simulate the discharge and water quality in rivers and channels, suitable for relatively simple river systems with limited longitudinal variations. In contrast, MIKE21, as a two-dimensional hydrodynamic model, is applicable to a wider range of water bodies, including lakes, river reaches, estuaries, and nearshore areas. However, MIKE21 has a more complex model structure and higher data input requirements. This study focuses on the Changxinggang River in Changxing County, Zhejiang Province, a typical elongated river. The choice of MIKE11 as the foundational model, rather than MIKE21 or other two-dimensional models, is based on MIKE11’s suitability for scenarios with limited lateral variations, high computational efficiency, and model simplification characteristics, making it more suitable for long and narrow rivers. MIKE11 has lower data requirements, making it more adaptable to limited data availability. It has demonstrated higher accuracy in ecological discharge calculations in past applications. In this study, our main focus is on the interaction effects of flow, water quality, and ecological factors, and the MIKE11 one-dimensional model is adequate to meet these research needs. However, we are aware that relying solely on MIKE11 may have certain limitations. Future investigations will explore the potential advantages of MIKE21, a two-dimensional model, and coupled one-dimensional and two-dimensional models like MIKE flood.
By analyzing and comparing the hydrological and water quality monitoring data obtained from the Xintang section of the Changxinggang River and the discharge data obtained from the Changxing (II) hydrological station from 2018 to 2021, it was observed that the daily average discharge during both non-flood and flood periods in the Xintang section of the river was consistently below the recommended control values. Additionally, as the discharge increased, the concentration of NH3-N gradually decreased, mitigating the nutrient conditions conducive to the occurrence of algal blooms in the Changxinggang River. This study has shown that river discharge has a significant influence on the aquatic environment. This aligns with the findings of Zhang et al. [30] in their analysis of the causes of algal blooms and simulation research in the context of hydraulic engineering, which revealed that hydraulic conditions such as the discharge velocity and discharge directly and indirectly affect the growth, development, and spatial distribution of algae. Furthermore, this study found that discharge has a certain threshold effect on the aquatic environment, which plays a vital role in the formation of environmental problems such as algal blooms. When the river discharge is below a certain threshold, environmental issues such as algal blooms are more likely to occur. Increasing the river discharge to a certain extent alleviates these environmental problems. This is consistent with the research conducted by He et al. [31], which investigated the characteristics of algal blooms and the ecological discharge threshold in the middle and lower reaches of the Han River. They found that river discharge is a key influencing factor in algal blooms in rivers. Slower discharges carry a risk of algal blooms, while discharges exceeding the threshold suppress algal growth.
This study used the MIKE 11 one-dimensional hydrodynamic–water environment coupled model to simulate the river environment under different discharge hypothetical conditions and calculated the suitable ecological discharge control values for the Changxinggang River during non-flood and flood periods; these were found to be 2.54 m3/s and 2.63 m3/s, respectively. The results of this study indicate that the ecological discharge control values are higher during the flood period than during the non-flood period. This is because the flood period experiences more precipitation, resulting in higher flow rates, higher water levels, increased sediment from rainfall, and higher concentrations of pollutants such as pesticides and fertilizers. Setting higher ecological discharge control values helps to maintain the ecological balance of the river and reduces the risk of flooding, sedimentation, and pollution. During the non-flood period, which sees reduced rainfall, the flow rates are relatively low, and the ecological discharge control values are correspondingly lower. This is consistent with the results obtained by Su [32] in his research, which was conducted on ecological discharge control targets in the Manas River in Xinjiang. He found that the ecological water discharge target in the Hongshan Mouth Diversion Hub section during the normal water period (May to June and October to November) is 43.2 million cubic meters, while the ecological water discharge target during the flood period (July to September) is 135.83 million cubic meters.
This study compared the daily average discharge data obtained for nearly 10 years during non-flood and flood periods with the recommended ecological discharge control values. The results show that 60.89% of non-flood period daily average discharge data and 76.36% of flood period daily average discharge data can reach the ecological discharge control values of 2.54 m3/s and 2.63 m3/s. When the discharge data are equal to or greater than the ecological discharge control values, algal bloom problems in the Changxinggang River are relatively minor or do not occur. This is consistent with the findings of Yu et al. [33] in their research on the calculation of ecological discharge and the analysis of control measures in rain-fed rivers. They discovered that to ensure the ecological base discharge of the Dasha River, various control measures, such as different guaranteed water rates and regular scheduling management, should be adopted to ensure the healthy and sustainable development of the river ecosystem. Therefore, the ecological discharge control values obtained in this study are achievable in practical control work. Based on the comparative analysis of the maximum concentrations of each control index, this study concluded that increasing the discharge is a feasible means by which to improve the hydraulic conditions and enhance the diffusion and dilution capacity of pollutants; this could help to mitigate water quality issues in the Changxinggang River.
To effectively safeguard the ecological health of the Changxinggang River, measures such as enhancing ecological water resource protection, constructing a high-efficiency water-saving society, advancing river and lake ecological restoration projects, implementing algal bloom prevention and control measures, and improving the intelligent governance of the aquatic environment can be taken in the future.
5. Conclusions
Based on the actual hydrodynamic conditions and water environment status of Changxinggang River, this study selected the hydrodynamic module and water environment module of the MIKE 11 software as the foundation. By combining relevant hydrological data related to the Changxinggang River, the coupling of the new hydrodynamic module and water environment module was achieved via data transfer and information exchange. This process resulted in the construction of the MIKE 11 one-dimensional hydrodynamic–water environment coupled model. The for the simulated values of the main water quality control indicators during each hydrological period compared to the measured values consistently remained below 17.00%. This suggests that the model exhibits a good simulation accuracy and can effectively simulate the hydrological and water quality conditions of the Changxinggang River. It can also be employed for calculations and analyses related to ecological discharge control.
PCA was able to determine that the water quality control indicators for the non-flood period in the Changxinggang River are NH3-N, CODMn, and BOD, while the water quality control indicators during the flood period are NH3-N, TP, and CODMn. Considering the three objectives of improving water dynamics, safeguarding water ecosystem quality, and controlling algal blooms, the ecological discharge for the Changxinggang River was calculated based on the developed MIKE 11 one-dimensional hydrodynamic–water quality coupling model. Using the Xintang section as the representative section, calculations were performed separately for the non-flood and flood periods. The recommended ecological discharge control values were ultimately determined as 2.54 m3/s for the non-flood period and 2.63 m3/s for the flood period. This study further demonstrated that increasing the flow rates led to lower nutrient concentrations in the Changxinggang River, thus mitigating the conditions conducive to the occurrence of algal blooms and improving the aquatic environment. All water quality control indicators met the control standard values with regard to increased flow rates.
Therefore, the ecological discharge control recommendations proposed in this study are scientifically valuable and serve as important references for safeguarding environmental water quality in the Changxinggang River. It is worth mentioning that the ecological discharge calculations for the algal bloom period involve relatively complex mechanisms and numerous factors, and it is recommended that further discussions take place in future research.
Author Contributions
Conceptualization, D.H.; methodology, C.T.; software, T.X.; validation, Z.L.; formal analysis, H.M.; investigation, Z.Z.; resources, C.T.; data curation, X.D.; writing—original draft preparation, D.H.; writing—review and editing, Z.L.; visualization, H.M.; supervision, C.T.; project administration, D.H.; funding acquisition, C.T. All authors have read and agreed to the published version of the manuscript.
Funding
This research was funded by the [Science and Technology Project of the Zhejiang Water Resources Department] grant number [RA2008, RB2206] awarded to Chuanchong Tian and Dongjing Huang, [Scientific research foundation of Zhejiang University of Water Resources and Electric Power] grant number [XKY2022007] awarded to Dongjing Huang, and [The 111 Project of Energy and Environmental System Analysis and Engineering Applications] grant number [B14008] awarded to Xiaowen Ding.
Data Availability Statement
The data presented in this study are available on request from the corresponding author. The data are not publicly available due to [part of the data used in this paper are confidential materials].
Acknowledgments
We are very grateful to Xiaowen Ding from the North China Electric Power University for her support and assistance in this work.
Conflicts of Interest
Author Chuanchong Tian was employed by the company Zhejiang Design Institute of Water Conservancy and Hydroelectric Power Co., Ltd. The remaining authors declare that the research was conducted in the absence of any commercial or financial relationships that could be construed as a potential conflict of interest.
References
- Zhao, R.D.; Fang, C.L.; Liu, H.M.; Liu, X.X. Evaluating urban ecosystem resilience using the DPSIR framework and the ENA model: A case study of 35 cities in China. Sustain. Cities Soc. 2021, 72, 102997. [Google Scholar] [CrossRef]
- Wang, N.; Li, H.D.; Tang, L.; Zhao, L.J.; Qiu, K.B.; Yao, G.H.; Wang, W.M. Urban ecological observation: Objects, systems and criterion of quality control. Acta Ecol. Sin. 2021, 41, 8807–8819. [Google Scholar] [CrossRef]
- Basak, S.M.; Hossain, S.; Tusznio, J.; Grodzińska-Jurczak, M. Social benefits of river restoration from ecosystem services perspective: A systematic review. Environ. Sci. Policy 2021, 124, 90–100. [Google Scholar] [CrossRef]
- Yang, Z.D. Comparison and empirical analysis of the urban economic development level in the Yangtze River urban agglomeration based on an analogical ecosystem perspective. Ecol. Inform. 2021, 64, 101321. [Google Scholar] [CrossRef]
- Kaiser, N.N.; Feld, C.K.; Stoll, S. Does river restoration increase ecosystem services? Ecosyst. Serv. 2020, 46, 101206. [Google Scholar] [CrossRef]
- Kong, L.; Chen, J.X.; Jiang, R.F.; Shi, Y.; Chen, J. Analysis of Watershed Integrated Planning under the Concept of Water Ecological Civilization. Water Resour. Dev. Res. 2019, 19, 6. [Google Scholar] [CrossRef]
- Yan, Z.Q.; Zhou, Z.H.; Sang, X.F.; Wang, H. Water replenishment for ecological flow with an improved water resources allocation model. Sci. Total Environ. 2018, 643, 1152–1165. [Google Scholar] [CrossRef]
- Zhang, P.; Li, K.F.; Wu, Y.L.; Liu, Q.Y.; Zhao, P.X.; Li, Y. Analysis and restoration of an ecological flow regime during the Coreius guichenoti spawning period. Ecol. Eng. 2018, 123, 74–85. [Google Scholar] [CrossRef]
- Wang, Z.G.; Zhao, L.L.; Chen, Q.W.; Huang, Z. Analysis of the ecological flow concept. China Water Resour. 2020, 15, 29–32. [Google Scholar]
- Liu, S.Y. A Brief Discussion on the Determination and Protection of River Ecological Flow. Huai River Gov. 2020, 9, 11–12. [Google Scholar]
- Jia, H.F.; Ma, H.T.; Wei, M.J. Calculation of the minimum ecological water requirement of an urban river system and its deployment: A case study in Beijing central region. Ecol. Model. 2011, 222, 3271–3276. [Google Scholar] [CrossRef]
- Peters, D.L.; Baird, D.J.; Monk, W.A.; Armanini, D.G. Establishing Standards and Assessment Criteria for Ecological Instream Flow Needs in Agricultural Regions of Canada. J. Environ. Qual. 2012, 41, 41–51. [Google Scholar] [CrossRef] [PubMed]
- Cheng, B.; Li, H.E.; Yue, S.Y.; Huang, K. A conceptual decision-making for the ecological base flow of rivers considering the economic value of ecosystem services of rivers in water shortage area of Northwest China. J. Hydrol. 2019, 578, 124126. [Google Scholar] [CrossRef]
- Xie, Y.; Wen, J.W.; Wen, W.; Yang, C.S. Deter-mination and analysis of the ecological flow of Ashi River. Environ. Sci. Technol. 2021, 44, 223–228. [Google Scholar] [CrossRef]
- Tennant, D.L. Instream flow regimens for fish, wildlife, recreation and related environmental resources. Fisheries 1976, 1, 6–10. [Google Scholar] [CrossRef]
- Richter, B.D.; Baumgartner, J.V.; Powell, J.; Braun, D.P. A method for assessing hydrologic alteration within ecosystems. Conserv. Biol. 1996, 10, 1163–1174. [Google Scholar]
- Nehring, R.B. Evaluation of Instream Flow Methods and Determination of Water Quantity Needs for Streams in the State of Colorado; Colorado Division of Wildlife: Denver, America, 1979. [Google Scholar]
- Liu, C.M.; Men, B.H.; Song, J.X. Eco-Hydraulic Radius Method for Estimating Instream Ecological Water Demand. Prog. Nat. Sci. 2007, 17, 7. [Google Scholar]
- Chen, Z.Y.; Zhou, H.; Wu, W.S.; Yi, P. Determination Method of Zhoushan Ecological Flow of Urban Artificial River. W Resour. Power. 2021, 39, 52–55. [Google Scholar]
- Meng, D. Study on Ecological Water Demand in Artificial River Channels in Plain Areas; Yangzhou University: Yangzhou, China, 2021. [Google Scholar] [CrossRef]
- Tao, H.N.; Liu, X.W.; Li, B.; Hu, X. Research on delicacy management of small watersh ed based on WASP model—Take the Lushui River Basin in Zhuzhou as an example. J. Xiangtan Univ. (Nat. Sci. Ed.) 2023, 45, 1–11. [Google Scholar] [CrossRef]
- Jiang, L.B.; Wang, M.; Gao, X.J. Water Quality Simulation Analysis of the Malian River Reservoir Based on EFDC. Energy Environ. 2021, 5, 89–91. [Google Scholar]
- Liang, L.; Deng, Y.; Zheng, M.F.; Wei, X. Nutrient Enrichment Prediction in the Longchuan River Tributary using the CE-QUAL-W2 Model. Resour. Environ. Yangtze Basin. 2014, 23, 103–111. [Google Scholar] [CrossRef]
- Fan, G.H. A Study on the Health Assessment of Changxing Port River in Changxing County, Zhejiang Province; North China Electric Power University: Beijing, China, 2023. [Google Scholar] [CrossRef]
- Zheng, B.F.; Fan, Y.Y.; Ren, Y.H.; Huang, Q.Y.; Huang, Y. Assessment of Water Environment Carrying Capacity in Typical River Network Areas: A Case Study of Changxing County. Chin. Rural Water Hydropower 2020, 7, 54–59. [Google Scholar]
- State Environmental Protection Administration of China; General Administration of Quality Supervision, Inspection and Quarantine of China. Environmental Quality Standards for Surface Water (GB 3838—2002); Ministry of Ecology and Environment of People’s Republic of China: Beijing, China, 2002.
- Xiang, W.X.; Chen, J.G.; Li, S.; Li, Z.; Cai, M. Comprehensive Assessment of Water Quality Pollution in Baitan Lake Based on Principal Component Analysis. J. Green Sci. Technol. 2023, 25, 93–97. [Google Scholar] [CrossRef]
- Ding, Y.T.; Mo, L.J.; Huang, D.J.; Ge, S.Y.; Ju, Q.; Gu, H.N. Simulation Study on Improving Water Environment Quality in Plain River Networks with Drainage Based on MIKE11. Chin. Rural Water Hyd. 2023, 9, 166–170. [Google Scholar] [CrossRef]
- Zhang, T.; Wang, X.L.; Geng, J.J.; Ban, X.; Yang, C.; Lv, X.R. Water Quality Simulation and Assessment of Hong Lake Based on MIKE21 and Grey Model Recognition. Resour. Environ. Yangtze 2018, 27, 2090–2100. [Google Scholar] [CrossRef]
- Zhang, Y.; Xia, R.; Zhang, M.H.; Jing, Z.X.; Zhao, Q.; Fan, J.T. Analysis and Simulation Study of the Causes of Cyanobacterial Blooms in Rivers under the Background of Hydraulic Engineering. Res. Environ. Sci. 2017, 30, 1163–1173. [Google Scholar] [CrossRef]
- He, S.F.; Hu, W.; Yang, Z.L.; Feng, T.; Yan, H.L.; Lin, Y.Q.; Chen, Q.W. The Characteristics of Algal Blooms in the Middle and Lower Reaches of the Han River and their Ecological Flow Threshold. Chin. Environ. Sci. 2023, 9, 1–9. [Google Scholar] [CrossRef]
- Su, Z.Q. Research on Determination of Ecological Flow Control Targets in Manas River, Xinjiang. Shaanxi Water Res. 2023, 9, 37–39. [Google Scholar] [CrossRef]
- Yu, Z.B.; Zhang, L.; Yao, H.B.; Wan, D.H. Calculation of Ecological Flow and Analysis of Control Measures in Rain-fed Rivers. Guangdong Water Res. Hydropower 2022, 11, 43–47. [Google Scholar]
Disclaimer/Publisher’s Note: The statements, opinions and data contained in all publications are solely those of the individual author(s) and contributor(s) and not of MDPI and/or the editor(s). MDPI and/or the editor(s) disclaim responsibility for any injury to people or property resulting from any ideas, methods, instructions or products referred to in the content. |
© 2024 by the authors. Licensee MDPI, Basel, Switzerland. This article is an open access article distributed under the terms and conditions of the Creative Commons Attribution (CC BY) license (https://creativecommons.org/licenses/by/4.0/).