1. Introduction
The metallurgical industry, along with the accompanying processes, is one of the essential elements of economic development [
1,
2]. During the operation of smelters, gas, water, and slag are produced [
3,
4,
5]. The mining and smelting of metal ores is one of the factors of heavy metal accumulation in the environment [
6]. Smelting activities can cause soil, water, and air pollution [
7,
8]. Contamination may include metals such as copper, arsenic, cadmium, lead, or nickel [
9]. It should be noted that the negative impact of metals not only affects the environment, but also human health.
The greatest threat is observed in the case of lead and cadmium contamination [
10,
11]. Particularly dangerous are high concentrations of cadmium, the emission of which comes mainly from the industrial sector [
12]. In the vicinity of smelters, other infrastructure is also being built, such as landfills. Slags after smelting are subject to physicochemical erosion, posing a potential threat [
13]. Waste containing the above-mentioned metals is particularly dangerous due to their difficult removal from the soil. It should also be kept in mind that, apart from the direct migration of pollutants to soils and waters, interactions of slags with the soil or vegetation of landfills may also occur [
14]. Such interactions can lead to increased mobility of metals from slags [
15,
16].
The half-life of select metals is almost 6000 years [
17]. Therefore, it seems important to react quickly to pollution and constantly monitor the quality of groundwater and soil in the vicinity of such facilities. Groundwater quality should be monitored in the area of zinc smelters in order to determine the impact of this facility. Much attention is focused on the recovery of metals; the use of waste in, e.g., construction, geotechnics, or agronomy [
18]; or the pollutant-leaching processes themselves. Studies assessing the impact of smelting on the metallic state of contaminants in the soil and on human health are quite common too but do not take into account the groundwater aspect [
19].
Groundwater risk assessment is an effective way to protect groundwater resources and should be performed through the use of monitoring results. The results of monitoring tests should be related to the acceptable standards for waters. The natural hydrochemical background, standards for drinking water, or limit values for various quality classes can be used as a reference level [
20].
Index methods are ideally suited for assessing groundwater quality in the vicinity of pollution sources [
21,
22]. Many of the proposed indicators are specifically designed to assess metal content in waters. These are, for example, the landfill water pollution index (LWPI) [
23,
24], the heavy metal pollution index (HPI) [
25], and the metal index (MI) [
26].
The aim of the article is to present the results of the groundwater quality assessment of the Quaternary aquifer in the area of Miasteczko Śląskie Smelter in selected years of the facility’s operation. Three indicator methods and a set of metals consisting of Pb, Cd, Ni, Cu, Fe, Mn, and Zn were considered.
2. Material and Methods
2.1. Study Area
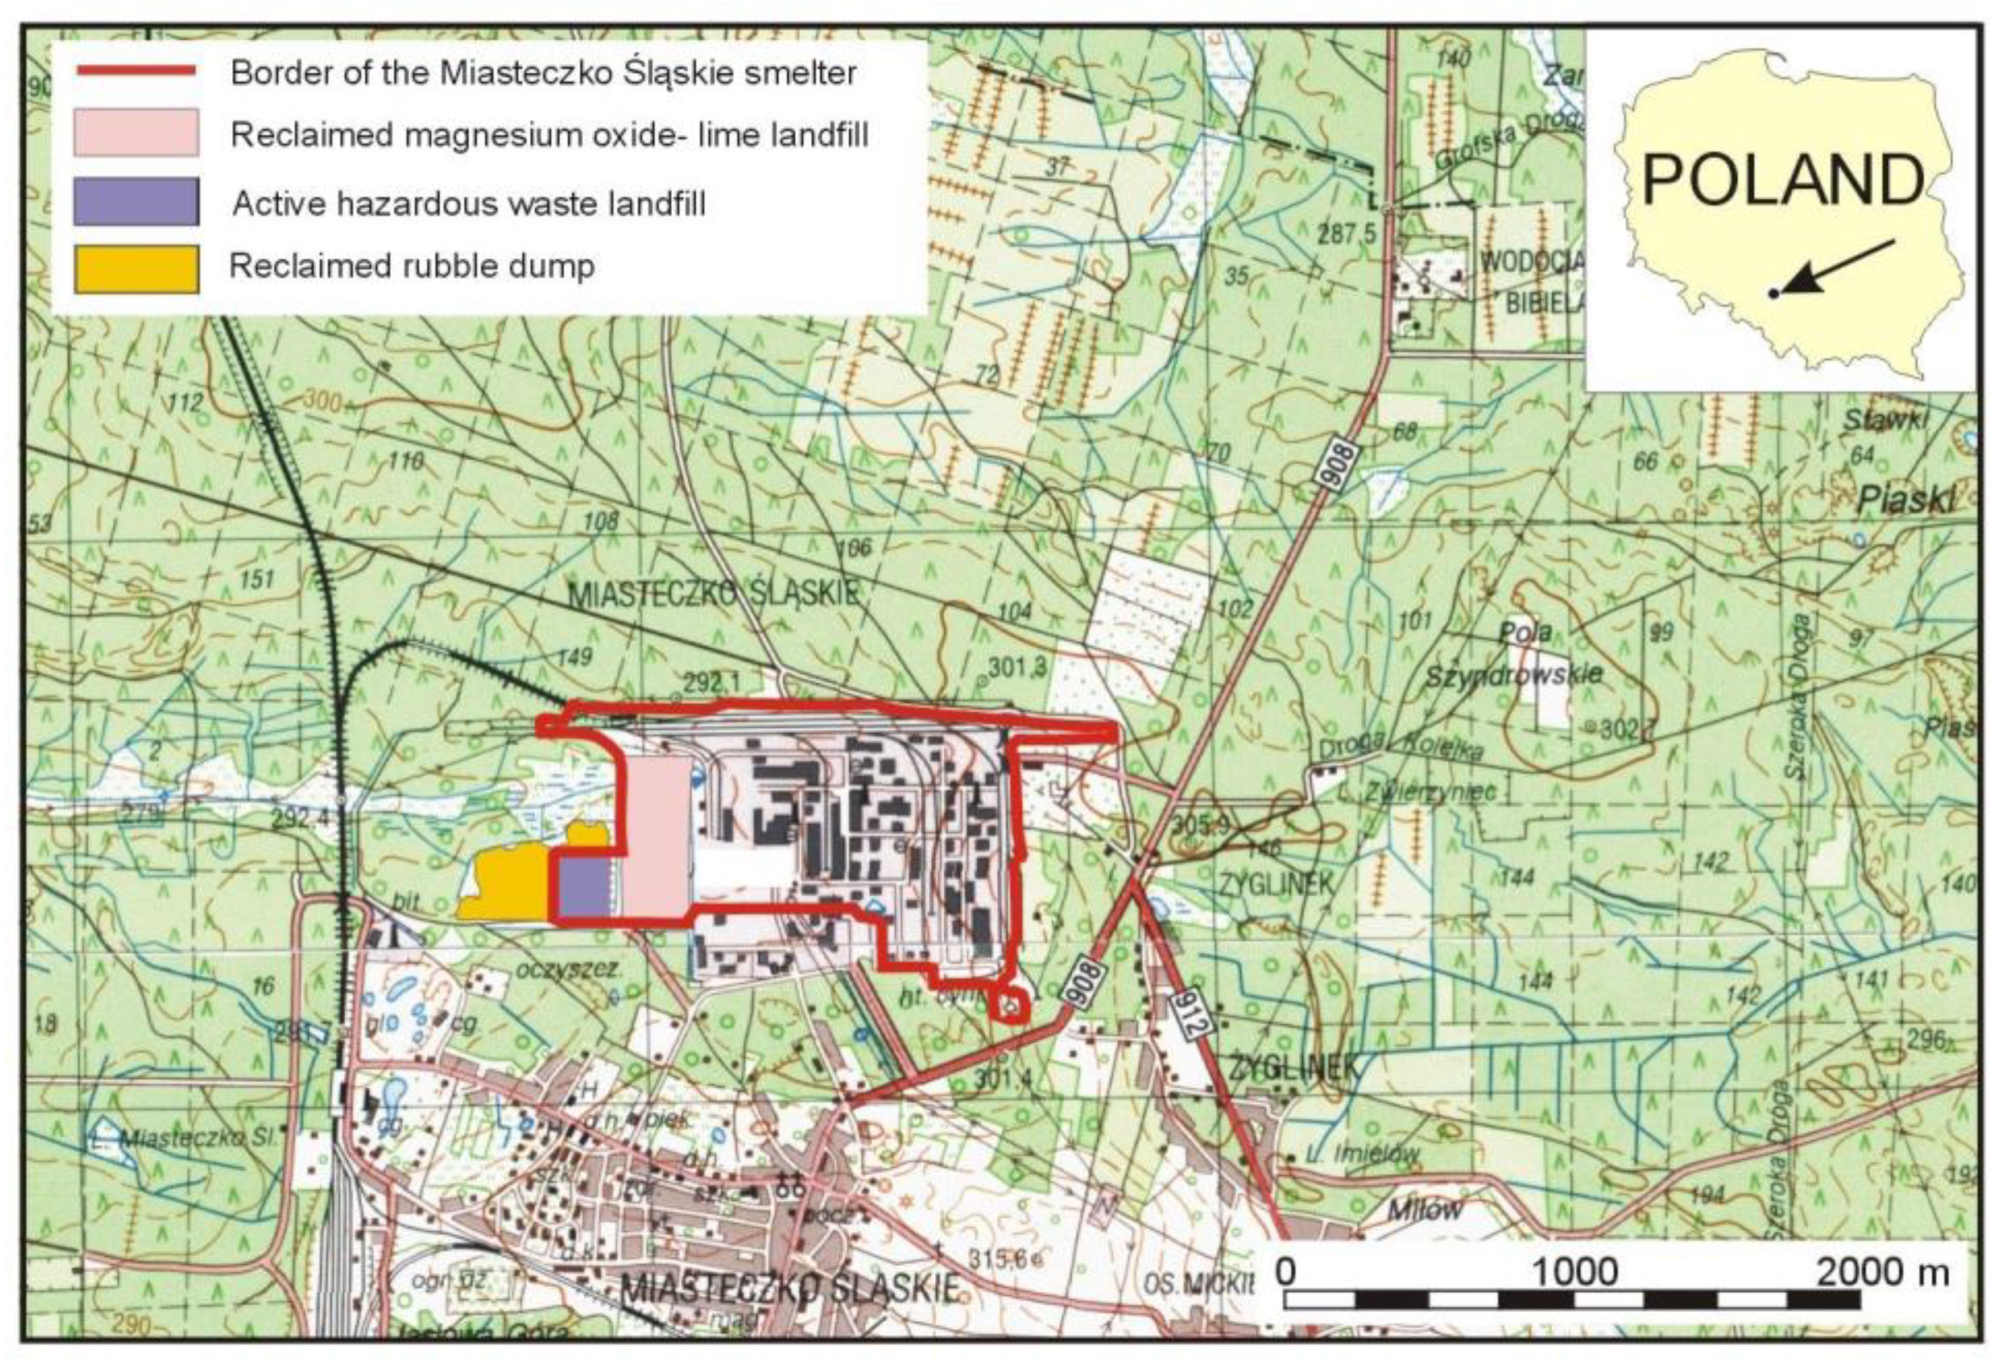
The research area is located in the region of the Miasteczko Śląskie Zinc Smelter (southern Poland). The smelter is located about 7 km north-east of Tarnowskie Góry and covers an area of about 1.4 km
2. From the north and west, the smelter area is surrounded by extensive forests, and about 1 km to the south, there are buildings of Miasteczko Śląskie (
Figure 1).
The smelter produces zinc and lead, obtained in the process of simultaneous smelting in a shaft furnace using the Imperial Smelting processes (ISP) method. In addition to the basic production, significant amounts of sulfuric acid are generated in the desulphurization installations of furnace gases.
Currently, there is one production complex located in the eastern part of the smelter which, together with the sulfuric acid factory, occupies approx. 15% of the entire area. The remaining area is occupied by auxiliary departments, warehouses and landfills for production means, and industrial waste landfills (
Figure 1). The central and western part of the area is occupied by buildings and landfills of the old production complex, together with the original sulfuric acid factory and the installations of the former zinc oxide smelter, totaling approximately 20 ha. The waste from this production process was a significant amount of oxide-magnesium lime, which was stored in a landfill in the western part of the smelter area. The area of the landfill, together with the rubble dump located nearby, is approximately 27 ha in total. The entire area of the smelter has been significantly transformed. During the construction of the new complex, surface leveling was carried out. Most likely, the unevenness of the terrain was covered with post-production waste, such as slags and sludge. Under the surface of the site, there is a whole range of technological installations, from power lines to cooling and gas purification installations.
The zinc smelter Miasteczko Śląskie is located in an area with a complex geological structure. In the central and eastern part of the area occupied by the smelter, there are Middle Triassic carbonate formations on the surface, which dip steeply to the west and north. They are overlain by Quaternary deposits with a very variable lithological formation, the thickness of which increases to the north and west. Both the Quaternary and Triassic formations contain aquifers. In the area of Miasteczko Śląskie, the main aquifer is of the Triassic carbonate series. Because both the Triassic and Quaternary horizons are relatively shallow and because there is no isolation between these levels that are simple, all aquifers occurring here had to be observed.
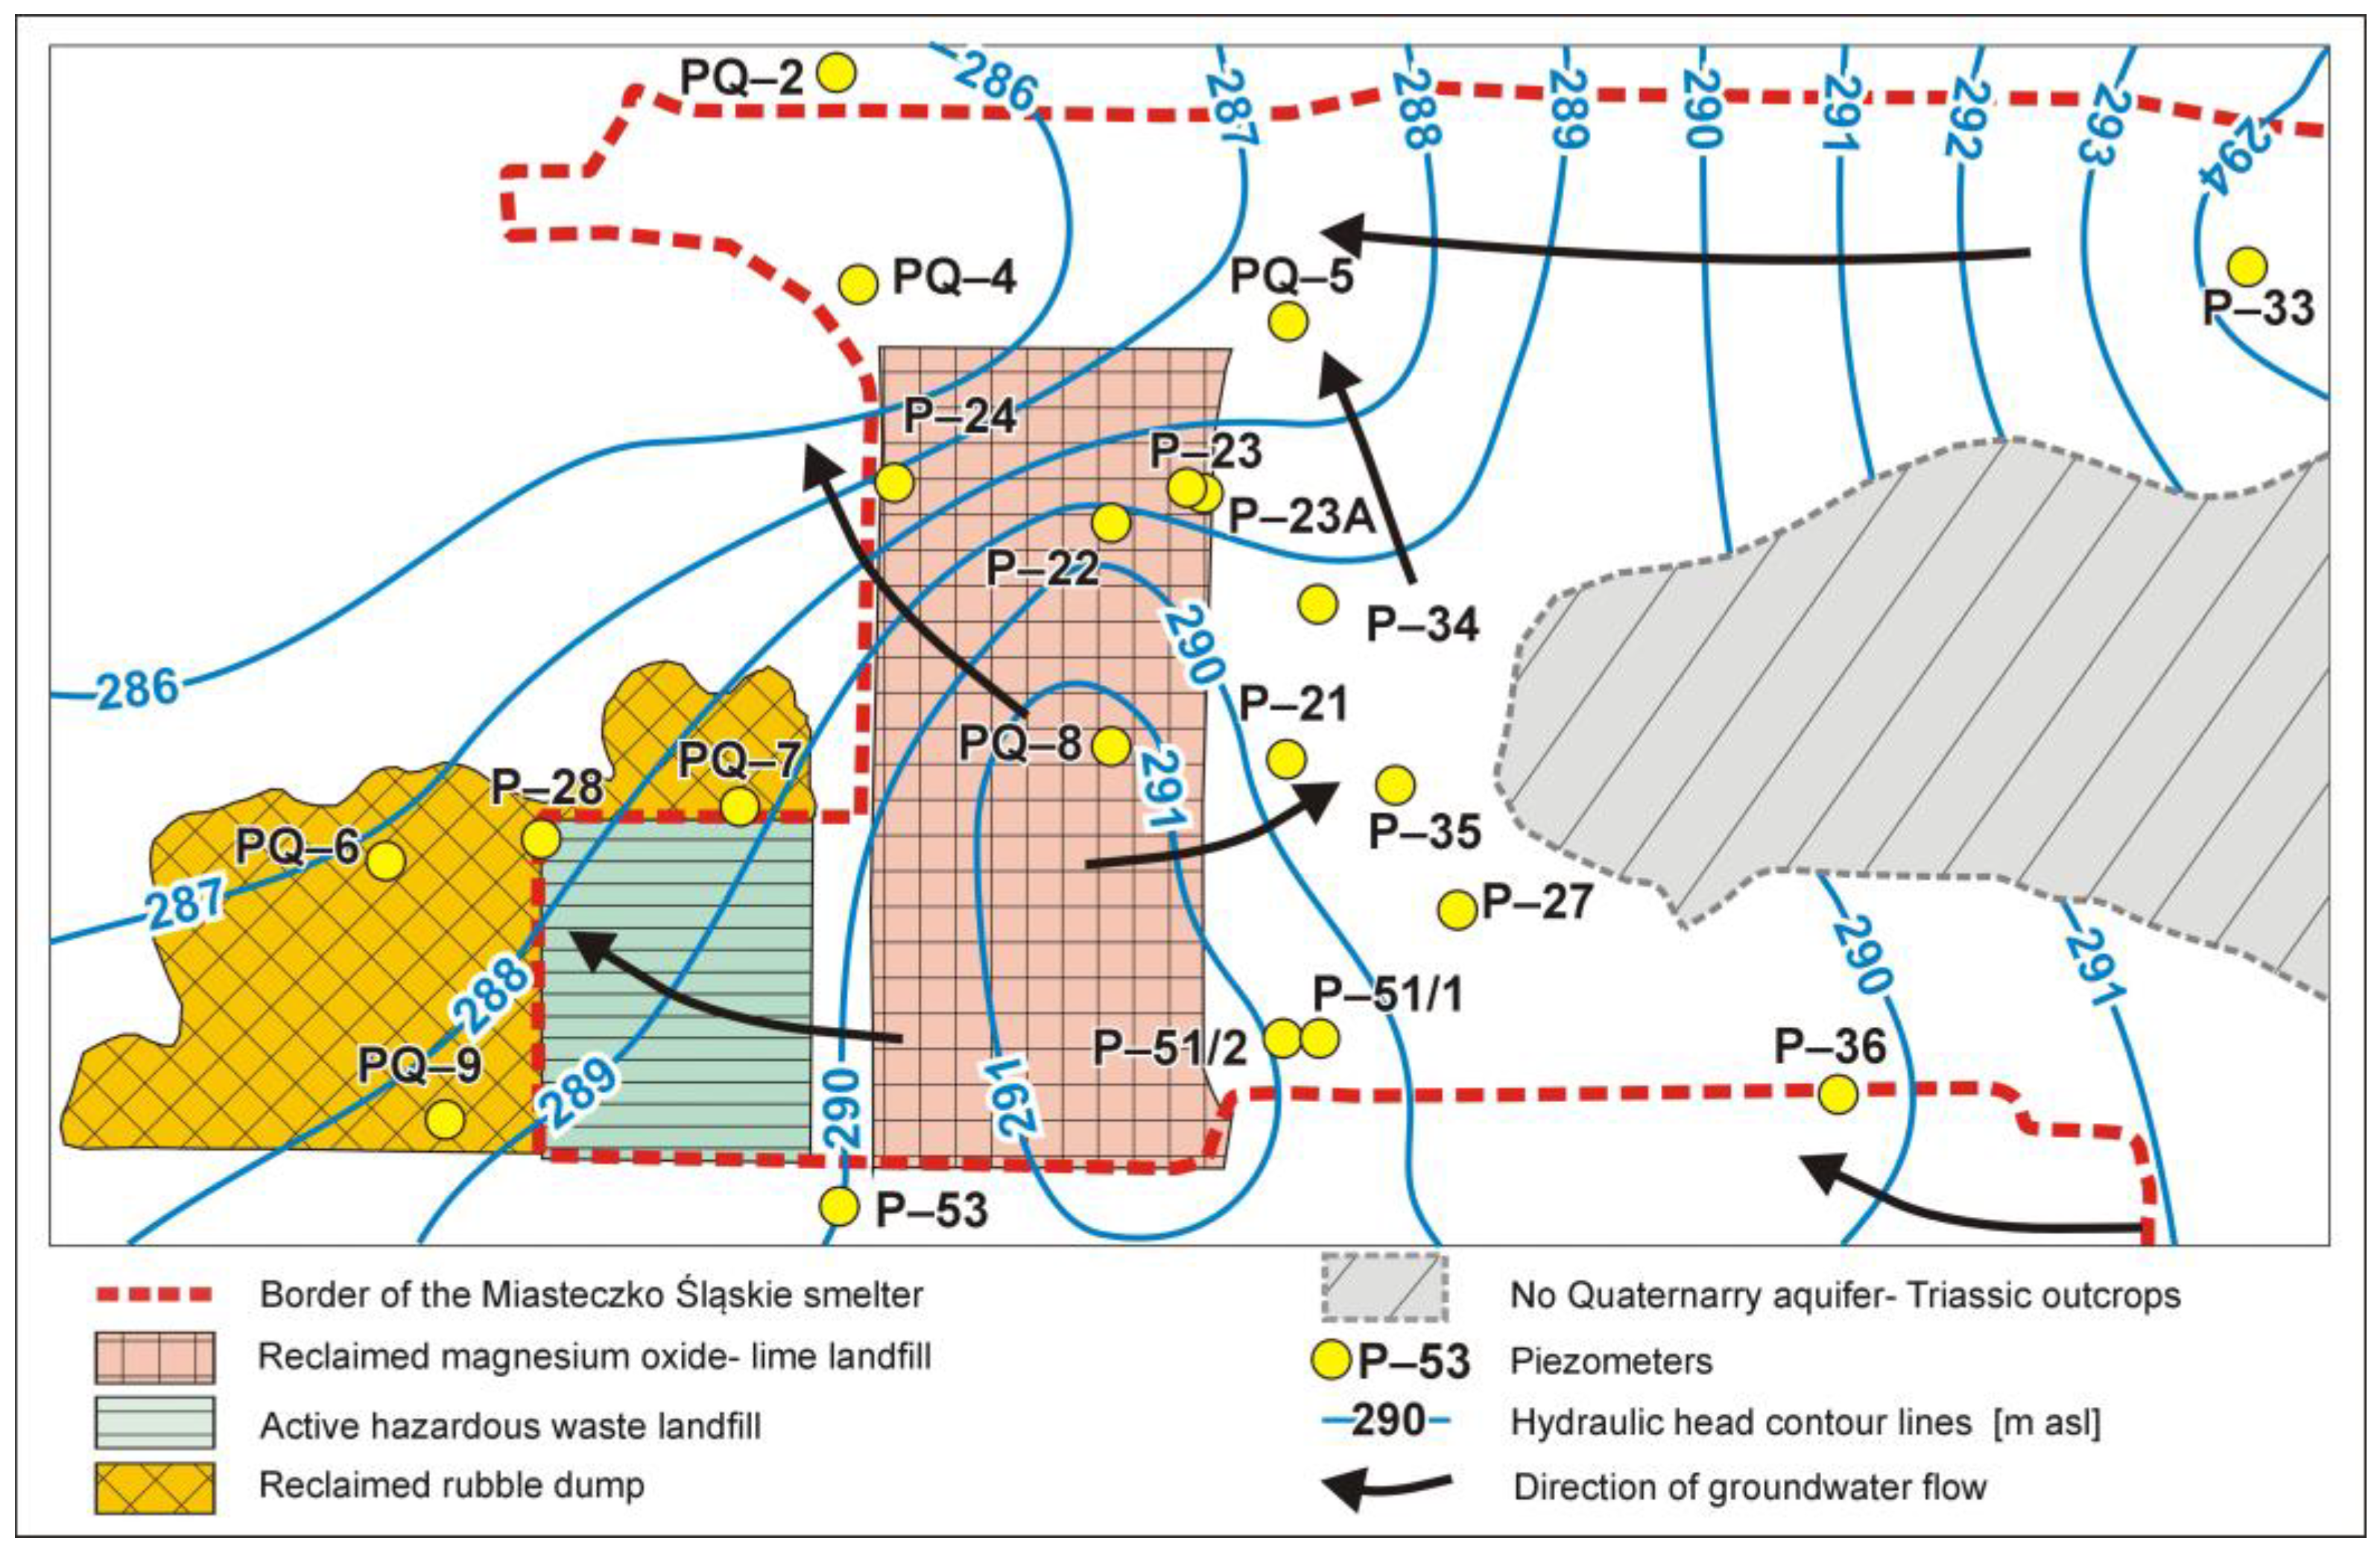
The Quaternary system in the analyzed study area consists of aquifers which, due to the considerable thickness of clays and their variable distribution, are interrupted and occur at a depth of 1.5 to 12 m. The water table is usually unconfined and is only locally confined. Drainage of the groundwater from the Quaternary aquifer takes place through drainage ditches and local streams. The water flow is generally towards the west (from P-33 to PQ-4 (
Figure 2)). Locally, from the watershed zone located in the area of the reclaimed magnesium oxide lime landfill, groundwater flows in different directions (east, west, and north). An important role in the hydrodynamic system is played by the clearly visible drainage zone running from the P-36 piezometer through the area of piezometers P-35, P-34, PQ-5, and PQ-4 (
Figure 2). In the central-eastern part of the area, the Quaternary aquifer does not exist due to the outcrops of the Triassic deposits (
Figure 2).
The local groundwater quality monitoring network has consisted of 36 observation points (22 piezometers for the observation of the Quaternary aquifer and 13 piezometers and one exploitation well for the Triassic aquifer). These piezometers were created at different times over several projects. The first network was created in 1993–1994. Until now, this network was subjected to many changes that were connected with the liquidation of piezometers. A few new piezometers were drilled, and some of them were damaged and removed from the network.
The current active observation network for the groundwater quality of the Quaternary aquifer includes the 11 mentioned piezometers PQ-4, PQ-5, PQ-7, PQ-9, P-23A, P-28, P -33, P-35, P-36, P-51/2, and P-53 with a depth of up to 12 m (P-23A). The Triassic aquifer is monitored by 6 piezometers (the main aquifer of the Triassic carbonate series—5 piezometers: PT-5, PT-6, P-40, P-41, and P-48; and Triassic Gogolin beds—1 piezometer: P-44). The depth of these piezometers is up to 64 m (P-40).
The purpose of such a monitoring network is:
- -
Observation of the first—the Quaternary aquifer, which is not exploited in this area but is important from the potential migration of pollutant to the Triassic bedrock;
- -
Observation of contamination of the first local aquifer in the Triassic Gogolin beds;
- -
Observation of changes in the chemistry and water quality of the main aquifer of the Triassic carbonate series.
2.2. Methodology
The following parameters were used in the analysis: Pb, Cd, Ni, Cu, Fe, Mn, and Zn. In total, information from 21 observation points was used, from which data from the analyzed years of the observation network operation were obtained. Monitoring studies were conducted in a way that allowed us to obtain reliable and representative results. Groundwater samples were collected using a submersible pump after pumping out 3 volumes of the stagnant water column in the borehole. During pumping, continuous control of the depth of the position of the dynamic water table in the boreholes was carried out. Efforts were made to obtain steady-state conditions, i.e., stabilization of the groundwater table with a constant flow of pumped water. Before starting the field markings and collecting water samples for laboratory tests, stability control of the hydrochemical parameters was carried out, which included measurements of the electrolytic conductivity, pH, and temperature of water flowing through the measuring vessel until subsequent measurements at 5 min intervals did not show significant differences. All physicochemical analyses were performed in an accredited laboratory. For each year, the average value from measurements conducted in March, June, September, and November was taken into account.
The environmental risk assessment (ERA) methodology was used to evaluate the environmental risks associated with the chosen metals in the groundwater in the vicinity of the zinc smelter in Miasteczko Śląskie. Data for piezometers monitoring the Quaternary aquifer from 2000 to 2022 were used in the article. These were data obtained from reports on monitoring the quality of groundwater in the smelter area. The years 2000, 2011, and 2022 were selected from this period. The selected years for this assessment was based on the following rationale:
- -
2000 was the year that the total monitoring system started;
- -
2011—10 years of full-functioning monitoring for this facility;
- -
2022 was the last year for which year-round research is available.
The research took into account the data from all existing piezometers located in the observation network around the zinc smelter in a given year. Three indices were calculated under the ERA, i.e., the landfill water pollution index (LWPI) [
23,
24,
27,
28,
29], the heavy metal pollution index (HPI) [
25,
30,
31] and the metal index (MI) [
26,
32]. The choice of these three indices was dictated by the fact that they use any range of parameters for analysis, the possibility of application for monitoring data, and the assumption of application for metals, which is important in the case of assessing the quality of water in the smelter area.
The first index was specially prepared for assessing the influence of landfills on groundwater quality. The landfill water pollution index is calculated on the basis of the general formula:
where:
The Si value is calculated as the quotient of the concentration of the i-th parameter in each of the polluted groundwater samples and the concentration of the i-th parameter in the inflow groundwater sample (the background value).
This index assigns weights to individual parameters. Determining the weights is quite important because it significantly affects the value of the final indicator. Individual parameters were assigned weights based on data from [
28]. In the analysis, considering only the metal, a weight of 3 was assigned to each of the components.
The value of the index was interpreted as is given in
Table 1.
The second measure, called the heavy metal pollution index (HPI), is an index that calculates the overall contamination of heavy metals in water resources. It is a measure that aims to assess the combined impact of individual heavy metals on overall water quality. The rating ranges from zero to one and reflects the relative importance of individual quality parameters, and it is inversely proportional to the recommended standard (B
i) for each parameter. The formula uses acceptable values for a given parameter, ideal values for a given parameter in groundwater, and measured values [
33]. The general formula for this index is as follows:
where:
Bi is the background value of the i-th parameter;
Qi is the sub-index of the (i-th) parameter, which is calculated from Formula (3):
Mi is the concentration of an individual heavy metal;
Ii is the ideal value of the particular metal (the limit value of the first quality class—good water quality without any negative human impact);
Si is the standard permissible limit of the particular metal (the limit value of the third quality class, i.e., for good water chemical status).
The value of this index was interpreted as is given in
Table 2.
Values for the first and third quality classes were used on the basis of the Regulation of the Minister of Maritime Economy and Inland Navigation of 11 October 2019 on the criteria and method of assessing the status of groundwater bodies (Journal of Laws of 2019, item 2148). It should be mentioned that according to this, classification groundwater of the first (very good quality water), second (good quality water), and third (satisfactory water quality) classes have a good chemical status. However, groundwater classified as class four (water of unsatisfactory quality) and five (water of poor quality) are waters with poor chemical status.
The limit values for the first and third quality classes are given in
Table 3.
The last of the indicators described is the metal index [
26]. This formula determines the ratio of the measured value of a given parameter to its maximum allowable value. In this case, the maximum permissible value was replaced with maximum values for class three water quality. This index is calculated from the formula:
where:
The total values were divided into six classes, indicating groundwater pollution. The list is in
Table 4.
When determining the impact of a facility on the quality of drinking water, the limit (permissible) values should be changed to other values taken from the relevant regulations. In the case of the MI index and very narrow ranges of index values for individual quality classes, in addition to the water classification, the assessment should also be verified based on hydrogeological knowledge.
3. Results and Discussion
The depth of the water table in 2022 ranged from 1.24 m below ground level (P-33) to 5.8 m below ground level (P-28) [
36]. The water table is deepest in the points located in the northern part of the rubble dump—piezometers P-28, PQ-5, and PQ-6, as well as piezometer P-36 located in the southern part of the zinc smelter, piezometer P-22 located on the reclaimed magnesium oxide lime landfill, and piezometer P-23A located in its eastern part.
The waters of the Quaternary aquifer show anthropogenic transformations. The mineralization of these waters in 2022, measured by the sum of dissolved substances (TDS), varies and ranges from 238 mg/L in P-33 to 2904 mg/L in PQ-5 [
36]. Taking into account the reaction of these waters, it is concluded that they range from weakly acidic (pH from 5.7 (P-51/2)) to alkaline (pH of up to 10.9 (PQ-9)).
Many piezometers show elevated COD values of the tested groundwater. The highest COD values were recorded in P-35 up to 358 mg O2/L. The lowest COD values (17 mg O2/dm3) were recorded periodically in P-28. The analyzed waters contain high concentrations of both main ions, e.g., sulphates reaching 1660 mg/L in PQ-5, chlorides reaching up to 262 mg/L in P-23A, calcium reaching up to 510 mg/L in PQ-5, sodium reaching up to 398 mg/L in P-35, and magnesium reaching up to 220 mg/L in PQ-5; minor components, e.g., potassium reaching up to 17.2 mg/L in P-28, ammonium ions reaching up to 22 mg/L in P-35, nitrates reaching up to 3.8 mg/L in PQ-5, iron reaching up to 110 mg/L in PQ-7; and micro elements such as zinc reaching up to 11 mg/L in PQ-4, cadmium reaching up to 0.27 mg/L in P-35, lead reaching up to 84 mg/L in P-35, nickel reaching up to 0.14 mg/L in PQ-7, copper reaching up to 0.47 mg/L in PQ-7, iron reaching up to 110 mg/L in PQ-7, and manganese reaching up to 8.3 mg/L in P-35.
Taking into account the modified chemical classification of groundwater according to Shchukarev–Priklonskiy [
37] for the averaged data from 2022 [
36], it can be concluded that out of 11 analyzed observation points (PQ-4, PQ-5, PQ-7, PQ-9, P-23A, P-28, P-33, P-35, P-36, P-51/2, P-53), 9 different types of water were found. These waters ranged from triionic (e.g., HCO
3-SO
4-Ca in P-33 and SO
4-HCO
3-Na in P-35) to complex pentaionic (SO
4-HCO
3-Ca-Na-Fe in P-28 and HCO
3-SO
4- Cl-Ca-Fe in P-36). Tetraionic waters dominated in seven piezometers; the remaining four piezometers there were triionic waters (in P-33 and P-35) and the aforementioned pentaionic waters (in P-28 and P-36). It should be added that natural anthropogenically unaltered groundwater in the Quaternary aquifer in this area should be the HCO
3-Ca type.
Under the EU Water Framework Directive, the water in all piezometers was assigned to poor chemical status. Exceeded concentrations were observed primarily for cadmium, calcium, zinc and sulfate, lead, iron, sodium, and phosphates.
The tested waters were also checked for suitability for human consumption. Data from 2022 were referred to the Regulation of the Minister of Health of 7 December 2017 (Journal of Laws of 2017, item 2294). In the study area, groundwater from Quaternary formations at all 11 study sites did not meet the requirements for drinking water. In the tested waters, the highest permissible values for drinking water were exceeded from four indicators in P-36 (Fe, Mn, Ni and COD) to eight indicators in PQ-4 (COD, NH4, SO4, Mn, Mg, Cd, Ni, total general) and in PQ-7 (pH, COD, Mn, Fe, Pb, Ni, total hardness, and NH4) and up to 10 indicators in P-35 (COD, SO4, NH4, Na, Fe, Mn, As, Ni, Pb, and Cd).
As already mentioned, the calculations of the three indices (LWPI, HPI, and MI) were performed based on the results of the determinations of Pb, Cd, Ni, Cu, Fe, Mn, and Zn for the years 2000, 2011, and 2022. The results are summarized in
Table 5. Spatial distribution within the analyzed area are presented on schematic maps (
Figure 3,
Figure 4 and
Figure 5).
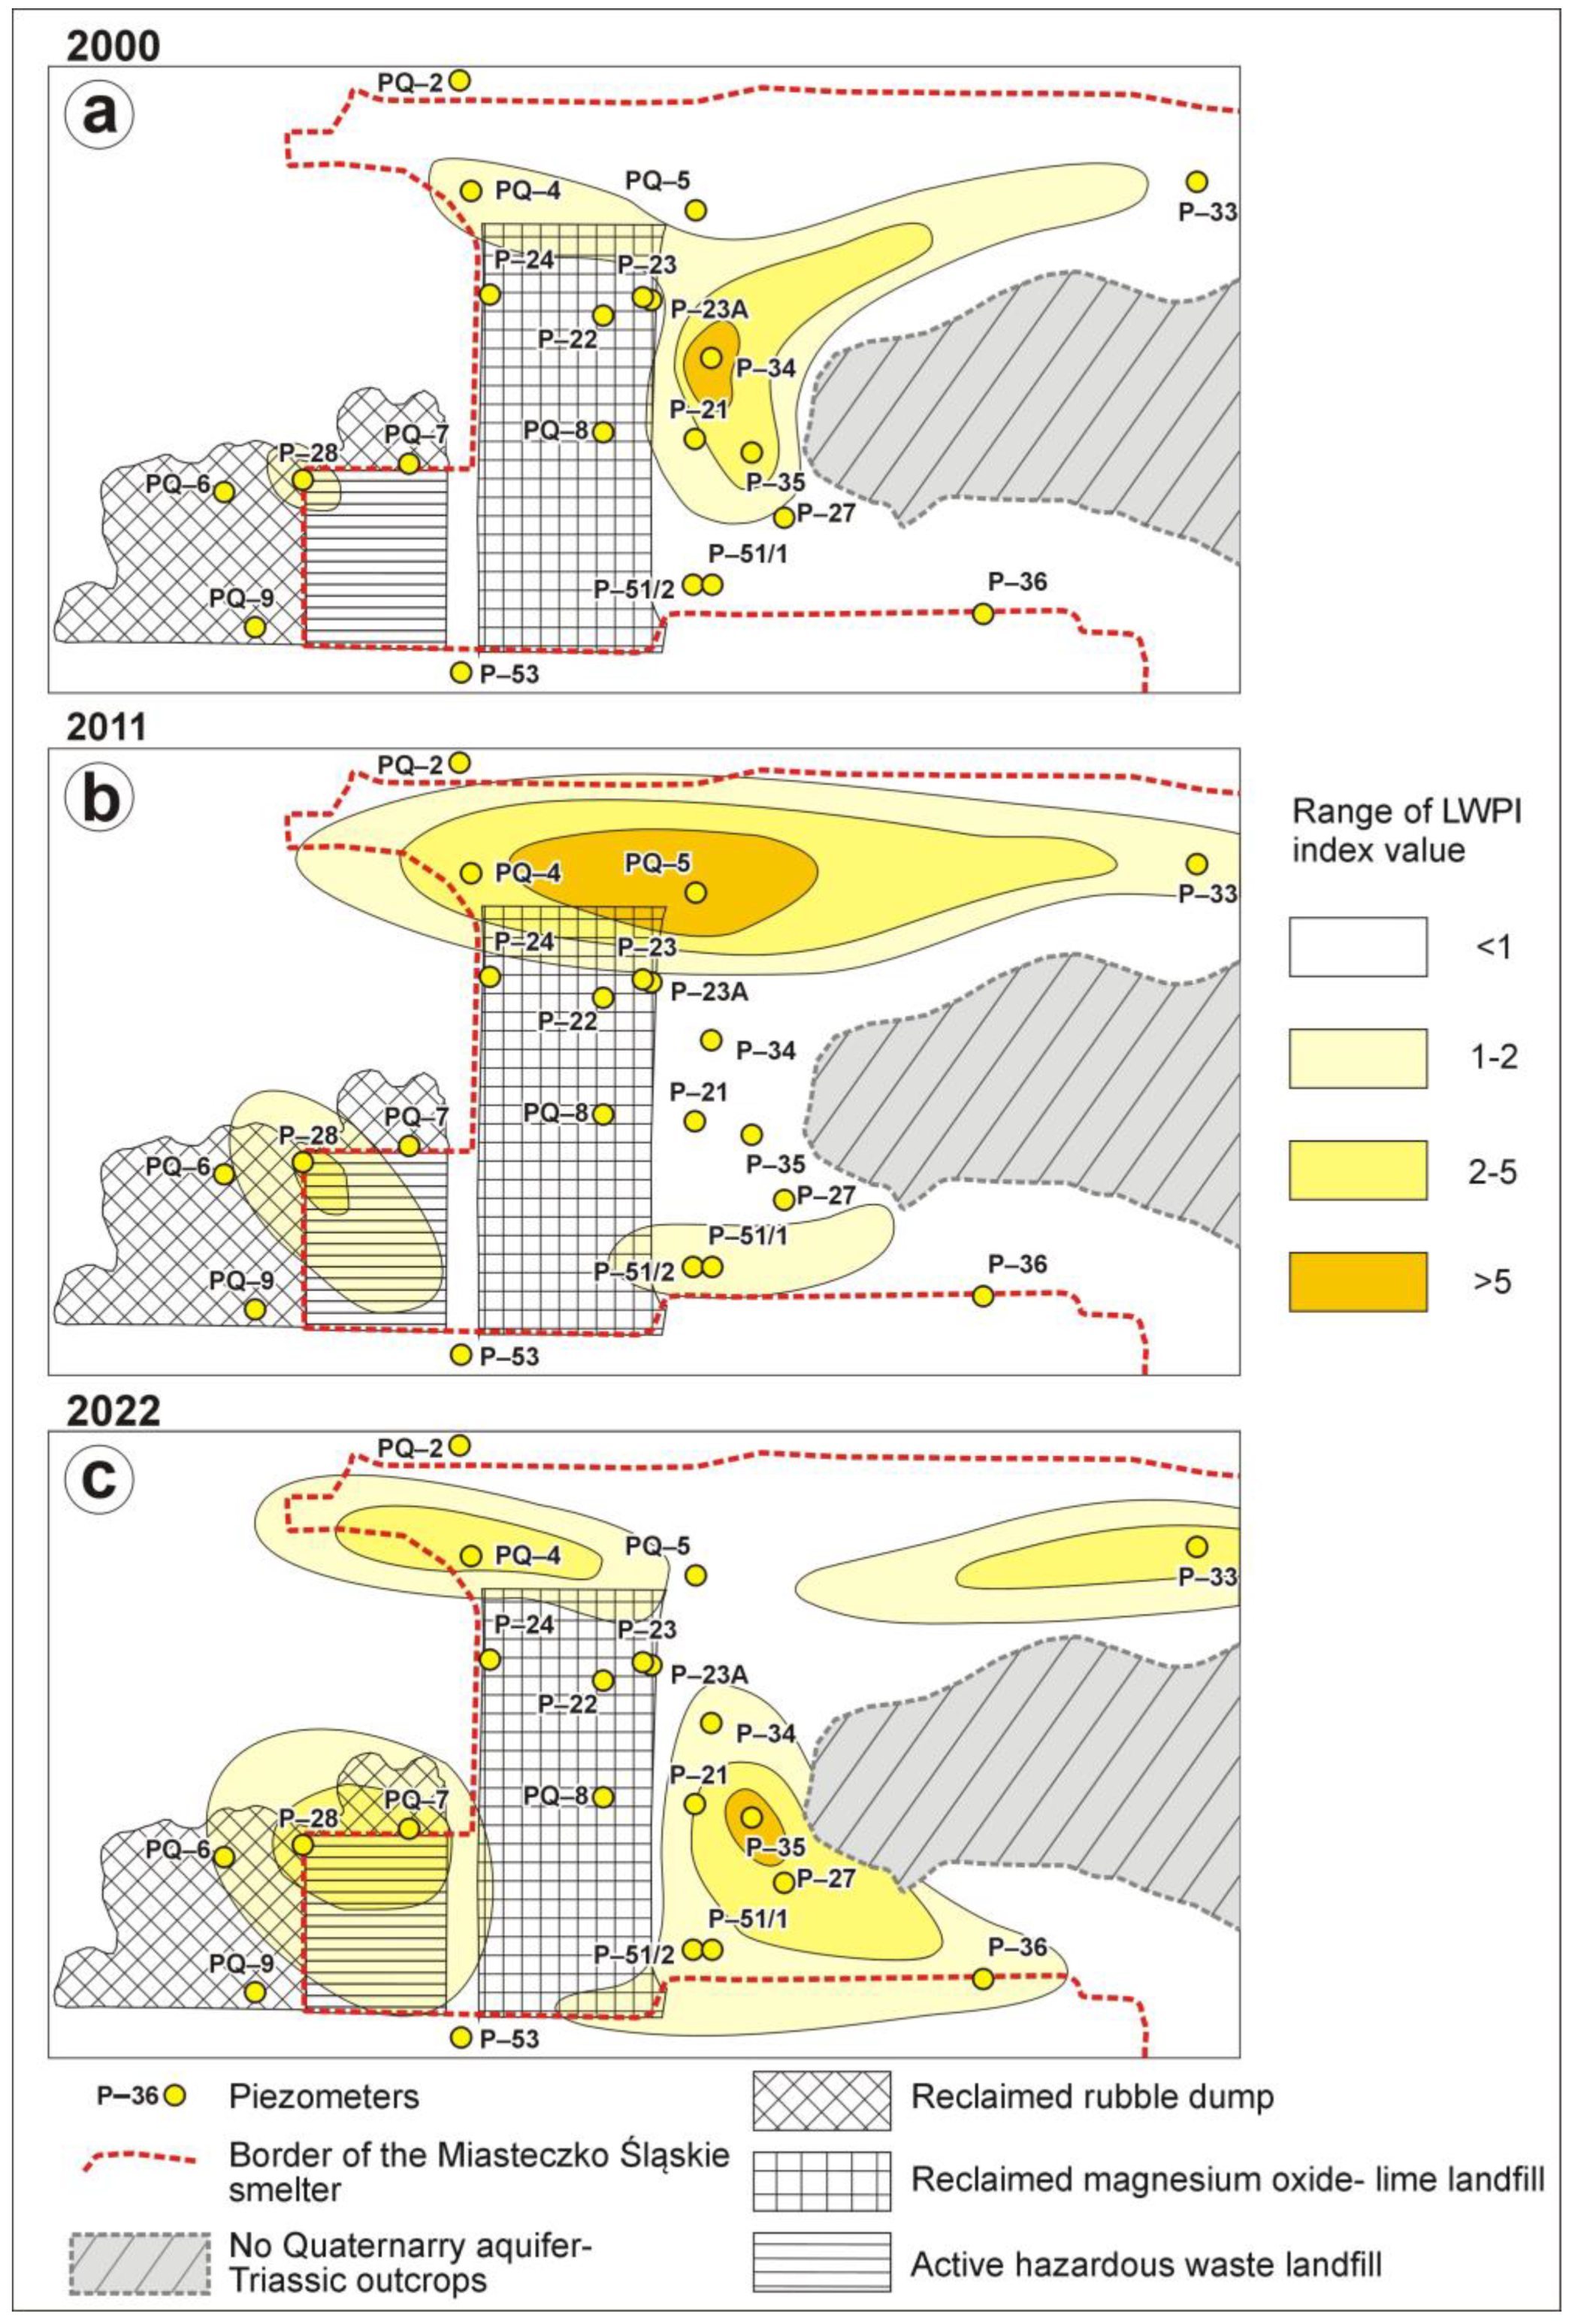
The values of the LWPI in 2000 ranged from 0.12 (PQ-8) to 16.62 (P-34). In most piezometers, the LWPI index did not exceed the value of two and even a value of one (11 piezometers). Increased values were also observed in the case of piezometers P-35 (week polluted) and P-27 (moderately polluted) (
Figure 3a). All piezometers showing elevated LWPI values are located east of the reclaimed magnesium oxide lime landfill in the central part of the zinc smelter area. In 2000, the tested waters are therefore mostly relatively clean and are locally moderately polluted due to low landfill impact when taking into account the LWPI index. Only in the case of piezometer P-34 should the water be classified as heavily polluted water (
Figure 3a).
High concentrations of cadmium and, to a lesser extent, zinc are responsible for the high value of the LWPI in the P-34 piezometer in 2000. In the case of cadmium, in single observations, concentrations were even 170 times higher than the limit values for class three water quality. Zinc concentrations were up to four times higher than the assumed background.
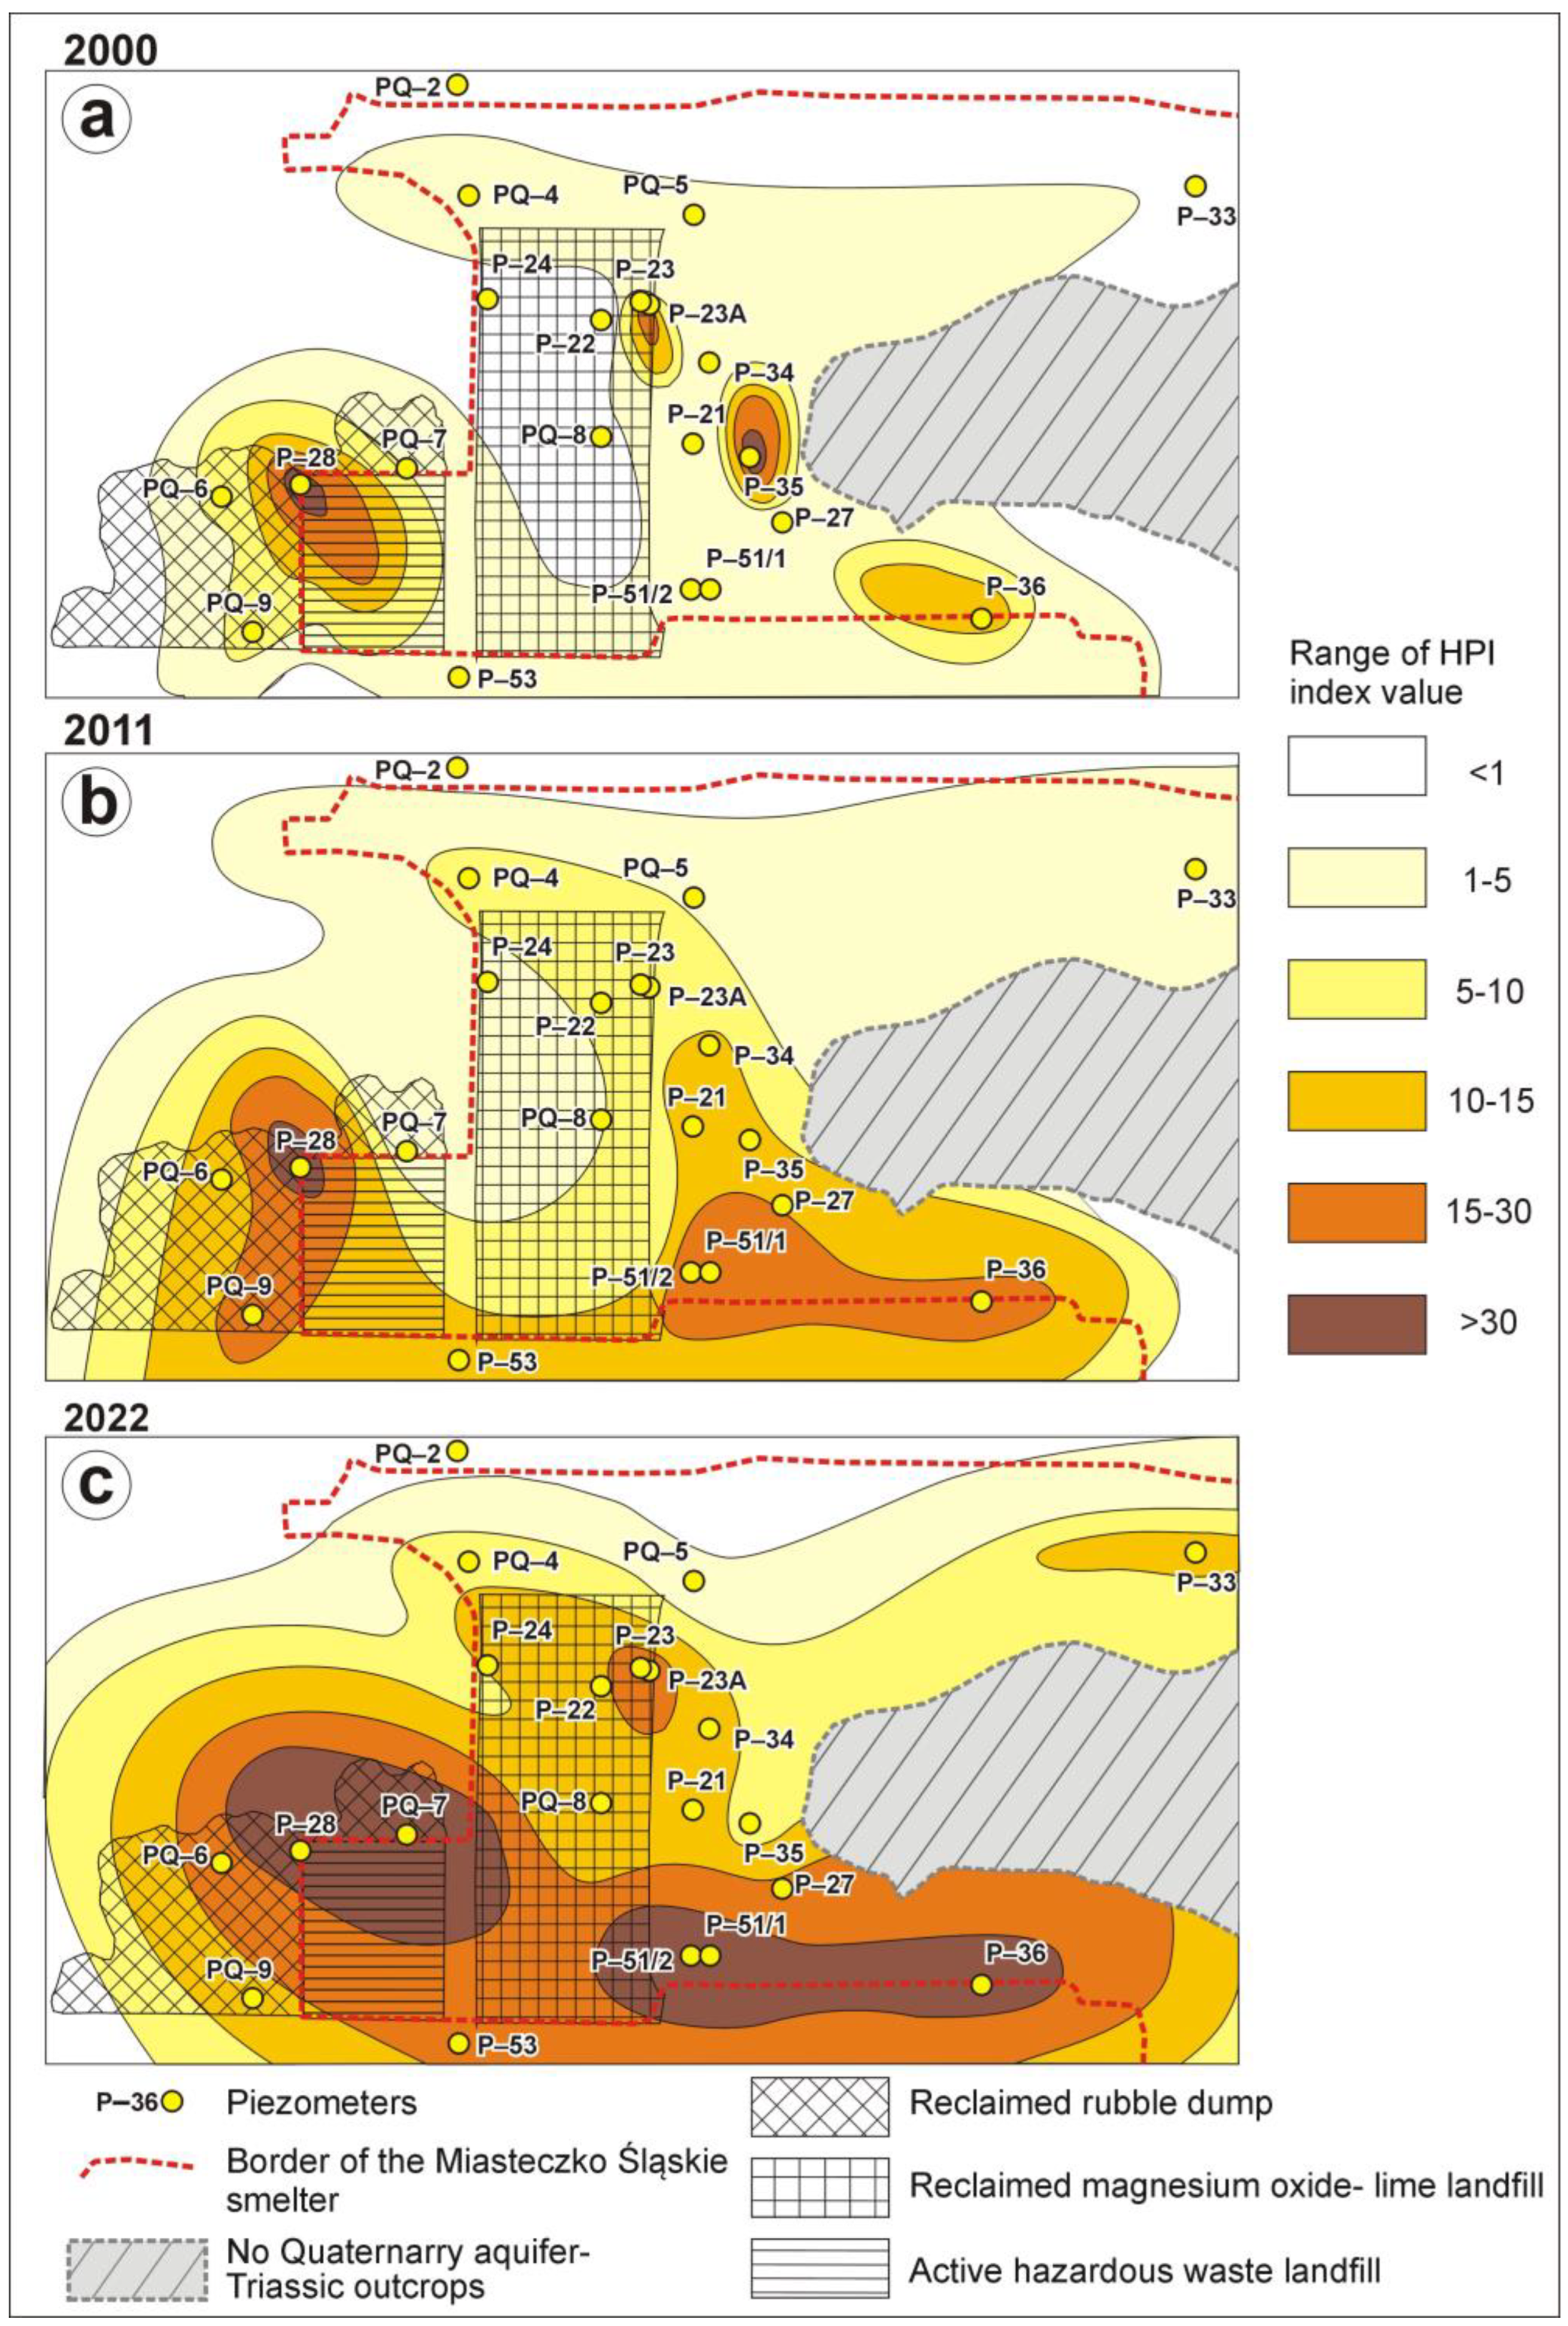
The HPI values ranged from −0.11 (PQ-8) to 39.93 (P-28). In the case of waters in piezometer P-28, a high indicator value is indicated by a high concentration of iron. About 60% of the total value of this indicator is influenced by exceeding the standards for iron. Based on this indicator, water in piezometers P-28 and P-35 was classified as water with a high degree of pollution. Only in one case (piezometer P-23A) can the water be classified as a polluted medium. In all other cases, the water should be classified as having low pollution. In this case, piezometers showing elevated HPI values were located in the eastern part of the reclaimed building rubble dump (P-23A, P-35) and also in the NW part of the active landfill (P-28) (
Figure 4a).
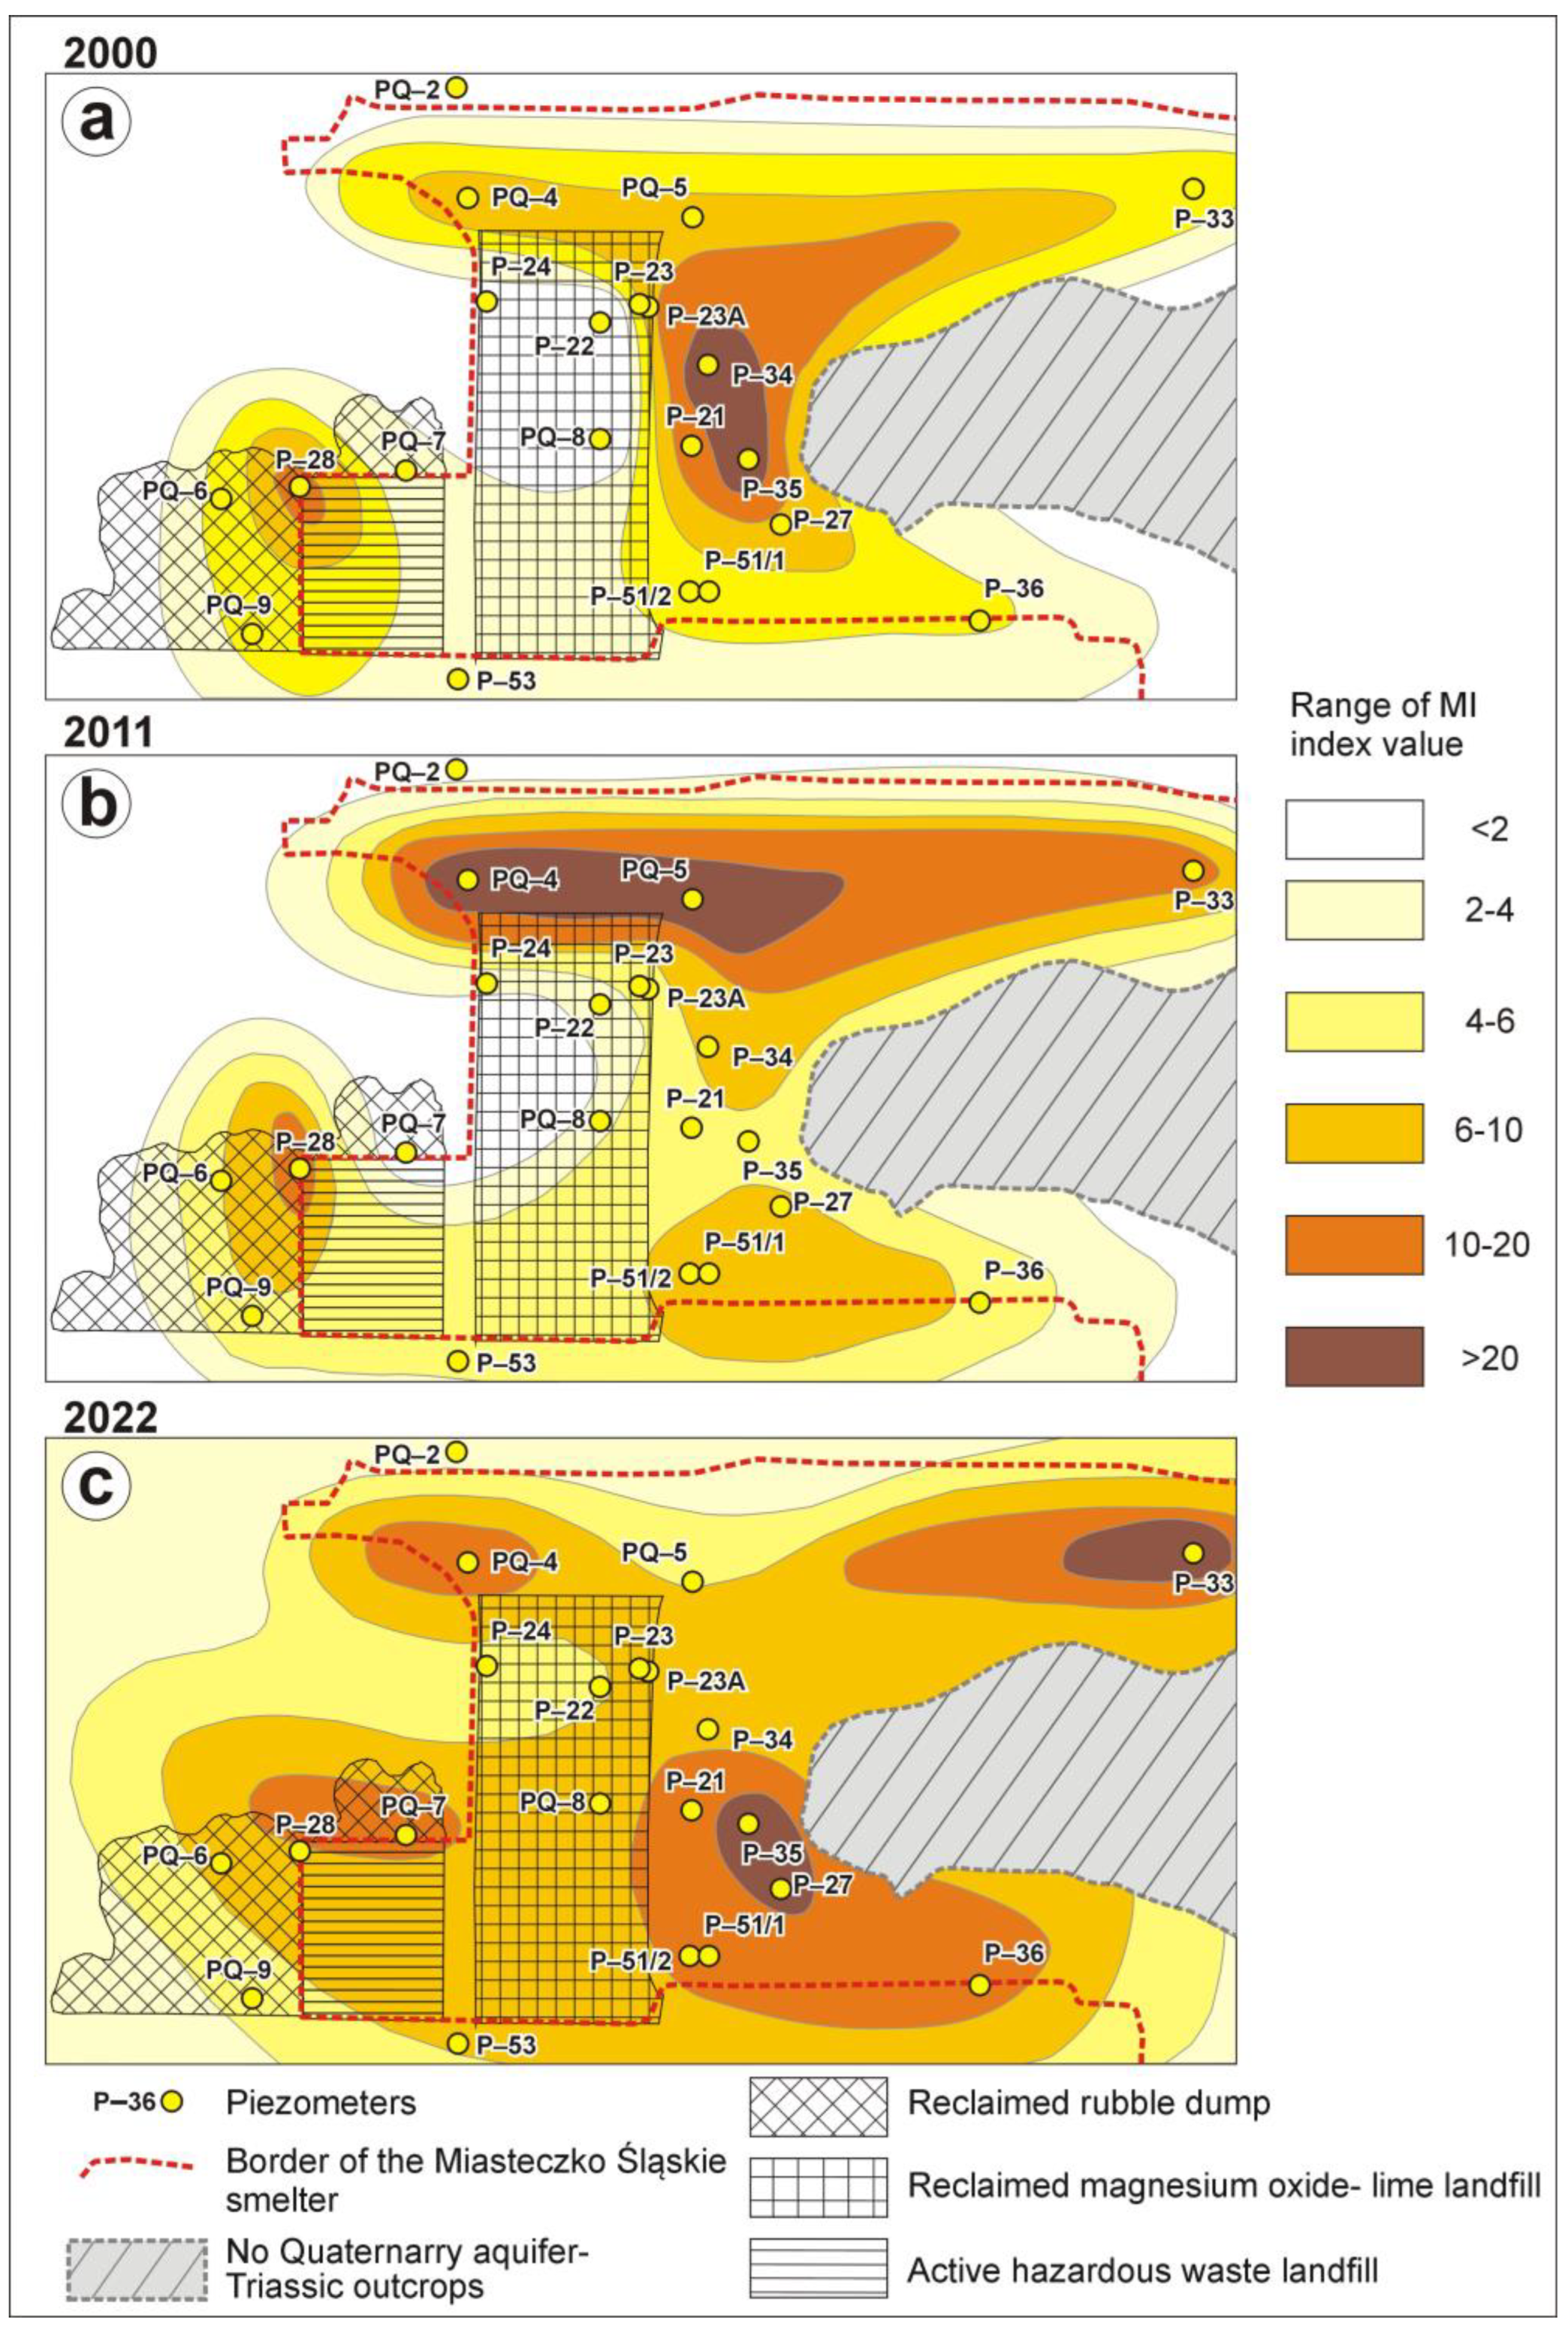
The MI ranged from 1.92 (P-22) to 132.95 (P-34). Here, as in the case of the LWPI with a high index value, the content of cadmium confirmed this. The calculated values of the indicator suggest that seriously affected groundwater (MI > 6) was noticed in the majority of tested piezometers (nine piezometers: PQ-4, PQ-5, P-21, P-23, P-23A, P-27, P-28, P-34, and P-35). Least polluted waters considered as strongly affected (MI 4–6) were identified in five piezometers (PQ-6, PQ-9, P-33, P-36, and P-51/1). For this index, very pure water cannot be identified. Only in single cases of pure groundwater (in PQ-8) were slightly (in P-22) and moderately affected (in PQ-7) identified. Taking into account the spatial variability of the value of this index, it should be concluded that seriously affected groundwater was noticed east of the reclaimed building rubble dump in the central part of the zinc smelter area and also north in the NW part of the active landfill (
Figure 5a), similarly to the previously considered indices (
Figure 3a and
Figure 4a).
In the next analyzed year, based on a smaller number of observation points, the obtained index values were definitely higher (
Table 5,
Figure 3b). The LWPI value ranged from 0.15 (PQ-2—north-west of the zinc smelter area) to 10.92 (PQ-5—north-east of the reclaimed magnesium oxide lime landfill) (
Figure 3b). A very high concentration of cadmium is responsible for the highest values of the indicator. In the waters of the PQ5 piezometer, the cadmium content was even 300 times higher than the standard for class three quality. In 2011, we can distinguish waters in terms of those in which the impact of the landfill was not observed (most of them: e.g., PQ-2, PQ-7, P-33, and P-36) and those that are heavily polluted (north of the reclaimed building rubble dump—PQ-5) (
Figure 3b).
HPI values in 2011 ranged from −0.17 (PQ-2—north-west of the zinc smelter area) to 55.26 (P-28—west of active landfill). A negative value of the indicator suggests that in some cases the concentrations of components in water may be lower than the background limit. The high iron values caused the HPI values in the P-28 piezometer to be around 50 all year round and accounted for more than 70% of the total value of the index. The HPI values in this research period also suggest that we are dealing with the entire cross-section of pollution. Increased index values (HPI 15–30) indicating medium polluted groundwater were also found in piezometers located in the southern part of the smelter area (P-51/1, P-51/2, and P-36) and west of the active landfill (P-9) (
Figure 4b). Most piezometers represent the so-called low polluted water (HPI < 15). Nevertheless, in this range, the HPI ranges from 0.74 (in PQ-7) to 12.69 (in P-35), which suggests a different degree of contamination.
In the case of the third index (MI), the values reached 87.34 (PQ-5—north-east of the reclaimed magnesium oxide lime landfill) (
Figure 5b). Such values are evidenced by high concentrations of zinc. The zinc content in the total value of the index was more than 100 times higher in comparison with other parameters. Taking into account the MI index, it should be stated that in most of the analyzed area, strongly (MI 4–6) and seriously affected (MI > 6) waters were recorded (
Figure 5b). The most polluted waters were found north of the reclaimed magnesium oxide lime landfill (PQ-4 and PQ-5) and north-west of active landfill (P-28).
The last of the analyzed periods was the year 2022. The values of the LWPI index ranged from 0.51 (PQ-9) to 6.57 (P-35). High concentrations of iron persist in the waters of this piezometer. They are the cause of the increased index values. In the remaining piezometers, the index values varied from 0.69 in PQ-5 to 3.68 in PQ-4. Of the 11 piezometers analyzed, visible landfill impact (LWPI 2–5) was found in 4 of them (PQ-4, PQ-7, P-28, and P-33). Water that, according to this index, can be considered water without landfill impact (LWPI < 1) was also identified in four piezometers (PQ-5, PQ-9, P-23A, and P-53), (
Figure 3c). In two piezometers (P-36 and P-51/2), the indicator values indicate moderately polluted waters (LWPI 1–2). This suggests that the tested waters are characterized by varying degrees of pollution, but most of them represent visible landfill impact (
Figure 3c).
Higher values were recorded for the HPI index this year (
Figure 4c). The lowest value was calculated for the piezometer PQ-5 (1.08), and the highest was equal to 65.35 for piezometer PQ-7. High values of this indicator are achieved due to the iron content. A high degree of groundwater pollution (HPI > 30) was found in four piezometers (PQ-7, P-28, P-36, and P-51/2). Medium pollution (HPI 15–30) was noticed in two piezometers (P-23A and P-53). The remaining five piezometers represented low polluted water (HPI < 15). And in this case, it should be added that the HPI ranged from 0.74 (in PQ-5) to 14.98 (in PQ-9), which suggests a different degree of contamination.
MI values ranged from 4.10 (PQ-9) to 53.25 (P-35) this year. This suggests that the waters in this area are strongly or seriously affected. Taking into account the MI index, it should be stated that seriously affected waters (MI > 6 in nine piezometers) were recorded in most of the analyzed area. Strongly affected water (MI 4–6) was noticed only in two piezometers (PQ-5 and PQ-9) (
Figure 5c). It is worth mentioning that the range of the MI in this case was also very diverse and ranged from 6.26 (P-53) and 6.85 (P-23A) to 53.25 (P-35) and 29.46 (PQ-4). The most polluted waters were found in the north-west (PQ-4) and east (P-35) of the reclaimed magnesium oxide lime landfill and also in the north-east part of the zinc smelter area (P-33). Seriously affected water was also recorded north of active landfill (PQ-7 and P-28) (
Figure 5c).
When analyzing the temporal and spatial changes of the three indices considered (LWPI, HPI, and MI), it can be noticed that in the case of LWPI in 2000, the most polluted waters occurred in the area of the P-34 piezometer and, to a lesser extent, in P-35 (
Figure 3a). In the following years, it moved towards PQ-5 (in 2011—
Figure 3b) and then further west in 2022 (to the area of the PQ-4 piezometer) (
Figure 3c). In the last analyzed year (2022), the most polluted waters were again found east of the reclaimed magnesium oxide lime landfill maximum in P-35 (
Figure 3c). In all analyzed years, a consistent increase in groundwater pollution north of the active landfill (P-28 and PQ-7) was observed (
Figure 3,
Figure 4 and
Figure 5). A practically analogous situation is presented by spatiotemporal changes in the MI (
Figure 5a–c). A slightly different situation in relation to the two previous indices can be seen in the case of the HPI (
Figure 4a–c). The pattern of values of this indicator indicates a clearly deteriorating water quality over time in the southern part of the smelter area (the area of piezometers P-36, P-51/2, and P-53) (
Figure 4a–c). The deterioration of water quality in 2022 in the southern part of the area is also indicated by the increased values of MI in piezometers P-36 and P-51/2 (
Figure 5c). As in the case of the previously analyzed indices, the HPI values indicate the deteriorating quality of water in the north of the active landfill (
Figure 4). In turn, we are dealing with a mosaic and temporally variable occurrence of more polluted groundwater in the east of the reclaimed magnesium oxide lime landfill (
Figure 4a–c).
In all analyzed cases, the least polluted water was located in the central western part of the smelter area in the watershed zone within the reach of the reclaimed magnesium oxide lime landfill (
Figure 3,
Figure 4 and
Figure 5).
The construction of the formula for individual indices causes the relationships between the values of MI to be similar to the values for LWPI. The difference lies in assigning weights to the parameters in the case of the LWPI. This is important if we want to create an ideal measure for various, often incomparable ingredients (e.g., different weights for metals, EC, and pH). This approach has been used in several studies on this index, including landfills in Poland [
24,
38]. The values of all indices are not as high as those presented in the literature. In the article [
38], the LWPI value exceeded 300. However, it should be noted that the range of parameters used is completely different, and it is difficult to compare the final water quality.
Taking into account only the values of metals in groundwater, it is difficult to assess the significance of the assigned weights. The difference can be found in the classification. In the case of the first of the indicators (LWPI), there are four classes into which water can be divided. It should be noted that waters with an LWPI value of higher than five will be classified as heavily polluted. In the analyzed material, there are indices at the level of up to about 17. Therefore, the question remains whether four classes for this indicator are sufficient.
The MI index is assigned to six classes. Thanks to this, a greater diversity in determining the impact of pollution sources on the quality of groundwater is possible. In the analyzed area, the value of this index exceeded 100. Therefore, it is difficult to compare the results in which the value for class six (6) was slightly exceeded.
The construction of the HPI index looks much less objective. In the formula, it is necessary to use two values that can be taken from archival materials or from legal conditions. Both data on water quality classes as well as data for waters intended for consumption can be taken into account here. Another way to select the background value is to determine the natural hydrochemical background for the analyzed area. Taking into account the values for the first and third class of groundwater quality (
Table 3), the obtained HPI values do not refer to the fact that the groundwater in the area of the Miasteczko Śląskie zinc smelter has a poor chemical status.
In Poland, MI and HPI indices were used in [
39]. However, the indices were calculated for the metal content in tap water from the Upper Silesia region (Poland). In the above article, HPI values ranged from 1.03 to 42.4, while MI values ranged from 0.131 to 2.99. However, these values cannot be compared with the values obtained in the groundwater from the smelter area (
Table 5).
4. Conclusions
In this study, 132 groundwater samples from 2000, 2011, and 2022 were analyzed for various physicochemical parameters to assess their quality using three chemical indices, i.e., the landfill water pollution index (LWPI), the heavy metal pollution index (HPI), and the metal index (MI). The calculations included typical metal characteristic for the zinc smelter and surrounding landfills such as Pb, Cd, Ni, Cu, Fe, Mn, and Zn. This article focused on the construction of indicators and the final value in the context of the selection of parameters, weights, and background values.
High concentrations of iron and cadmium have the greatest influence on the high values of the indicators. This is already visible in the case of the analysis of physicochemical data, but the use of index methods emphasizes the diversification of the degree of water pollution.
The calculation results of the indices used for the groundwater quality assessment presented in this article indicate the limited possibility of their application. Using data from groundwater monitoring carried out in 11 piezometers in 2022, it was found that each of them contained water with poor chemical status (class five and four). Taking into account the indicators used, only in the case of the MI index was the water in all piezometers classified as polluted water (nine piezometers seriously affected; and two piezometers strongly affected—PQ-5 and PQ-9). In the case of the LWPI, in four piezometers (PQ-5, PQ-9, P-23A, P-53), the groundwater was classified as practically unpolluted (without landfill impact), and in two piezometers (P-36, P-51/2), it was classified as moderately polluted water (low landfill impact). Only in one piezometer were the tested waters classified as heavily polluted (P-35). In the case of the HPI, a high degree of groundwater pollution was found in four piezometers (PQ-7, P-28, P-36, and P-51/2); in four piezometers (PQ-4, PQ-5, P-33, and P-35), low water pollution was found. These results indicate that the values of the calculated MI indices are closest to the actual water quality status.
Subsequently, the variability of metal content in the Triassic aquifer should be analyzed in order to determine the degree of contamination of these waters and possible analogies between the obtained values of these indices.


