
Spatial and Temporal Variability Characteristics and Driving Factors of Extreme Precipitation in the Wei River Basin

Abstract
1. Introduction
2. Data and Methods
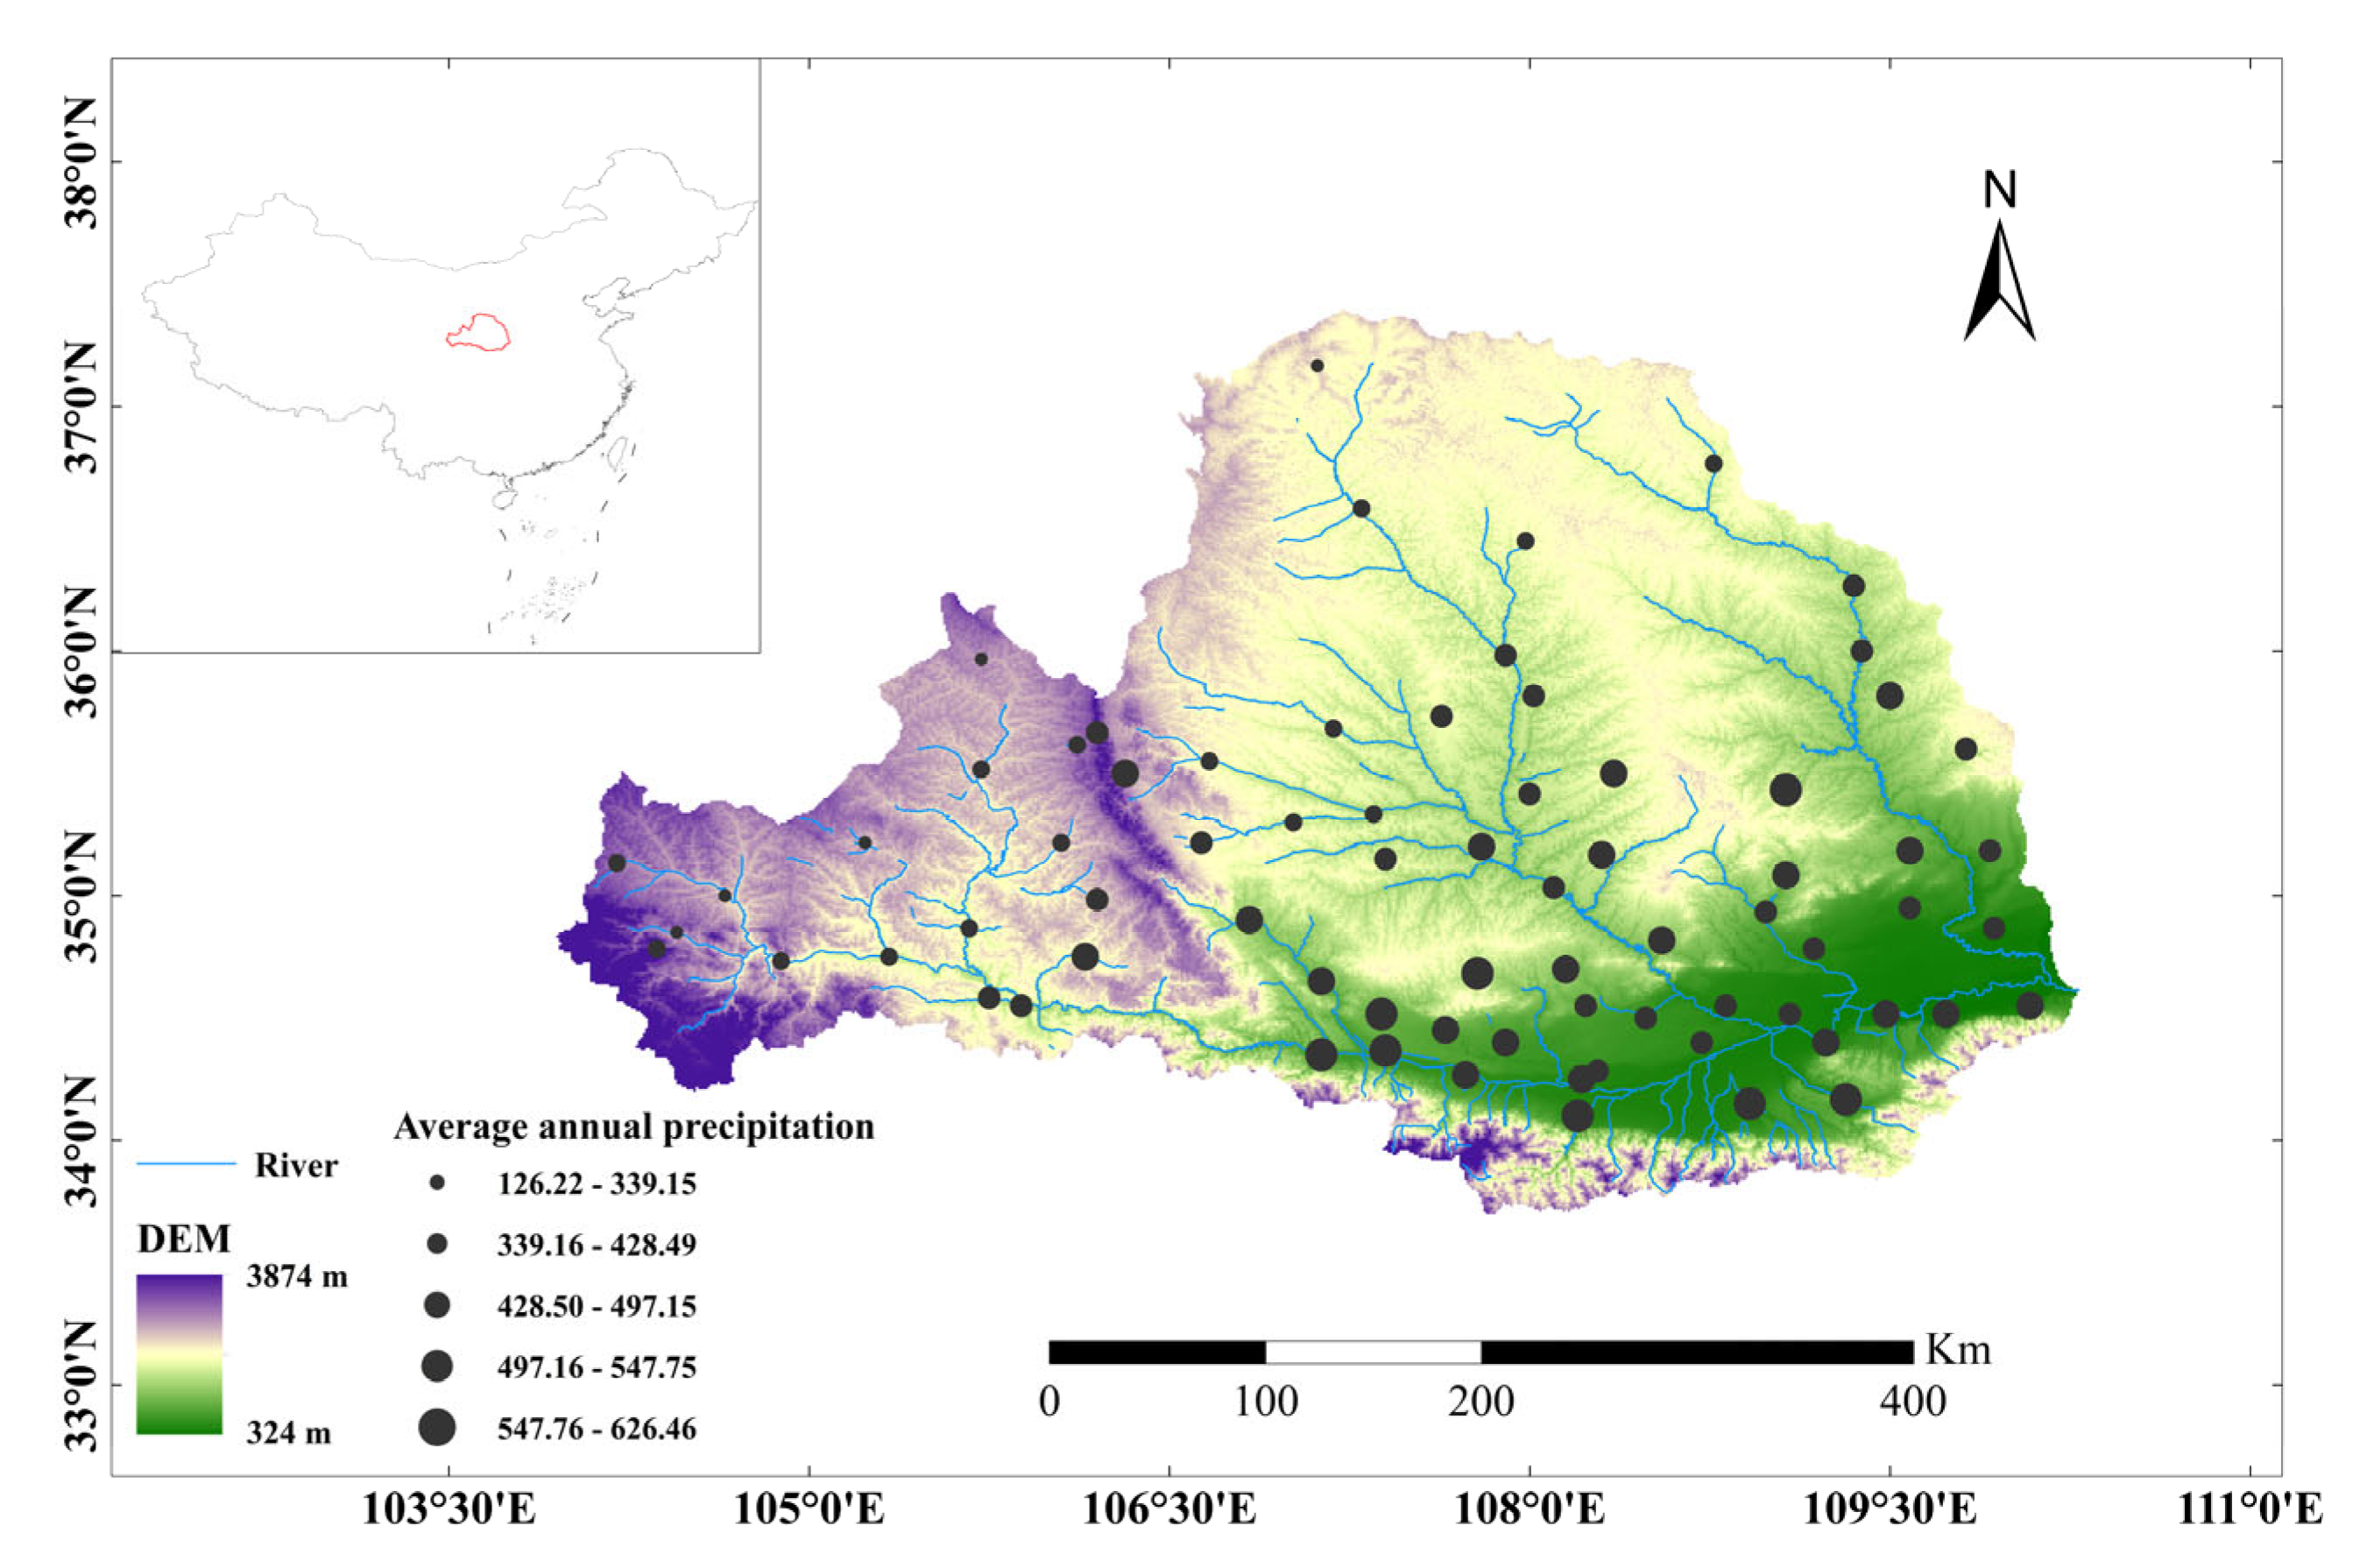
2.1. Study Area Description
2.2. Data Sources
2.2.1. Observed Precipitation Data
2.2.2. Climate Change Index Data
2.3. Methods
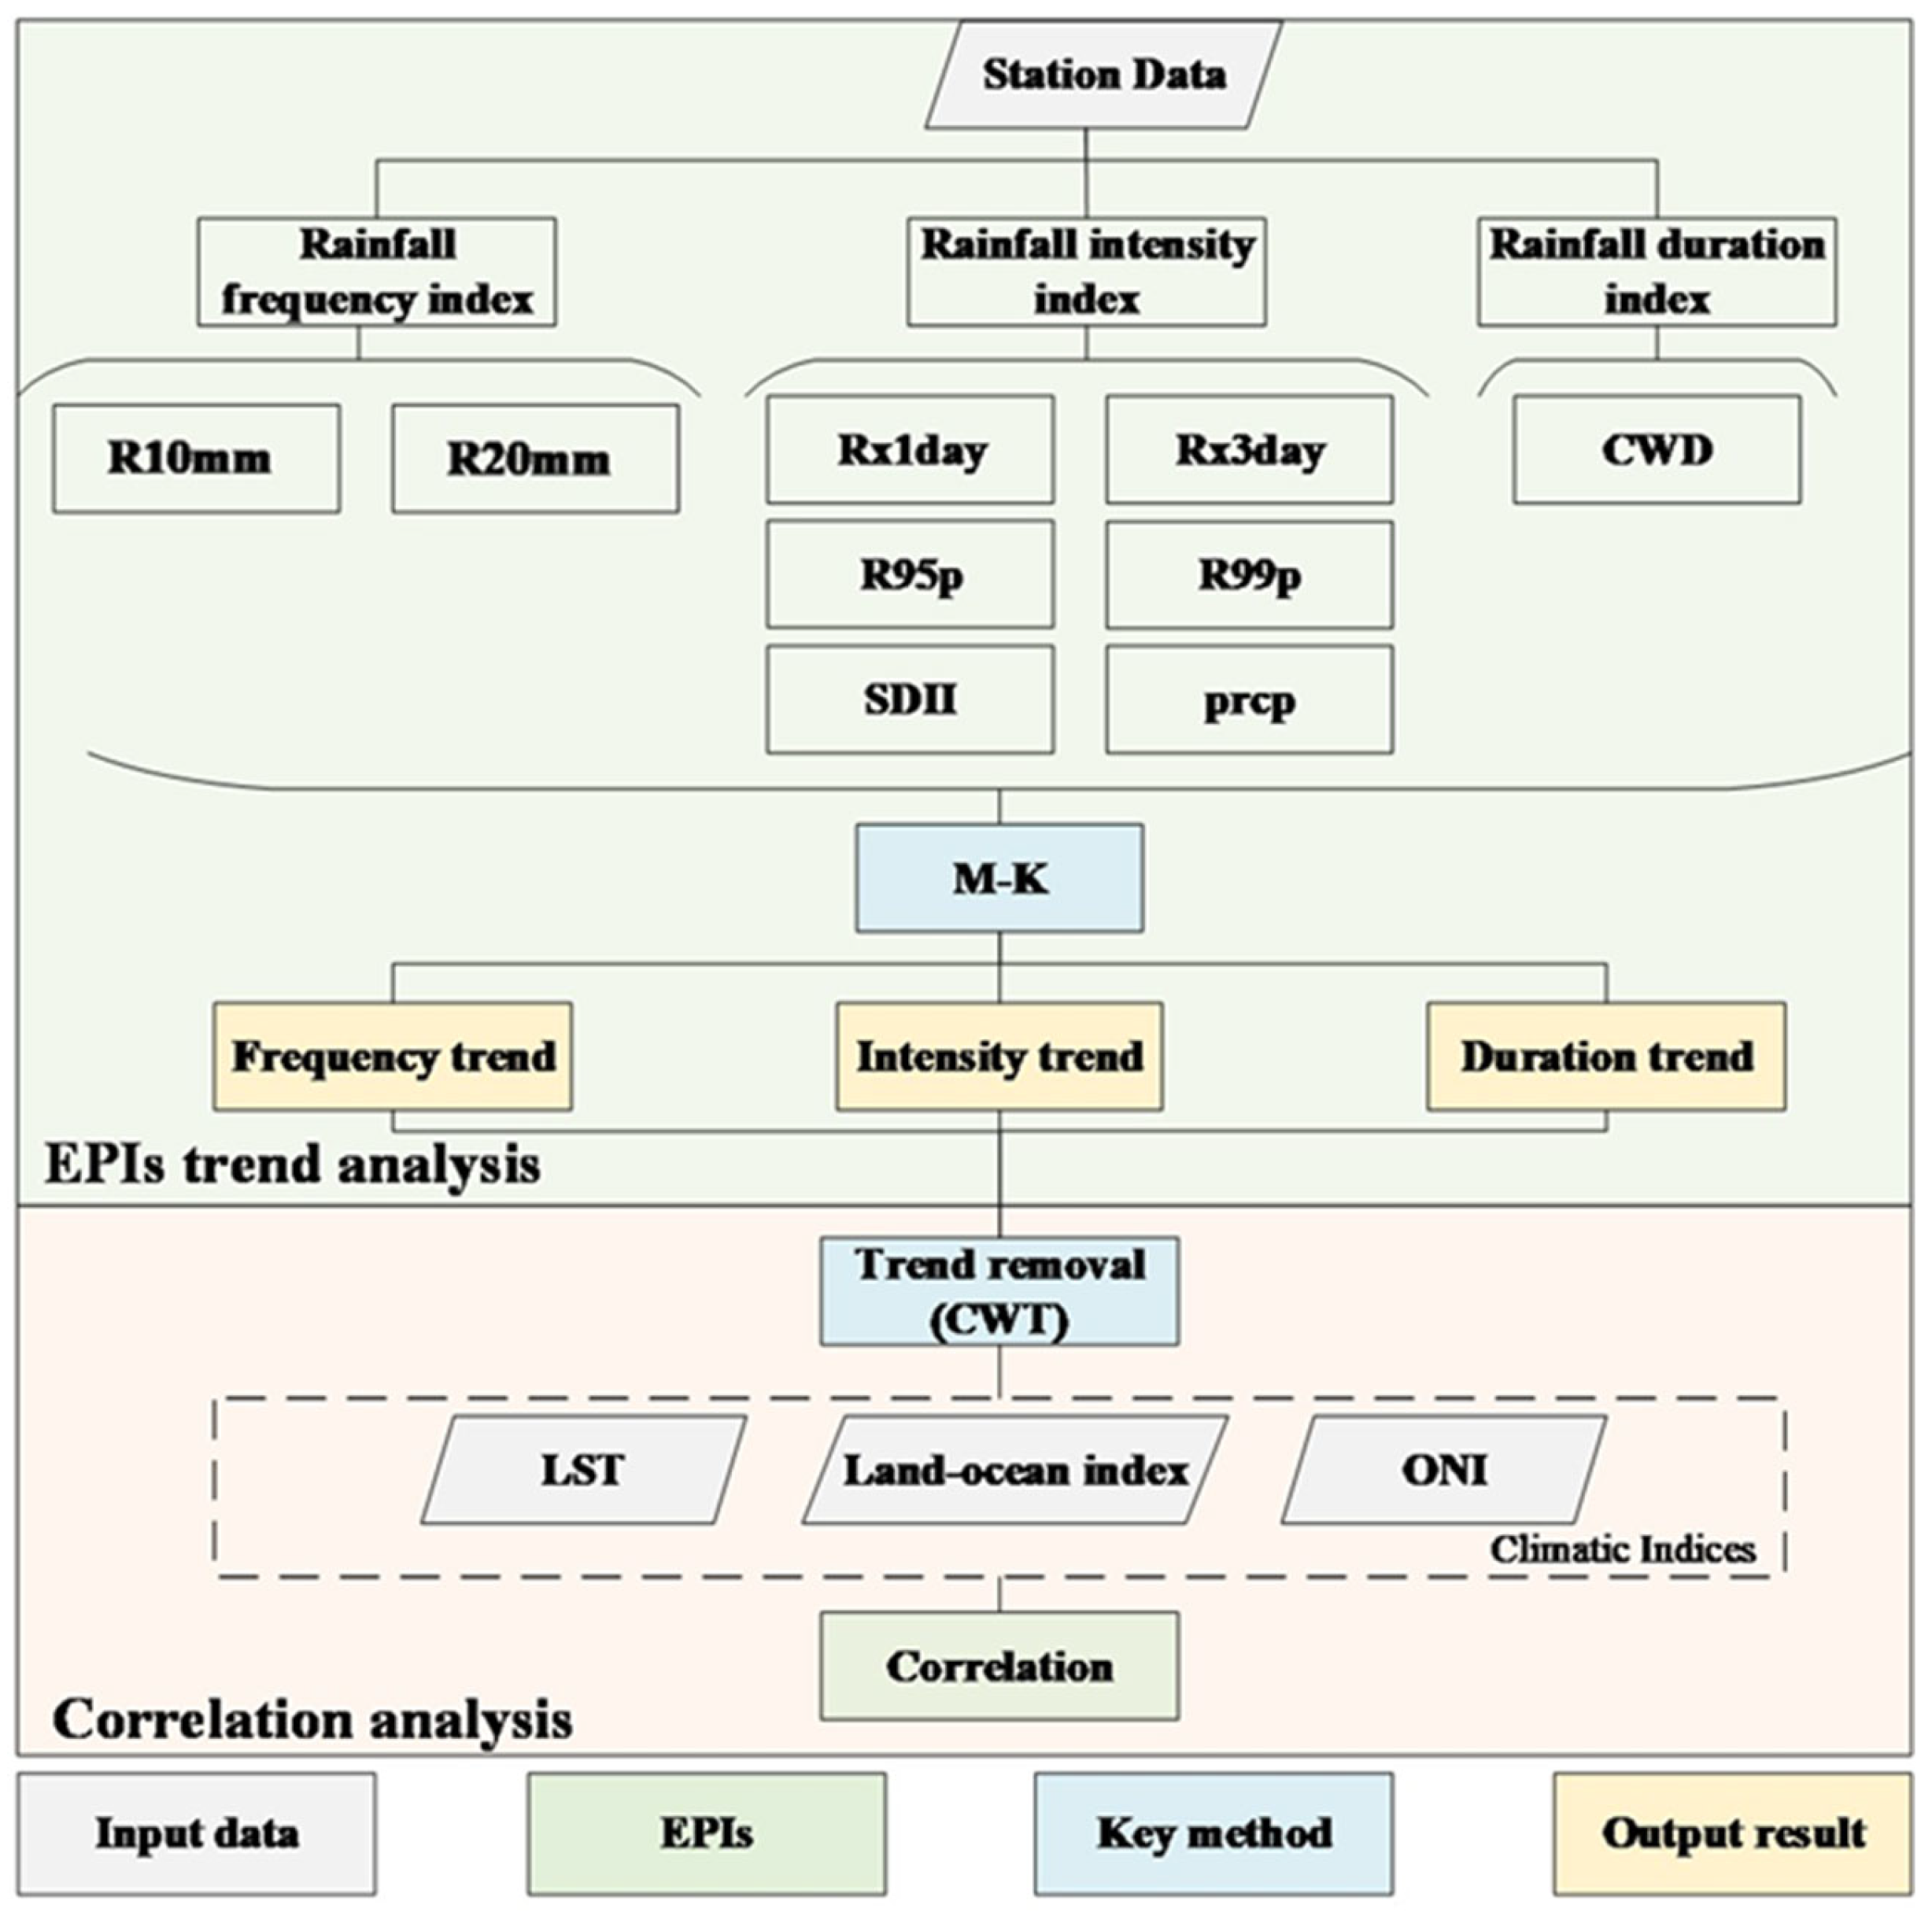
2.3.1. Analysis Method for Extreme Precipitation Characteristics
- (1)
- Extreme precipitation index
- (2)
- Non-uniformity test method
- (3)
- Spatial feature analysis method
2.3.2. Driver Correlation Analysis
3. Results
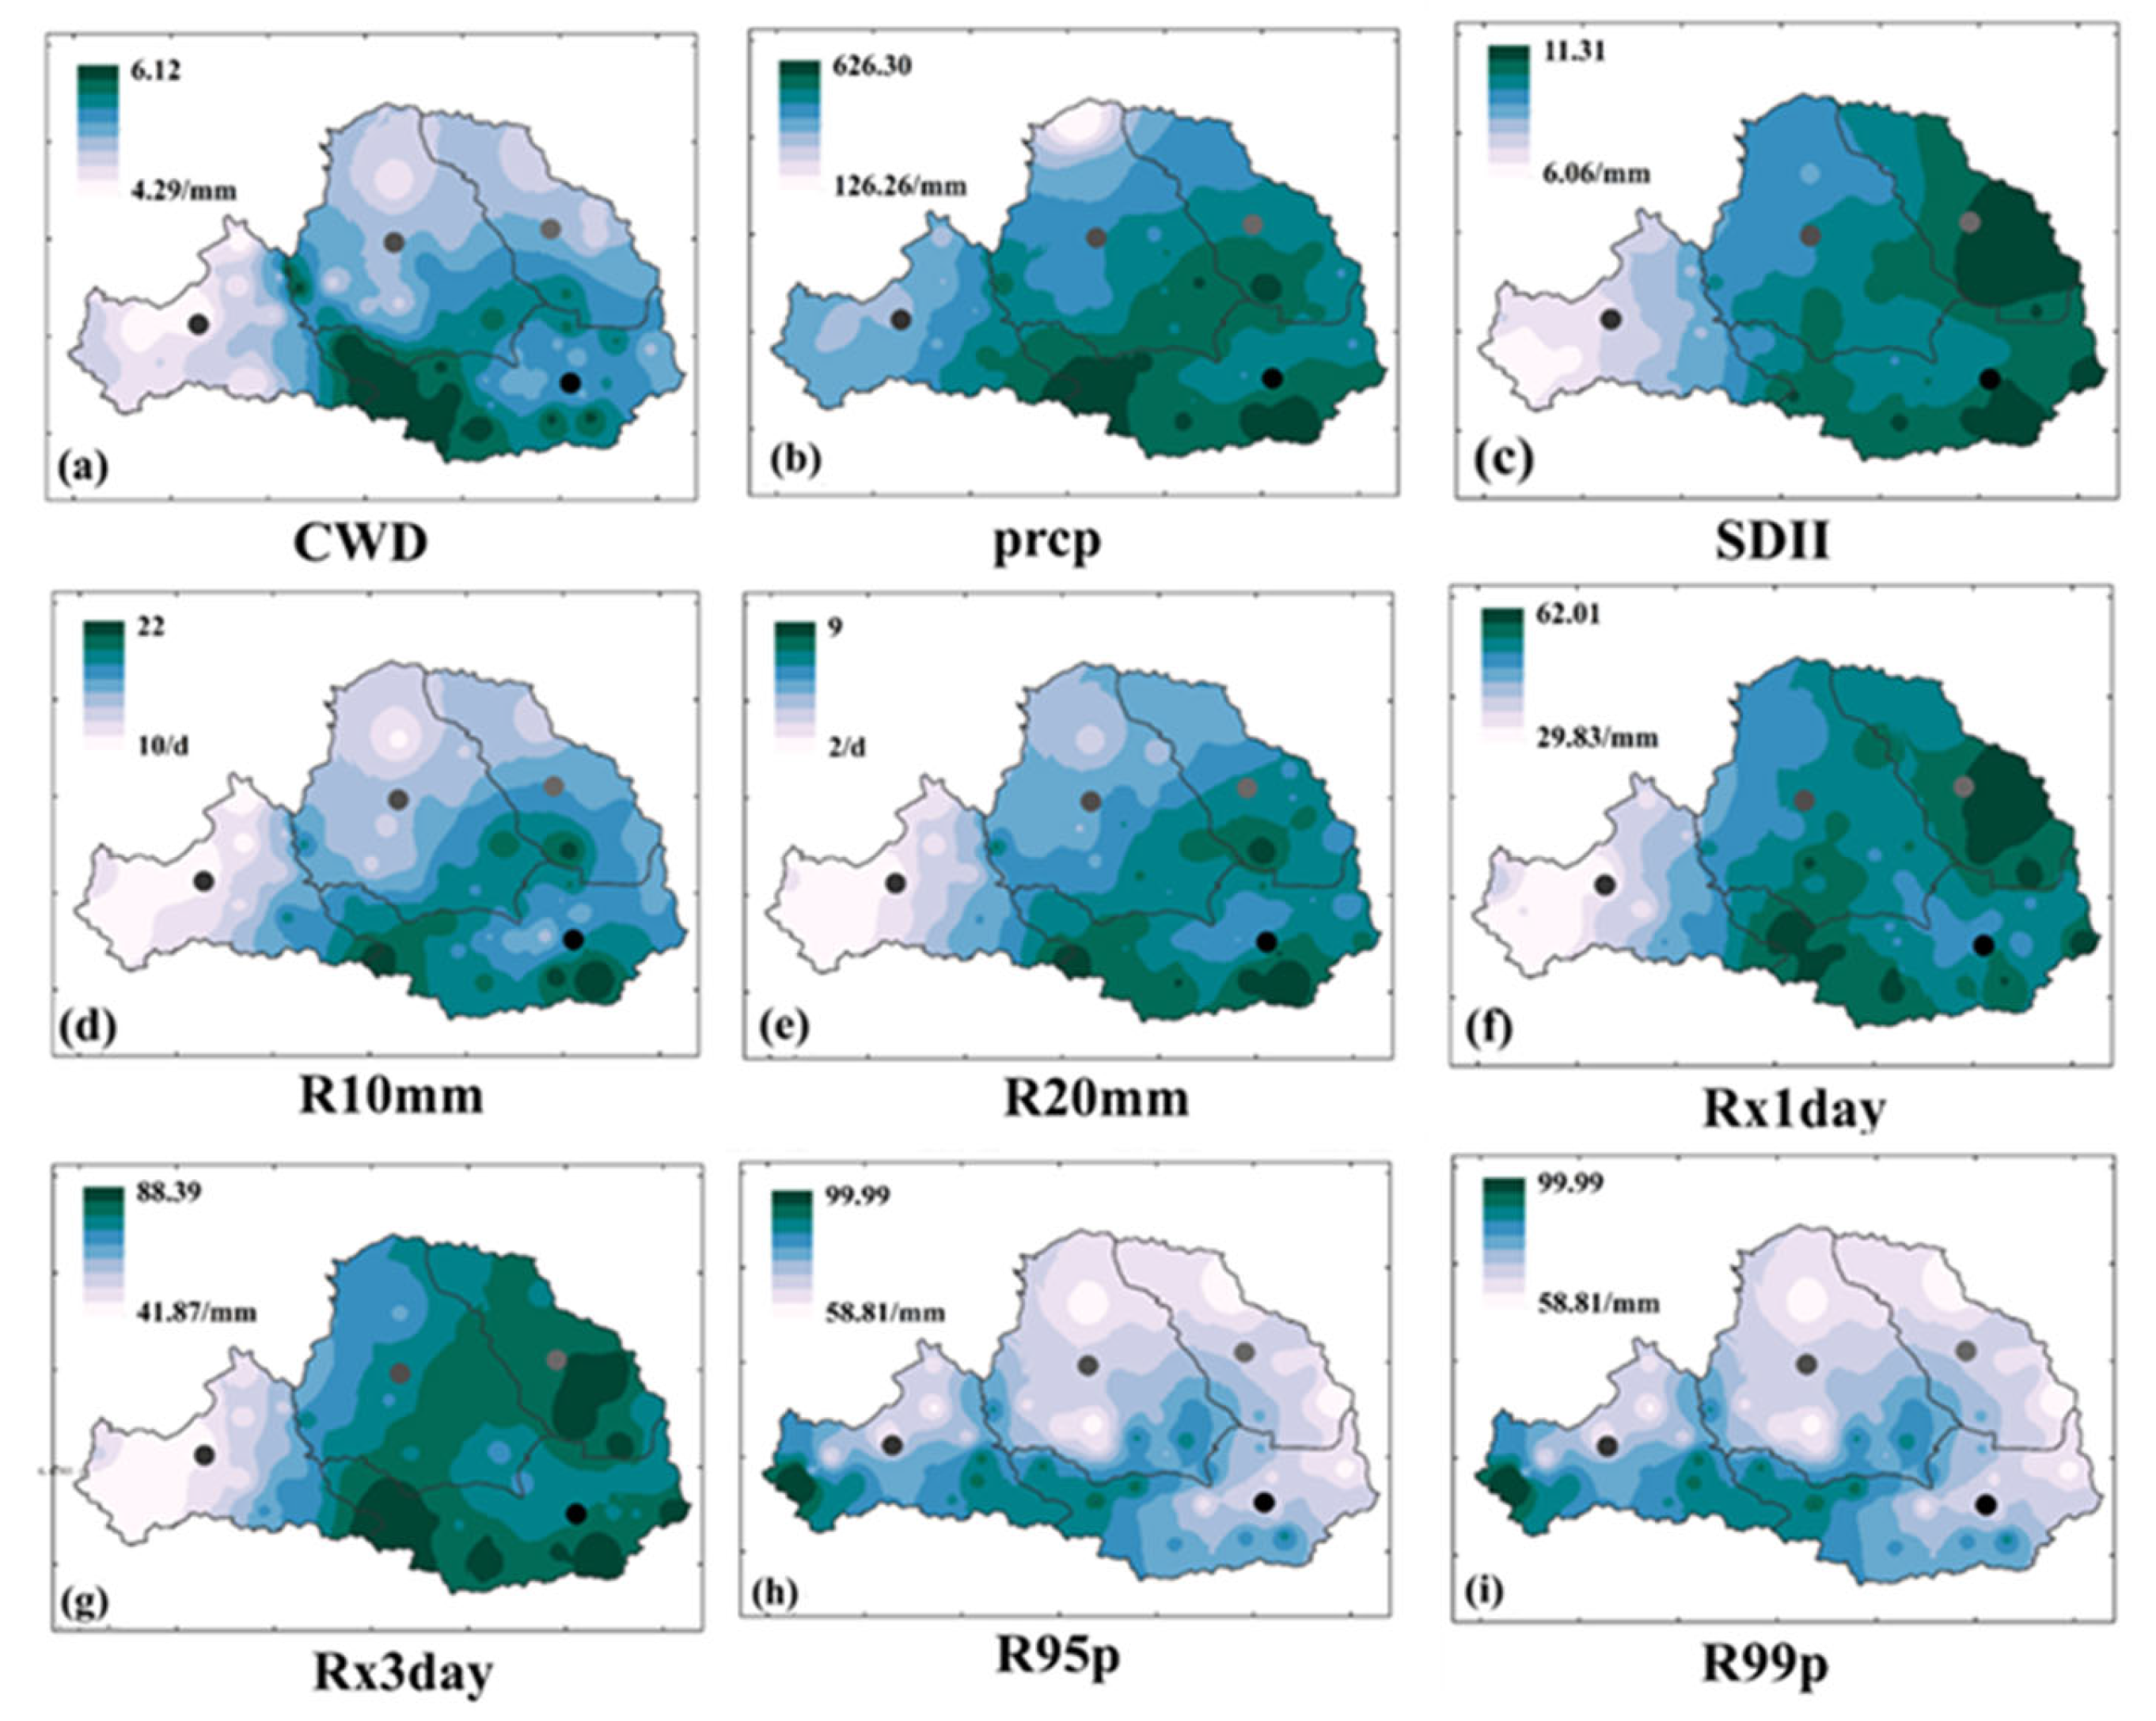
3.1. Spatial Variation in Extreme Precipitation in Wei River Basin
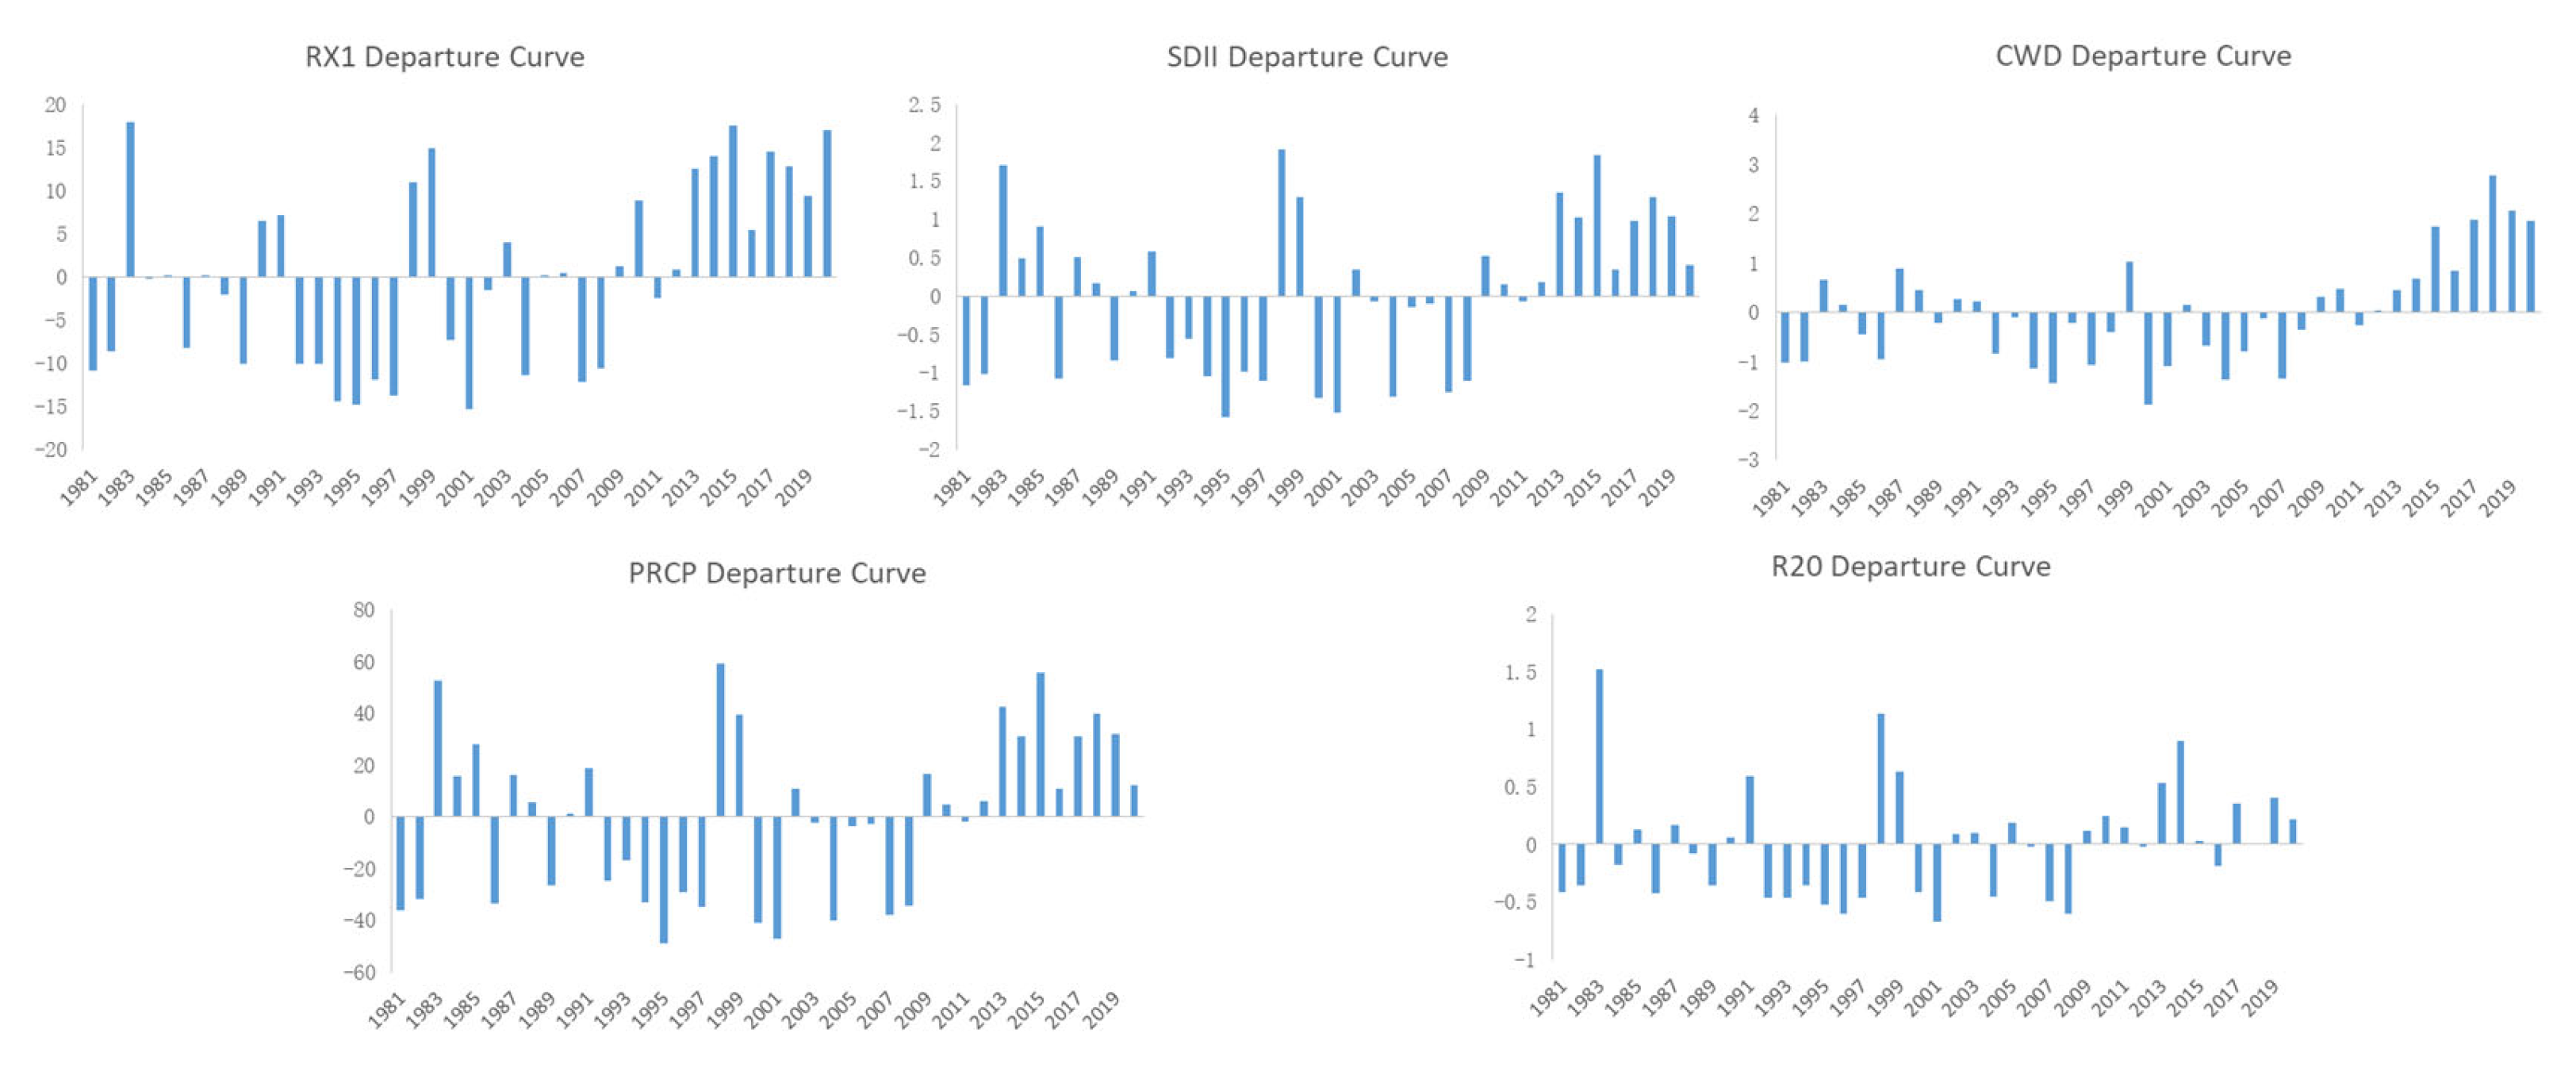
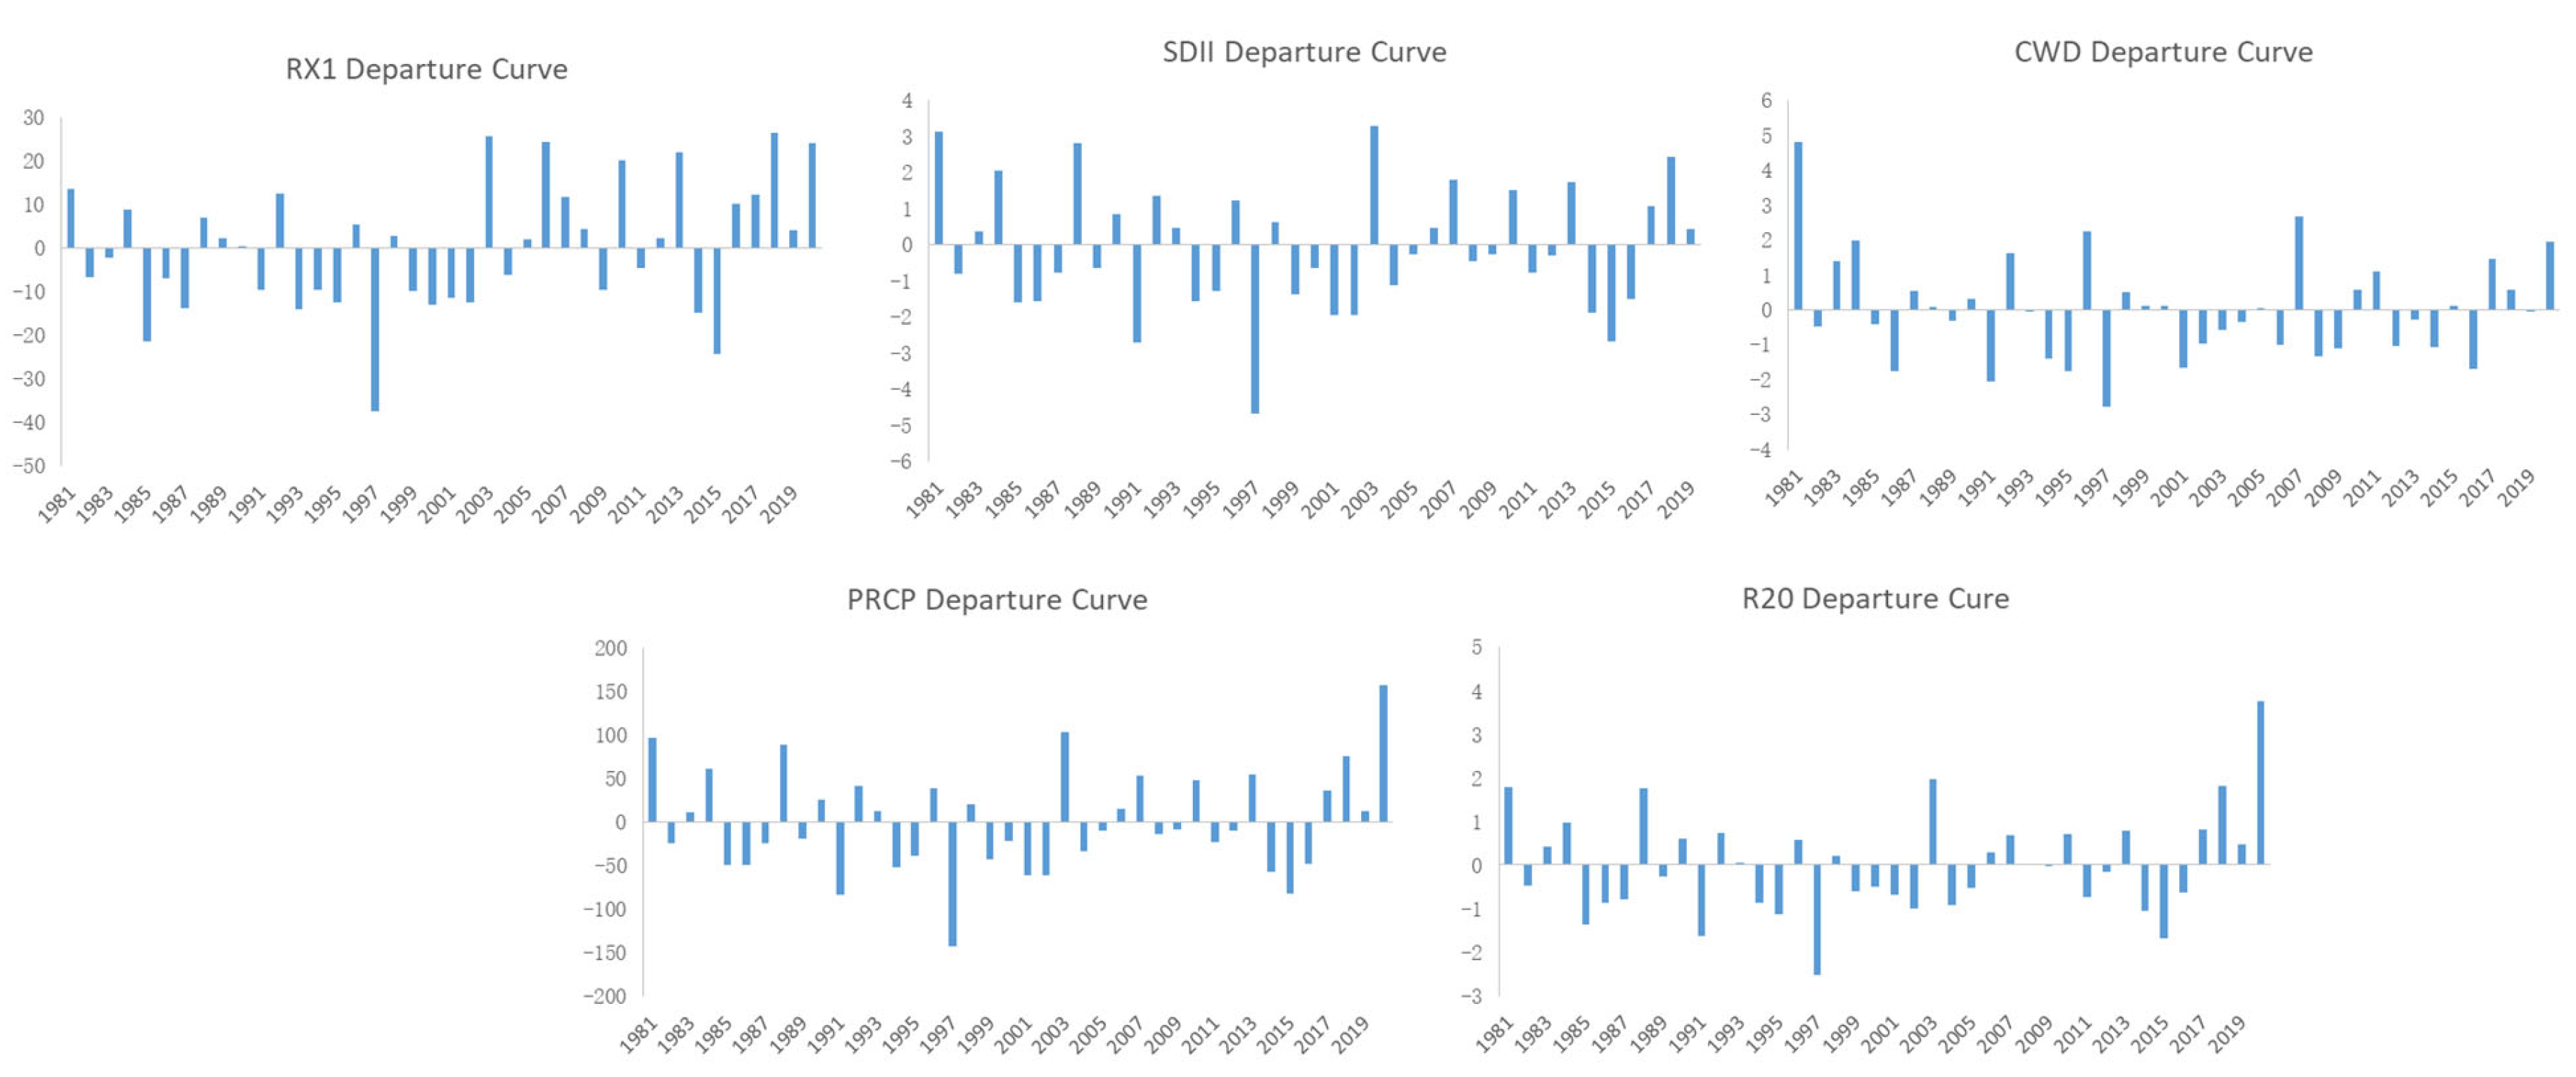
3.2. Temporal Variation Characteristics of the Extreme Precipitation Index
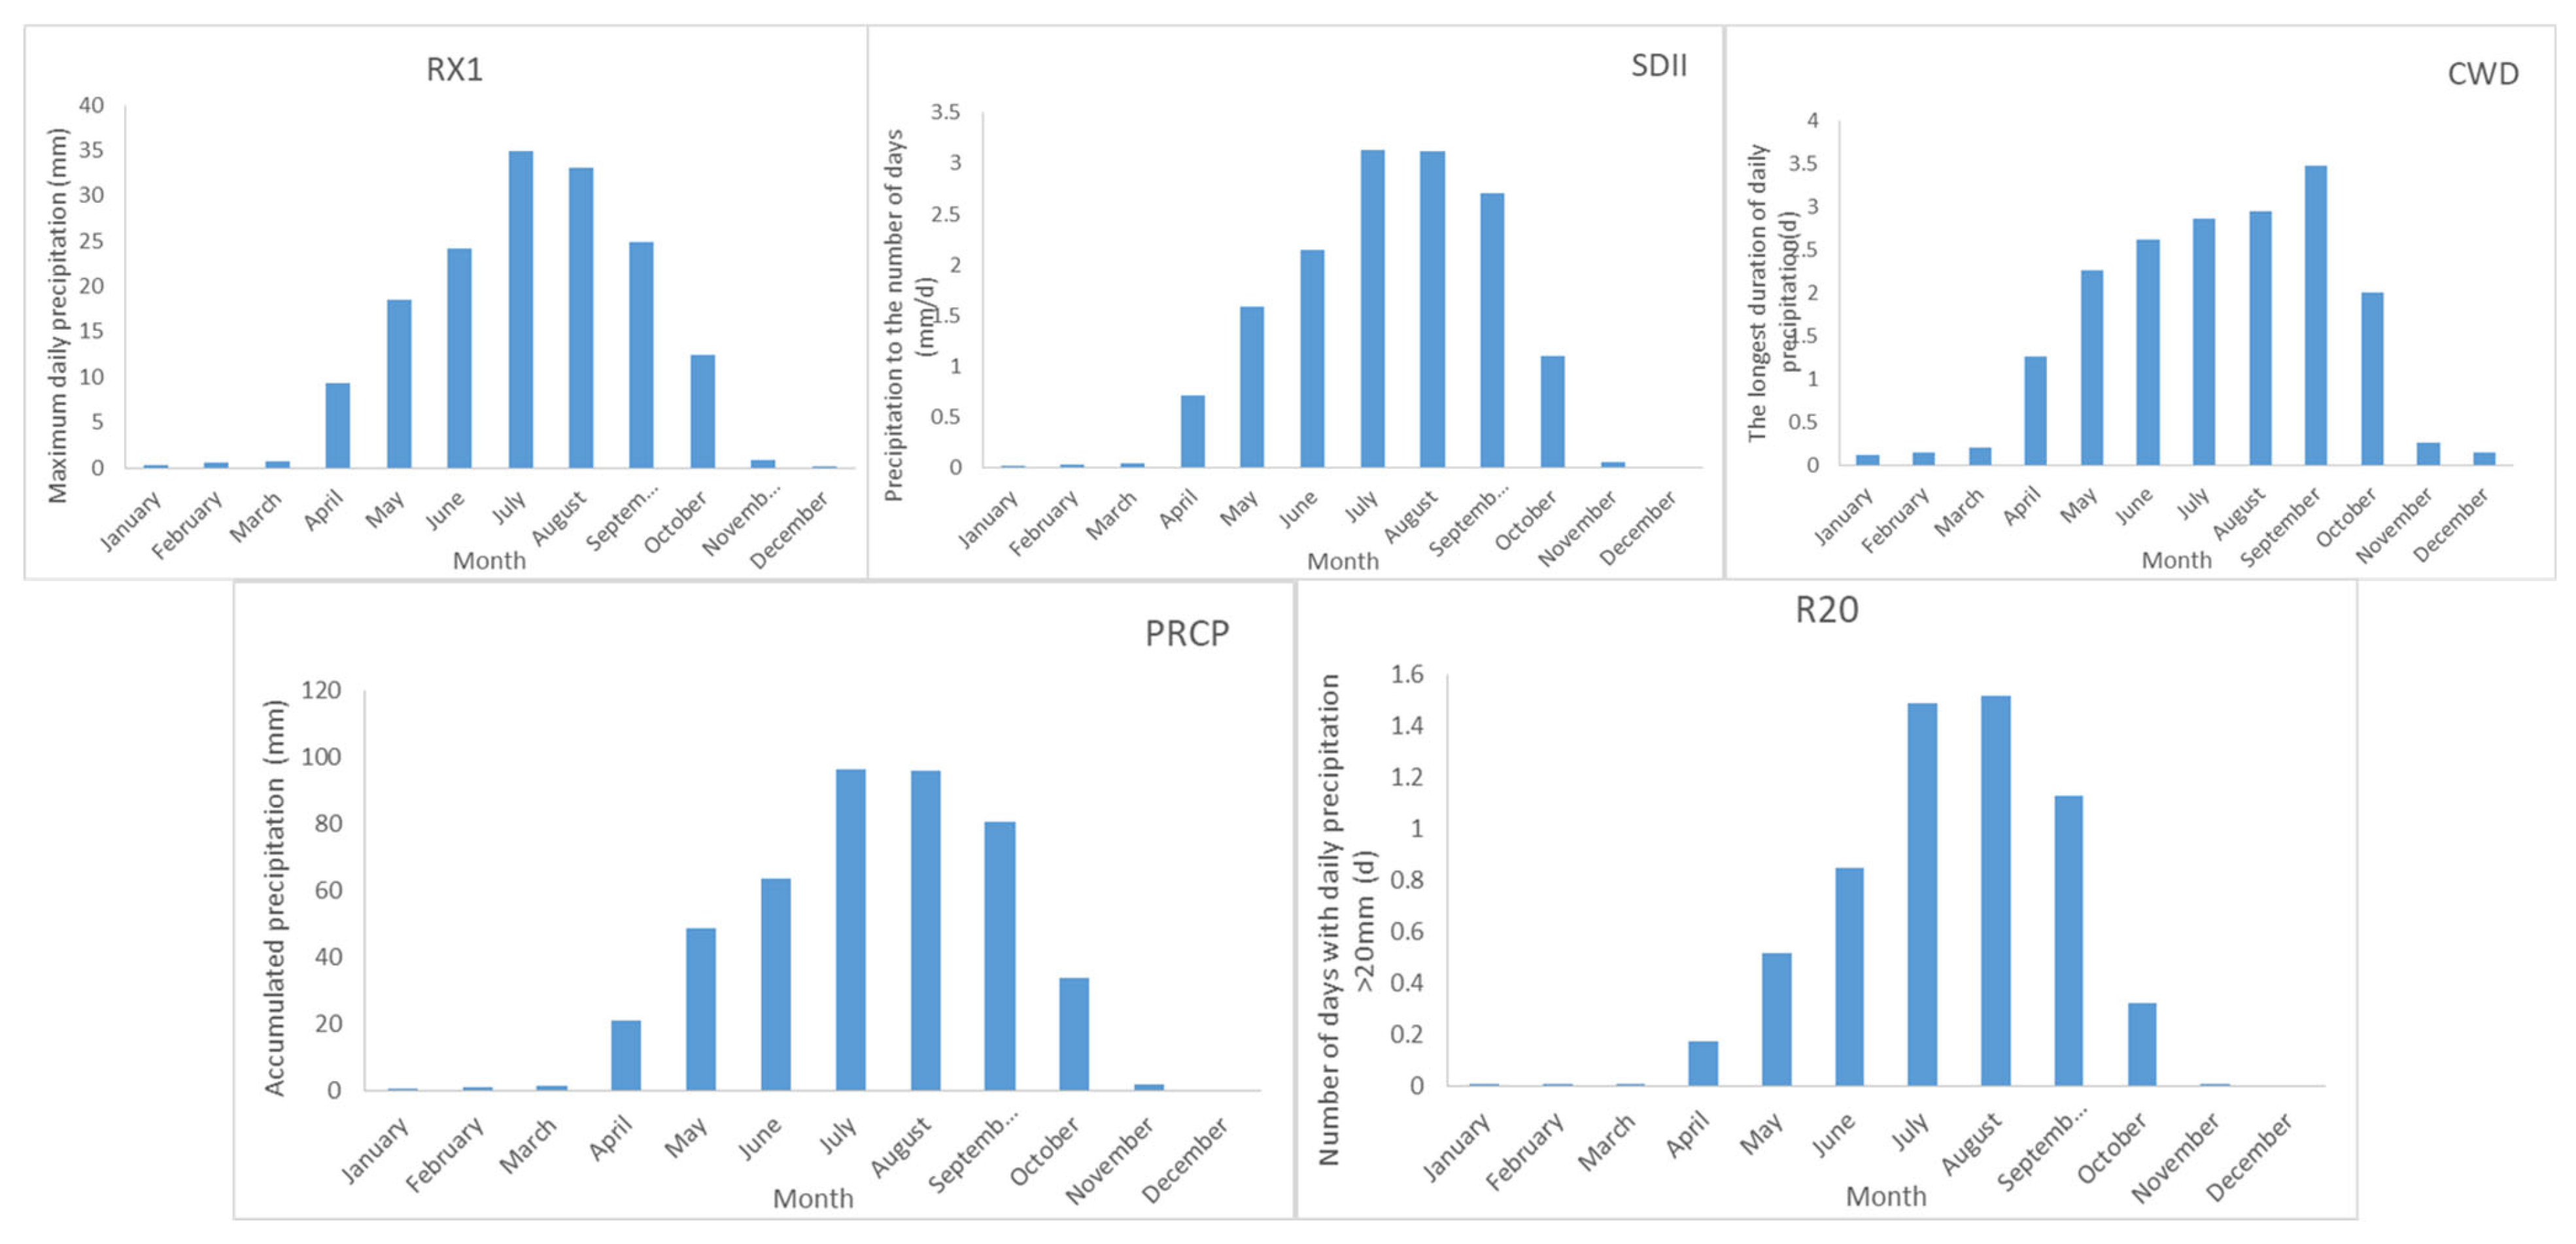
3.3. Intra-Annual Characteristics of Extreme Precipitation
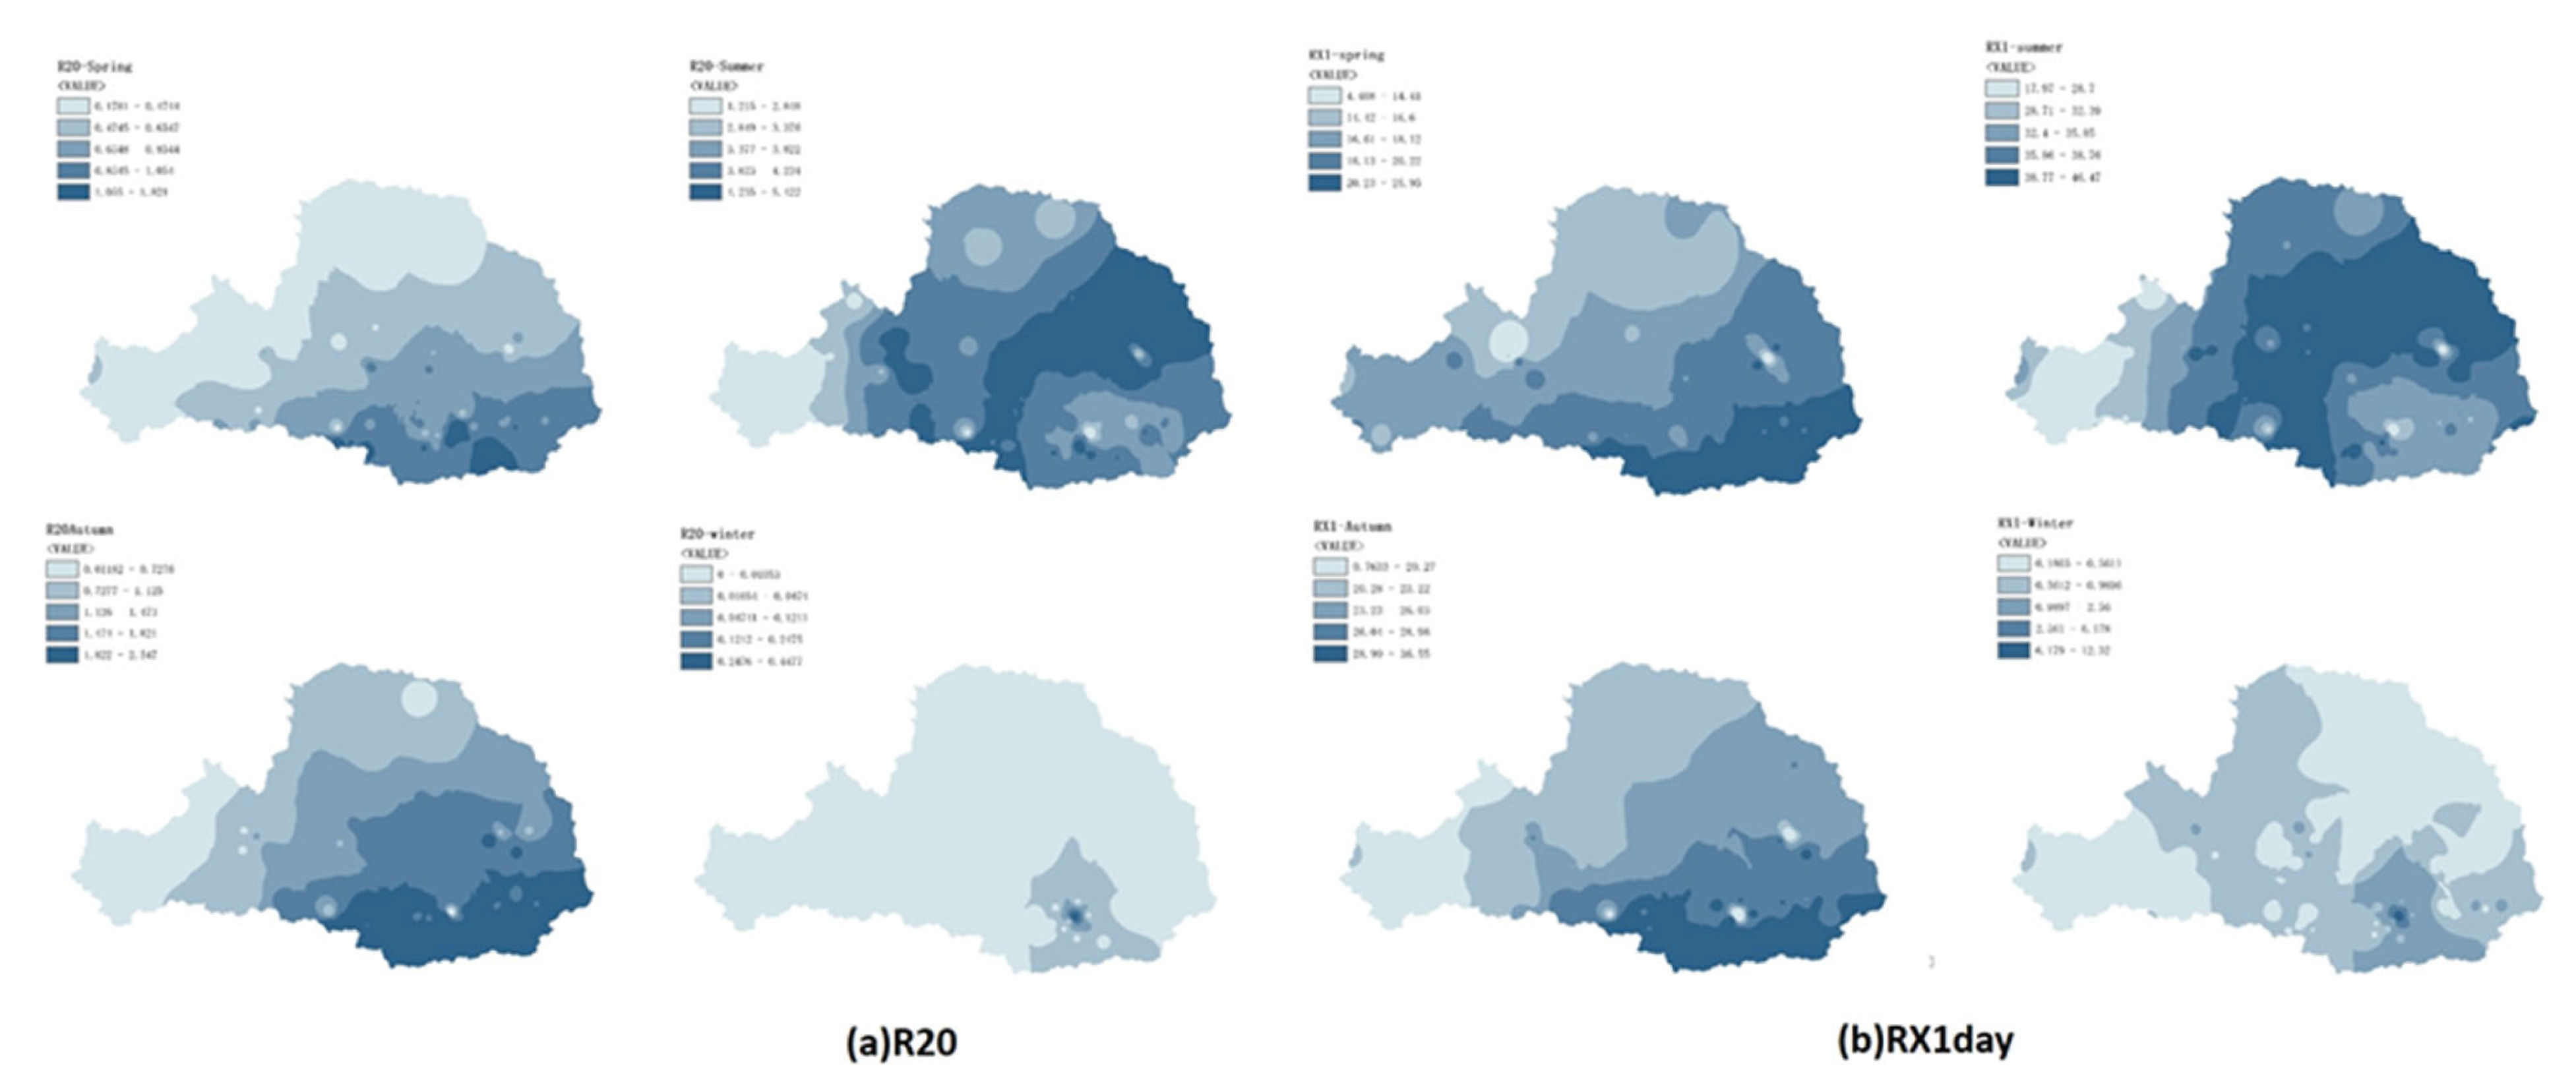
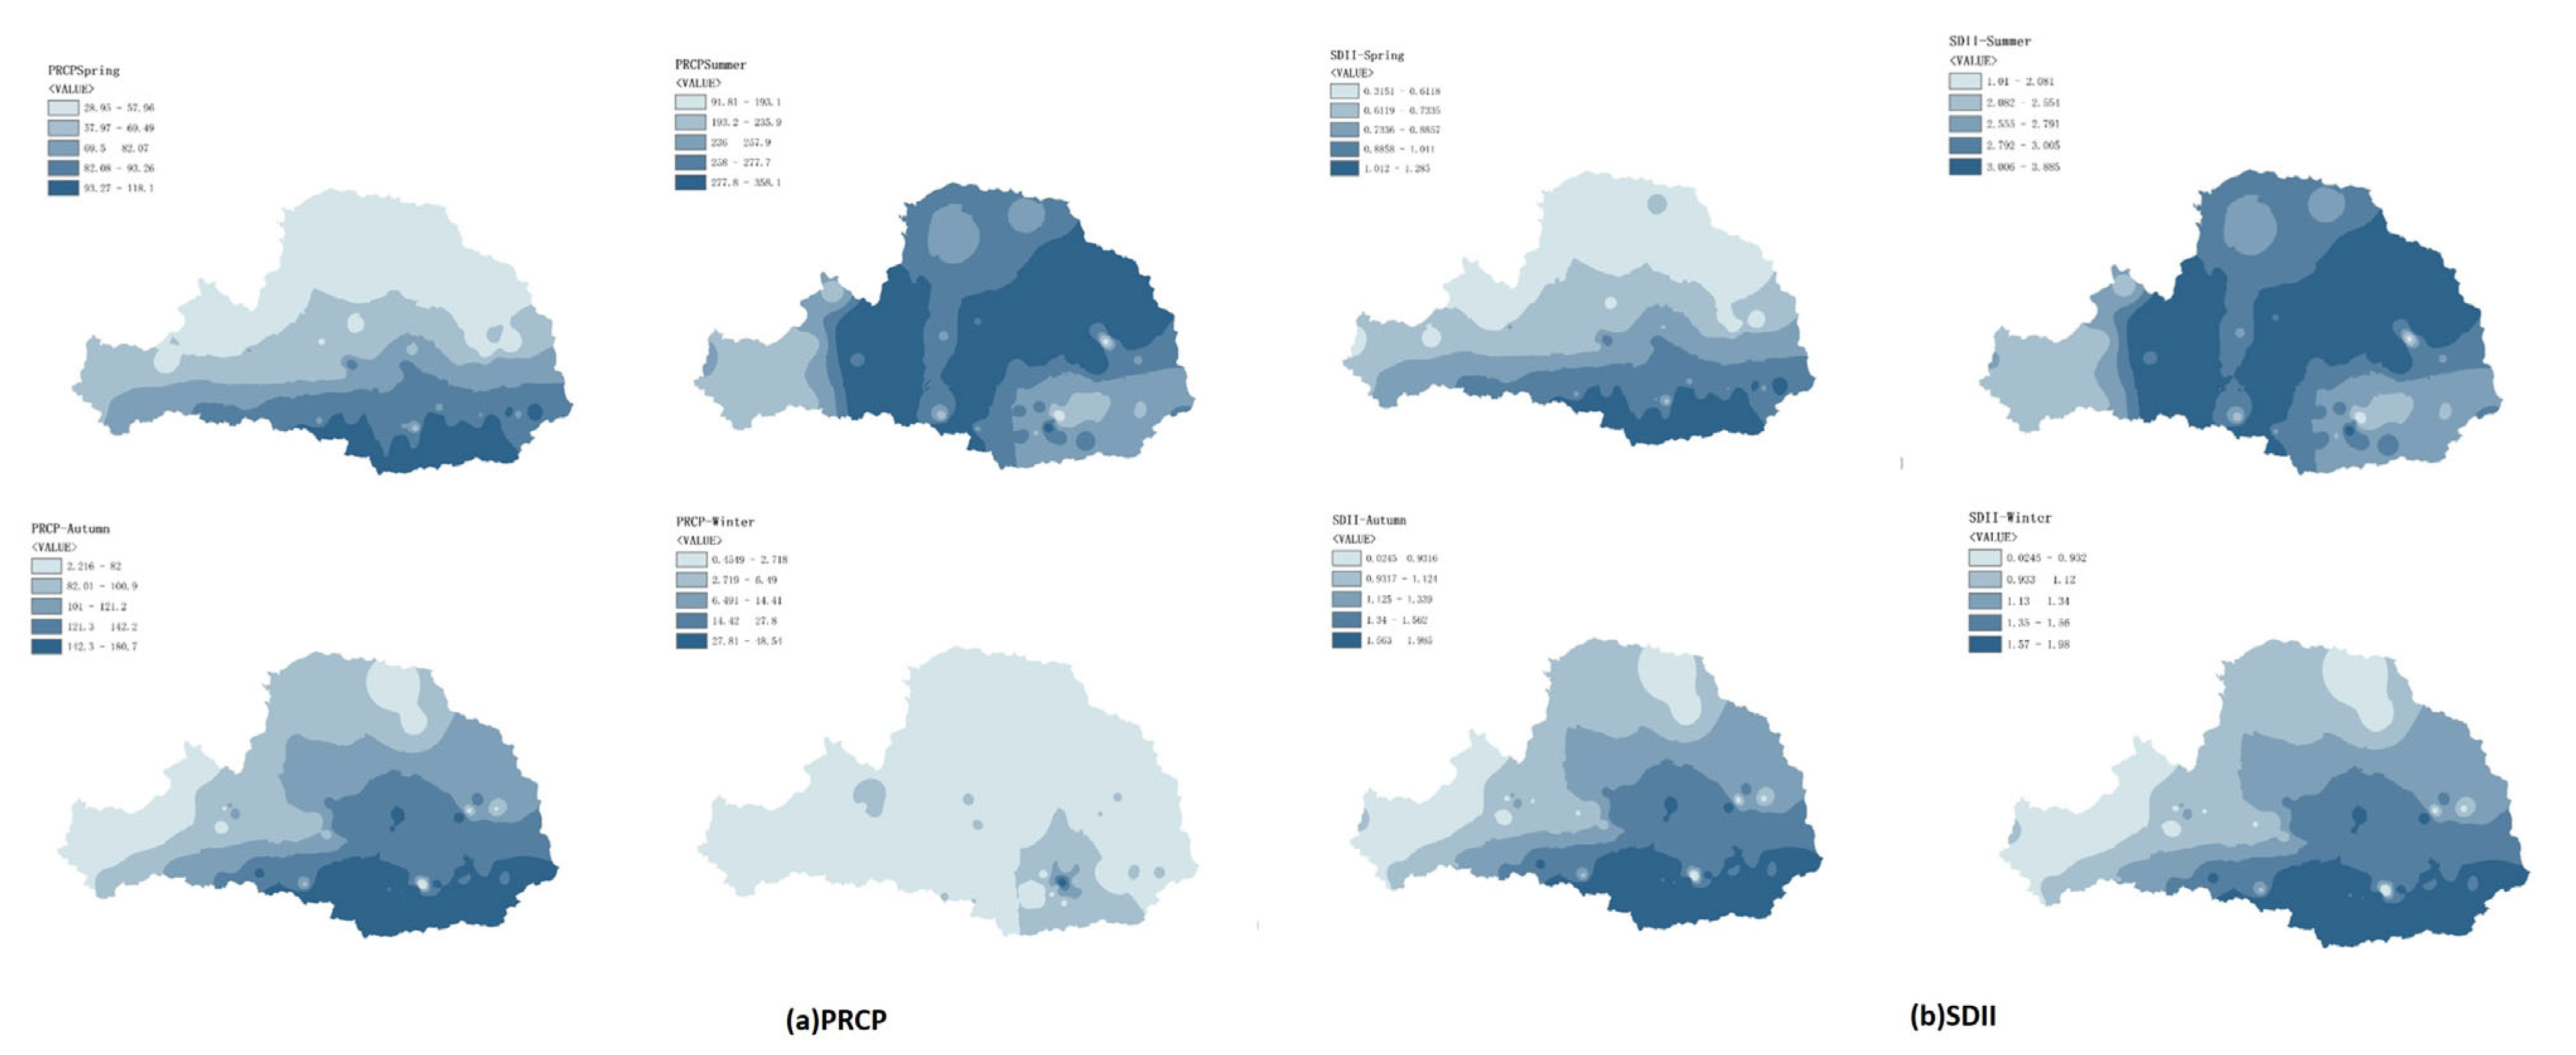
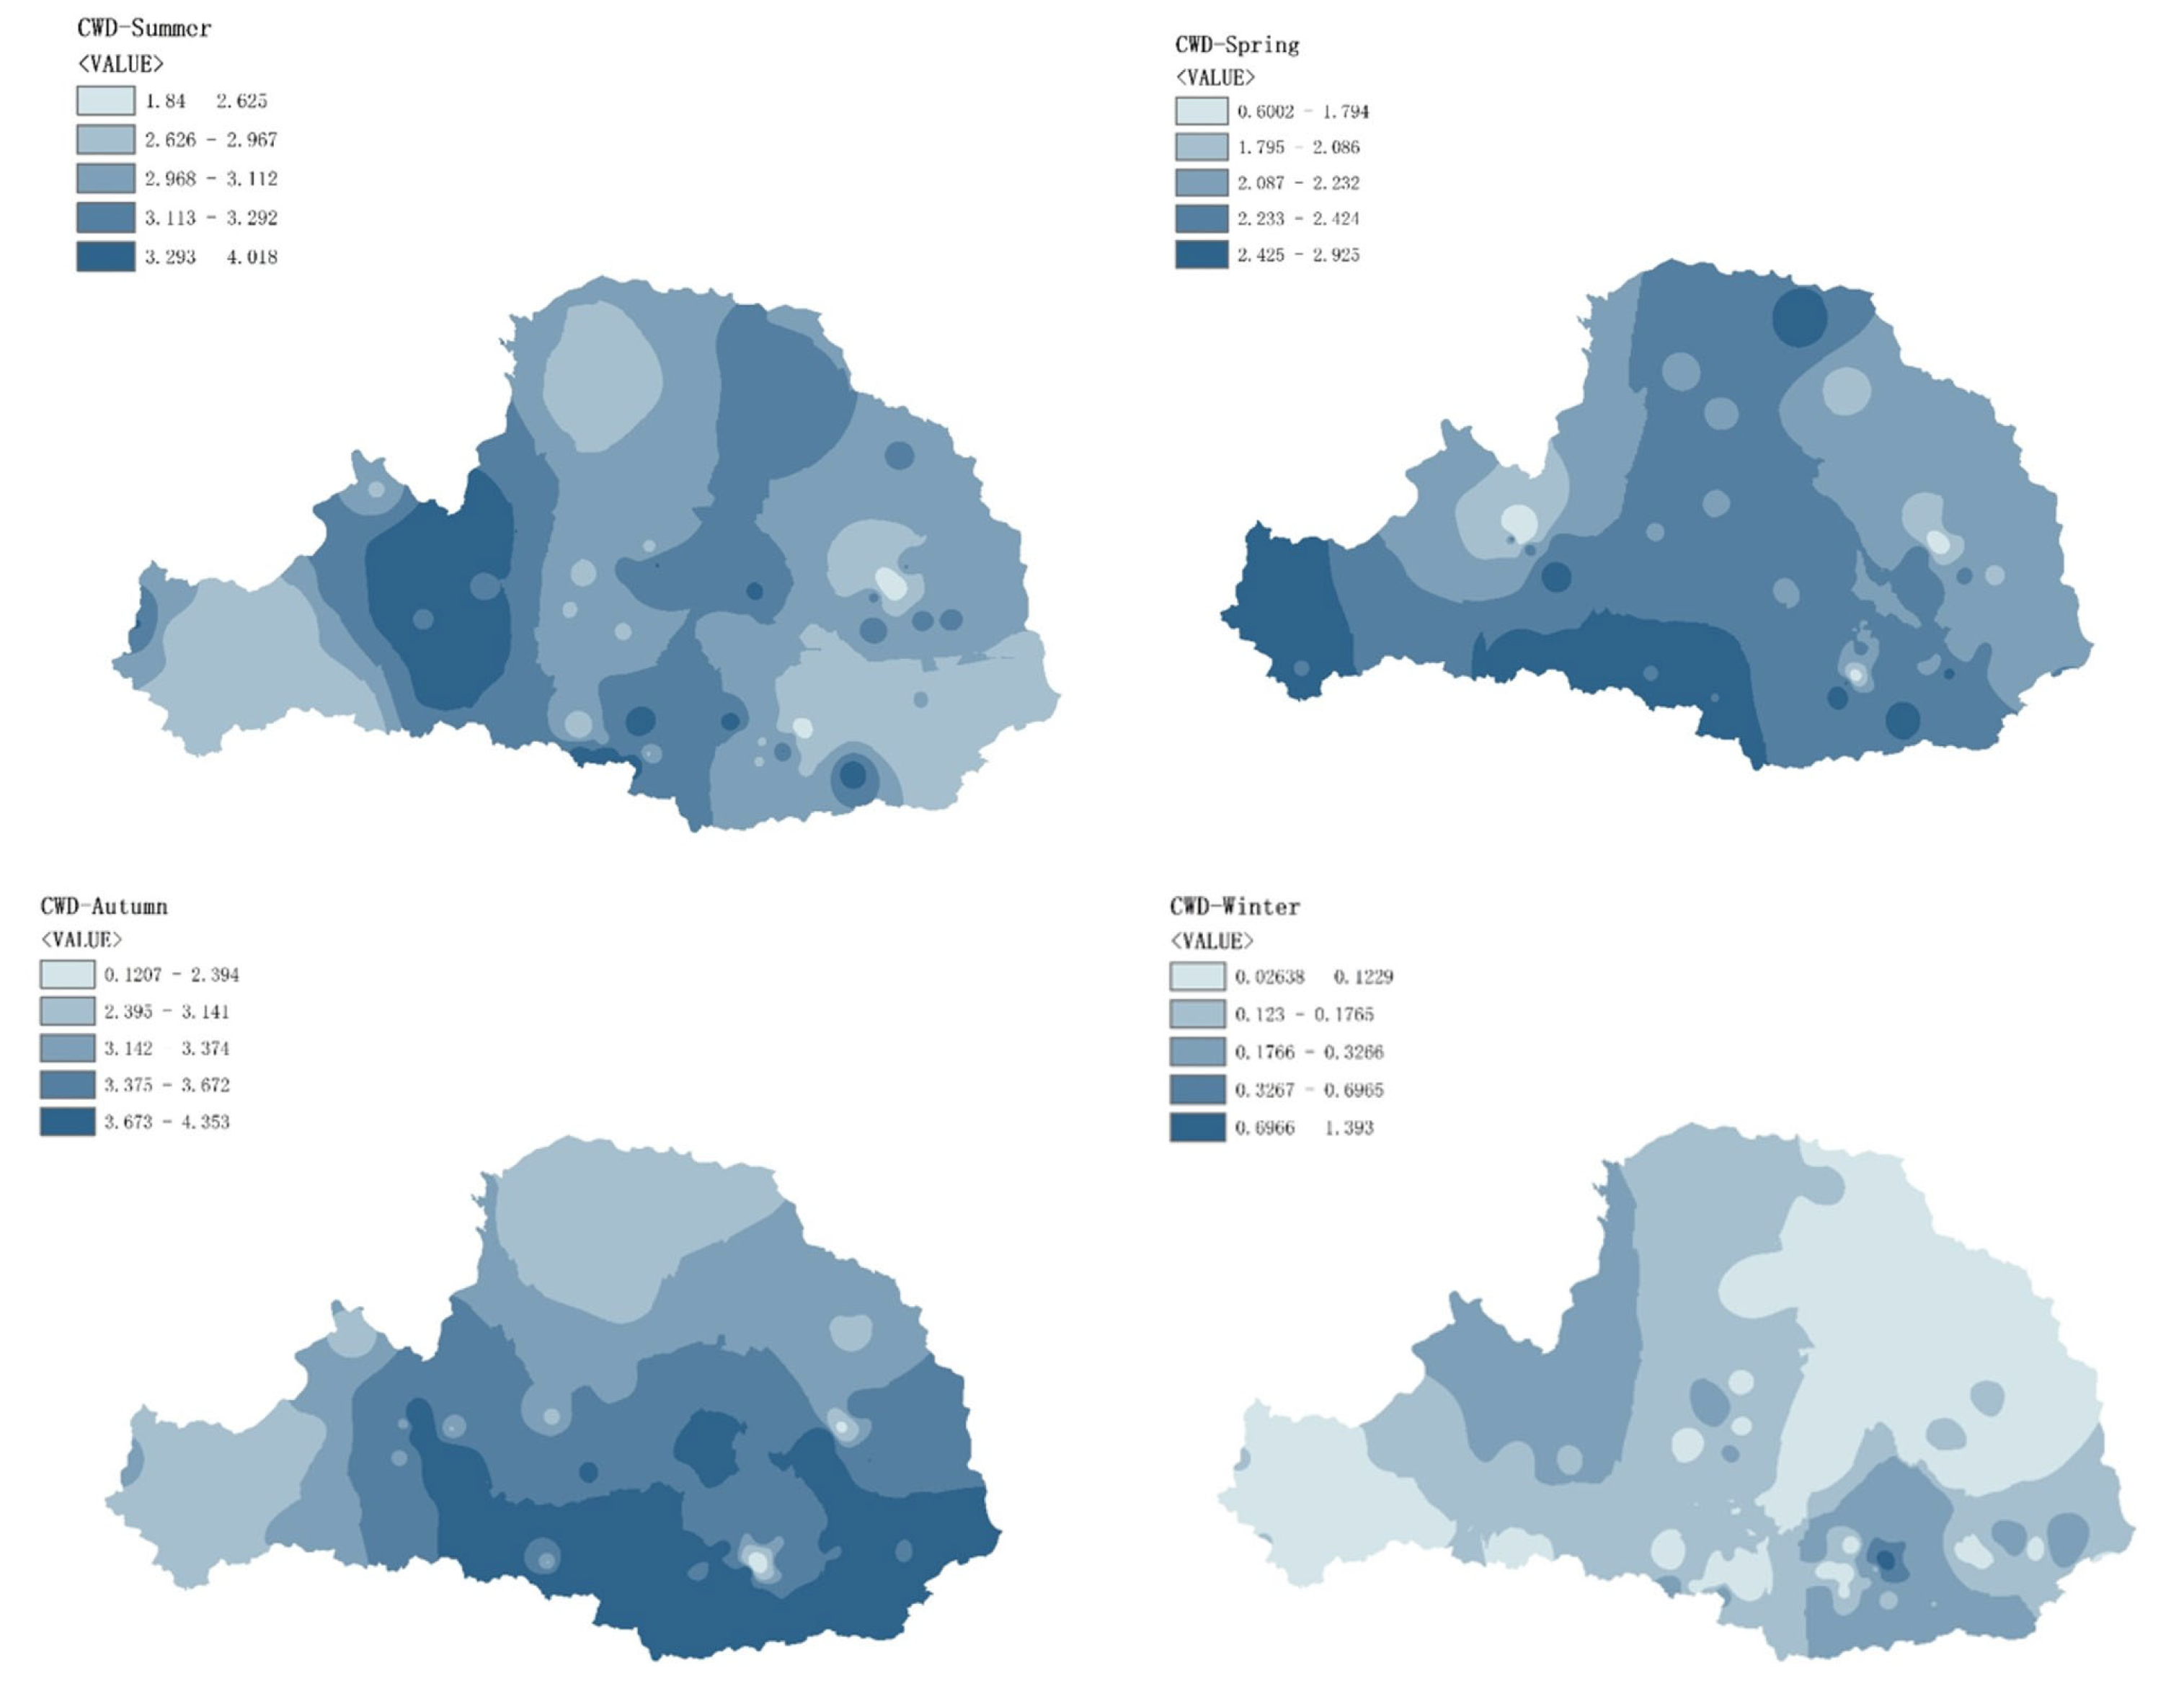
3.3.1. Intra-Annual Spatial Distribution Characteristics
3.3.2. Intra-Annual Temporal Characteristics
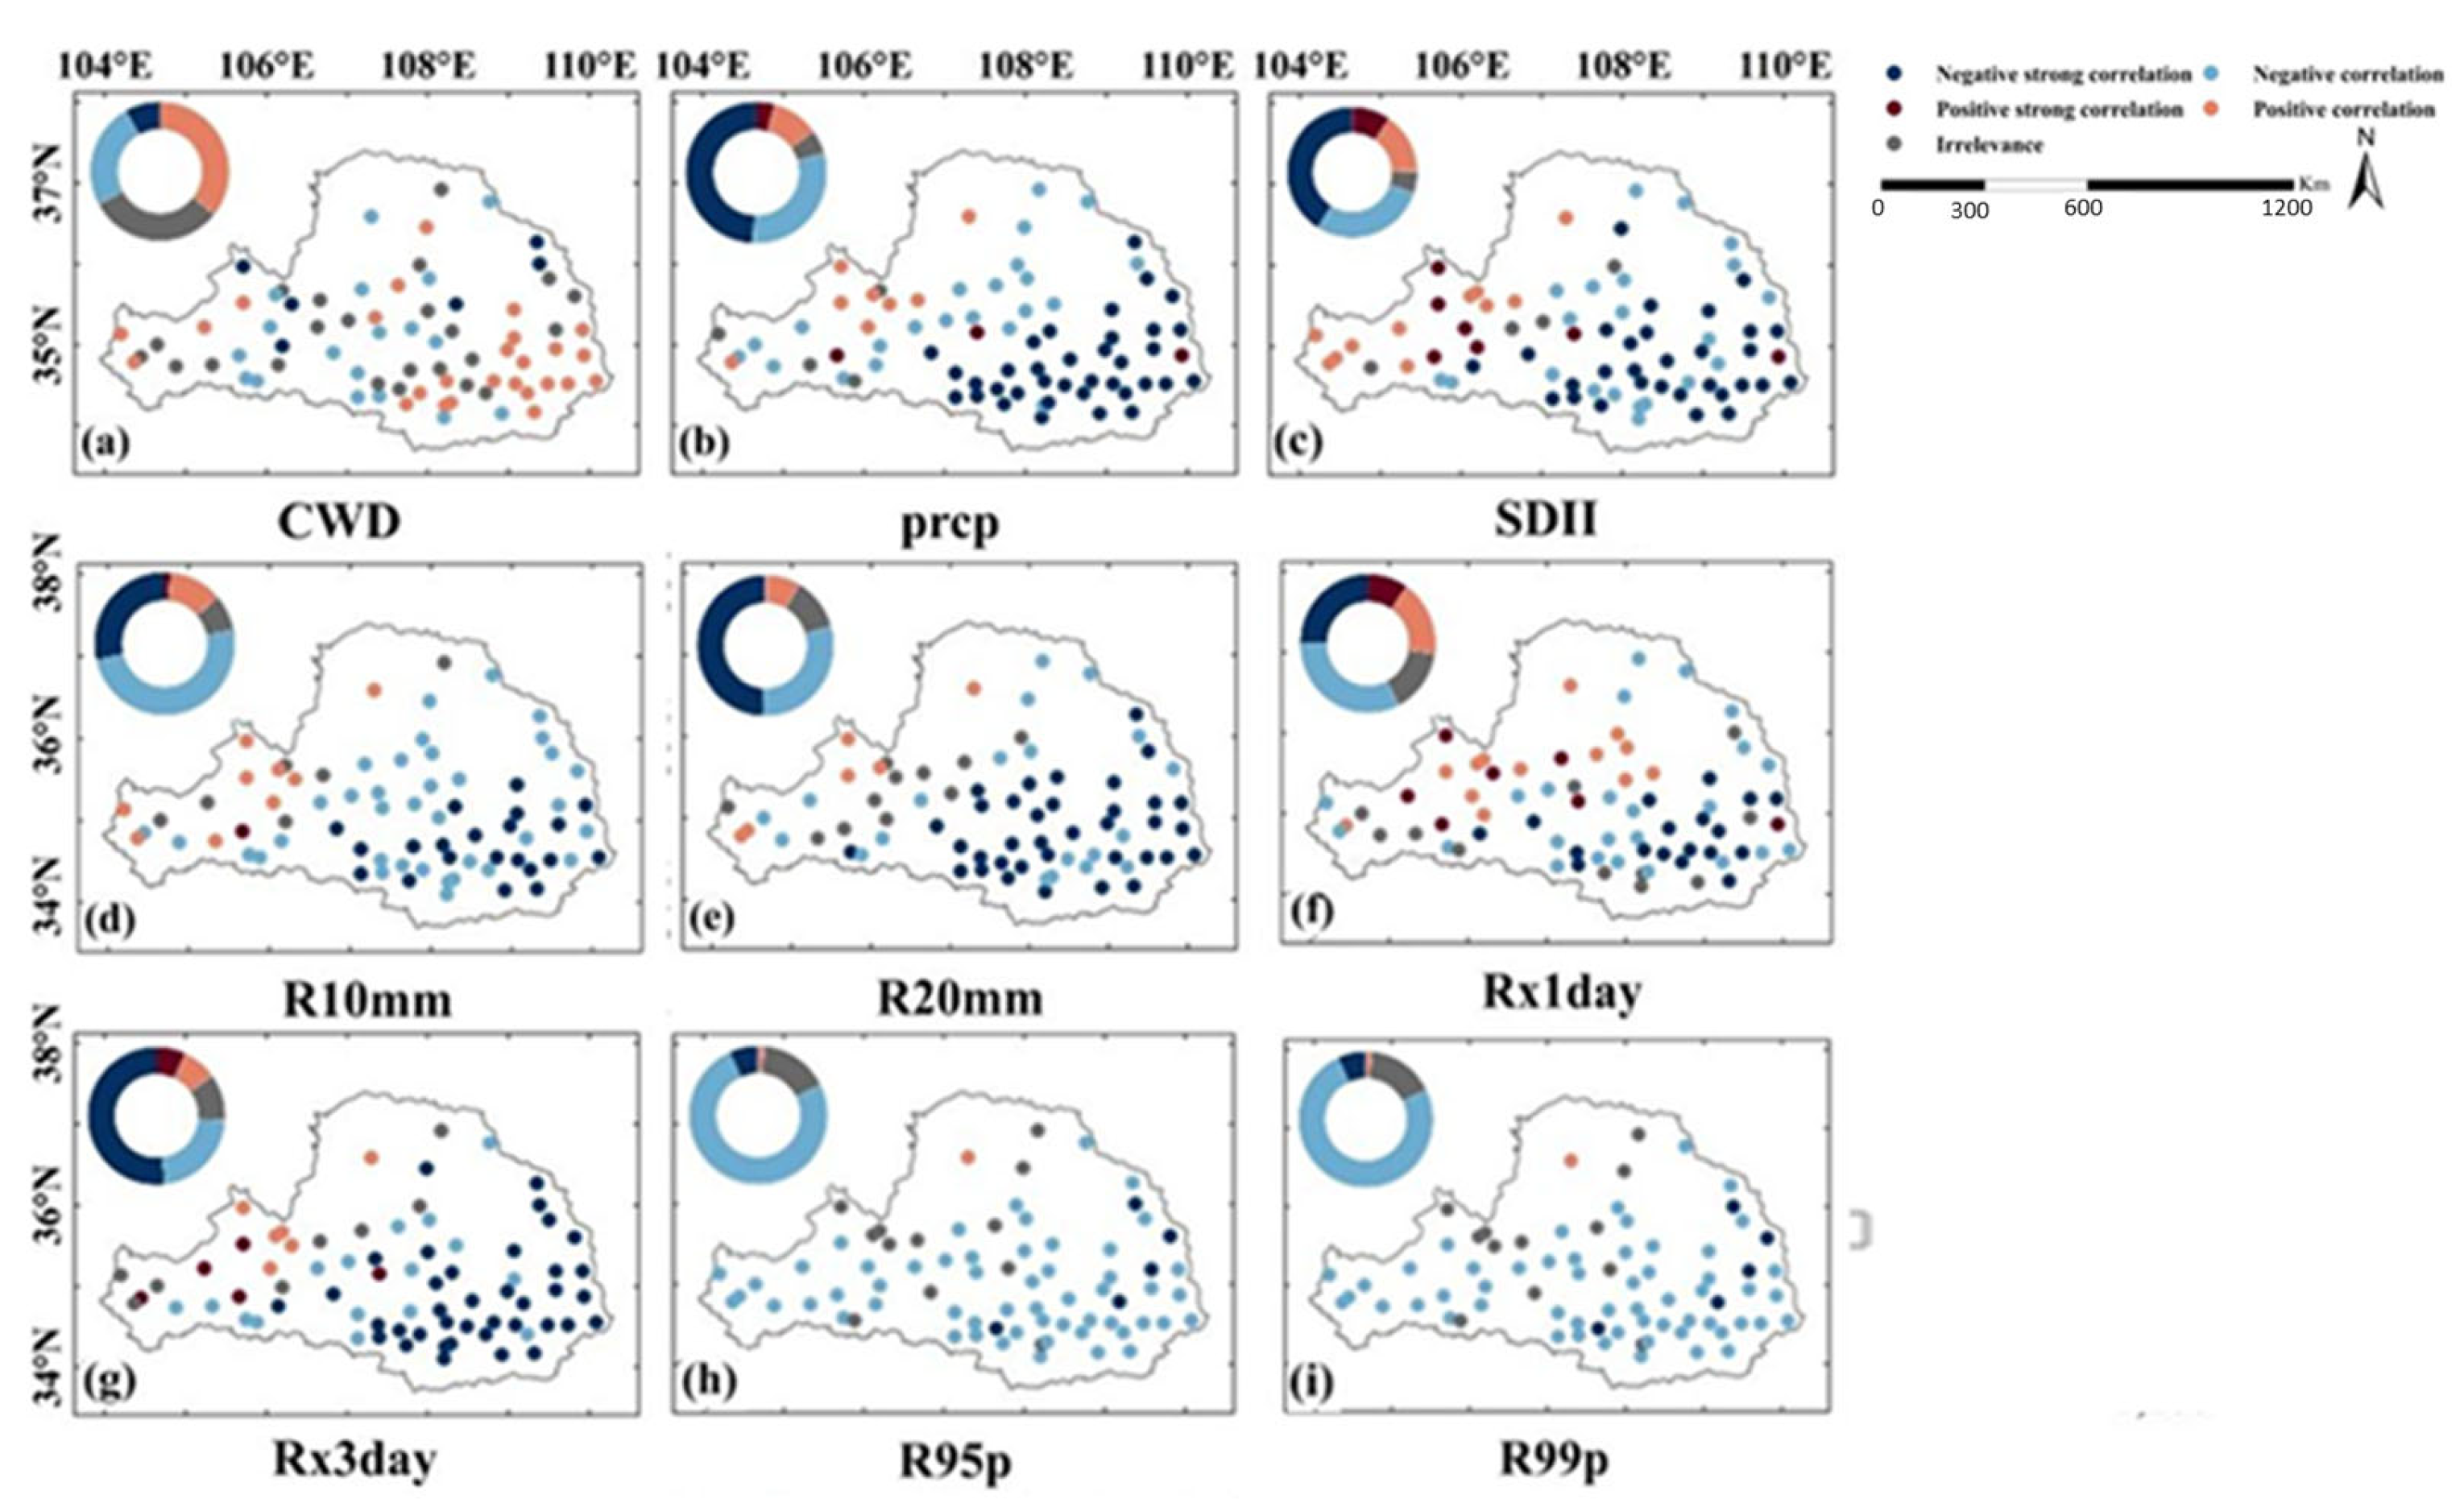
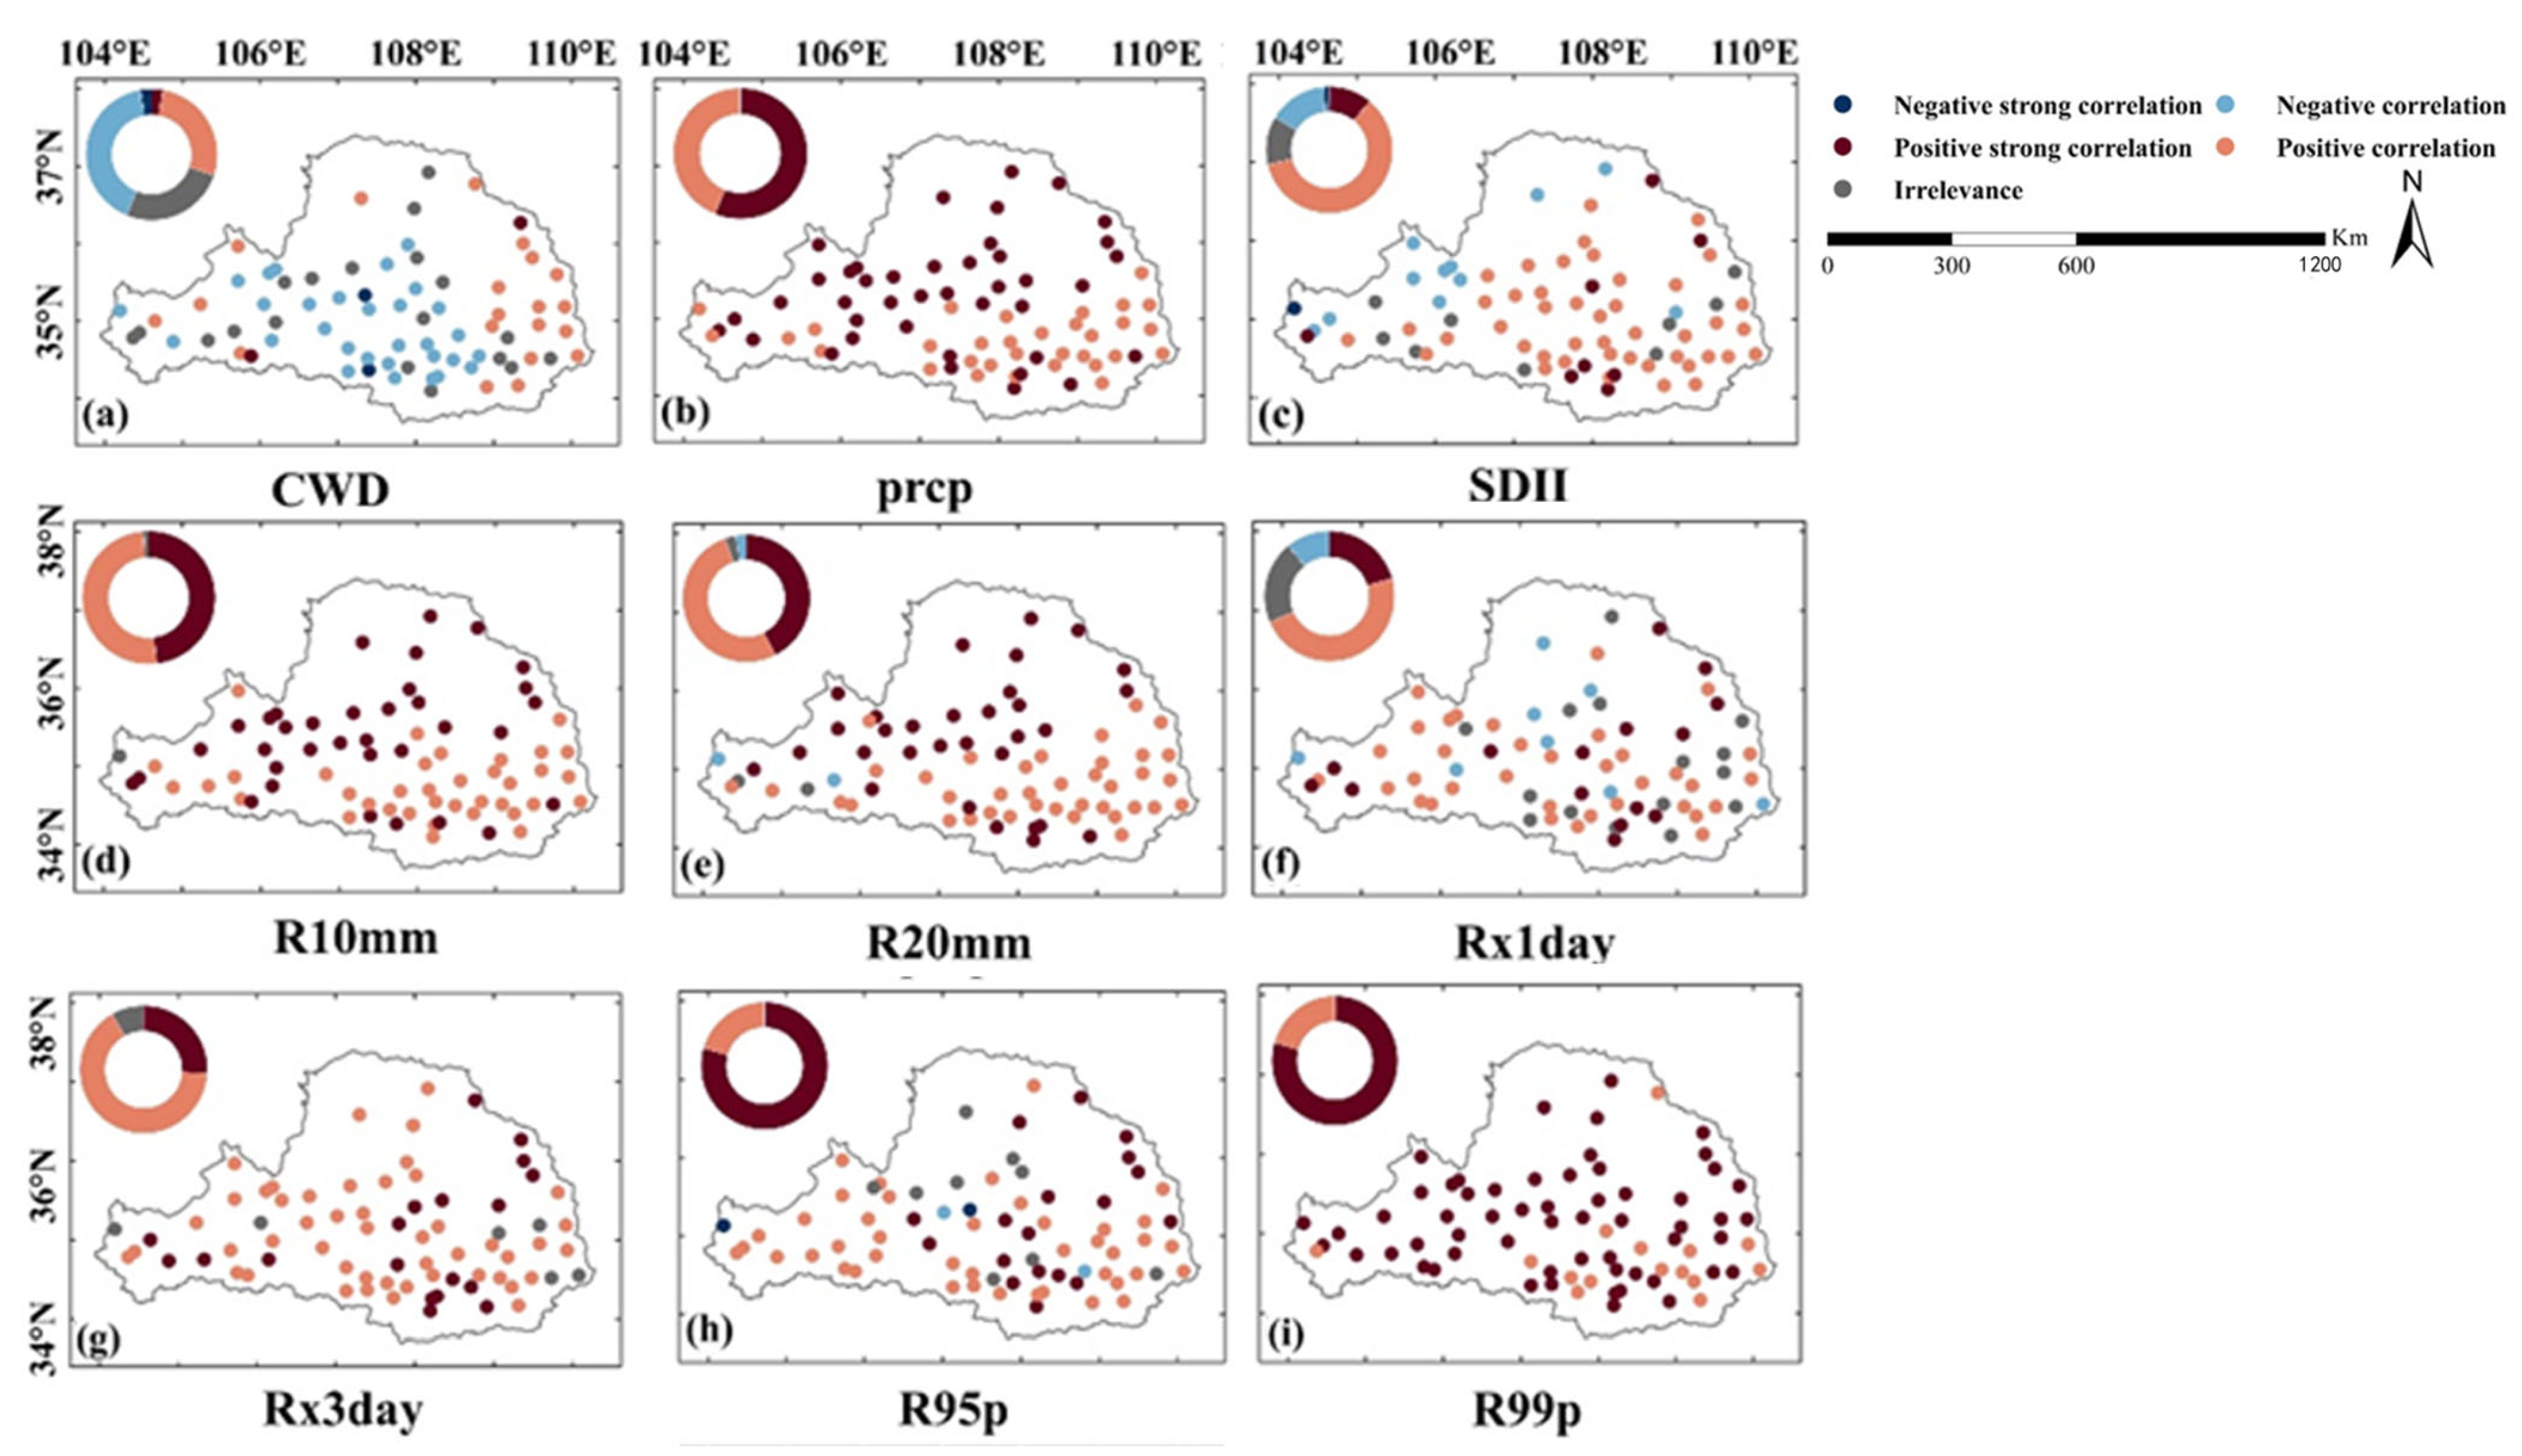
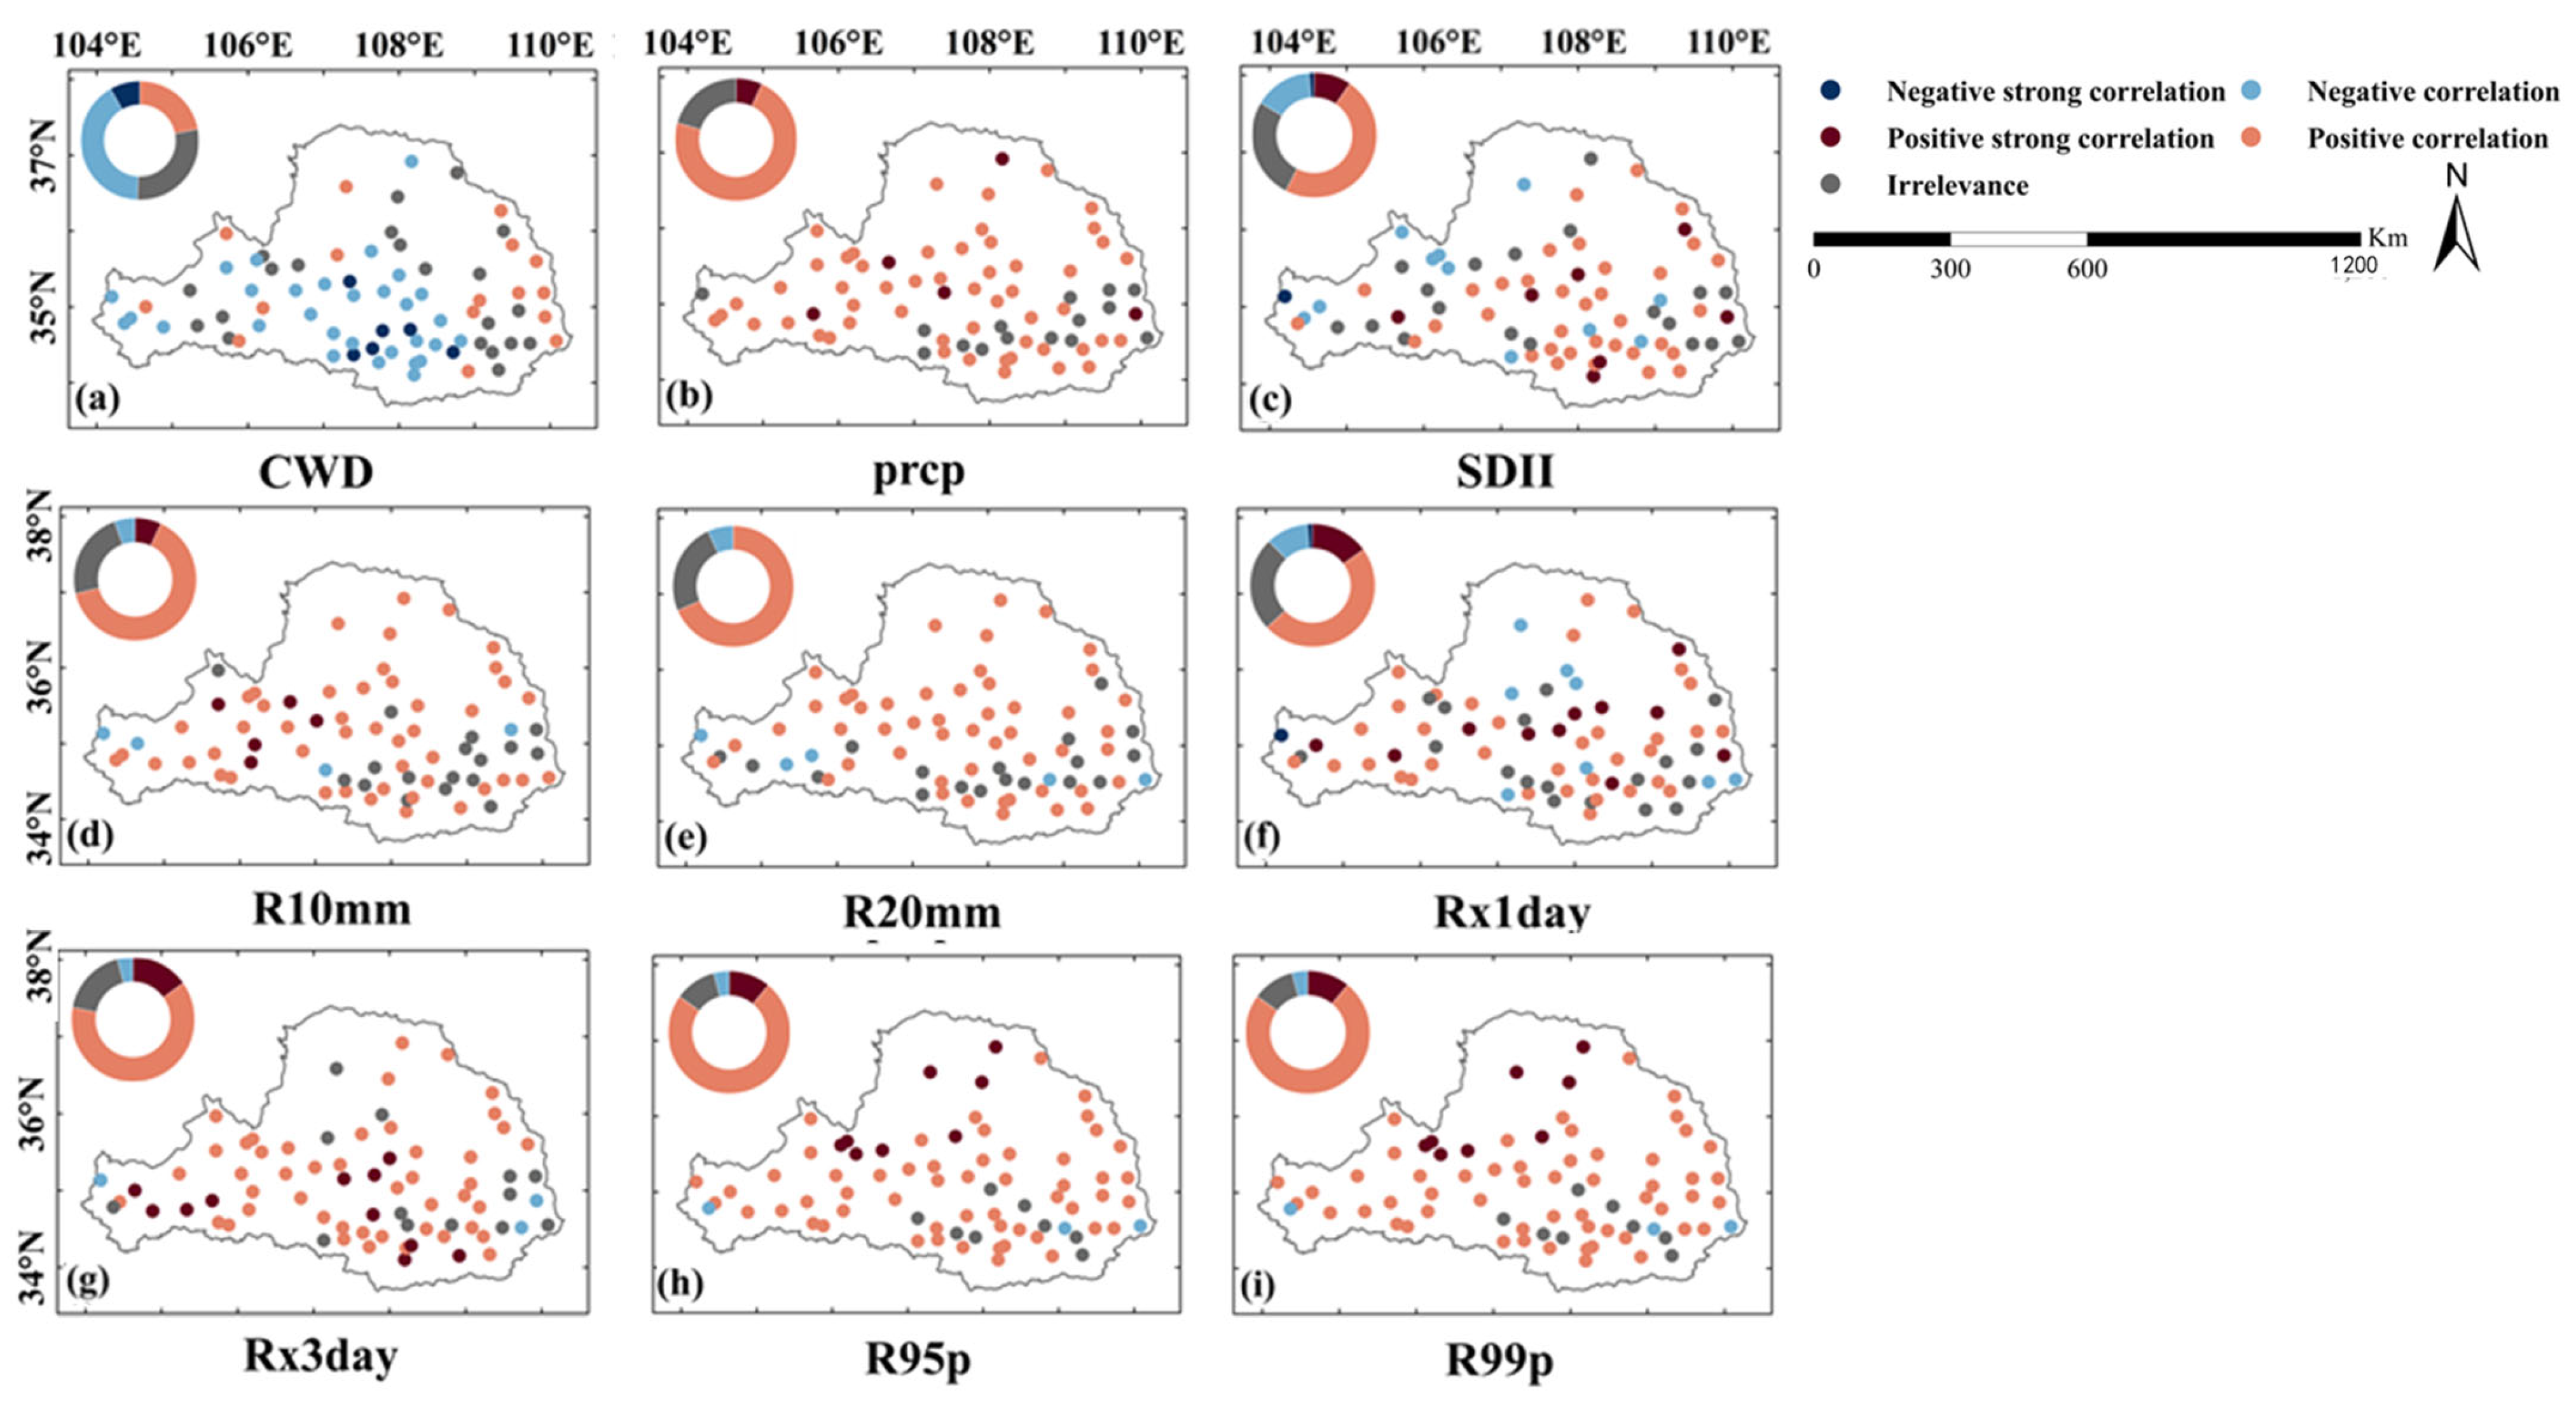
3.4. Impact of Climatic Factors on Extreme Precipitation
4. Conclusions and Discussion
- (1)
- The extreme precipitation events in the southern area of the Wei River Basin are more pronounced, with significantly higher extreme precipitation intensity and frequency indicators than those in the northern region. The maximum difference between the northern and southern regions for the three extreme precipitation indicators R1, R10, and R20 reached 40, 12, and 7 days, respectively.
- (2)
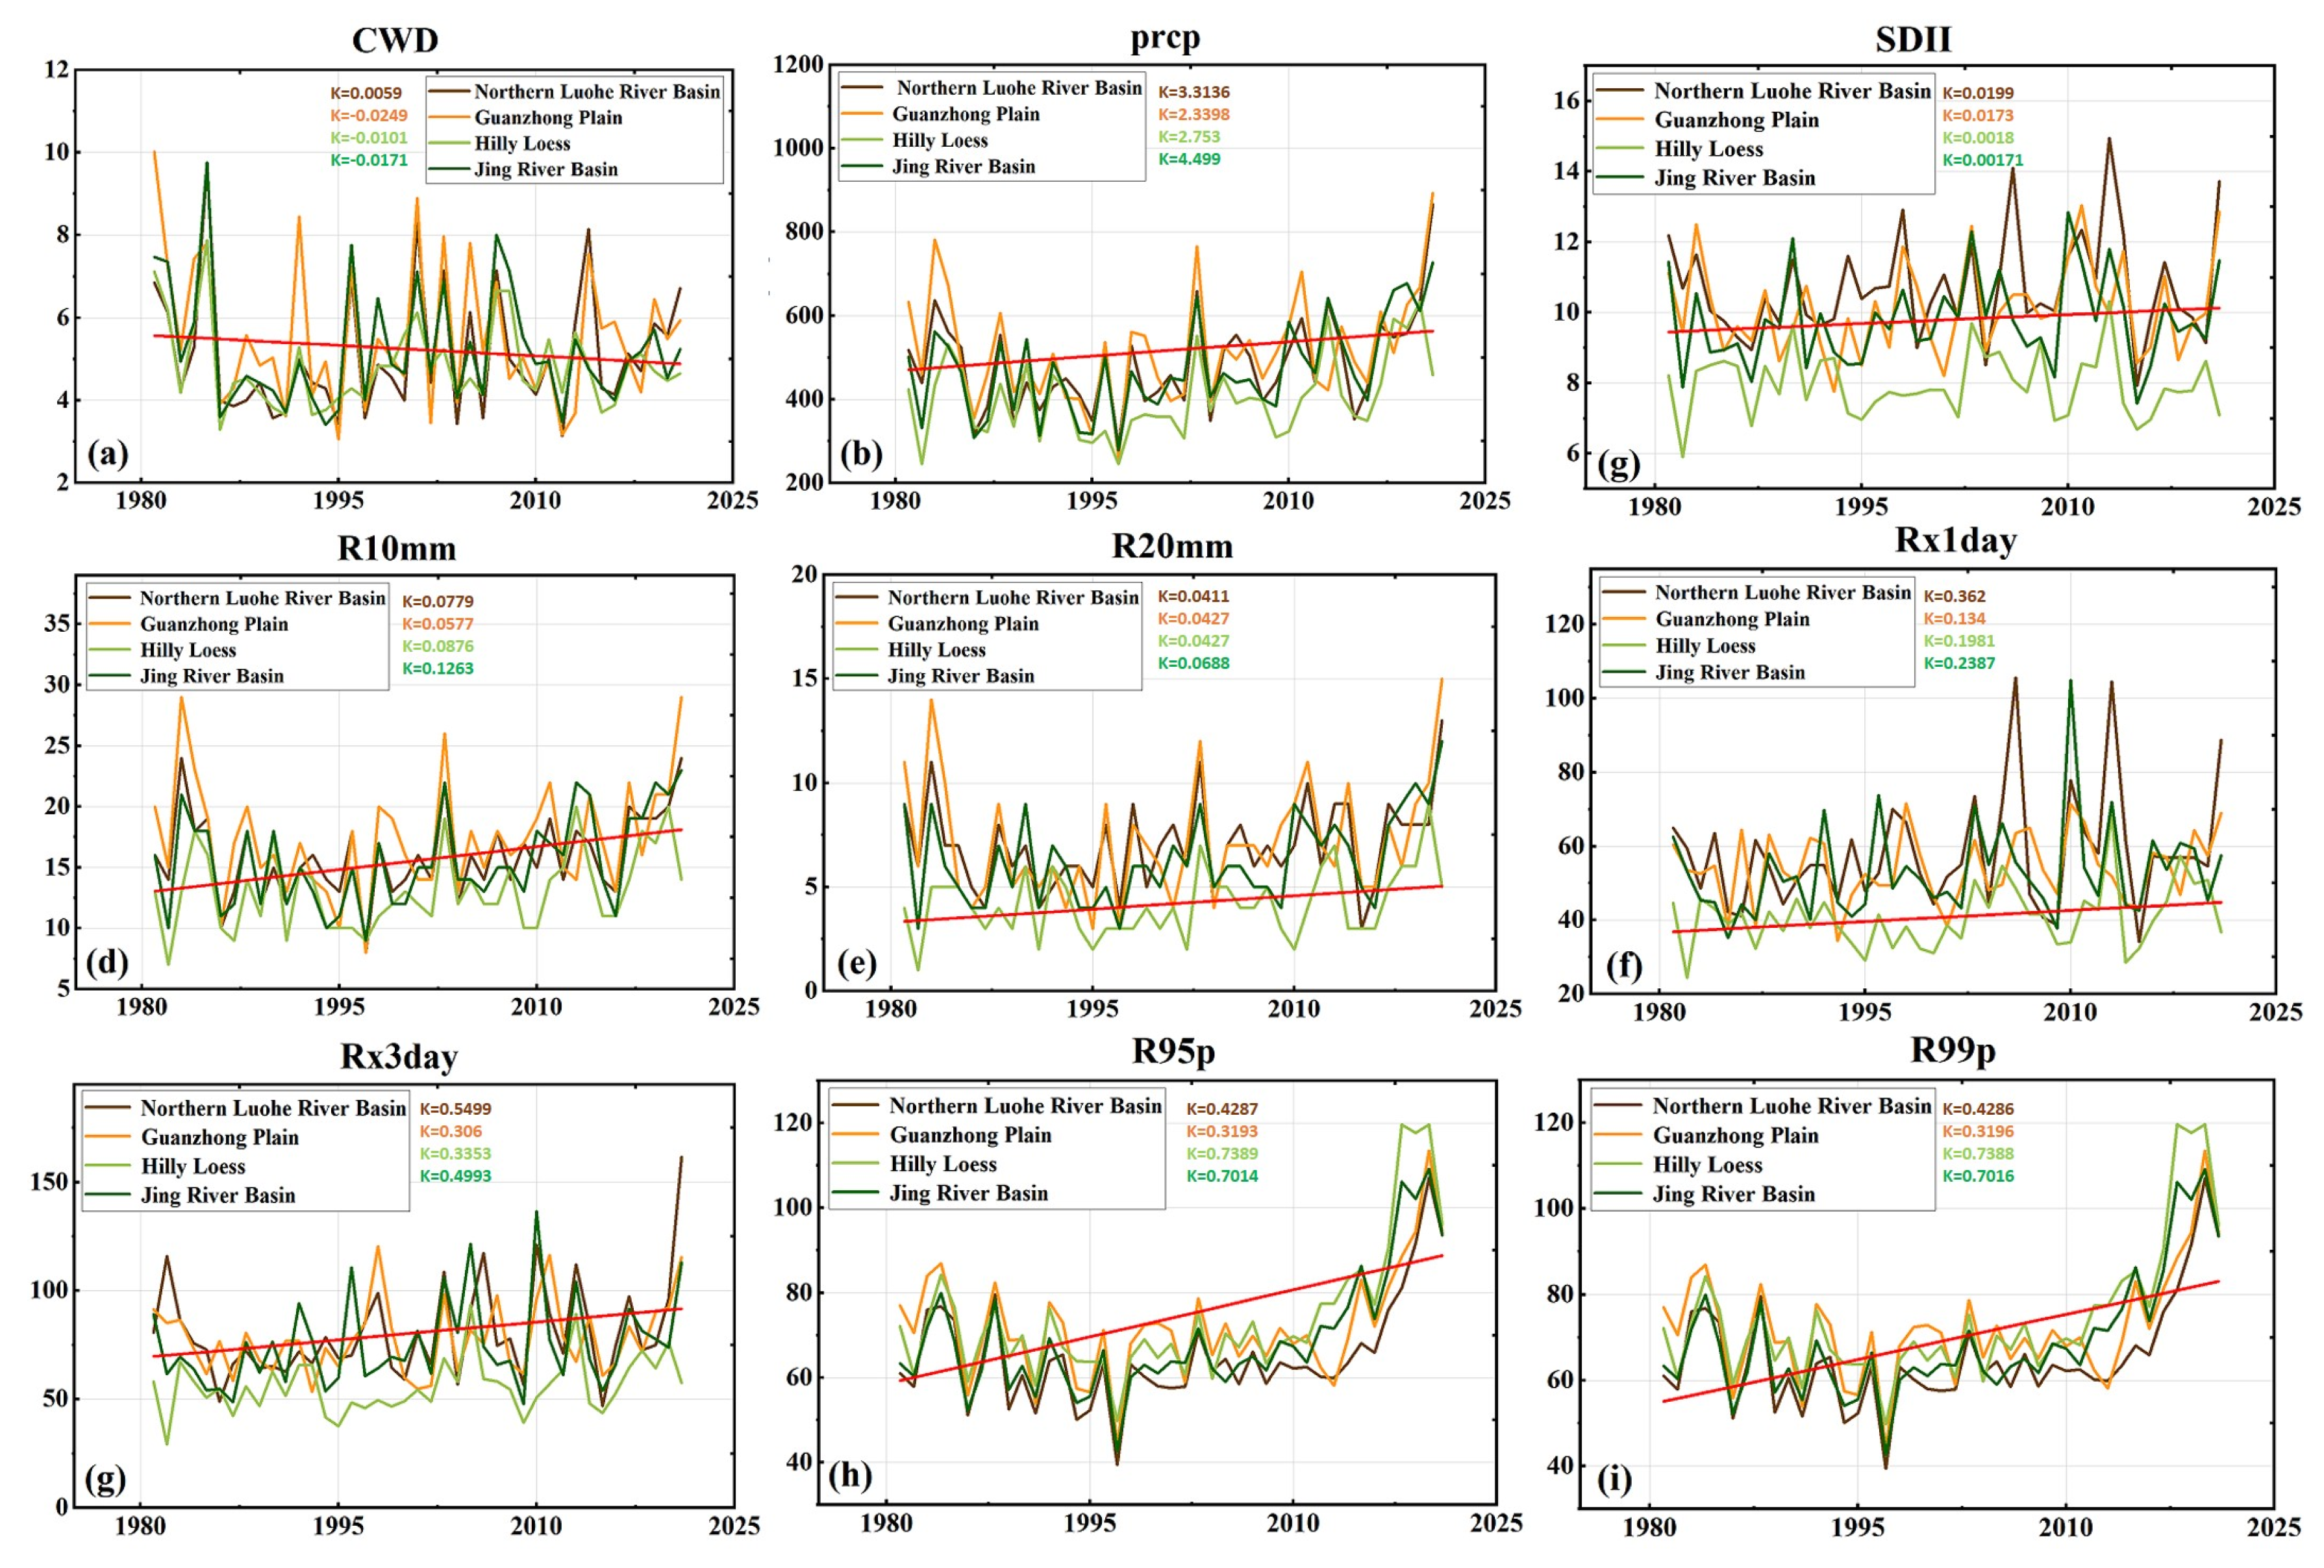
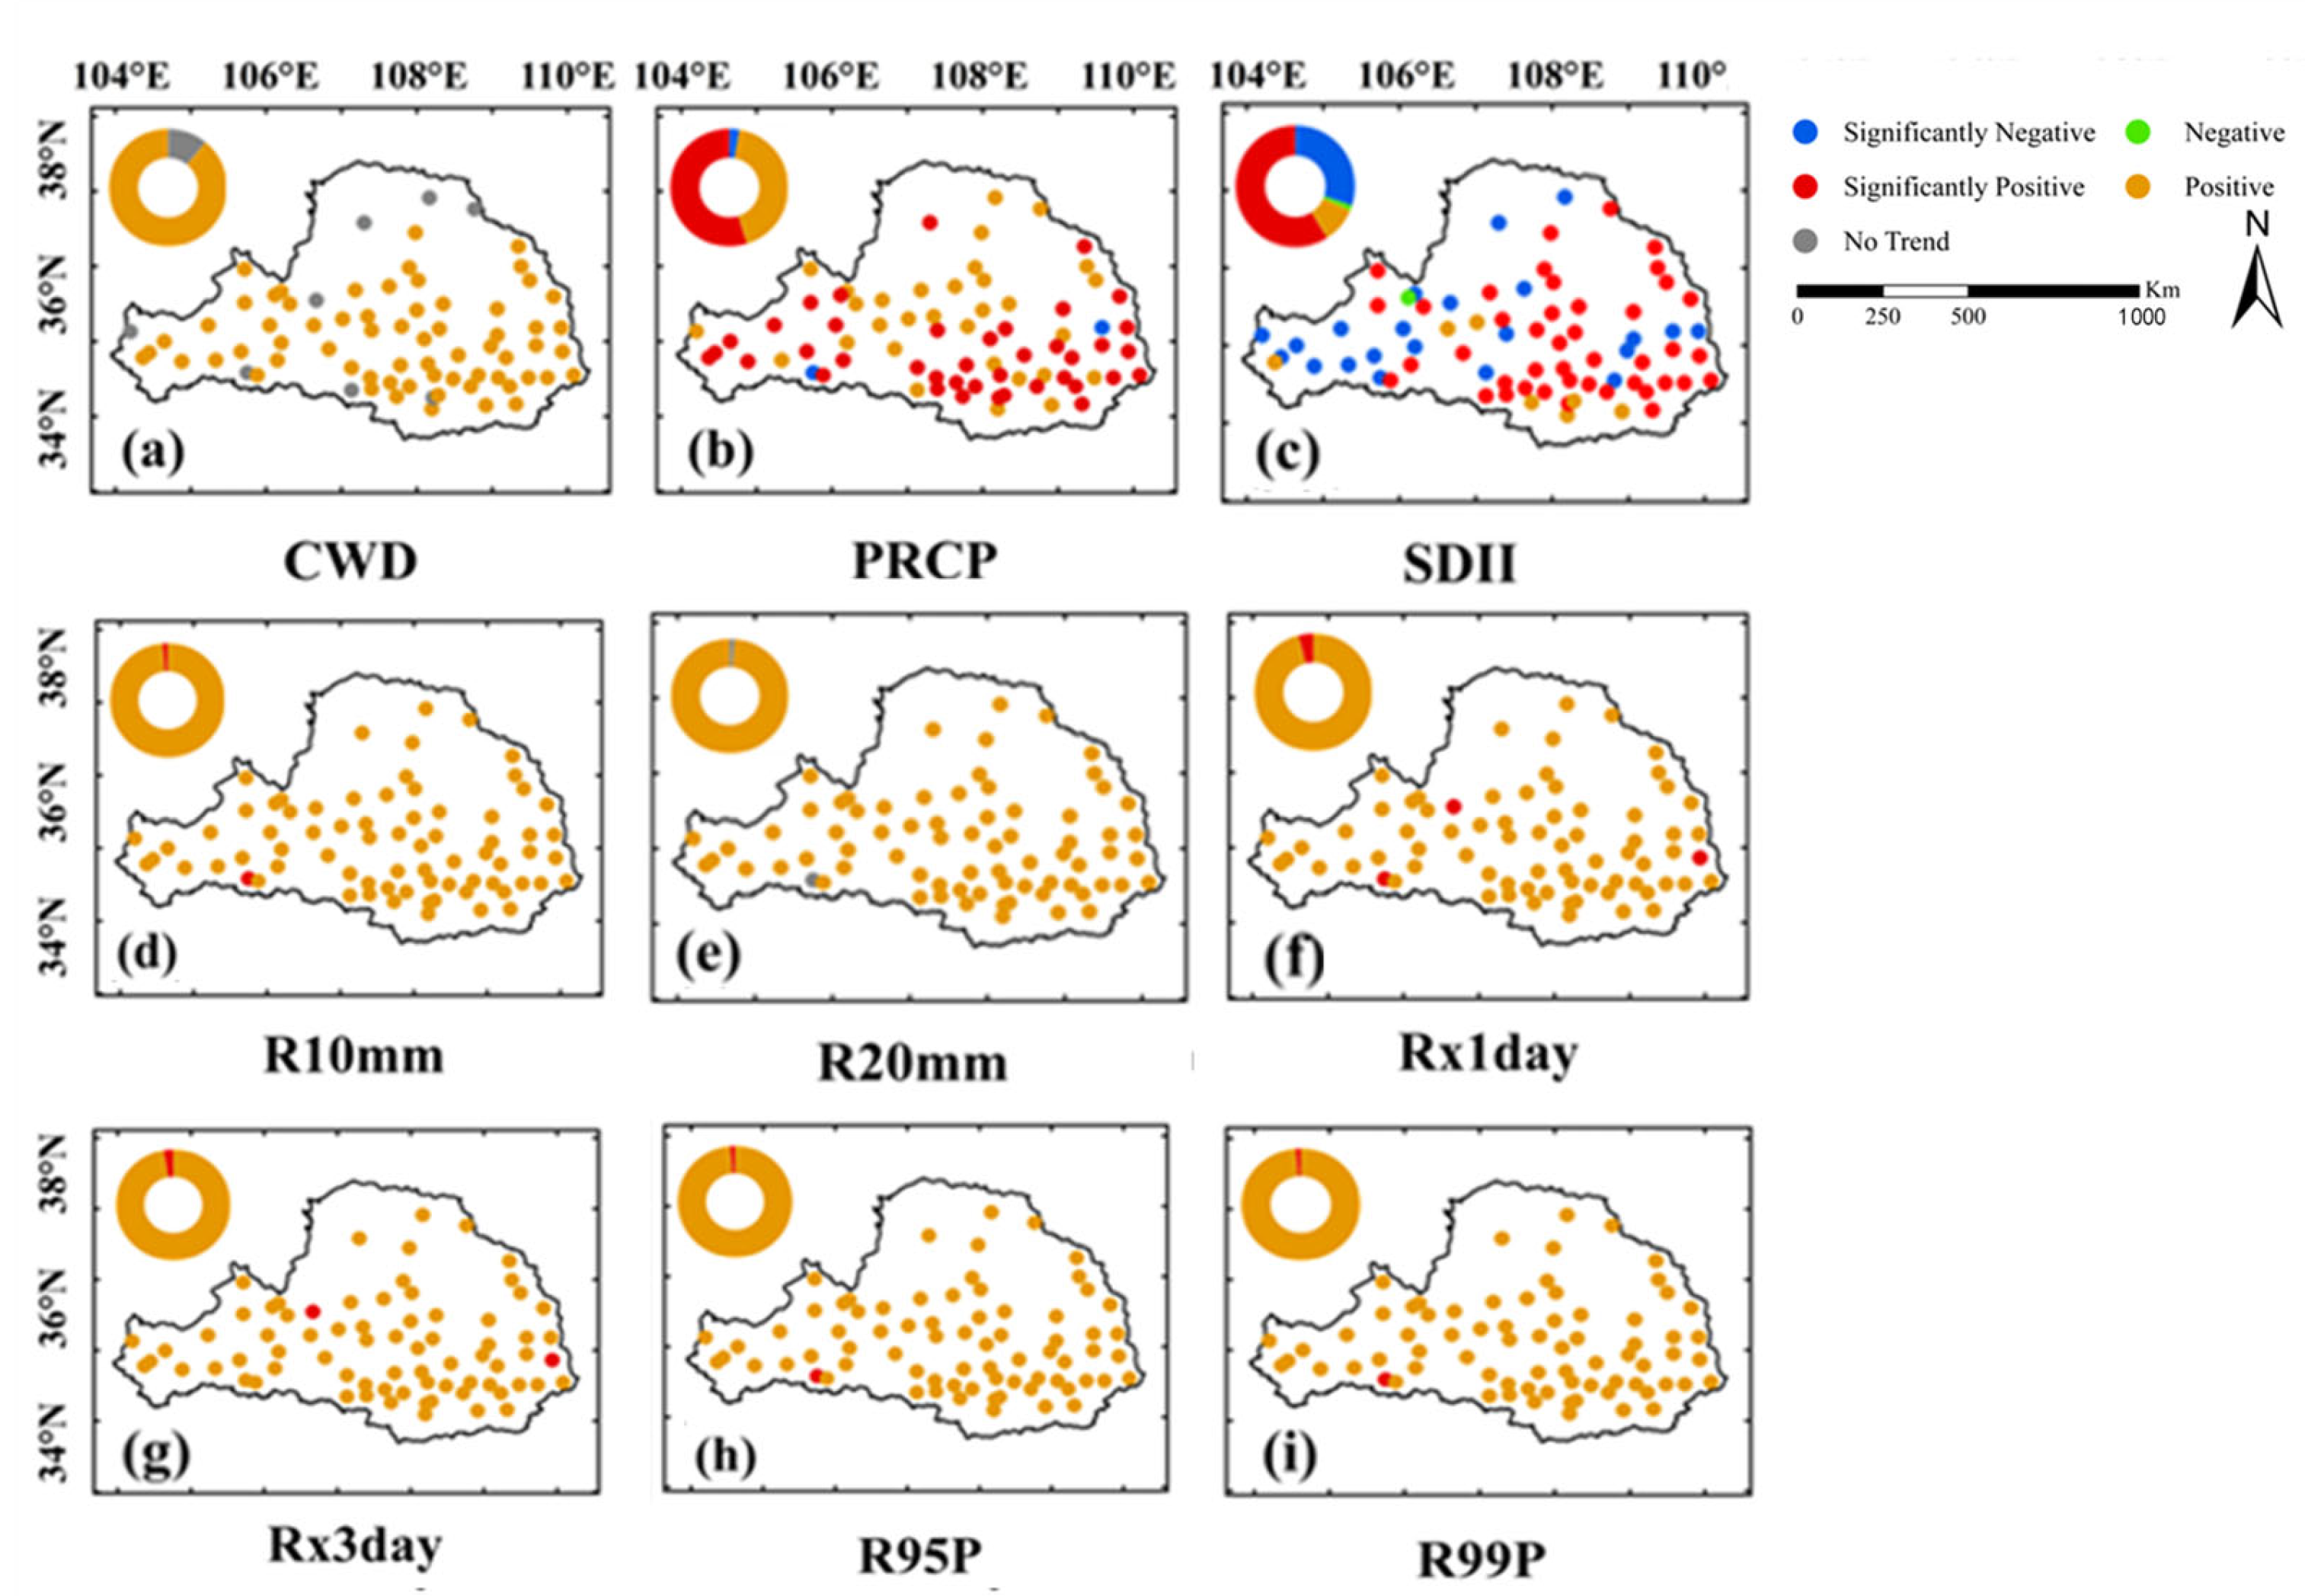
- The extreme precipitation index in most areas of the Wei River Basin showed an overall upward trend, with the most significant change occurring in the Guanzhong Plain region. The temporal variation characteristics of extreme precipitation factors were identified using the non-parametric Mann–Kendall test method. Specifically, most sites show an upward trend in EPIs and are consistent on empty. Among them, the annual variation in seven extreme precipitation indicators (CWD, R95, R99, R1, R10, Rx1day, and Rx3day) at all stations show an upward trend. The stations with an upward trend in the annual variation of the three indicators of R20, PRCP, and SDII account for 98.63%, 54.79%, and 59.8%, respectively. The overall pattern of extreme precipitation changes in four different seasons is consistent. The high values of extreme precipitation are mainly distributed in the southern or central regions, while the low-value areas are mainly in the western region. Among them, the scope and area of high-value areas in summer are more extensive.
- (3)
- Climate factors such as ENSO, LOTI, and LST are important driving factors for extreme precipitation, with LOTI and LST having the most significant relationship with extreme precipitation. Among them, ENSO events show a negative correlation with extreme precipitation with a certain lag effect, and strong ENSO events in the winter often lead to a decrease in extreme precipitation in the spring and summer of the following year.
- (4)
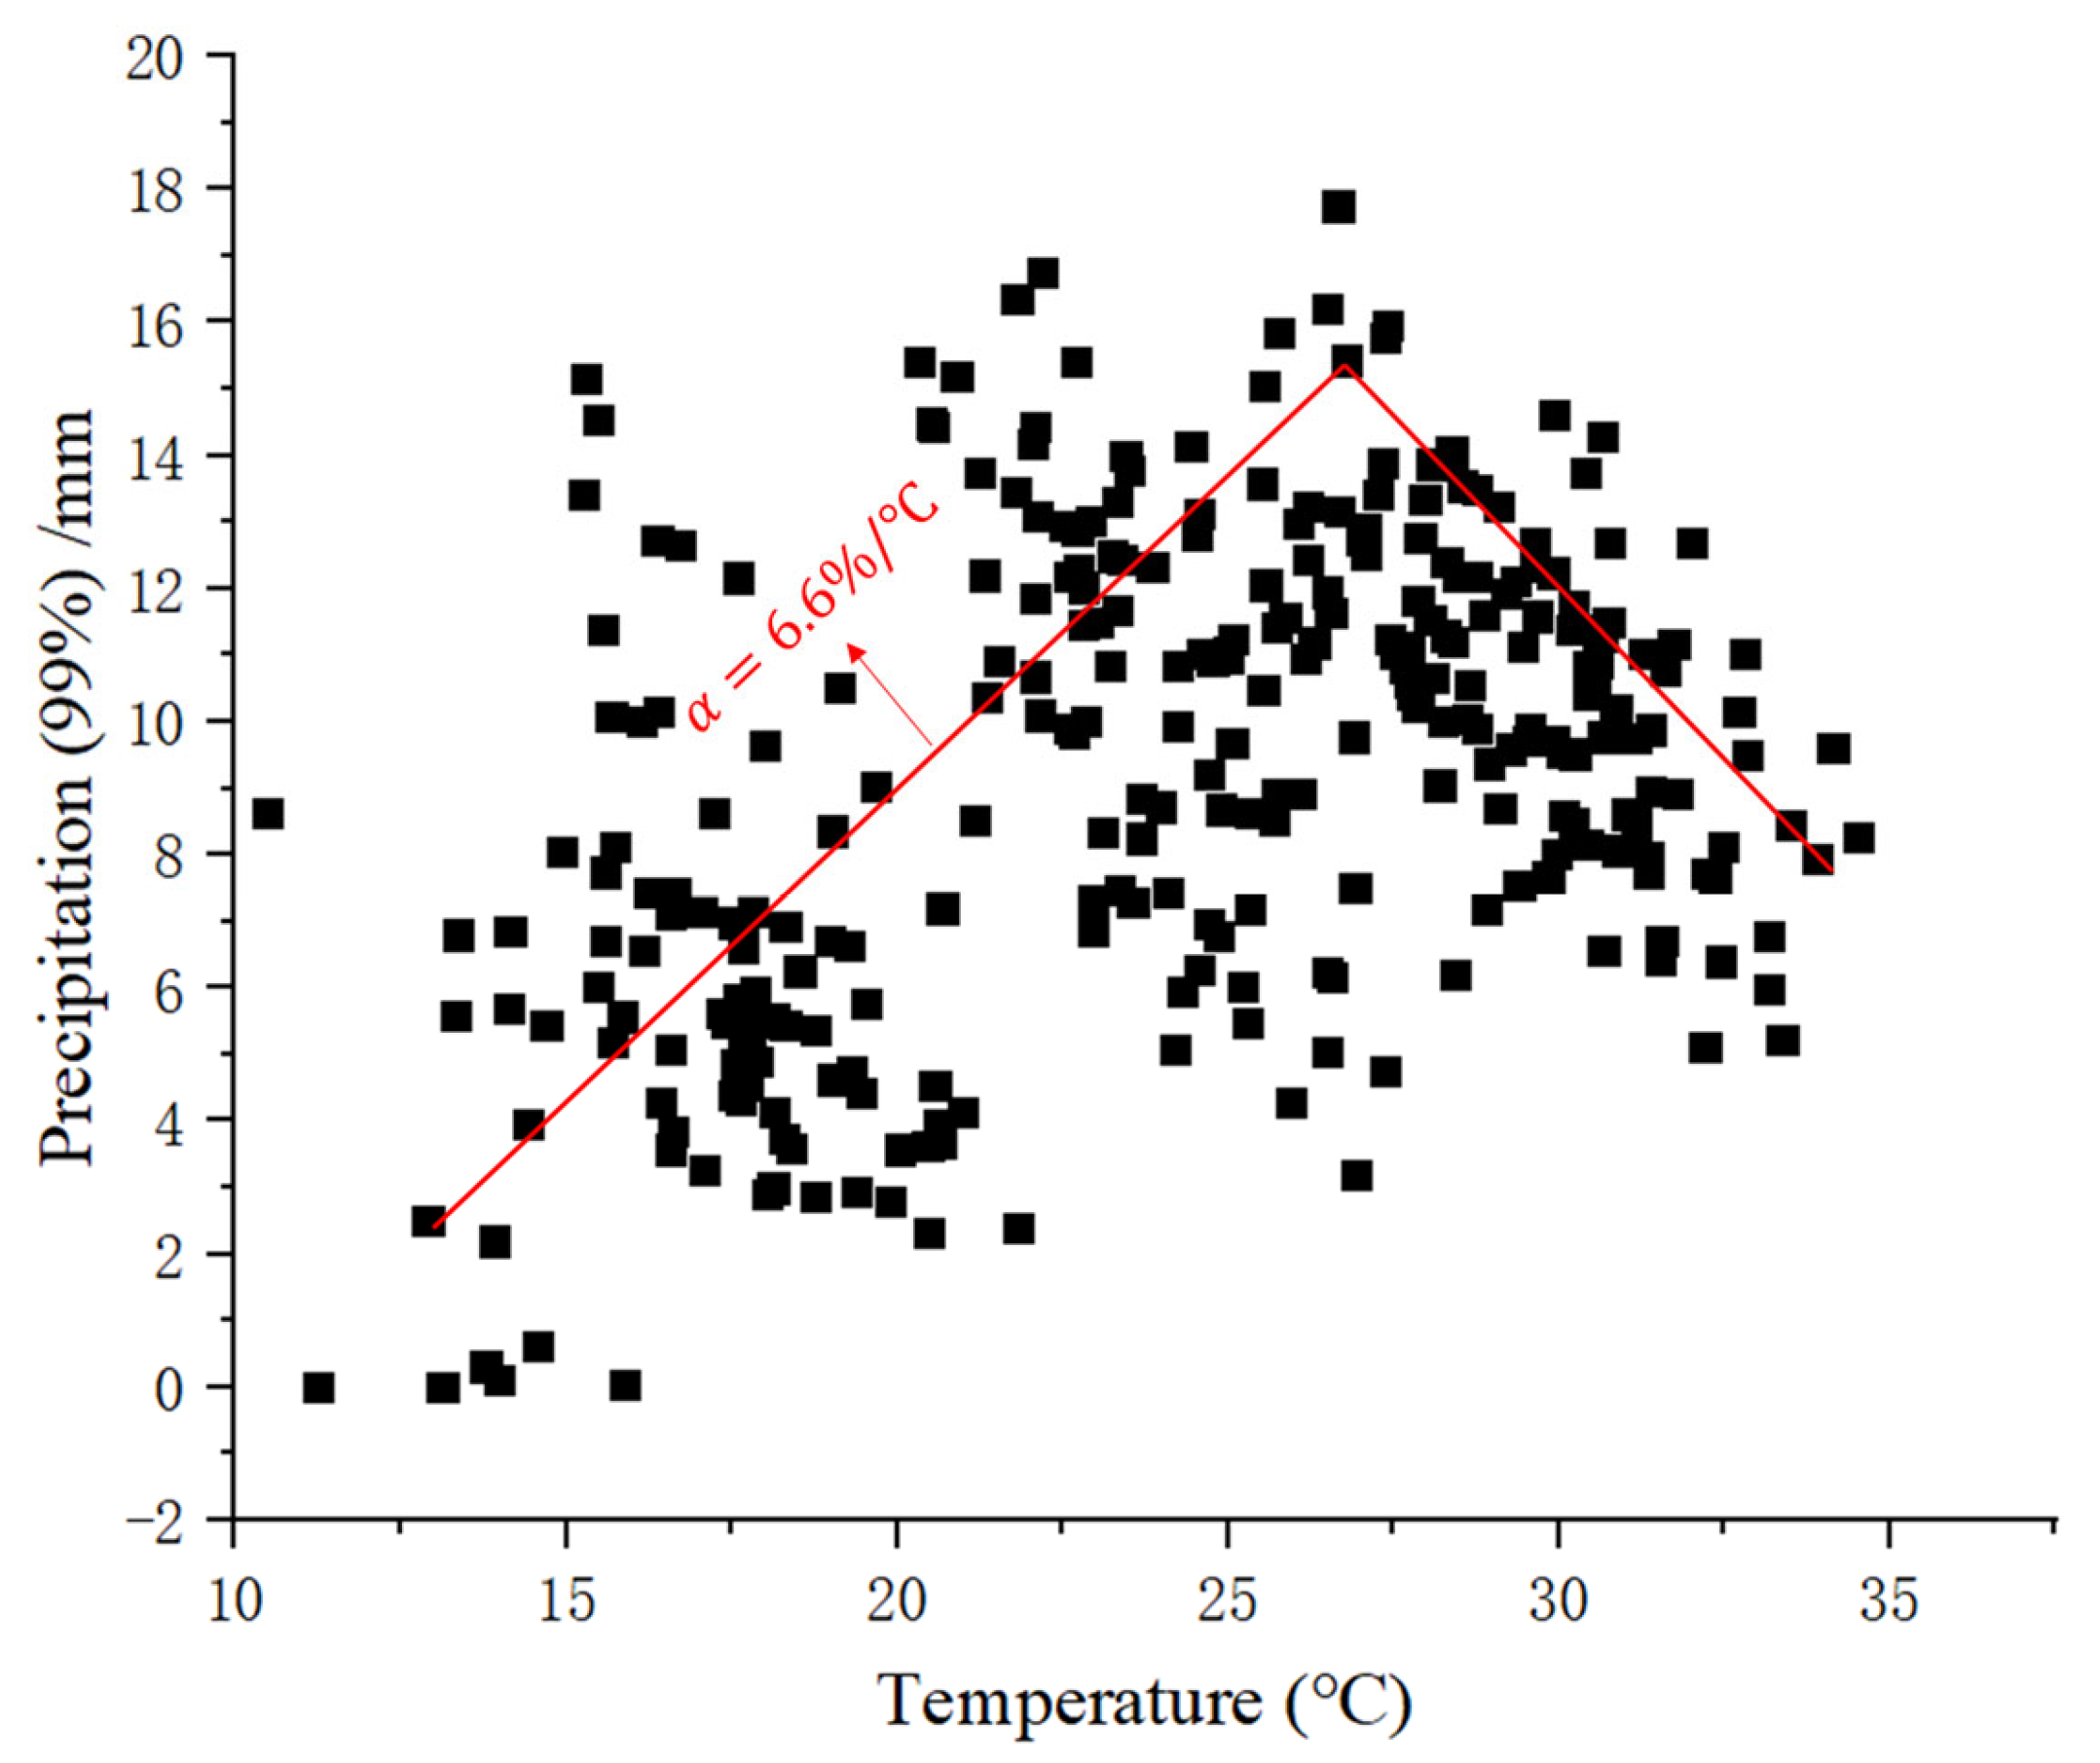
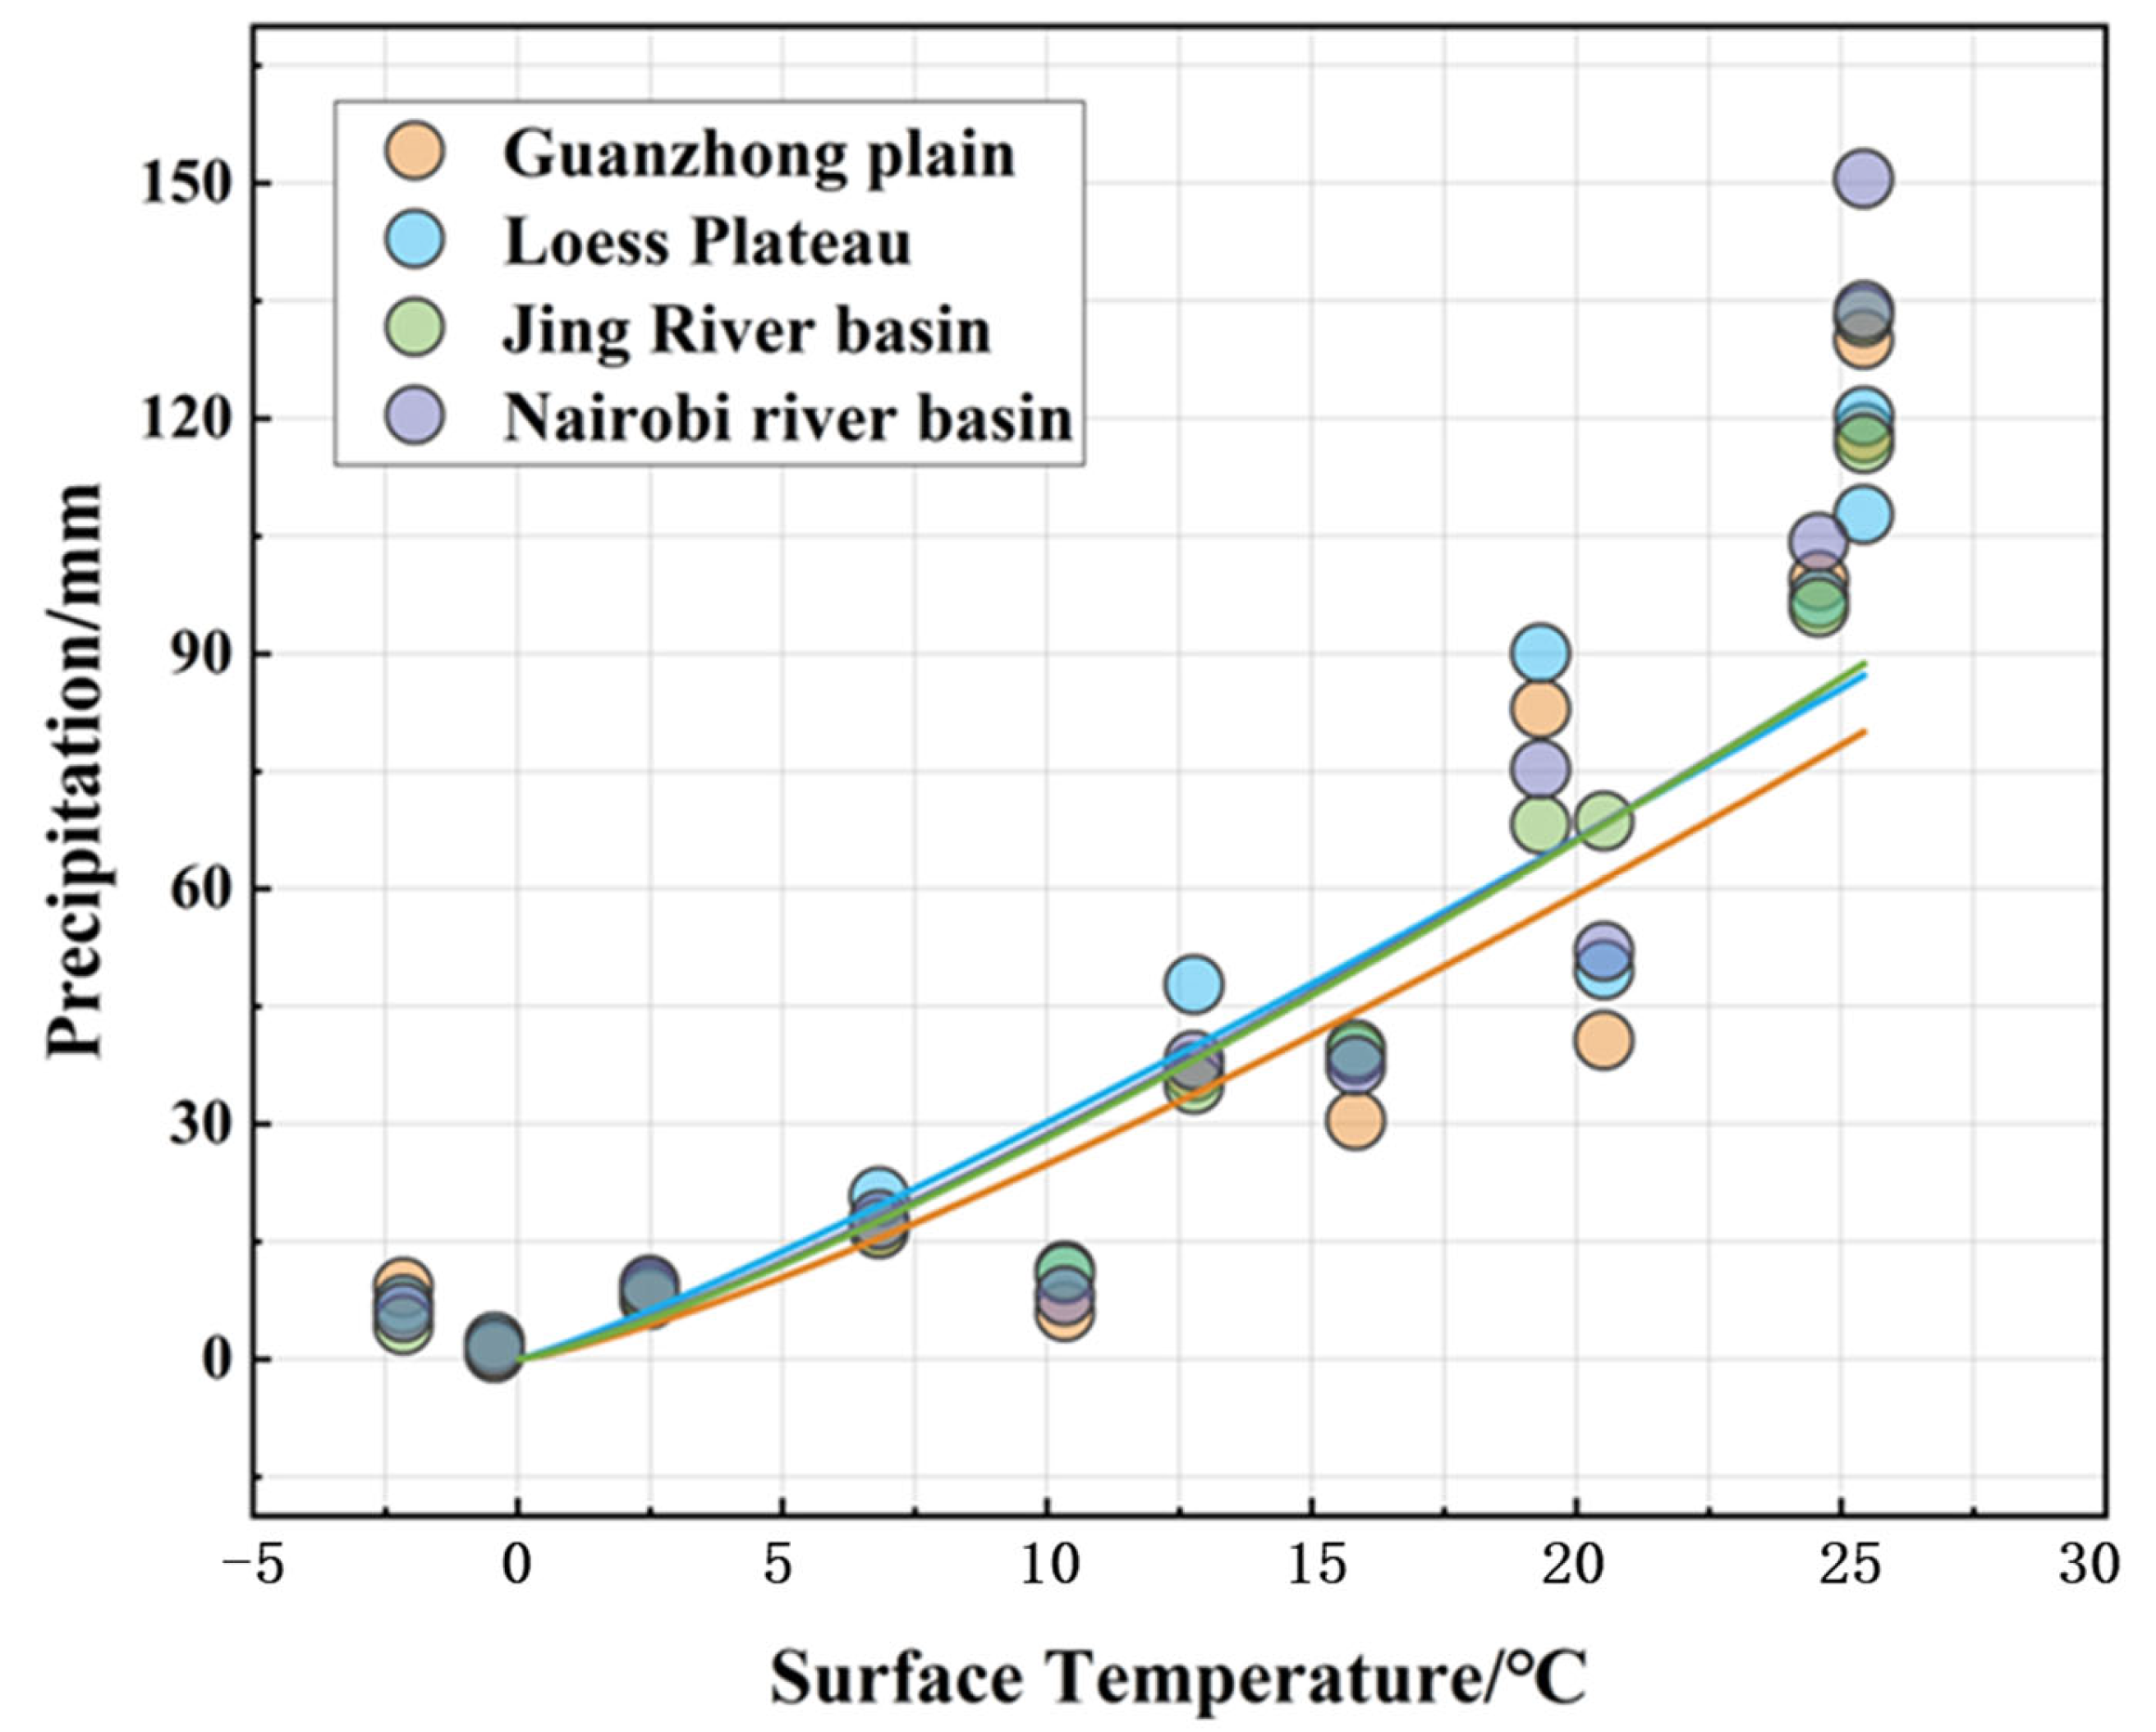
- The rise in temperature often leads to more frequent, more intense, and shorter-duration precipitation events. The relationships between extreme precipitation and temperature present a peak structure.
Author Contributions
Funding
Data Availability Statement
Conflicts of Interest
References
- Ombadi, M.; Risser, M.D.; Rhoades, A.M.; Varadharajan, C. A warming-induced reduction in snow fraction amplifies rainfall extremes. Nature 2023, 619, 305–310. [Google Scholar] [CrossRef]
- Jiang, J.; Zhou, T.; Qian, Y.; Li, C.; Song, F.; Li, H.; Chen, X.; Zhang, W.; Chen, Z. Precipitation regime changes in High Mountain Asia driven by cleaner air. Nature 2023, 623, 544–549. [Google Scholar] [CrossRef]
- IPCC. Climate Change 2021: The Physical Science Basis. Contribution of Working Group I to the Sixth Assessment Report of the Intergovernmental Panel on Climate Change; Cambridge Press: Cambridge, UK, 2023. [Google Scholar]
- Li, G.; Yu, Z.; Wang, W.; Ju, Q.; Chen, X. Analysis of the spatial Distribution of precipitation and topography with GPM data in the Tibetan Plateau. Atmos. Res. 2021, 247, 105259. [Google Scholar] [CrossRef]
- Saavedra, M.; Junquas, C.; Espinoza, J.-C.; Silva, Y. Impacts of topography and land use changes on the air surface temperature and precipitation over the central Peruvian Andes. Atmos. Res. 2020, 234, 104711. [Google Scholar] [CrossRef]
- Lu, M.; Xu, Y.; Shan, N.; Wang, Q.; Yuan, J.; Wang, J. Effect of urbanisation on extreme precipitation based on nonstationary models in the Yangtze River Delta metropolitan region. Sci. Total Environ. 2019, 673, 64–73. [Google Scholar] [CrossRef] [PubMed]
- Trenberth, K.E.; Dai, A.; Rasmussen, R.M.; Parsons, D.B. The changing character of precipitation. Bull. Am. Meteorol. Soc. 2003, 84, 1205–1218. [Google Scholar] [CrossRef]
- Li, X.; Zhang, K.; Gu, P.; Feng, H.; Yin, Y.; Chen, W.; Cheng, B. Changes in precipitation extremes in the Yangtze River Basin during 1960–2019 and the association with global warming, ENSO, and local effects. Sci. Total Environ. 2021, 760, 144244. [Google Scholar] [CrossRef] [PubMed]
- Donat, M.G.; Lowry, A.L.; Alexander, L.V.; O’Gorman, P.A.; Maher, N. More extreme precipitation in the world’s dry and wet regions. Nat. Clim. Change 2017, 7, 154–158. [Google Scholar] [CrossRef]
- Paik, S.; Min, S.K.; Zhang, X.; Donat, M.G.; King, A.D.; Sun, Q. Determining the anthropogenic greenhouse gas contribution to the observed intensification of extreme precipitation. Geophys. Res. Lett. 2020, 47, e2019GL086875. [Google Scholar] [CrossRef]
- Li, S.; Chen, Y.; Wei, W.; Fang, G.; Duan, W. The increase in extreme precipitation and its proportion over global land. J. Hydrol. 2023, 628, 130456. [Google Scholar] [CrossRef]
- Gu, X.; Zhang, Q.; Li, J.; Singh, V.P.; Sun, P. Impact of urbanization on nonstationary of annual and seasonal precipitation extremes in China. J. Hydrol. 2019, 575, 638–655. [Google Scholar] [CrossRef]
- Wei, W.; Zou, S.; Duan, W.; Chen, Y.; Li, S.; Zhou, Y. Spatiotemporal variability in extreme precipitation and associated large-scale climate mechanisms in Central Asia from 1950 to 2019. J. Hydrol. 2023, 620, 129417. [Google Scholar] [CrossRef]
- Wang, L.; Chen, S.; Zhu, W.; Ren, H.; Zhang, L.; Zhu, L. Spatiotemporal variations of extreme precipitation and its potential driving factors in China’s North-South Transition Zone during 1960–2017. Atmos. Res. 2021, 252, 105429. [Google Scholar] [CrossRef]
- Nigussie, T.A.; Altunkaynak, A. Impacts of climate change on the trends of extreme rainfall indices and values of maximum precipitation at Olimpiyat Station, Istanbul, Turkey. Theor. Appl. Climatol. 2019, 135, 1501–1515. [Google Scholar] [CrossRef]
- Tong, S.; Li, X.; Zhang, J.; Bao, Y.; Bao, Y.; Na, L.; Si, A. Spatial and temporal variability in extreme temperature and precipitation events in Inner Mongolia (China) during 1960–2017. Sci. Total Environ. 2019, 649, 75–89. [Google Scholar] [CrossRef] [PubMed]
- Jiang, R.; Xie, J.; Zhao, Y.; He, H.; He, G. Spatiotemporal variability of extreme precipitation in Shaanxi province under climate change. Theor. Appl. Climatol. 2017, 130, 831–845. [Google Scholar] [CrossRef]
- Li, X.; Wang, X.; Babovic, V. Analysis of variability and trends of precipitation extremes in Singapore during 1980–2013. Int. J. Climatol. 2018, 38, 125–141. [Google Scholar] [CrossRef]
- Londoño Arteaga, V.; Lima, C.H.R. Analysis of CMIP 5 simulations of key climate indices associated with the South America monsoon system. Int. J. Climatol. 2021, 41, 404–422. [Google Scholar] [CrossRef]
- Croitoru, A.E.; Piticar, A.; Burada, D.C. Changes in precipitation extremes in Romania. Quat. Int. 2016, 415, 325–335. [Google Scholar] [CrossRef]
- Nashwan, M.S.; Shahid, S.; Abd Rahim, N. Unidirectional trends in annual and seasonal climate and extremes in Egypt. Theor. Appl. Climatol. 2019, 136, 457–473. [Google Scholar] [CrossRef]
- Chen, G.; Xiao, B.; Wei, L.; Liao, Z.; Li, J.; Zhu, Z. Analysis of global land-based ocean temperature indices based on time series analysis. In Proceedings of the 2022 IEEE 6th Advanced Information Technology, Electronic and Automation Control Conference (IAEAC), Beijing, China, 3–5 October 2022; pp. 679–683. [Google Scholar]
- Wallace, C.; Joshi, M. Comparison of land–ocean warming ratios in updated observed records and CMIP5 climate models. Environ. Res. Lett. 2018, 13, 114011. [Google Scholar] [CrossRef]
- Ghaderpour, E.; Ben Abbes, A.; Rhif, M.; Pagiatakis, S.D.; Farah, I.R. Non-stationary and unequally spaced NDVI time series analyses by the LSWAVE software. Int. J. Remote Sens. 2020, 41, 2374–2390. [Google Scholar] [CrossRef]
- Allen, M.R.; Ingram, W.J. Constraints on future changes in climate and the hydrologic cycle. Nature 2002, 419, 224–232. [Google Scholar] [CrossRef] [PubMed]
- Hardwick Jones, R.; Westra, S.; Sharma, A. Observed relationships between extreme sub-daily precipitation, surface temperature, and relative humidity. Geophys. Res. Lett. 2010, 37, L22805. [Google Scholar] [CrossRef]

| Type | Index | Define | Units |
|---|---|---|---|
| R10mm | Total number of days with annual daily precipitation >10 mm | d | |
| R20mm | Total number of days with annual daily precipitation >1 mm | d | |
| Intensity index | Rx1day | Annual maximum daily precipitation | mm |
| Rx3day | Annual maximum 3-day precipitation | mm | |
| R95p | Annual accumulated precipitation with daily precipitation >95% quantile | mm | |
| R99p | Annual accumulated precipitation with daily precipitation >99% quantile | mm | |
| SDII | The ratio of the total amount of precipitation ≥1 mm to the number of days | mm/d | |
| PRCPTOT | Annual accumulated precipitation with daily precipitation >1 mm | mm | |
| Duration index | CWD | The longest duration of daily precipitation >1 mm | d |
Disclaimer/Publisher’s Note: The statements, opinions and data contained in all publications are solely those of the individual author(s) and contributor(s) and not of MDPI and/or the editor(s). MDPI and/or the editor(s) disclaim responsibility for any injury to people or property resulting from any ideas, methods, instructions or products referred to in the content. |
© 2024 by the authors. Licensee MDPI, Basel, Switzerland. This article is an open access article distributed under the terms and conditions of the Creative Commons Attribution (CC BY) license (https://creativecommons.org/licenses/by/4.0/).
Share and Cite
Yu, Y.; Wang, M.; Liu, Z.; Liu, T. Spatial and Temporal Variability Characteristics and Driving Factors of Extreme Precipitation in the Wei River Basin. Water 2024, 16, 217. https://doi.org/10.3390/w16020217
Yu Y, Wang M, Liu Z, Liu T. Spatial and Temporal Variability Characteristics and Driving Factors of Extreme Precipitation in the Wei River Basin. Water. 2024; 16(2):217. https://doi.org/10.3390/w16020217
Chicago/Turabian StyleYu, Yingdong, Mengran Wang, Zihua Liu, and Tong Liu. 2024. "Spatial and Temporal Variability Characteristics and Driving Factors of Extreme Precipitation in the Wei River Basin" Water 16, no. 2: 217. https://doi.org/10.3390/w16020217
APA StyleYu, Y., Wang, M., Liu, Z., & Liu, T. (2024). Spatial and Temporal Variability Characteristics and Driving Factors of Extreme Precipitation in the Wei River Basin. Water, 16(2), 217. https://doi.org/10.3390/w16020217