Article

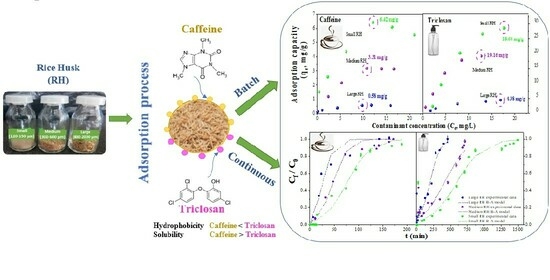
Efficient Decontamination: Caffeine/Triclosan Removal using Rice Husk in Batch and Fixed-Bed Columns

by
Cristina E. Almeida-Naranjo
1,*,
Jeniffer Cuestas
2,
Victor H. Guerrero
3,* and
Cristina A. Villamar-Ayala
4,5
1
Departamento de Ciencias de Alimentos y Biotecnología, Facultad de Ingeniería Química y Agroindustrial, Escuela Politécnica Nacional, Ladrón de Guevara E11-253, Quito P.O. Box 17-01-25, Ecuador
2
Department of Civil and Environmental Engineering, Escuela Politécnica Nacional, Ladrón de Guevara E11-253, Quito P.O. Box 17-01-25, Ecuador
3
Department of Materials, Escuela Politécnica Nacional, Ladrón de Guevara E11-253, Quito P.O. Box 17-05-25, Ecuador
4
Departamento de Ingeniería en Obras Civiles, Facultad de Ingeniería, Universidad Santiago de Chile (USACH), Av. Victor Jara 3659, Santiago P.O. Box 91-70-124, Chile
5
Programa para el Desarrollo de Sistemas Productivos Sostenibles, Facultad de Ingeniería, Universidad de Santiago de Chile (USACH), Av. Victor Jara 3769, Santiago P.O. Box 91-70-124, Chile
*
Authors to whom correspondence should be addressed.
Water 2024, 16(2), 197; https://doi.org/10.3390/w16020197
Submission received: 23 August 2023 / Revised: 11 October 2023 / Accepted: 12 October 2023 / Published: 5 January 2024
(This article belongs to the Section Wastewater Treatment and Reuse)

Abstract

:
Abundant, easily accessible, and low-cost agro-industrial residues represent attractive alternatives for removing emerging contaminants from water. In this work, the aqueous adsorption of caffeine/triclosan onto rice husk (RH) was studied in batch and continuous processes. For this purpose, adsorbents with three particle size ranges (120–150, 300–600, 800–2000 µm) were prepared and evaluated. The composition, structure, surface morphology, functionality, and specific surface area of the RH biosorbents were determined. This characterization revealed that RH primarily consists of lignin, cellulose, and hemicellulose, making up to 80.1% of its composition. RH also exhibited an irregular surface, with several functional groups (OH, C=O, CH, C=C, C-OH), and a relatively small specific surface area (1.18 m2/g). Batch tests were carried out using different RH sizes, doses (1–50 g/L), and contact times (5–300 min), using 20 mL of caffeine/triclosan solutions (30 mg/L). Tests were conducted to fit the most adequate kinetics and isotherm models. The optimal doses (g/L) for caffeine and triclosan removal were 4.5 and 1.5 with small RH, 8.5 and 2.5 with medium RH, and 50.0 and 10.0 with large RH, respectively. The optimal contact times for all three particle sizes were 180 and 60 min. Triclosan removal was greater than that of caffeine (2.5–25.5%) with all three particle sizes, requiring less adsorbent (2.5–5.0 times) and shorter times (3 times). The experimental data fit better the Sips isotherm and Elovich kinetics models. The small (120–150 µm) particles achieved the highest caffeine/triclosan batch adsorption capacities (6.3/28.6 mg/g). Continuous tests were performed on fixed-bed columns of 1 cm in diameter, packed with 4, 5, and 8 cm of RH, operated with hydraulic loading rates between 2 and 4 m3/m2day. Small particles also reached the highest adsorption capacity in the removal of caffeine (352.7 mg/L) and triclosan (3797.2 mg/L), and the experimental data were well-fitted to the Bohart–Adams model. The research results not only demonstrate the effective removal of contaminants but also illustrate the versatility and applicability of rice husk in various conditions and systems.

Graphical Abstract

1. Introduction

The removal of emerging contaminants (ECs) is a topic of growing significance in environmental management and public health [1]. These contaminants, which include substances such as antibiotics and disinfectants, have gained even greater importance in recent years due to global events such as the COVID-19 pandemic. During the pandemic, a significant increase in the consumption of chemicals was observed, with over 2000 tons of disinfectants used in Wuhan alone during March 2020 [2]. The residues of these substances are considered ECs [3]. ECs are pseudo-persistent organic substances found in low concentrations in the environment (ng/L–mg/L) [1]. They exhibit low concentrations, wide variety (100,000 chemical substances) [1] and different physical–chemical characteristics (solubility, volatility, bioaccumulation capacity, etc.). They exhibit low removal in conventional wastewater treatments: for instance, ibuprofen has 32.8% and diclofenac has no removal when treated with activated sludge at the laboratory scale [4]. This opens the possibility for ECs to reach water bodies and enter the food chain [1].
Caffeine (trimethylated xanthine, CAS 58-08-2) is an EC of great interest. It is part of the daily diet (consumed ~70 mg/person) because it is found in highly consumed beverages such as coffee, tea, and soft drinks, and is present in some medications [5]. Caffeine is water-soluble (21.6 g/L, at 25 °C), hydrophilic (log octane/water partition coefficient, log Kow = 0.5) and has a log acid dissociation constant pKa = 8.3. About 5% of ingested caffeine is not metabolized and is excreted in the urine [5]. Thus, it has been frequently found in different water bodies (surface water: 3–1500 ng/L, groundwater: 10–80 ng/L), wastewater (20–300 µg/L), and effluents from wastewater treatment plants (0.1–20 µg/L) [1]. Moreover, caffeine and its metabolites are not volatile substances, which makes them persistent (3–6 weeks under natural mineralization) in water bodies, generating toxic effects in biota and the surrounding aquatic environment [6]. Caffeine (0.6 mg/L) combined with other ECs, such as paracetamol (1.0 mg/L), can increase the reproductive activity of tadpoles of the pipiens species, altering the trophic chain since it increases the predator’s number [7].
Triclosan (5-cloro-2-(2,4-diclorofenoxi) fenol, CAS 3380-34-5) is another highly consumed EC (1500 ton/year). It is a synthetic and lipid-soluble antimicrobial agent used in healthcare (e.g., antiseptic, disinfectant), veterinary products, and personal care products (e.g., hand soaps, shampoos, deodorants, cosmetics) in concentrations between 0.1 and 2.0% [8,9]. Triclosan has low water solubility (10 mg/L, at 25 °C) and high bioaccumulation/hydrophobicity (log Kow = 4.30) and pKa = 8.1; thus, triclosan is compatible with many materials [10]. In aquatic habitats, triclosan is accumulated in sediments/sludge being deposited in agricultural areas. Triclosan has been found in surface waters (1.4–40,000 ng/L), municipal wastewater (0.07–14,000 μg/L), wastewater treatment plant effluents (23–5370 ng/L), seawater (<0.001–150 ng/L), and sediments (lake/river/other surface waters, <100–53,000 μg/kg in dry weight) [1,11]. The presence of triclosan in the environment could produce bioaccumulation (algae and snails), inhibit algae growth, show endocrine-disrupting effects, encourage the formation/accumulation of toxic by-products, and even increase the development of microbial resistance [9].
In the removal of caffeine/triclosan, several treatments have been employed, including electrooxidation, membrane filtration, advanced oxidation processes (e.g., Photo-Fenton), UV radiation + ozone catalysis, ozone oxidation, and reverse osmosis, among others [12,13,14]. These treatment methods have proven to be efficient in removing both contaminants (removal = up to 80%). However, the high infrastructure and operational costs are not the only limiting factors for their use (USD 10–450/m3), which is mainly in developing countries [12,15,16]. Additional disadvantages include variable reagent dosing, low mineralization (in the case of ozonation), high energy consumption (electrooxidation), and short lifespan due to saturation (membrane filtration, zero-valent iron particles). In contrast, adsorption using husks, seeds, fibers, and other agro-industrial residues offers significant advantages [1]. Using bio-adsorbents derived from these materials could also be profitable, since their benefits include high availability (1000 million tons annually worldwide) [17], simple conditioning, and being 28% less expensive (operating and maintenance) than conventional wastewater treatments (USD 5–200/m3) [16,18,19]. Moreover, their composition (minerals, lipids, polyphenols, and lignocellulosic compounds) allows them to have a variety of functional groups (hydroxyl, carbonyl, carboxyl, methylene, etc.) that could act as binding agents with ECs [1]. Furthermore, after their use, agro-industrial residues can find additional applications, such as composting, biogas generation, reinforcement in composite materials, and energy generation through combustion/torrefaction. This highlights their versatility and applicability in EC removal from water [1,20].
The removal of caffeine and triclosan using raw or treated agro-industrial residues (e.g., moringa seeds, grape stalk, activated carbon from coconut pulp) has achieved values around 40–80% [21,22]. Likewise, rice husk (RH) residues have demonstrated their effectiveness in the removal of various ECs. Notable results include the removal of bisphenol A (69.2%) [23], phenol (37.5–59.9%) [19], and 2,4-dichlorophenol (98%) [24]. Additionally, RH has demonstrated an adsorption capacity of 47.0 mg/g for aspirin [24], and 5.9 mg/g for triclosan [25]. These findings highlight the versatility of RH residues in removing ECs. Moreover, rice husk (RH) residues have an abundant global production (16 MT annually), and their reuse aligns with sustainable practices in line with the circular bioeconomy [1].
In this work, the removal of caffeine and triclosan from synthetic solutions using raw RH in batch tests and fixed-bed columns was studied. RH was characterized to determine how its constituents/characteristics influence the adsorption process. Batch tests were performed to determine the optimal conditions to remove both contaminants. The kinetics was determined fitting the experimental data to pseudo-first-order, pseudo-second-order, Elovich, and diffusion models. Meanwhile, Langmuir, Freundlich, and Sips models were used to model the equilibrium experimental data. Moreover, in order to determine whether RH could be used in full-scale applications (treating a greater amount of water), tests were carried out in fixed-bed columns. The data obtained were fitted to the Bohart–Adams model.

2. Materials and Methods

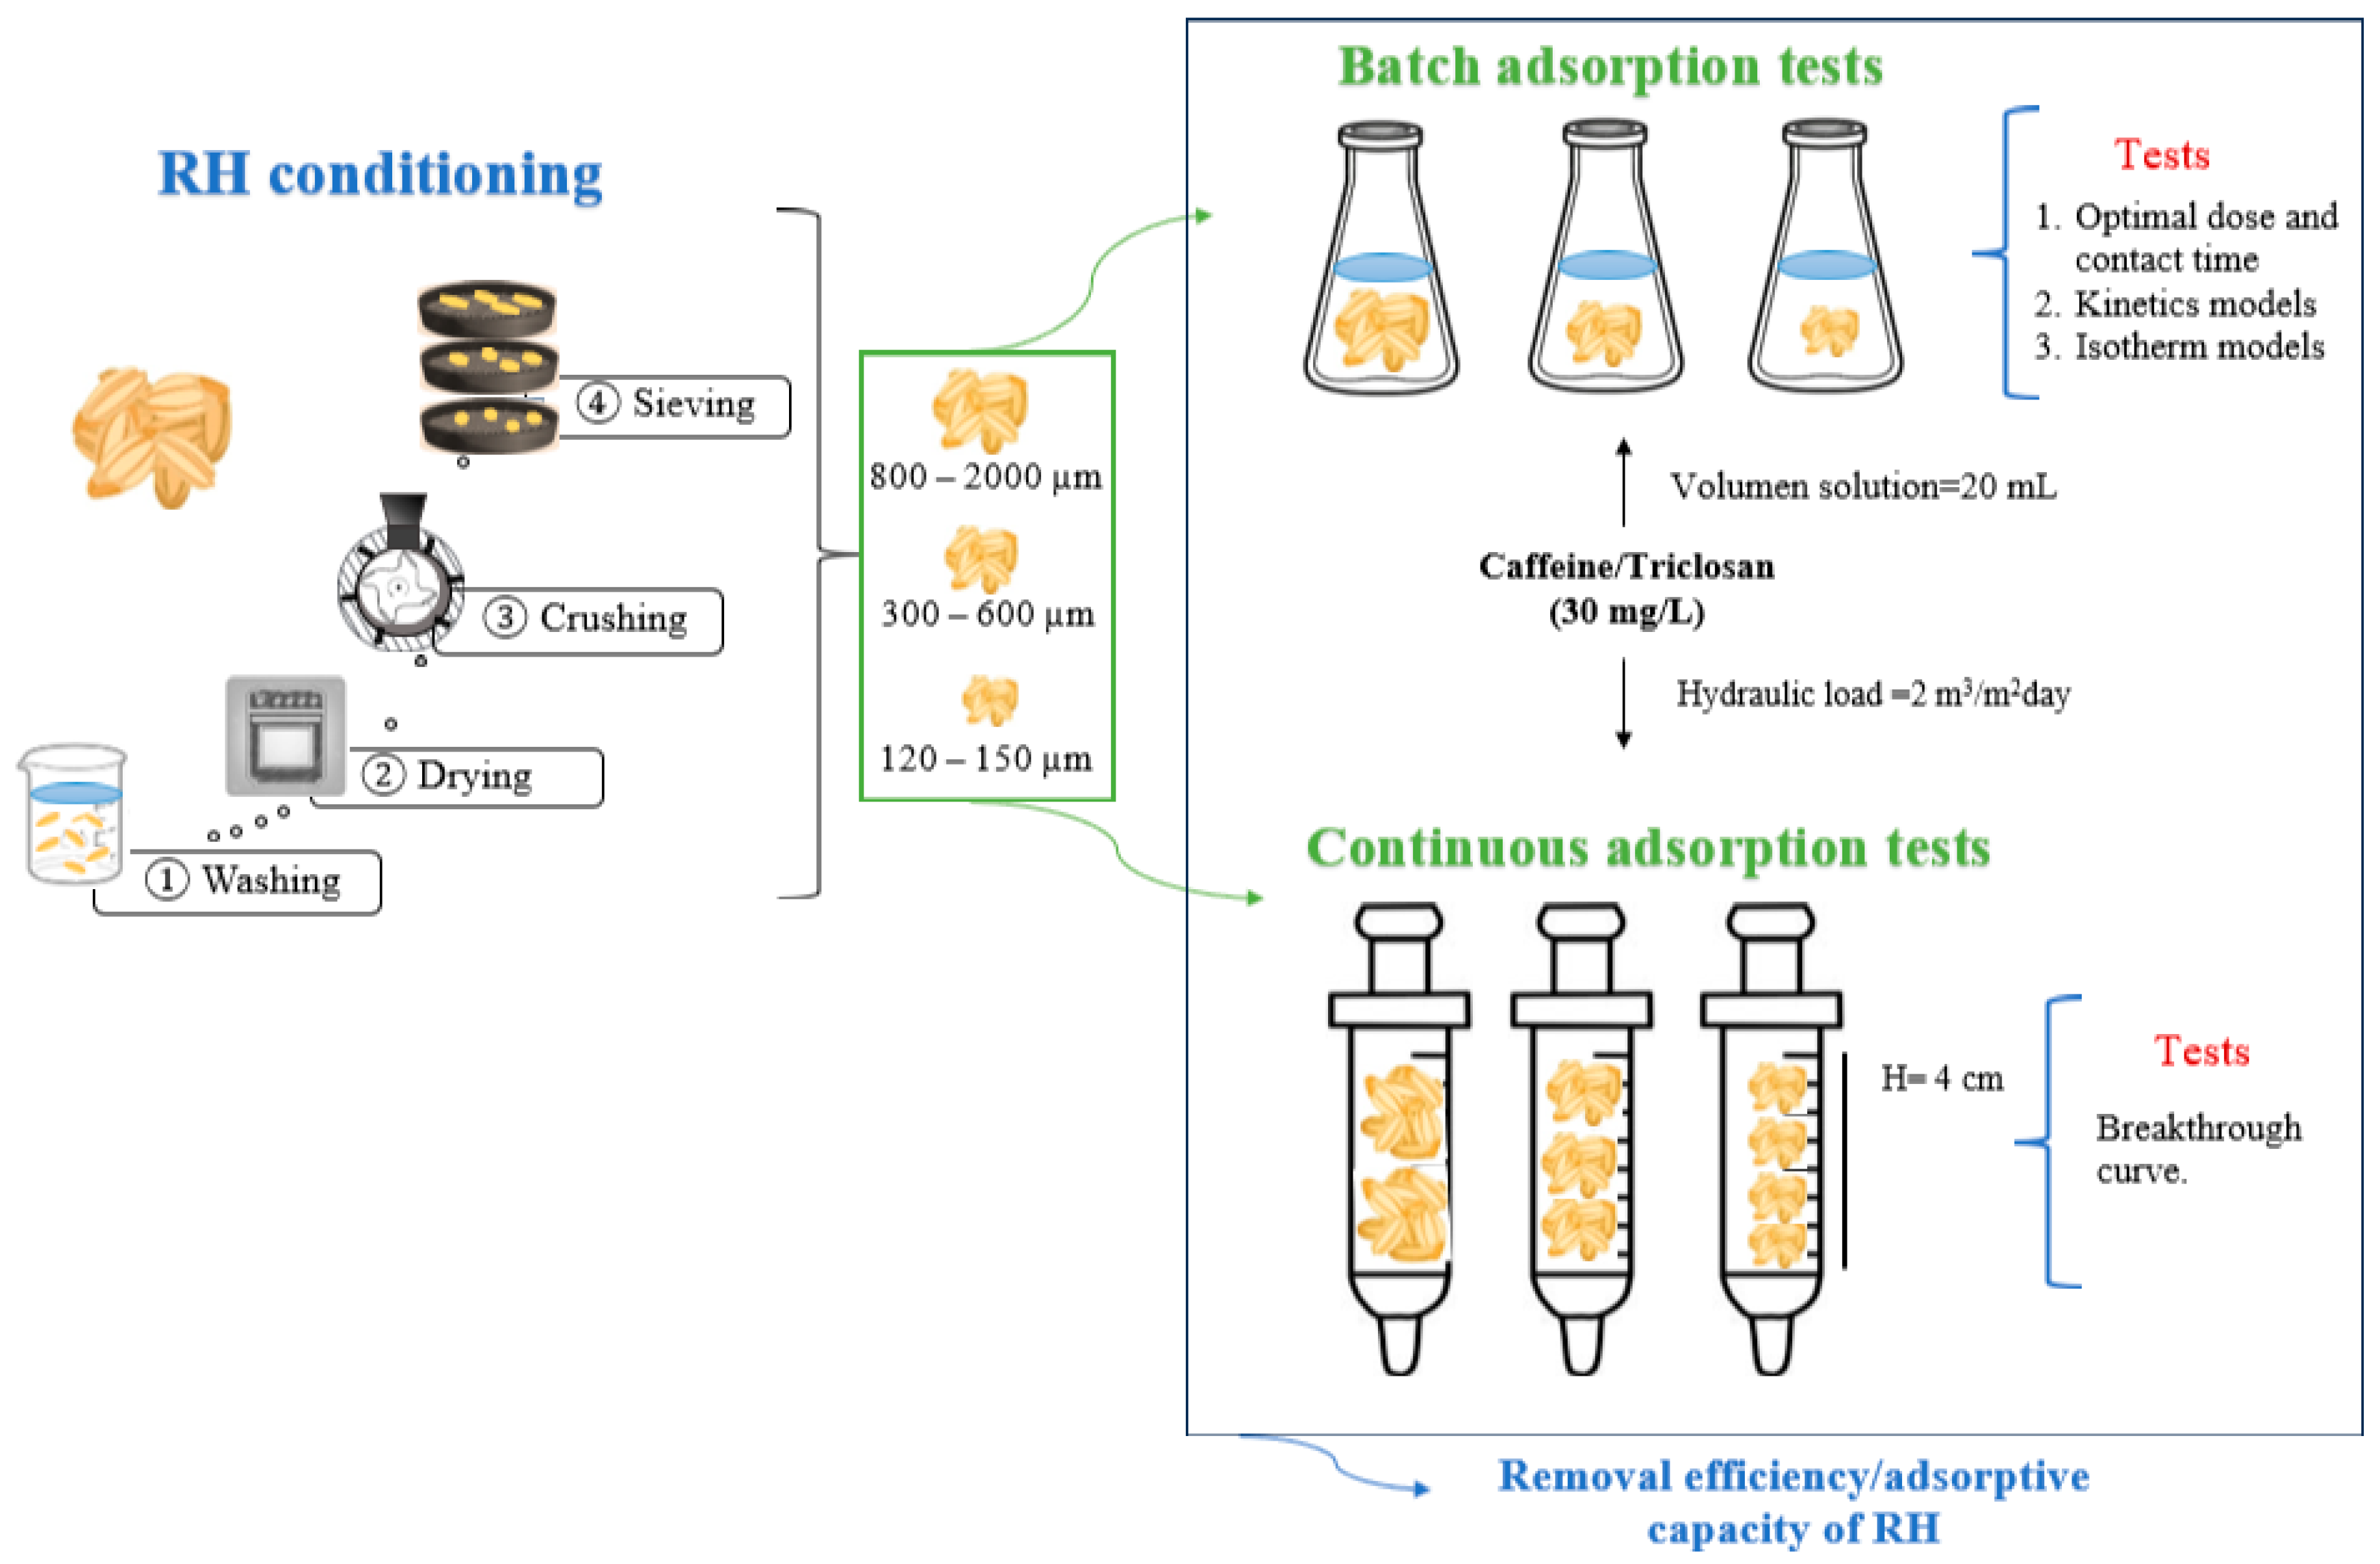
2.1. Rice Husk Material Conditioning

Rice husk was obtained from a rice processing plant in Ecuador (location: S 2°11′46.2″ W 79°53.173′). Caffeine and triclosan standards with purities greater than 99.0 and 97.0%, respectively, were purchased from Sigma-Aldrich (Saint Louis, MO, USA).
RH was washed with drinking water to remove impurities from the surface, such as dust and rice residues. The last washing cycle was carried out with distilled water. Subsequently, a Venticell stove was used to dry the material at 60 °C for 24 h. Dry RH was crushed using a Thomas knife mill and sieved in three different particle size ranges using ASTM sieves (Miami, FL, USA): 120–150 µm (small), 300–600 µm (medium), and 800–2000 µm (large).

2.2. Experimental Model

2.2.1. Batch Adsorption Tests

In the batch adsorption tests, synthetic solutions of 30 mg/L of caffeine and triclosan were individually used. In previous studies, solutions containing caffeine within the concentration range of 5–5000 ppm have been subjected to treatment using several adsorbents, including both conventional raw materials like grape stalks and non-conventional materials such as activated carbons, nanoparticles, and nanocomposites [5,26,27]. A parallel scenario is observed with triclosan, where investigations have encompassed concentrations spanning from 0.05 to 400 ppm, employing activated carbon derived from diverse sources, graphene, and some nanomaterials [28]. Moreover, working with synthetic wastewater or solutions containing a single contaminant allows the evaluation of the effect/behavior of both the adsorbent and the contaminant. The results of these tests are interesting since parameters/variables can be determined and used with real wastewater [29].
The solutions (V = 20 mL) were placed in beakers and mixed in a CIMAREC multipoint magnetic stirrer at 150 rpm. Optimal RH doses were determined using 8 different doses to remove caffeine (1.0–60.0 g/L) and triclosan (0.1–12.0 g/L), for 180 min. The optimal contact time and adsorption kinetics were determined using the optimal RH dose for each particle size. Different adsorption times were tested for caffeine (0–360 min) and for triclosan (0–180 min). Adsorption isotherms were obtained using optimal conditions (dose and contact time) with caffeine/triclosan solutions with 7 concentrations (5–60 mg/L). All batch adsorption tests were performed in triplicate for the three particle size ranges, keeping pH = 6.5 (±0.2) and temperature constant (room temperature = 22.7 (±1.1) °C). The efficiency in the caffeine/triclosan removal was the variable analyzed in batch adsorption tests.

2.2.2. Fixed-Bed Columns

Fixed-bed column tests were carried out for the three particle sizes in duplicate. Columns measuring 10 cm high and 1 cm diameter were used, being packed with 4, 5, and 8 cm of RH. RH was washed with distilled water until this water was colorless. The columns were operated using the caffeine/triclosan solutions (30 mg/L) with hydraulic loading rates between 2 and 4 m3/m2day, which are in the range of hydraulic loads used in previous studies at lab-scale with commercial adsorbents such as granular activated carbon [30].
The experimental scheme used in this research is presented in Figure 1.

2.3. Analytical/Instrumental Methods

2.3.1. Material Characterization

The point of zero charge (pHpzc) of RH was determined using a set of Erlenmeyer flasks containing 50 mL of distilled water each. The pH was adjusted between 2 and 11 using 0.01 M NaOH and HCl solutions. RH (mass = 0.5 g) was added, and samples were shaken at 150 rpm for 48 h. The test was carried out for the three particle sizes in duplicate.
The RH physical–chemical characterization was performed according to ASTM standards, and considering thermogravimetric analysis (TGA), aiming to understand how the adsorbent composition and structure influence its capacity. TGA was performed using a SHIMADZU thermo-balance model 50, between 20 and 600 °C, with a heating rate of 10 °C/min and a nitrogen flow of 50 mL/min. Moisture [31], extractives in organic and aqueous solvents [32,33], lignin [34], hemicellulose and cellulose [35], ash [36], and volatile material [37] were determined.
The functional groups present on the RH surface (before/after adsorption) were identified using a Perkin Elmer FTIR-6800 spectrometer equipped with a diamond crystal ATR. Nine scans were performed in the range from 400 to 4000 cm−1 with a resolution of 4 cm−1. The analysis of the RH surface was performed by using an ASPEX PSEM eXpress scanning electron microscope with a working distance of 20.4 mm and 15 kV of acceleration. The pore size (Barret–Joyner–Halenda, BJH) and the specific surface area (Brunauer–Emmett–Teller, BET) of the small RH were determined by nitrogen adsorption in a micrometric NOVA touch 1LX equipment. More than 6 multi-points were considered to determine the surface characteristics of the material, which was conditioned by drying it at 105 °C under vacuum.

2.3.2. Caffeine/Triclosan Quantification before/after the Adsorption Tests

The quantification of the concentration of both contaminants before/after the adsorption processes was carried out in a Specord® 210 Plus UV-VIS spectrophotometer. Caffeine and triclosan solutions were prepared using distilled water and an NaOH solution (5 v/v %) as solvents, respectively. The NaOH solution was used to avoid potential measurement problems associated with the relatively low solubility of triclosan. The wavelength of greatest absorbance (caffeine = 287 nm, triclosan = 295 nm) was determined by scanning between 200 and 800 nm using 10 mg/L solutions. Subsequently, the calibration curves of caffeine (y = 0.0153x + 0.0185, R2 = 0.996) and triclosan (y = 0.0068x − 0.0126, R2 = 0.995) were obtained using solutions with concentrations between 1 and 70 mg/L [3].

2.4. Data Analysis

2.4.1. Isotherm and Kinetic Models

The data obtained in the kinetics tests were fit to the non-linear pseudo-first-order (Equation (1)), pseudo-second-order (Equation (2)), and Elovich (Equation (3)) models:
q t = q e ( 1 e k 1 t )
t q t = 1 k 2 q e 2 + t q e    
q t = 1 β ln ( 1 + α β t ) .
Furthermore, the intraparticle diffusion model (Equation (4)) was used to obtain information about the adsorption process.
q t = k p t + C
where qt (mg/g) is the amount of caffeine/triclosan adsorbed at time t; qe (mg/g) is the amount of caffeine/triclosan adsorbed at equilibrium; k1 (min−1) is the pseudo-first-order rate constant; k2 (g/(mg min)) is the pseudo-second-order rate constant; α (mg/g min) is the initial rate constant; β (mg/g) is the desorption constant; kp (mg/g min1/2) is the rate constant of the intra-particle diffusion model; and C (mg/g) is a constant associated with the thickness of the boundary layer.
The data obtained in the isotherm tests were fitted to the non-linear models of Langmuir, Freundlich, and Sips isotherms, which are shown in Equations (5)–(7), respectively:
q e = q m K L C e   1 + K L C e  
q e = K F C e 1 / n
q e = q m ( K L C e ) 1 / n   1 + ( K L C e ) 1 / n
where qe (mg/g) is the amount of caffeine/triclosan adsorbed per unit mass of RH at equilibrium; qm (mg/g) is the maximum adsorption capacity of RH; Ce (mg/L) is the liquid phase concentration of caffeine/triclosan in equilibrium; KF (mg/g) is the Freundlich capacity constant; KL (L/mg) is the Langmuir constant; and n is the Freundlich intensity parameter. The selected models are classic models that have shown a good fit to the kinetics and equilibrium models (R2 ~ 1) described by agro-industrial residues in the removal of several contaminants [38].
The adsorption tests were performed in triplicate, and a control was placed with distilled water/NaOH solution (5.0 w/w%) for caffeine/triclosan. Moreover, the adsorption tests were carried out in the dark to avoid photodegradation.

2.4.2. Breakthrough Curve

The effluent–time concentration curves were used to evaluate the adsorption of caffeine/triclosan in continuous adsorption processes. The amount of caffeine/triclosan adsorbed at the breakthrough time (qb) and saturation time (qs) (mg/g) was calculated using Equations (8) and (9):
q s = C o   Q 1000   m 0 t s 1 C s C o
q b = C o   Q 1000   m 0 t b 1 C b C o
where Co (mg/L) is the initial concentration of caffeine/triclosan; Cb and Cs (mg/L) are the effluent concentration (caffeine/triclosan) at the breakthrough time and the saturation time, respectively; Q (mL/min) is the volumetric flow; m (mg) is the RH mass; tb and ts (min) are the breakthrough and saturation times when C/Co is 0.1 and 0.9, respectively. The data obtained were fit to the non-linear Bohart–Adams model (Equation (10)), since this model provides an easy and rapid evaluation of adsorption performance. Moreover, it has shown good fit when ECs are adsorbed by agro-industrial residues, such as cane bagasse [39].
C t C o   = 1 1 + e ( K BA N 0 h u K BA C 0 t )
where KBA (L/(min-mg)) is the rate constant of the Bohart–Adams model; No (mg/L) is the adsorption capacity of the adsorbent per unit volume of the bed; h (cm) is the bed height; t (min) is the service time of the column; u (cm/min) is the linear flow velocity; and Ct (mg/L) is the concentration at time t.
In addition, useful parameters for column design were calculated, such as the empty bed contact time (EBCT), the percentage of fractional bed utilization (%FBU); the height of the mass transfer zone (hMTZ) (cm) using Equations (11)–(13), respectively [39,40]:
EBTC = V c Q 100
% FBU = q b q s 10
h MTZ = ( 1 q b q s ) h
where Vc is the fixed-bed volume (L) and Q is the flow rate (L/d).

2.5. Statistical Analysis

The optimal RH dose in the different particle sizes was determined by means of the significant differences between the doses used in the adsorption of caffeine/triclosan and the performance achieved (removal efficiency, %) in batch tests. Analyses of variance (ANOVA) with a single factor analyzed by Tukey’s test, with a significance level of 0.05, were applied. Data normality was determined using normality (Shapiro–Wilks) and homogeneity (Levene) tests. Minitab 18 version 1.0 was the software used in statistical analysis. The same statistical analysis was performed to determine the optimal bed height in the adsorption of caffeine/triclosan in fixed-bed columns.
Data from kinetics (pseudo-first-order, pseudo-second-order, and Elovich models), isotherm (Langmuir, Freundlich, and Sips), and Bohart–Adams non-linear models, considered descriptive statistical means, standard deviation, error, and linear regressions using Microsoft Excel Solver version 2016. For this purpose, in batch and continuous tests, the coefficient of determination (R2), the chi-square (χ2), and the sum of squared errors (SSE) were calculated (Equations (14)–(16)) to determine the models that best fit the caffeine and triclosan adsorption data:
R 2 = 1 ( V e , exp V e , cal ) 2 ( V e , exp V e , mean ) 2
χ 2 = ( V e , exp V e , cal ) 2 V e , cal
SSE = ( V e , exp V e , cal ) 2
where Ve,exp are the experimental value of parameters (q, Cf/Co for batch tests and fixed-bed columns, respectively), Ve,cal are the calculated parameters using the Solver tool, Ve,mean is the mean of Ve,exp values [38].

3. Results and Discussion

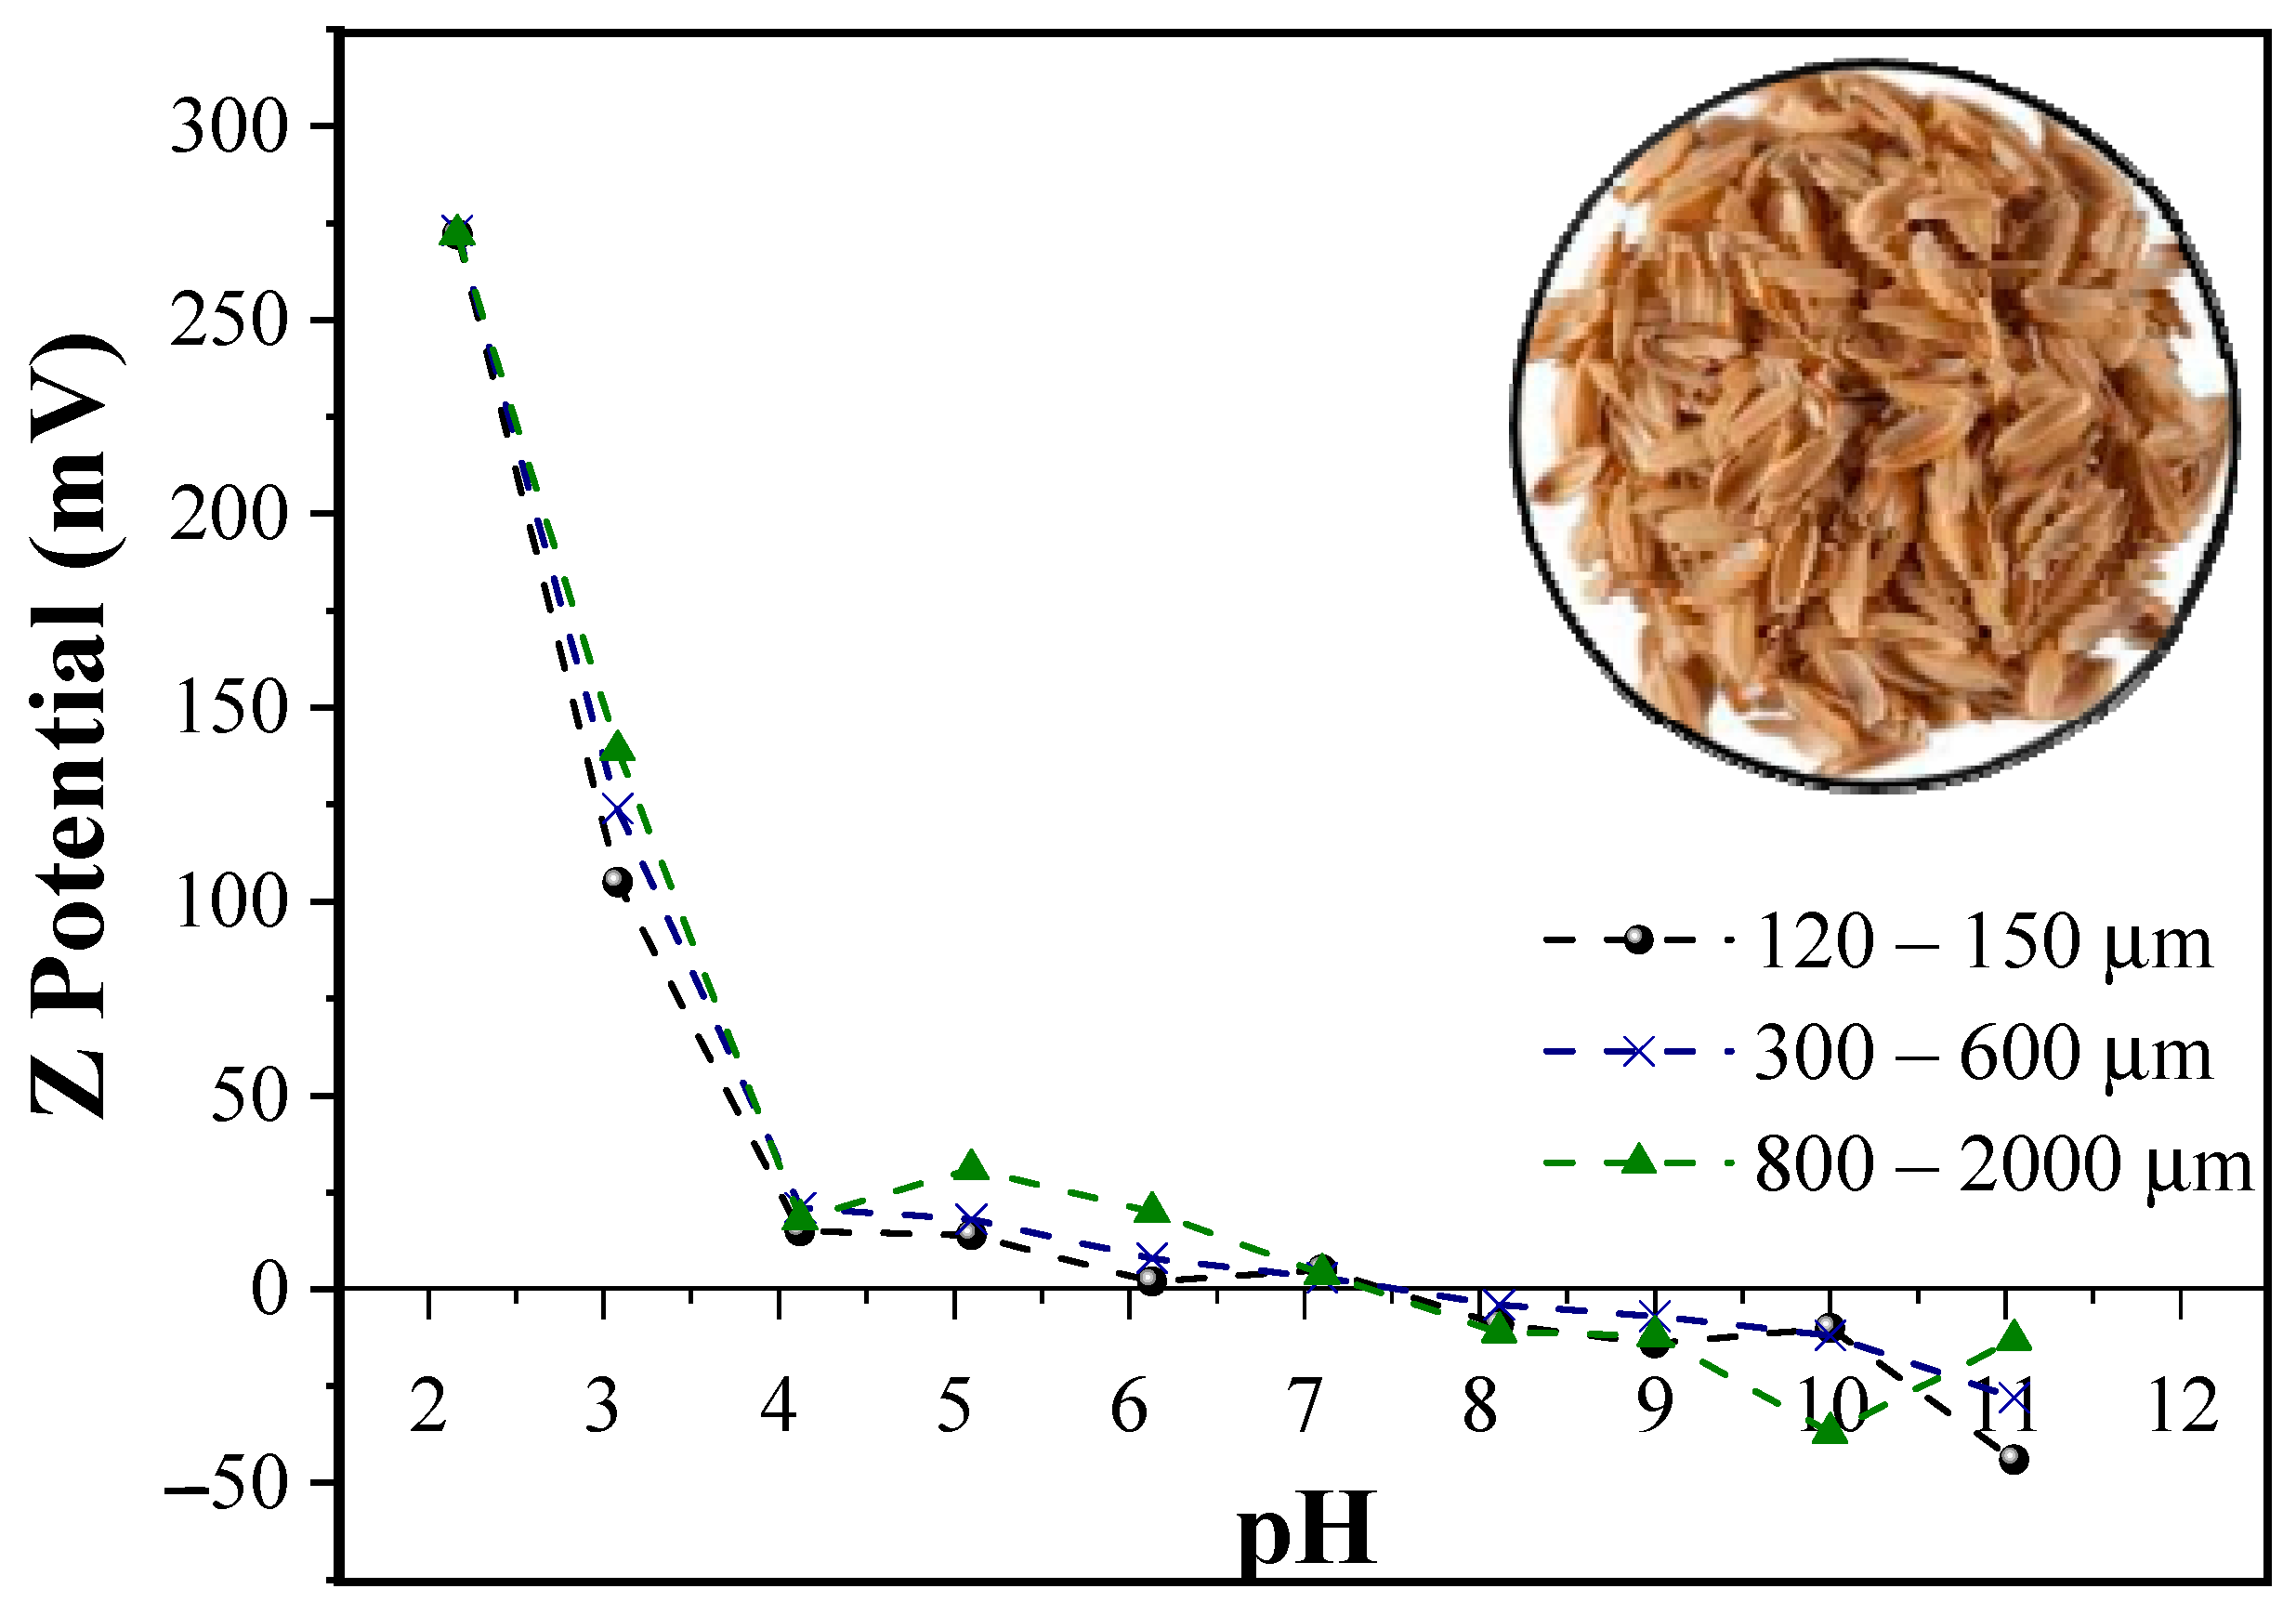
3.1. Point of Zero Charge

The pH of the solution affects the charge of the adsorbent and the ionization of adsorbate molecules, influencing adsorption. The pHpzc of RH in the three-particle sizes was around 7.6 (Figure 2). This means that at pH values lower than the pHpzc, RH will adsorb contaminants with a negative charge (since RH is positively charged), and at higher pH values, contaminants with a positive charge will be adsorbed by RH (since RH is negatively charged). Caffeine, as a weak electrolyte, exhibits a greater affinity for the RH in an acidic pH due to hydrogen bonding formation [41]. Moreover, caffeine and triclosan have pKa values of 10.4 and 7.9–8.1, suggesting that they could be more efficiently removed at pH values lower than the pHpzc [5,42]. Because both contaminants do not dissociate at acidic pH (they have a neutral charge), which minimizes repulsive electrostatic forces and improves adsorption capacity. Therefore, working at 6.5 (±0.2) would favor the removal of caffeine/triclosan [43].

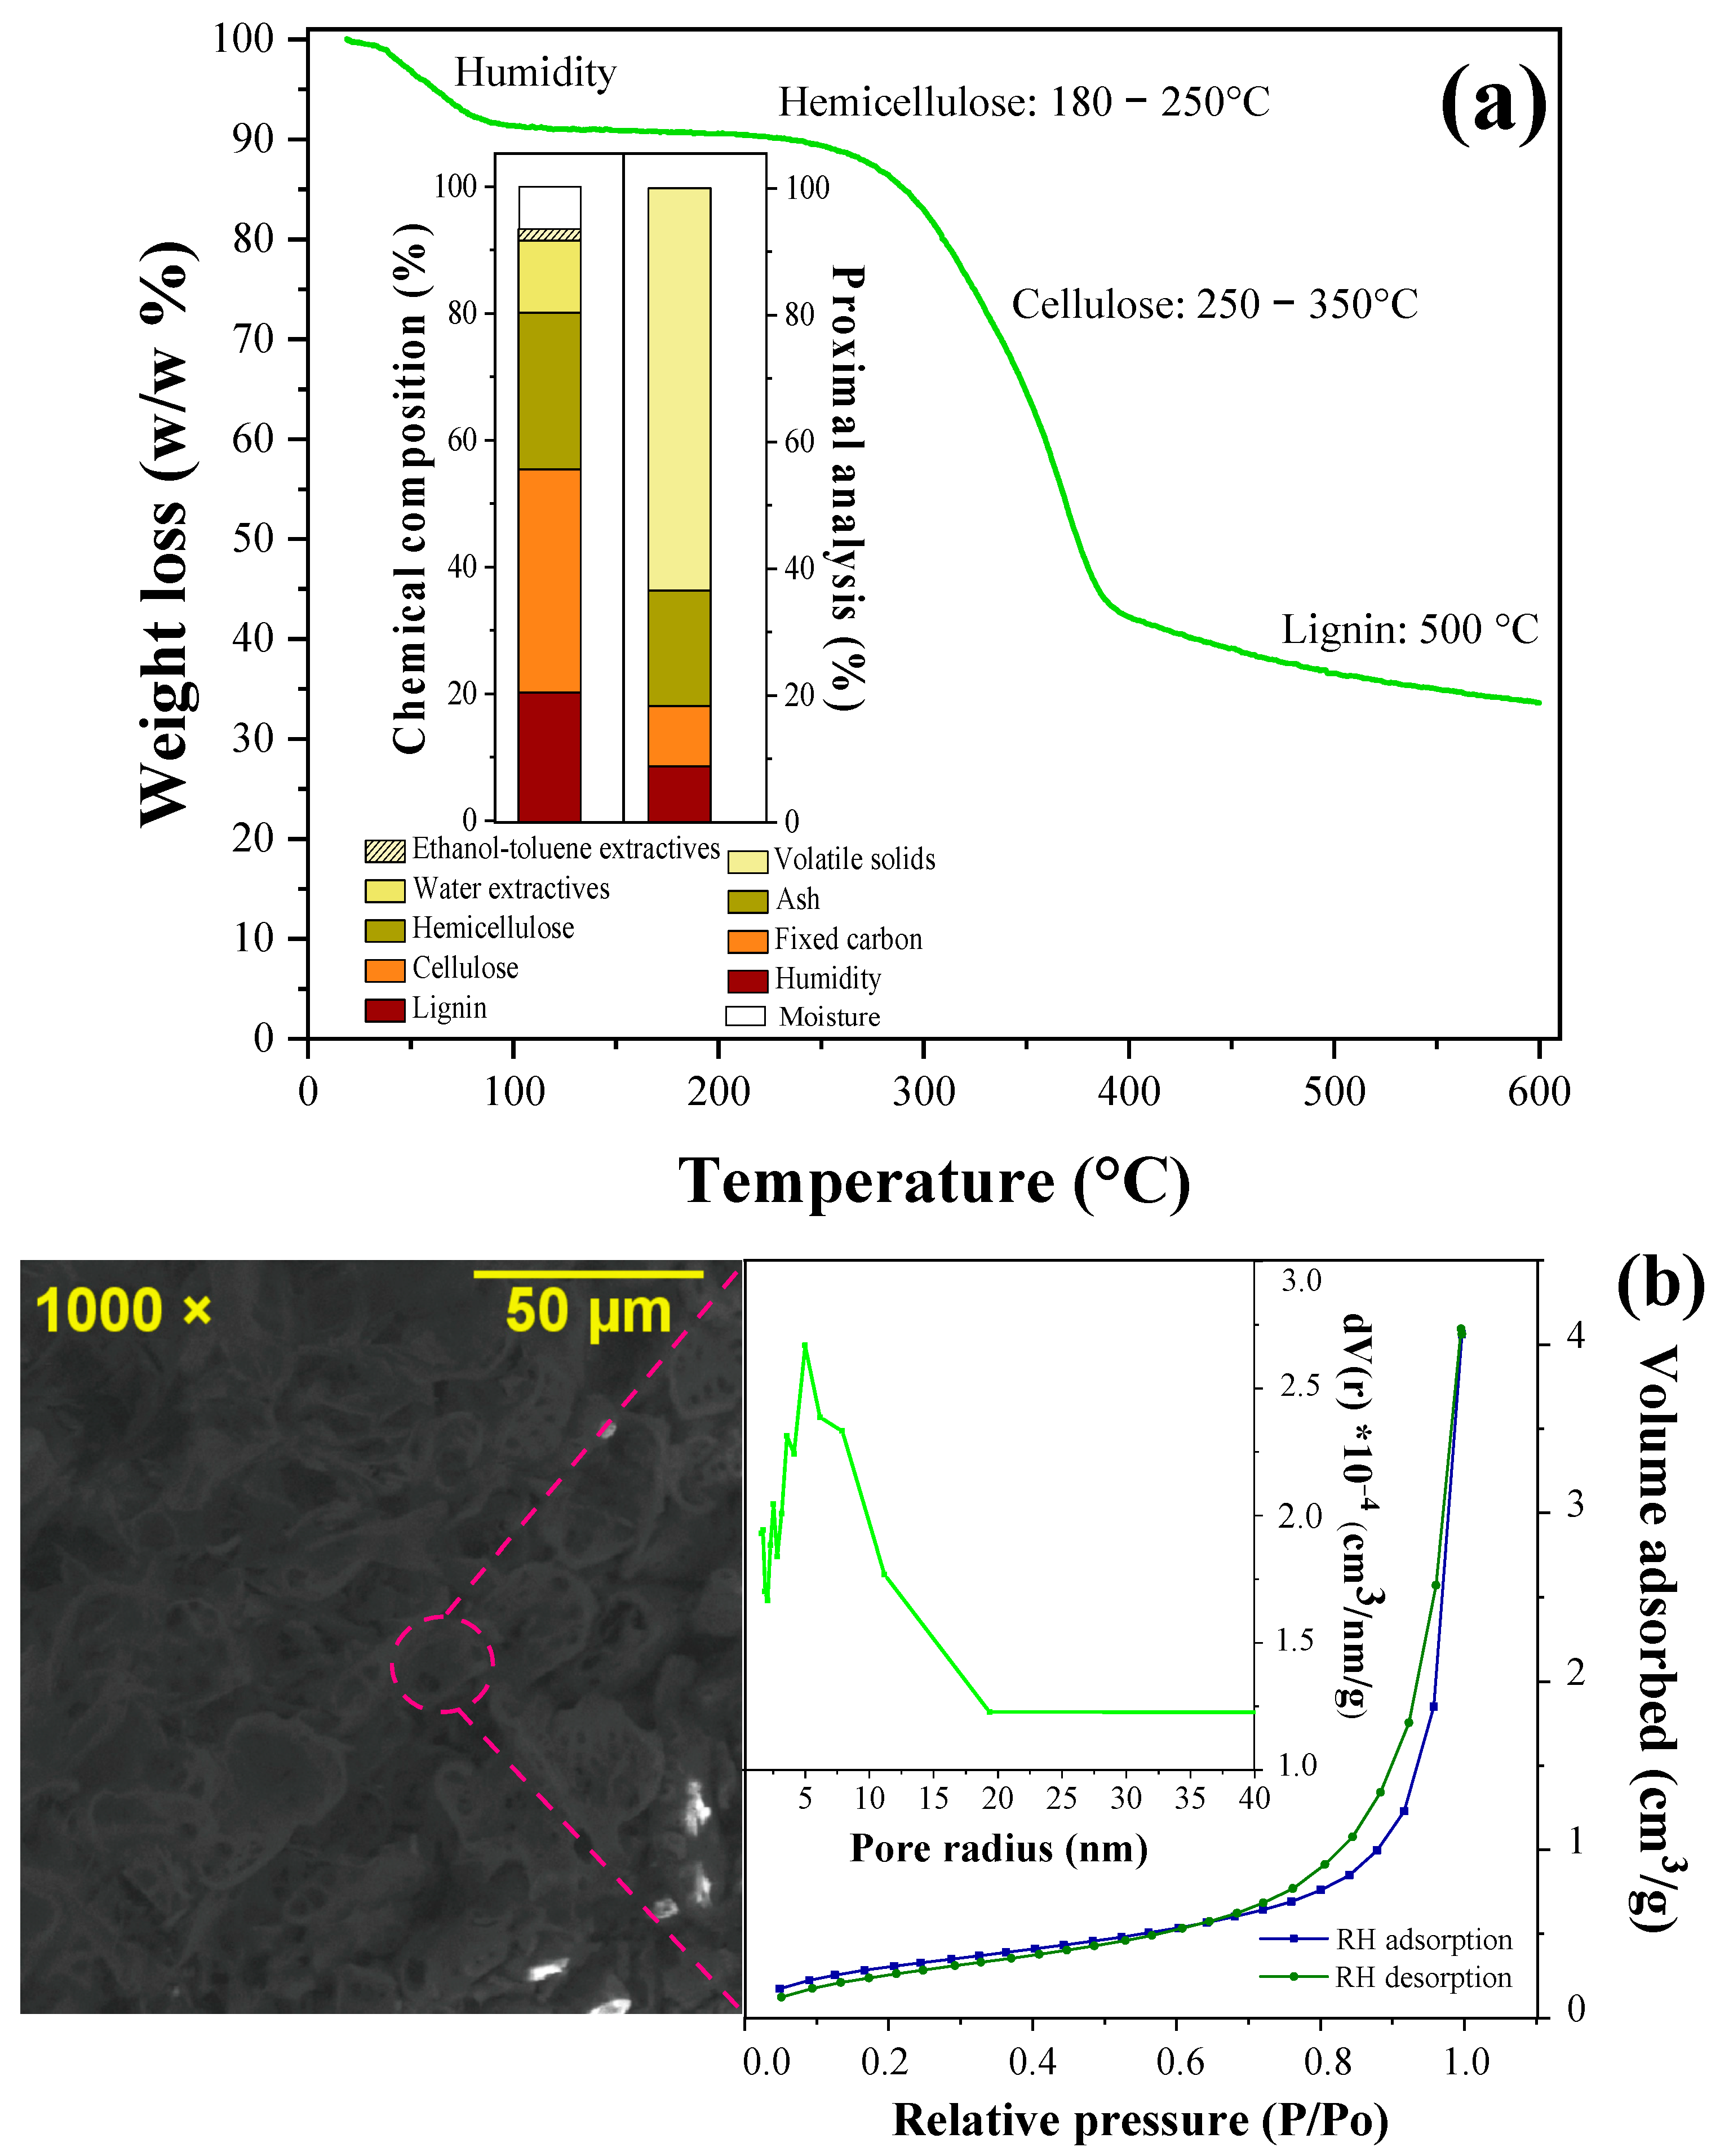
3.2. Physical–Chemical Characterization and TGA Analysis

Figure 3a (inset) shows the physical–chemical characterization of RH. RH shows a high content of lignin (20.2%), hemicellulose (24.7%), and cellulose (35.2%), polysaccharides that have functional groups such as phenols, carboxyl, and methyl. These groups provide positive and negative charges to RH, which could enable it to retain contaminant molecules through chemical forces (e.g., hydrogen bonding), taking into consideration the chemical structure of caffeine and triclosan molecules [44,45]. Meanwhile, TGA shows that there is a weight loss in the clean RH after continuous heating (below 100 °C). The initial weight loss (8.6%) is mainly due to the water vaporization/moisture removal [46]. The weight loss (20.6%) between 280 and 340 °C is attributed to hemicellulose degradation. Meanwhile, the weight loss between 340 and 400 °C (29.8%) and the carbonization of RH (temperature > 450 °C = 7.8%) are attributed to the degradation of cellulose and lignin, respectively [47].

3.3. Morphological Characterization of RH

SEM and BET results are presented in Figure 3b. RH exhibits an irregular surface with cavities and grooves where caffeine/triclosan could be retained. On the other hand, the surface area of small RH (1.18 m2/g) is similar to that found in other studies, where values between 0.14 and 7.14 m2/g were reported. The range for the RH specific surface area is relatively wide since it depends on the rice species and its particle size [48]. However, the surface area determined is lower than the values presented by RH with thermal and chemical modifications (25.06 m2/g) [49].
The average pore radius was 4.99 nm, which according to the IUPAC corresponds to a mesoporous material [50]. This is verified with the nitrogen adsorption–desorption isotherms of RH (Figure 3), which is a combination of the type II and V isotherms, that characterizes macro and mesoporous adsorbents. The shape of the RH hysteresis loop is type H1, with a sharp inflection in the range of 0.7–1.0 P/Po. The hysteresis presents two parallel and practically vertical bands that indicate the presence of cylindrical pores [6]. Therefore, the morphological characteristics related to the irregular surface and presence of pores in RH could favor the adsorption process between it and caffeine/triclosan.

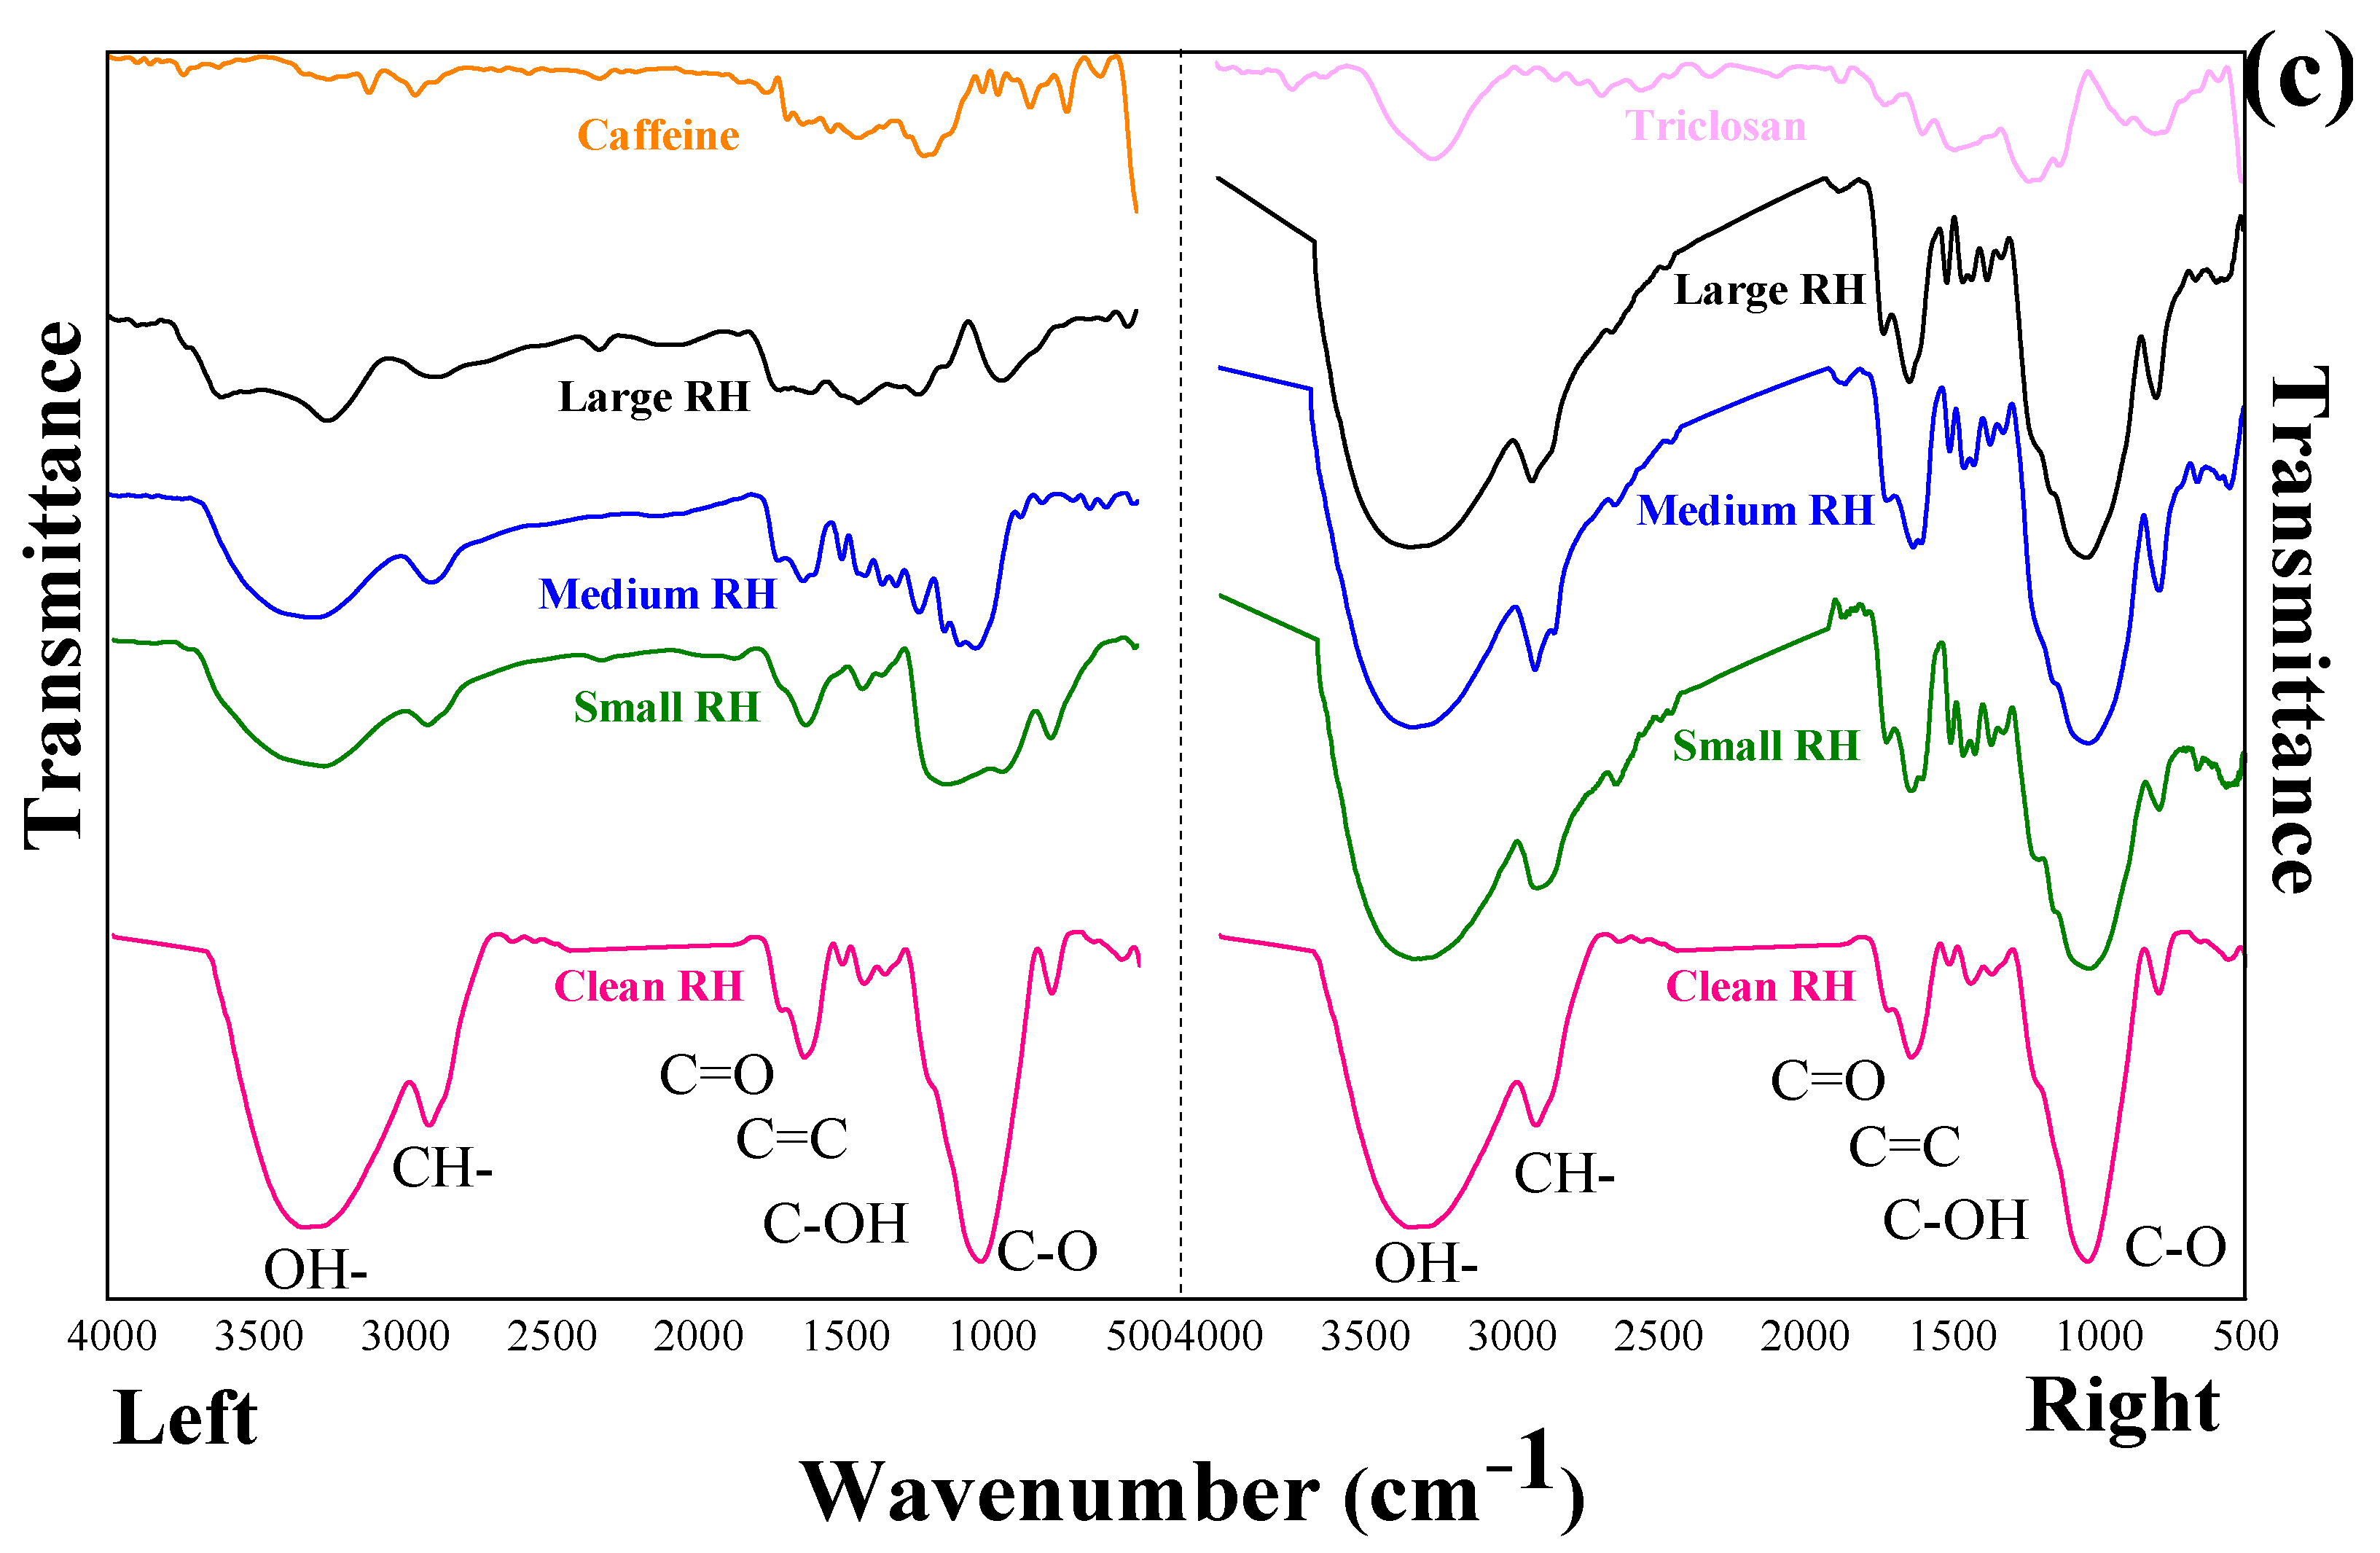
3.4. FTIR Spectroscopy Analysis

Figure 3c shows the FTIR spectra of RH before/after the adsorption process. The region between 3300–2500 cm−1 denotes the presence of OH- and CH- bonds. The bands around 1639–1723 cm−1 correspond to the C=O stretch, while the band around 1375 cm−1 corresponds to the CH bending. Both groups can be attributed to the aromatic groups of hemicellulose and lignin [38]. Meanwhile, the bands around 1039–1370 cm−1 correspond to the vibration of the C=O group in lactones.
After caffeine/triclosan adsorption under the same conditions for all RH sizes, the spectra of three RH sizes showed changes. Modifications in the intensity of bands around 2924–3500 and 1100–1490 cm−1, which are related to lignin, cellulose, and hemicellulose, were evident. The intensity of the band around 1598 cm−1, assigned to the carbonyl group, changed after adsorption. The intensity after caffeine/triclosan adsorption suggest chemical reactions/attraction forces between caffeine/triclosan molecules and the functional groups of the RH surface [21].

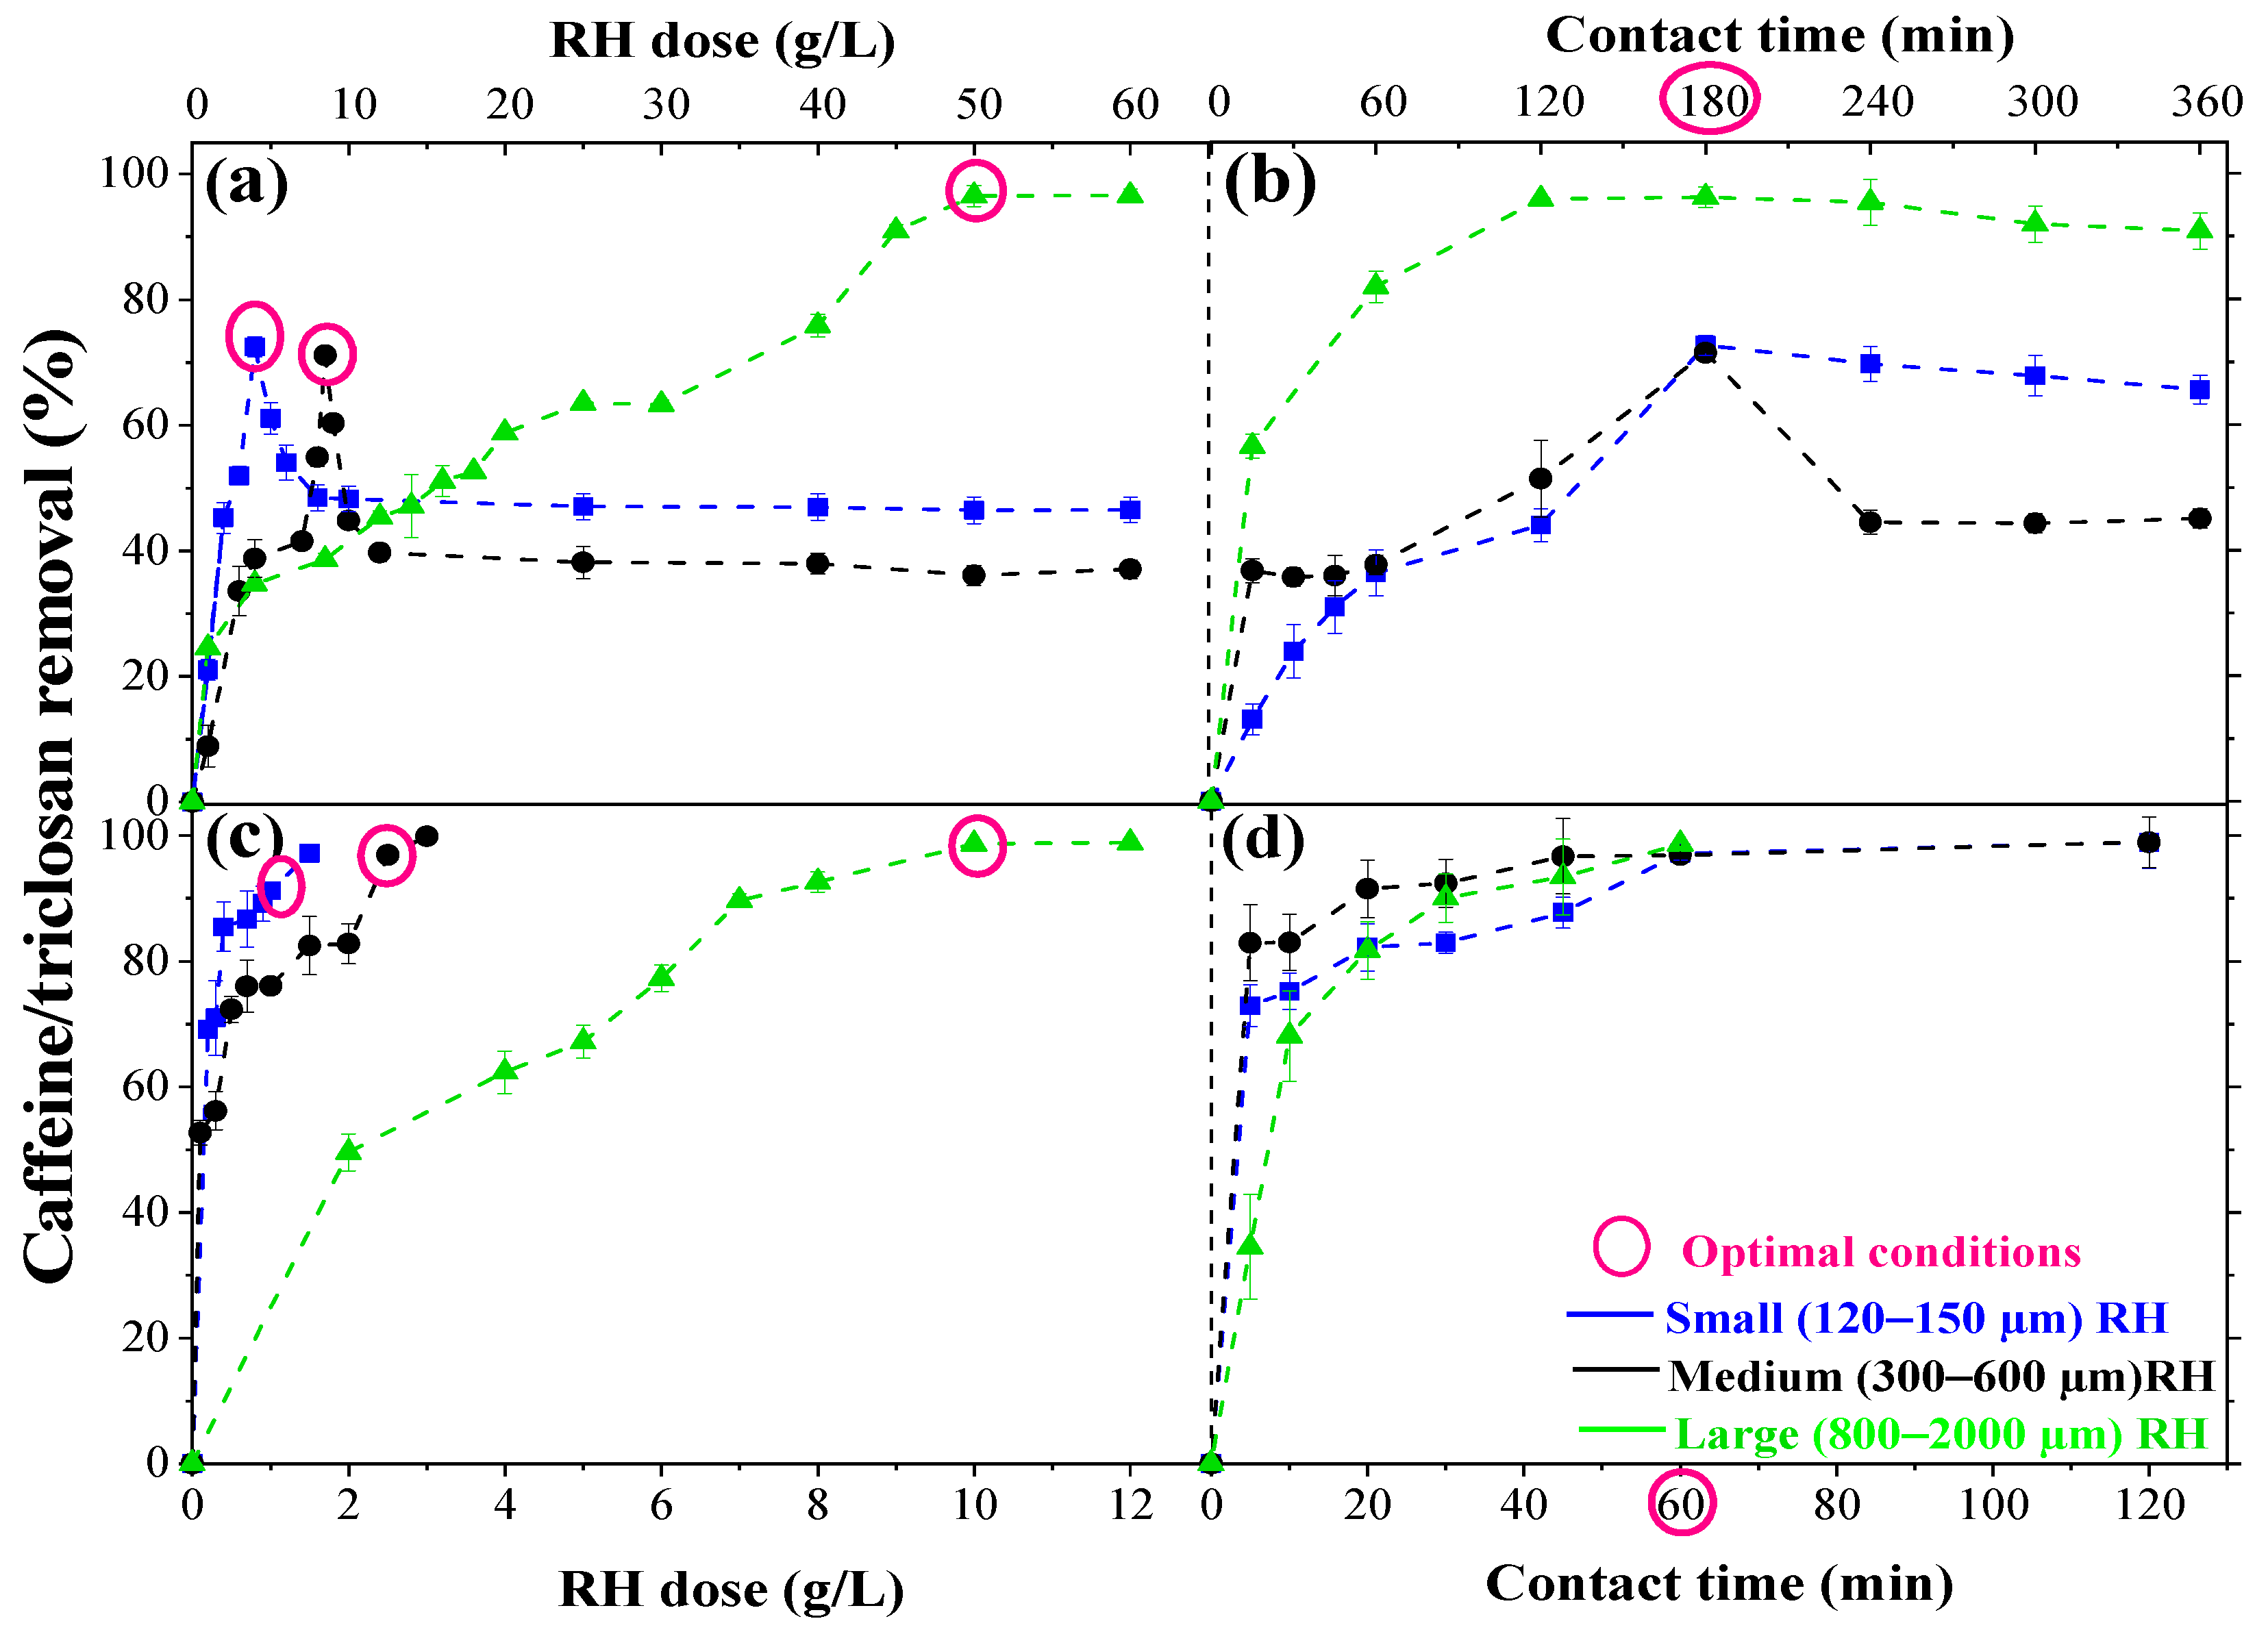
3.5. Optimal Adsorption Parameters

Figure 4 shows the influence of the RH dose and contact time in the removal of caffeine and triclosan for each particle size. For caffeine removal (Figure 4a), the optimal doses for small particles (120–150 µm) and medium particles (300–600 µm) were 4.0 and 8.5 g/L, achieving removals of 72.5 (±1.6) and 71.1 (±0.6) %, respectively. The lower dose of the smaller particles is associated with their larger surface area and, consequently, a greater number of active sites [1]. Initially, as the RH dose increases, the caffeine removal also increases. However, after reaching the maximum adsorption with small and medium particles, an increase in the RH dose reduced the caffeine removal (20–30%). At first, an increase in the RH dose leads to greater caffeine removal due to the availability of more adsorption sites. However, once the adsorbent becomes saturated, the escalation of the RH dose no longer results in a proportional increase in caffeine removal. Additionally, as the RH dose increases, there could be heightened competition among caffeine molecules for the available adsorption sites, potentially diminishing the adsorption efficiency [26,51]. Furthermore, the potential influence of interactions among RH particles and variations in adsorption kinetics based on particle size should also be taken into account [52]. A similar behavior was observed with adsorbents such as almond shell ash, bentonite modified with hexadecyltrimethylammonium, activated carbon from Azolla filiculoides and olive pome+magnetite [26].
For the large particles (800–2000 µm), the optimal RH dose increased considerably, reaching 50.0 g/L with a maximum adsorption percentage of 96.5 (±1.7) %. In this case, the caffeine removal increases while increasing the RH dose, due to the higher availability of surface area [52]. Figure 4c shows the optimal doses for triclosan removal. The optimal doses for the small, medium, and large particle sizes were 1.5, 2.5, and 10.0 g/L, respectively; these doses achieved removals of 97.2 (±1.0), 96.9 (±0.1), and 98.7 (±0.4) %, respectively. The absence of interaction between rice husk (RH) particles in the case of triclosan, unlike what occurs with caffeine, can be explained by the specific chemical and physical properties of these substances and their relationship with RH particles. This could be due to differences in the size and shape of the molecules, where caffeine, being larger and more complex, could favor the formation of aggregates with RH particles, while triclosan, being smaller and having a different structure, could not have a similar effect. Other properties such as the charge and polarity of the two contaminants can also influence the behavior of RH [53].
On the other hand, Figure 4b,d show the optimal contact time for the removal of caffeine and triclosan, respectively. The optimal contact time for the caffeine removal using the small, medium, and large particle sizes was 180 min. At that time, the highest removal percentage was achieved, reaching between 71.4 (±0.8) and 96.2 (±1.7) %. For triclosan, the optimal contact time for the three particle sizes was 60 min, achieving removals between 96.9 (±0.1) and 98.7 (±0.4) %. The removal of caffeine and triclosan was greater than 80% and 70% in the first 60 and 10 min, respectively. However, over time, the increment in adsorption is minimal, arguably due to the increasing challenge of filling available active sites due to the repulsion between caffeine molecules and those already adsorbed.
Therefore, it was verified that the particle size influences the adsorption process. An adsorbent with a smaller particle size requires a lower dose because the surface area and the available sites to retain the caffeine/triclosan are higher [6]. Likewise, the characteristics of the contaminants will facilitate or not their removal from the aqueous medium. In this case, triclosan has a lower solubility in water (4.8 × 10⁻⁴ times) compared to caffeine, which allows it to be adsorbed more quickly (3 times) with a lower RH dose (2.7–5.0 times). Moreover, the high Kow of triclosan results in a greater affinity with organic matter so it easily adheres to the RH surface [54]. Another factor that hinders the caffeine removal is its dipole moment (3.64 D) since it could affect the separation processes from the solution. This is due to the strength of the bonds that exist between the caffeine molecules and water [5]. Furthermore, caffeine has a natural pH of 6.55 (weak base), which causes it to dissolve only partially in the working pH as RNH+, thereby reducing its adsorption capacity [41].

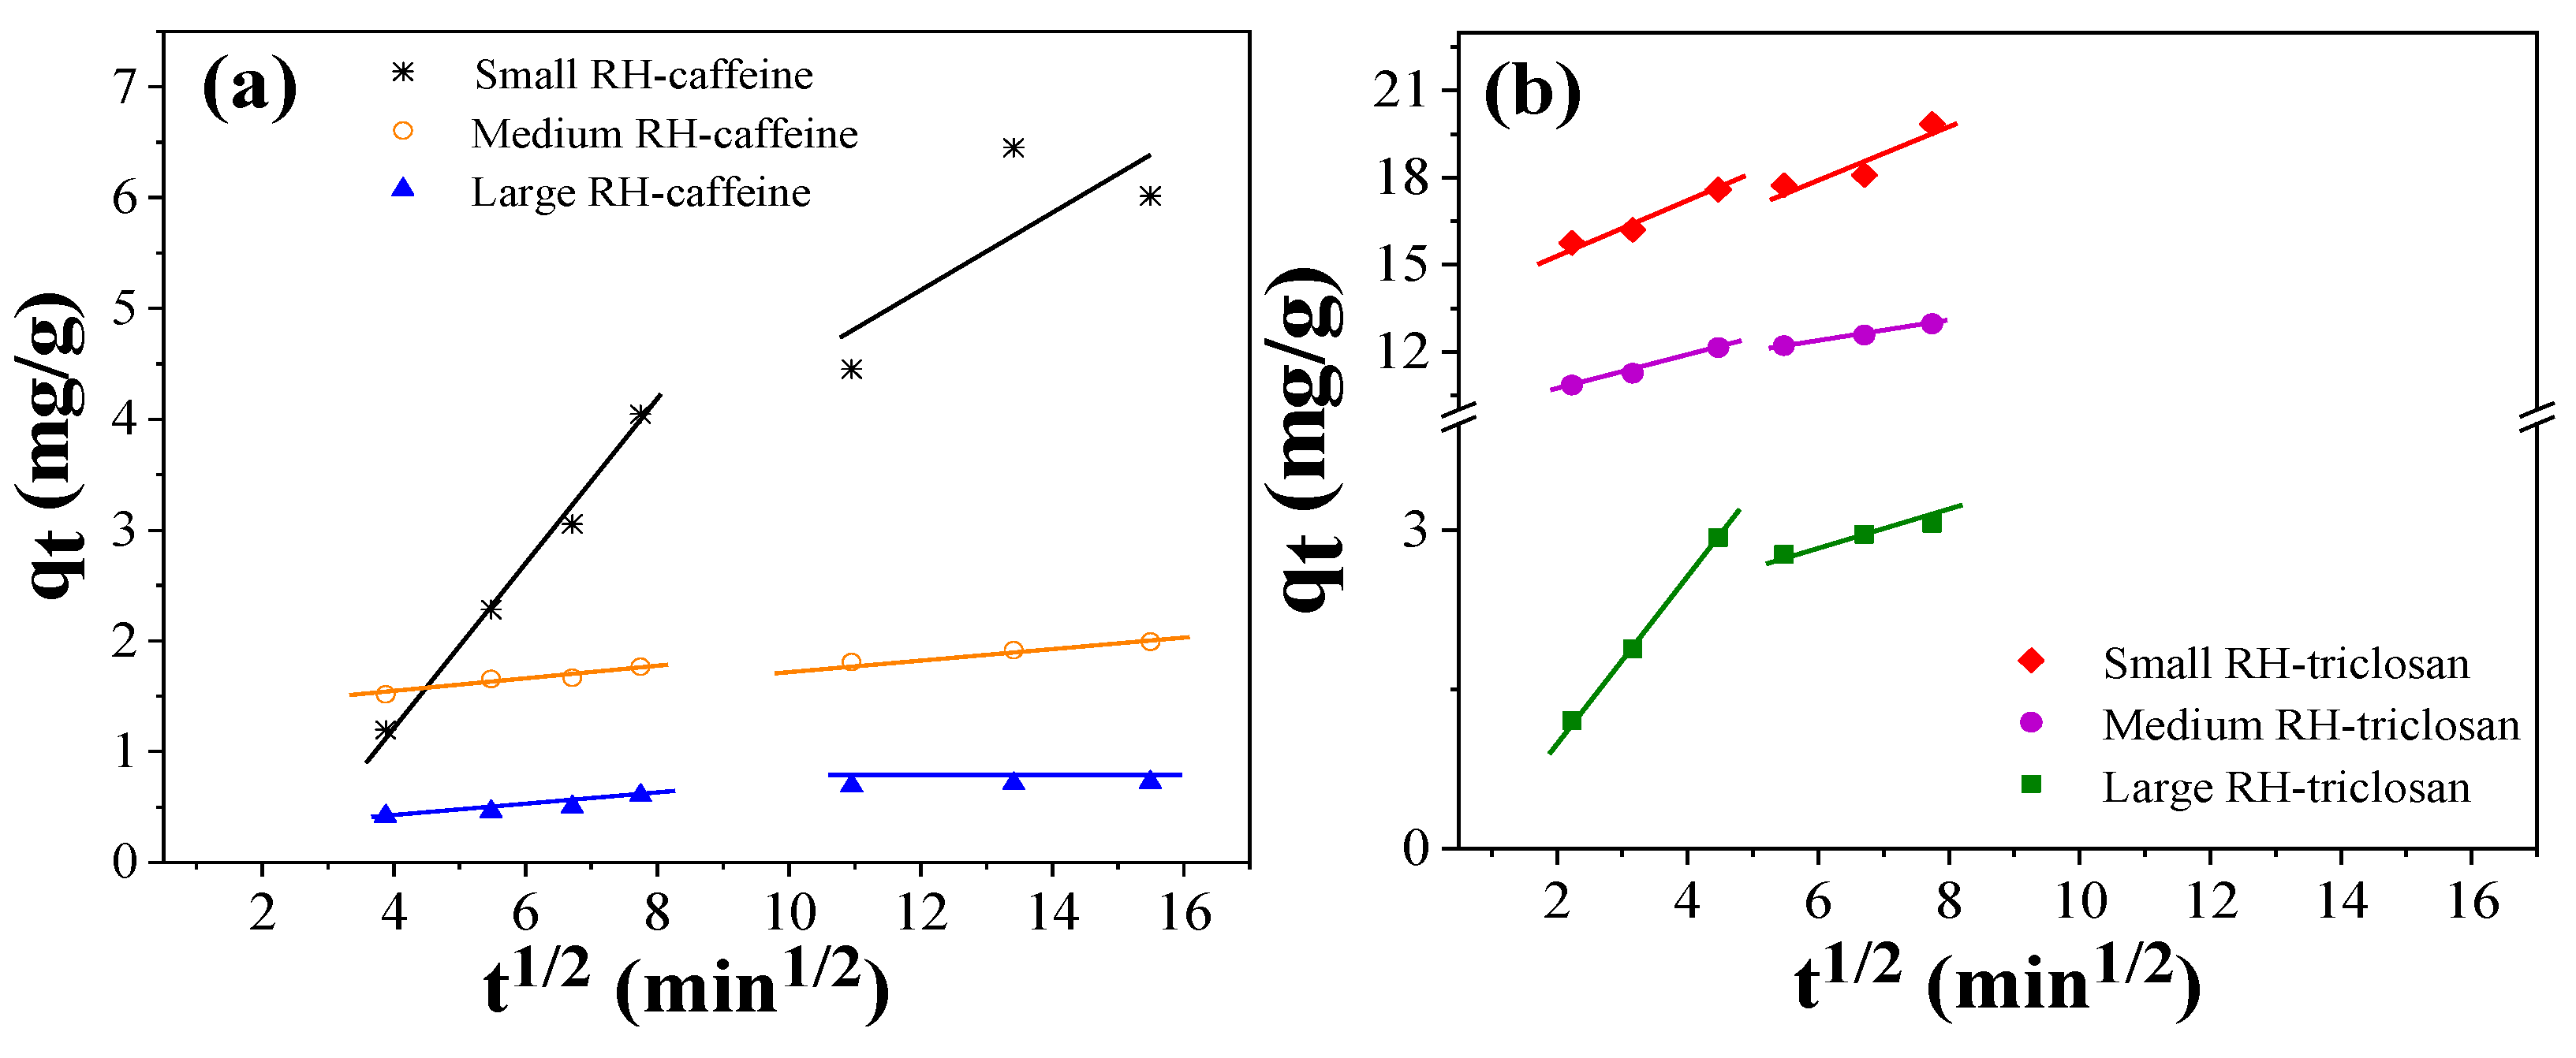
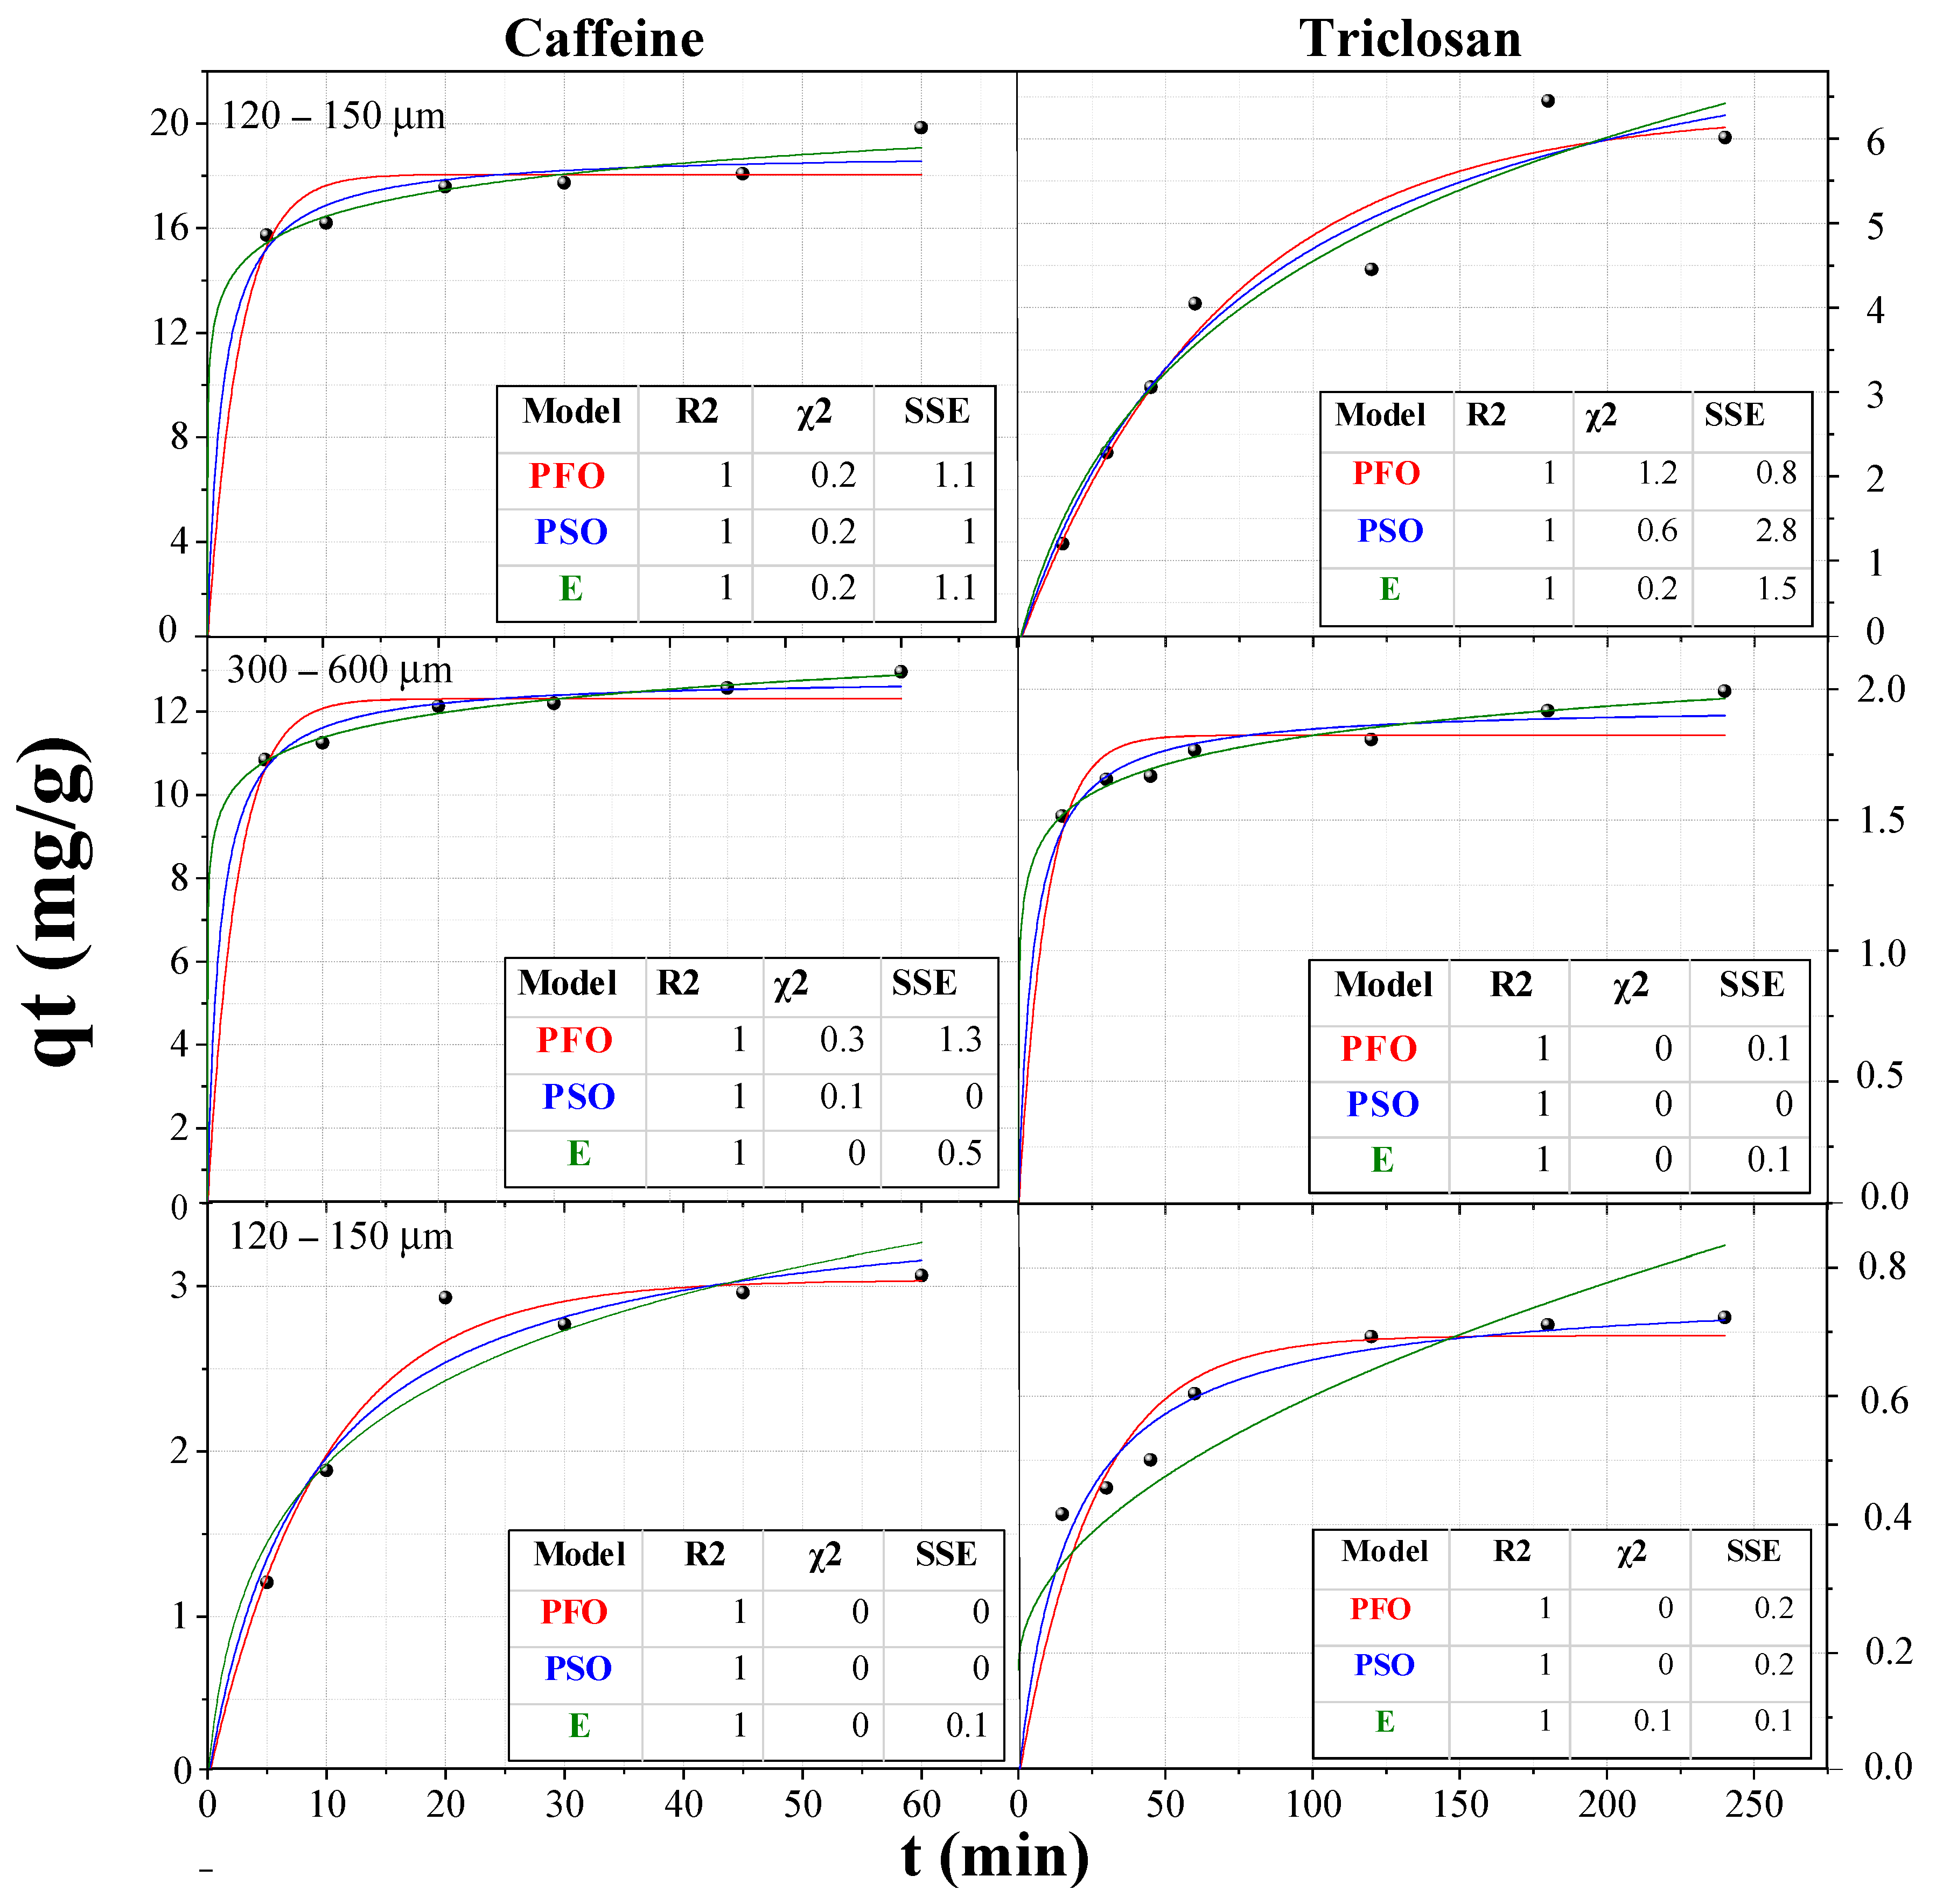
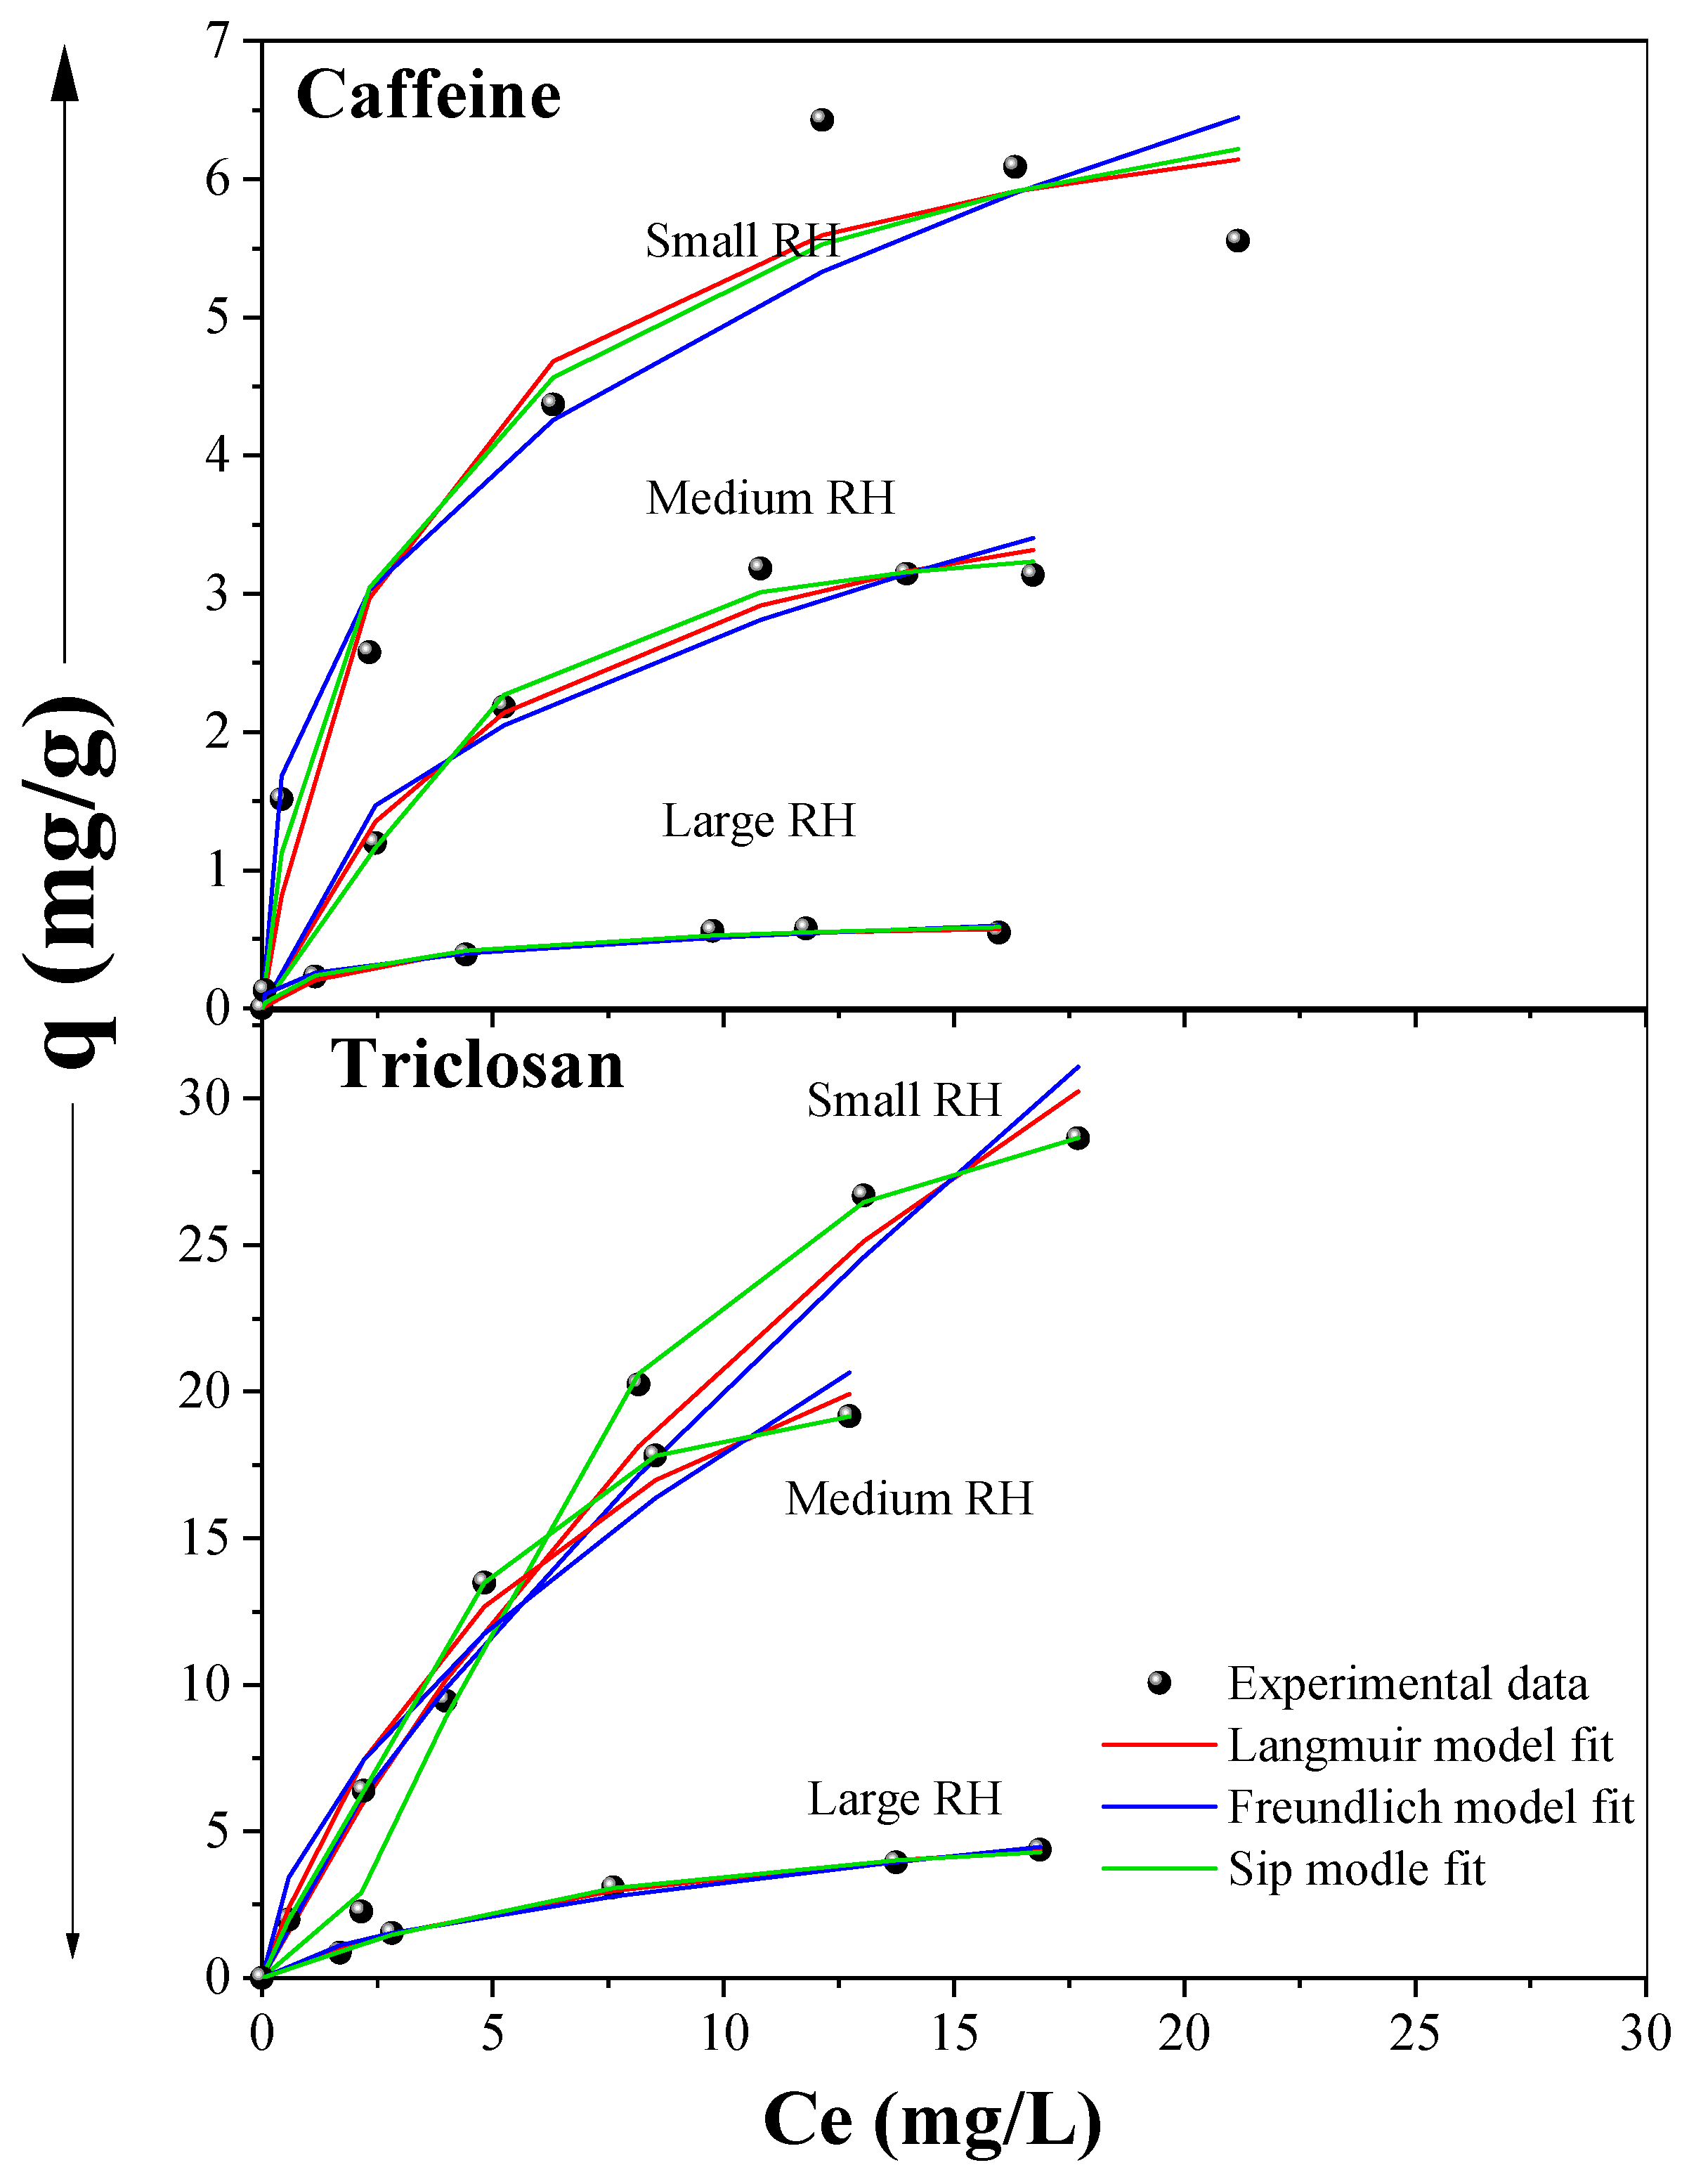
3.6. Adsorption Isotherms and Kinetics

The adsorption of caffeine and triclosan on RH was analyzed at different times to study the rate of adsorption and the adsorption mechanism. The fitting to the different models is presented in Figure 5. The caffeine adsorption on large and small RH, and triclosan adsorption on large RH particles, were better fitted to the pseudo-second-order model (R2 = 0.971–0.987). Meanwhile, the adsorption using medium size particles better fitted the Elovich model (R2 = 0.996–0.999) for both contaminants. The χ2 and SSE values show lower values (closer to zero) for the models that best fit the data obtained (higher R2, closer to 1).
The pseudo-second-order model assumes that the contaminant concentration is constant over time and that the total number of active sites depends on the amount of contaminant adsorbed at equilibrium [55]. Caffeine and triclosan adsorption also followed a pseudo-second-order model when cotton-derived carbon microtubes were used. The qe values achieved were higher (caffeine = 19.8–212.9 times, triclosan = 39.8 times) than those of this study, probably due to the thermal modification of cotton and its greater surface area (380–540 m2/g) [56]. Although using modified residues such as oxidized biochar from pine needles and RH nanosilica, lower qe values were obtained (caffeine: 2.0–40.2 times, triclosan: 17.5 times) compared to those of this study [57,58].
On the other hand, the Elovich model assumes that the adsorbent surface is energetically heterogeneous, and that adsorption kinetics is not substantially affected by either desorption or interactions between adsorbed species [55,59]. Furthermore, α associated with adsorption rate and β associated with desorption rate indicate the interaction between RH and caffeine/triclosan. High values of α (13.6–110.1 mg/(g min)) and low values of β (0.62–0.68 mg/g) suggest the appearance of stable interactions [55]. In previous studies in which caffeine (adsorbent: tea-waste biochar and Gliricidia sepium biochar) and triclosan (adsorbent: PVC and activated carbon from stevia residues) were removed, the experimental data were also fitted to the Elovich model [55,59,60,61]. Some authors suggest that if the experimental data fit the Elovich model, chemisorption occurs [59,60]. Therefore, the best fit to pseudo-second-order/Elovich models adding to the presence of the functional groups in RH (Figure 3c) and pHpzc value suggest that the mechanism involved in the removal of caffeine and triclosan using RH was chemisorption. Nevertheless, other authors indicate that the fitting to the pseudo-second-order models do not reveal the adsorption mechanisms, since to determine the adsorption mechanisms (physics, chemistry), it is necessary to use several analytical techniques (FTIR, SEM, BET, Raman, Z potential, etc.) together with enthalpy and entropy changes (adsorption thermodynamics) and activation energies and adsorption [62]. Indeed, several studies suggest that caffeine/triclosan adsorption on materials like rice husk and carbonaceous materials involves a range of interactions, including π–π, hydrogen bonding, and electrostatic attractions. The adsorption efficiency is influenced by factors such as the pH of the medium and the charge of functional groups on the adsorbent’s surface. Moreover, caffeine, with its high dipole moment, forms electrostatic bonds with charged functional groups on the adsorbent, such as OH and COOH groups. Furthermore, the presence of polar groups on the adsorbent’s surface allows for dipole–dipole interactions with caffeine/triclosan [41,43]. These findings are consistent with the conditions of our study, suggesting that the predominant mechanism for the removal of caffeine and triclosan involves π–π stacking, hydrogen bonding, and electrostatic attractions. The parameters for both models are shown in Table 1.
Table 1 also shows the parameters for the intraparticle diffusion model. According to Tran et al. (2017), the intraparticle diffusion model can be useful to identify the reaction pathways, the adsorption mechanisms and also predict the adsorption rate control step [63]. In the process of removing a contaminant present in an aqueous medium using an adsorbent (solid–liquid sorption), contaminant transfer is generally characterized by film diffusion or external diffusion, surface diffusion and pore diffusion, or combined surface and pore diffusion. In summary, if the qt vs. t1/2 curve passes through the origin, then the adsorption process is limited only by intraparticle diffusion. However, Figure 6 shows the presence of two linear zones, whereby the adsorption process is controlled by a two-step mechanism. In the first stage, caffeine/triclosan are transported from the liquid phase to the external surface of the RH through the hydrodynamic boundary layer (film diffusion). In the second stage, there is a slow diffusion (intraparticle diffusion) of the caffeine/triclosan molecules from the outside of the RH to its pores. In the final stage, the caffeine/triclosan are rapidly adsorbed in the pores [62].
On the other hand, the parameter values and the fittings to the Langmuir, Freundlich, and Sips isotherm models are shown in Table 1 and Figure 7, respectively. The adsorption of caffeine and triclosan fit well to the three isotherm models used. Nevertheless, the adsorption in the small (caffeine, triclosan), medium (caffeine, triclosan), and large (triclosan) RH particles show a better fitting to the Langmuir and Sips models (R2 > 0.91).
Langmuir’s model supposes that caffeine/triclosan adsorption occurs in a monolayer without interaction or steric hindrance between adsorbate molecules, because the active sites have the same energy (same affinity for adsorbate molecules) [55]. Meanwhile, the Sips model is a combination of Langmuir and Freundlich models, which indicates that caffeine/triclosan can occupy more than one RH adsorption site (heterogeneous surface). The qm values calculated with the Langmuir (caffeine) and Sips (triclosan) models are very close to those obtained experimentally, which suggests that a monolayer and heterogeneous adsorption occurs, respectively [64]. The results obtained coincide with studies in which it is observed that the adsorption of caffeine on adsorbents such as tea leaves, orange, and banana peels, activated carbon from grape stem, water hyacinth biochar, activated carbon from coconut residues, etc., fit better the Langmuir model [38,65]. Likewise, triclosan adsorption using nanosilica from RH and activated carbon from civilian gas masks fit better to the Sips model [56,58].
On the other hand, the adsorption using the large RH particles fit better to the Freundlich model (R2 = 0.96) in the caffeine removal. The same happened with adsorbents such as biochar from tea-waste and Gliricidia sepium [59,60]. The Freundlich model supposes multilayer adsorption because the energy is not equal on the surface. Likewise, the χ2 (0.001–0.257) and SSE (0.008–1.693) values are lower (close to zero) in the models that better fit the data obtained.
Furthermore, the KL and n values in the Langmuir and Freundlich models are lower than 1.0, which indicates that the caffeine/triclosan adsorption in RH is favorable. In the triclosan adsorption, the KL value is even lower than 0.1 (low surface energy), which indicates a greater intensity in the bonds between triclosan and RH [38,66].
These results show that the RH adsorption capacity is a function of the particle size and the characteristics of the contaminant (solubility, Kow). The small RH particles have a higher adsorption capacity for caffeine/triclosan (8.1/31.4 mg/g) than the medium (3.4/22.6 mg/g) and the large RH particles (0.8/5.7 mg/g), respectively.
The adsorption capacity achieved by RH in caffeine removal is comparable to that achieved with other raw low-cost adsorbents, such as groundnut shell (100 µm, 4.21 mg/g), grape stalk (700 µm, 0.938 mg/g), Balanites aegyptiaca seeds (<100 µm, 4.28 mg/g), and treated adsorbents: pine needles oxidized biochar (<300 µm, 5.35 mg/g) and rice husk charcoal (8.0 mg/g) [22,41,67]. The caffeine adsorption by RH is even higher than adsorbents such as grape stalk (~1 mg/g), which has greater surface area (6.23 m2/g) and pore volume (0.003 cm3/g), comparable to RH (0.006 cm3/g).
Something similar happened in the removal of triclosan with activated carbon from nanosilica from RH with a specific surface between 208 and 223 m2/g (2.74 mg/g) [58], coconut pulp residues of 595 µm (2.02–31.57 mg/g) [21], and microplastic polystyrene with a specific surface between 0.58 and 2.53 m2/g (0.29–0.43 mg/g) [9]. However, there are other adsorbents (e.g., grape stalk modified with phosphoric acid, grape-stalk-activated carbon, pineapple-plant-leaves-activated carbon, etc.) with higher adsorption capacity than RH (>120 mg/g) to remove caffeine, triclosan, and other ECs [41]. The latter received chemical or thermal treatments, but the costs or the environmental impact that could be generated are not always indicated. Raninga et al. (2023) indicates that the cost of physical and chemical activation with LiOH, KOH, and H2SO4 ranges from 1.72 to 2.89 UDS/kg of adsorbent [68]. Similarly, H3PO4-modified berry leaves are priced at USD 10.68/kg, while activated carbon costs USD 172.96/kg [69].

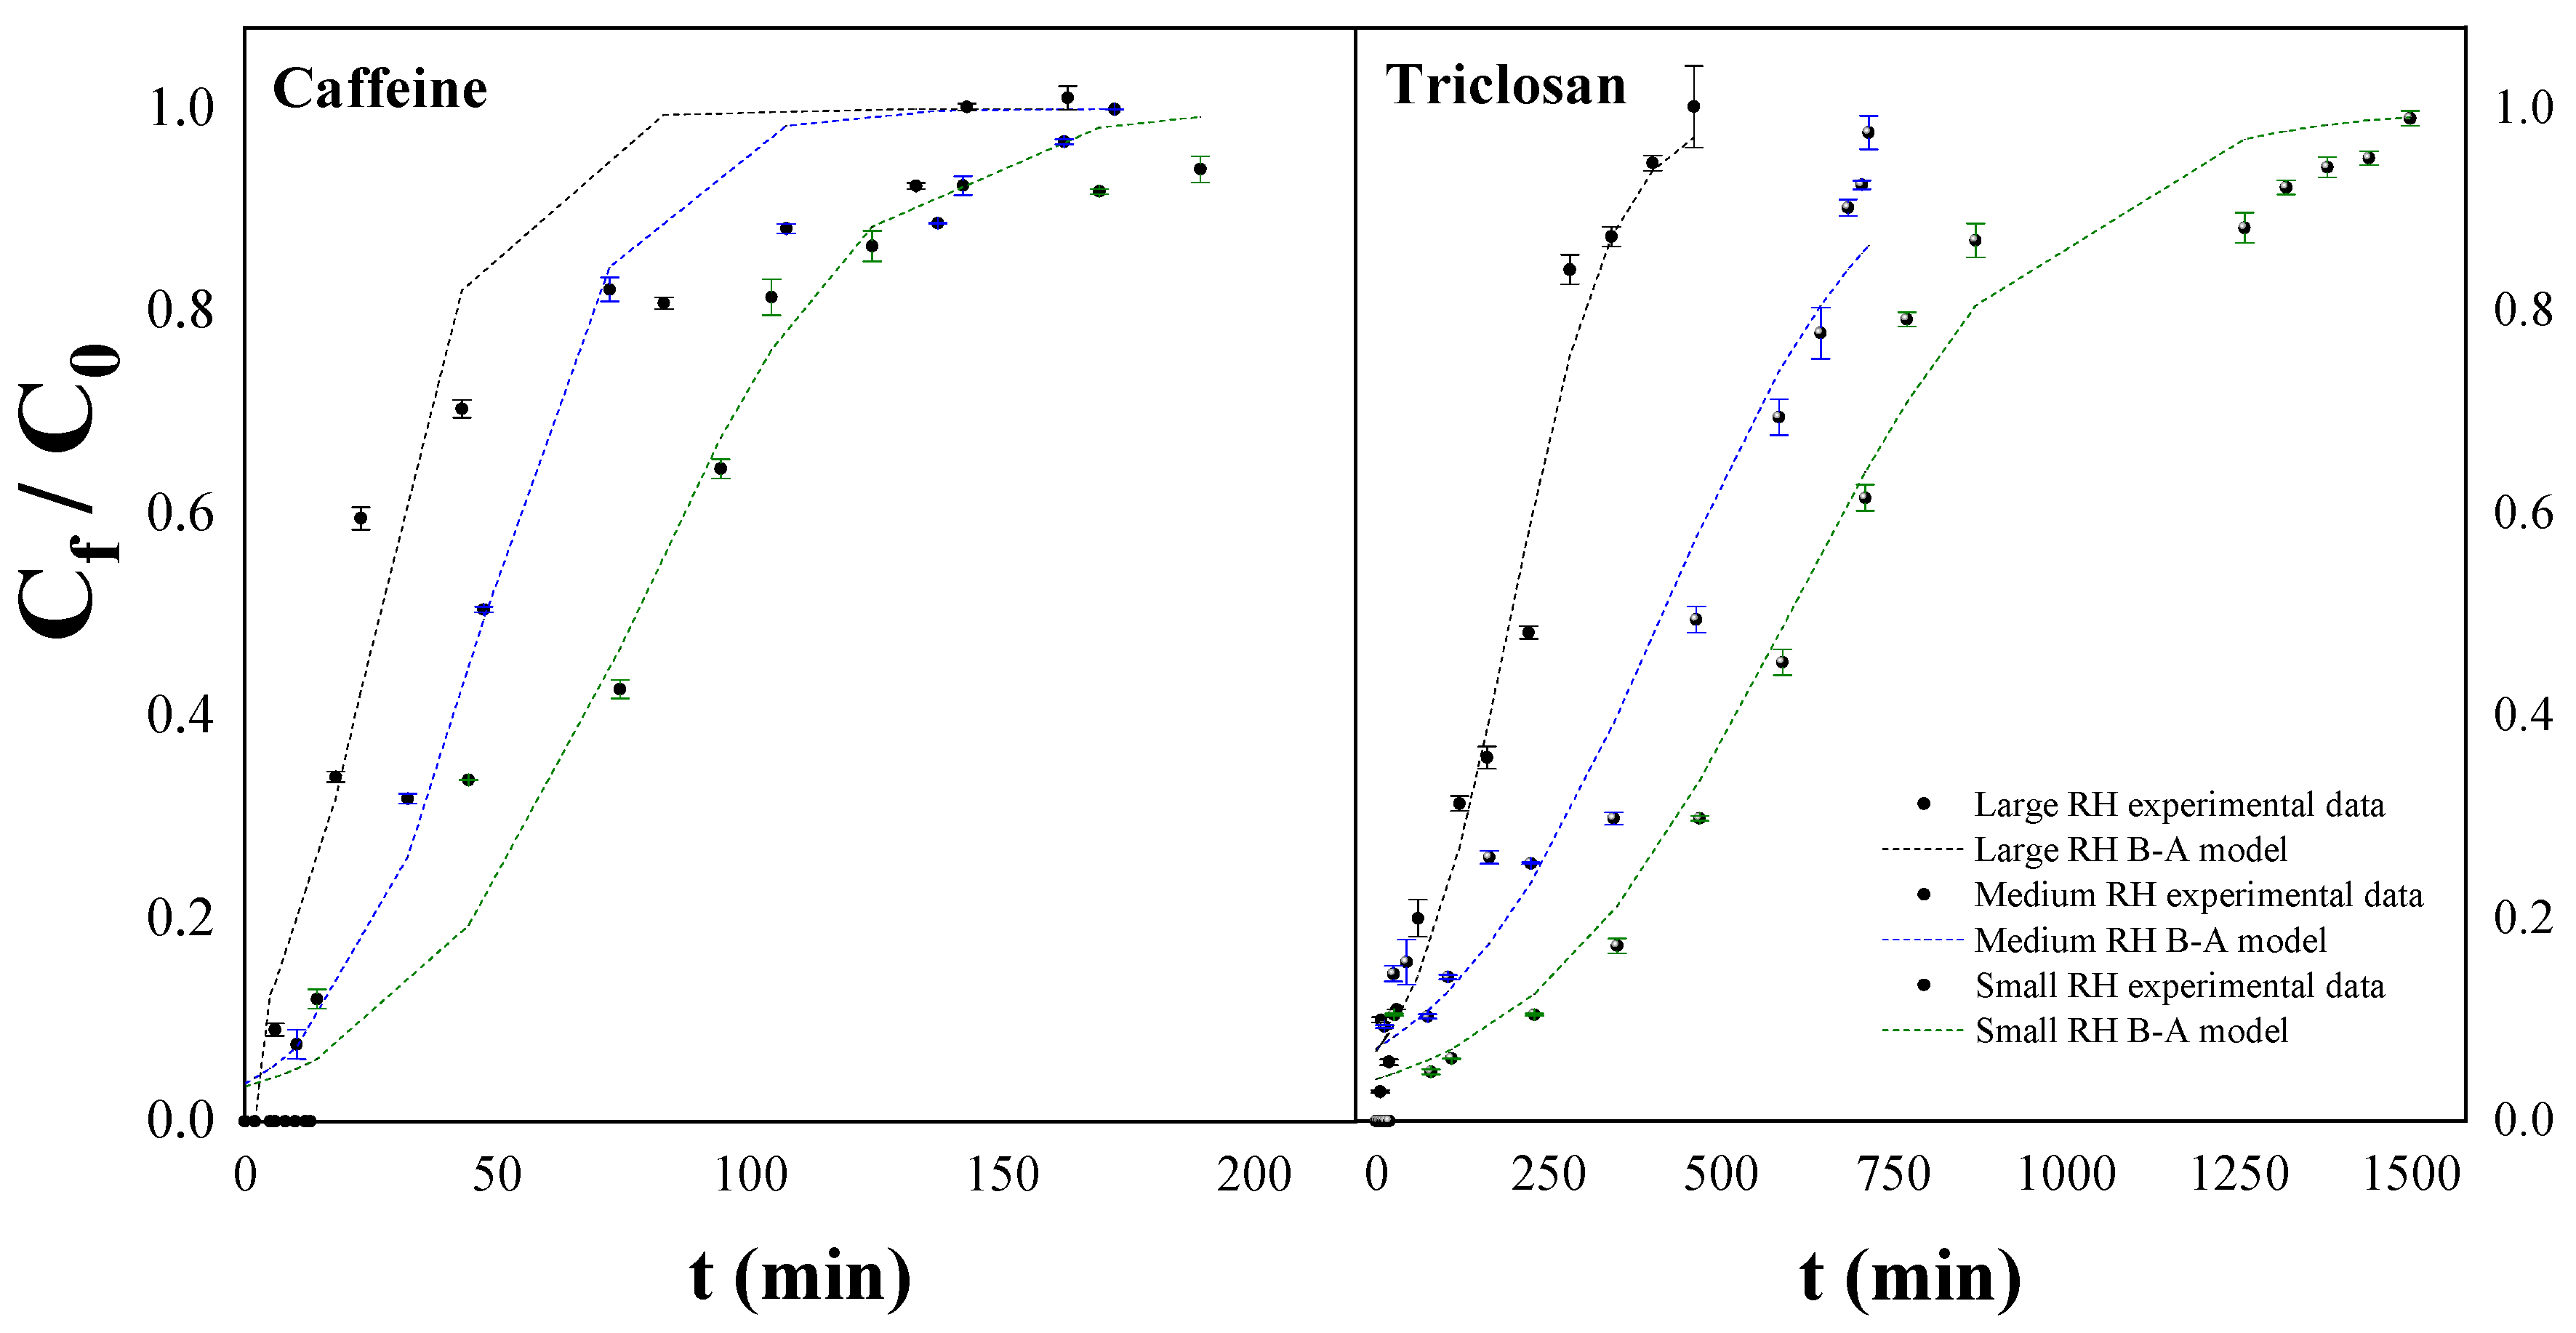
3.7. Fixed-Bed Columns

The main results obtained in fixed-bed columns are summarized in Table 2. The tests in the fixed-bed columns were carried out to determine the influence of the bed height and the hydraulic load on the three particle sizes of RH to remove caffeine/triclosan. The efficiencies achieved in the removal of caffeine and triclosan using the three sizes of RH at bed heights of 4, 5 and 8 cm did not show significant differences (p > 0.05). On the other hand, the hydraulic load (4 m3/m2-day) produced clogging in the columns that used the small RH at 30 min of operation (spillage of the caffeine/triclosan solution was observed at the top of the column), so it was not possible to construct the breakthrough curve for this hydraulic load and establish its influence on the three particle sizes. The experimental breakthrough curves for the three RH particle sizes using a bed of 4 cm heigh and with a hydraulic loading rate of 2 m3/m2-day are presented in Figure 8.
The size of the adsorbent particles is a very important parameter in the operation of fixed-bed columns since it defines the available surface area, the void fraction, and the available path for the movement of caffeine/triclosan solutions [70]. An increase in particle size decreased the adsorption capacity at breakthrough time (qb decrease caffeine = 16.7–33.3% and triclosan = 43.3–60%) and saturation time (qs decrease: caffeine = 7.7–23.1% and triclosan = 19.8–33.3%). The smaller RH particles allow a shorter diffusion path for the caffeine/triclosan molecules [70]. The effect of particle size on adsorption capacity in both breakthrough time and saturation time is lower for caffeine, probably due to its physicochemical characteristics (e.g., high water solubility) [5]. Something similar happens with the values of the breakthrough/saturation time. Therefore, an increase in RH particle size results in faster bed depletion and lower volume (Vb) of treated water up to the breakthrough time [39].
The smaller RH particles also had lower hMTZ than the medium (1.3/1.1) and large (2.6/1.1) particles for both contaminants (caffeine/triclosan). A smaller particle size allows a higher mass transfer rate and thus a smaller mass transfer zone [71]. This shows that the small RH has better performance. A similar behavior was observed in cadmium adsorption when using date palm trunk fiber with size ranges of 250–355 and 560–630 µm [72]. A smaller mass transfer zone with a higher slope can also be identified on the Cf/Co vs. t plot (Figure 7). Increasing hMTZ in the larger RH reduced fractional bed utilization (FBU) by 2.97–14.21% for caffeine and 7.38–9.40% for triclosan. The larger particles leave larger spaces between each other (the fraction of voids in the bed increases), so the contact time between the caffeine/triclosan and the RH particles decreases, and this reduces the fraction of bed which is being effectively used [70].
Table 3 shows the results of the fitting of the experimental data obtained in the absorption of fixed-bed columns to the Bohart–Adams model. The Bohart–Adams model correlates C/Co with contact time in a continuous adsorption system. The model considers only the first region of the breakdown curve where C/Co ˂ 0.5 and assumes negligible mass transfer–movement of caffeine/triclosan from the aqueous medium to the RH. Therefore, the adsorption rate will depend on the residual capacity of the adsorbent and the concentration of the contaminants [73]. Both caffeine and triclosan adsorption show a relatively good fit to the model, presenting R2 values between 0.91 and 0.99 and very low values of SSE (2.706 × 10⁻³–0.245) and χ2 (6.151 × 10⁻³–0.032). A good fit of the experimental data to the Bohart–Adams model indicates that surface diffusion is the rate-limiting step in the adsorption process. This is because the Bohart–Adams model is designed to capture the early stages of adsorption, where the rate of transfer at the surface dominates, and the external mass transfer is negligible [74].
The values of adsorption capacity (No) for triclosan are higher, and of the Bohart–Adams constant (KBA) are lower compared to those for caffeine. This is associated with the lower solubility/higher hydrophobicity of triclosan. A similar behavior was observed in the removal of sulfapyridine (less soluble in water) and sulfamethoxazole (more soluble in water), in which sulfapyridine reached a higher removal (20.72 mg/L) [73]. Furthermore, the smallest particles presented the greatest adsorption capacities, which is related to their largest surface area [1].

4. Conclusions

The use of rice husk represents a promising alternative for the removal of emerging contaminants such as caffeine and triclosan, as is evident from the batch/continuous tests carried out in this work. The optimal particle size for caffeine and triclosan removal was found to be the small (120–150 µm), with recommended doses of 4.0 g/L and 1.5 g/L, along with contact times of 180 min and 60 min, respectively. The size of the RH and the characteristics of caffeine/triclosan (solubility, Kow) notably influenced their adsorption in batch and fixed-bed columns. The optimal dose of the small RH was lower than the other two sizes (caffeine = 2.1–12.5 times, triclosan = 2.0–6.7 times), reaching efficiencies of 72.5 and 97.2% for caffeine and triclosan, respectively. The optimal contact time for caffeine removal was 3.0 times greater than triclosan. The adsorption of both contaminants for most particle sizes was better fitted to the Elovich and Sips/Langmuir models; and the removal of both contaminants was dominated by film and intraparticle diffusion. In addition, the operation of the fixed-bed columns fitted the Bohart–Adams model quite well, with the small RH particles providing the most efficient removal of both contaminants (caffeine: qb = 0.12 mg/g, qs = 0.13 mg/g and triclosan: qb = 0.30 mg/g, qs = 1.26 mg/g). The relatively high adsorptive capacity of RH, and its affinity with the contaminants studied, open the possibility of exploring its use in water treatment technologies that could benefit from its availability, ease of processing, and relatively low cost.

Author Contributions

Conceptualization, C.A.V.-A. and V.H.G.; methodology, C.E.A.-N. and J.C.; formal analysis, C.E.A.-N.; investigation, C.E.A.-N. and J.C; resources, C.A.V.-A. and V.H.G.; data curation, C.E.A.-N. and J.C.; writing—original draft preparation, C.E.A.-N. and J.C.; writing—review and editing, C.E.A.-N., C.A.V.-A. and V.H.G.; supervision, C.A.V.-A. and V.H.G.; project administration, C.A.V.-A. and V.H.G.; funding acquisition, C.E.A.-N., C.A.V.-A. and V.H.G. All authors have read and agreed to the published version of the manuscript.

Funding

This research was funded by Escuela Politécnica Nacional through the projects PIS-18-01 and by FONDECYT (Grant project 11190352) from Chile.

Data Availability Statement

Data sharing is not applicable to this article.

Acknowledgments

The authors acknowledge the support of the Escuela Politécnica Nacional (EPN) through the grant project PIS-18-01. C.A. Villamar-Ayala thanks the financial support from Fondecyt (grant project 11190352). Cristina Almeida would also like to pay a fair tribute with your work, to all the people who have suffered and died from COVID-19, mainly to her father.

Conflicts of Interest

The authors declare no conflict of interest.

References

  1. Almeida-Naranjo, C.E.; Guerrero, V.H.; Villamar-Ayala, C.A. Emerging Contaminants and Their Removal from Aqueous Media Using Conventional/Non-Conventional Adsorbents: A Glance at the Relationship between Materials, Processes and Technologies. Water 2023, 15, 1626. [Google Scholar] [CrossRef]
  2. Chen, Z.; Guo, J.; Jiang, Y.; Shao, Y. High Concentration and High Dose of Disinfectants and Antibiotics Used during the COVID-19 Pandemic Threaten Human Health. Environ. Sci. Eur. 2021, 33, 11. [Google Scholar] [CrossRef] [PubMed]
  3. Gil, A.; Taoufik, N.; García, A.M.; Korili, S.A. Comparative Removal of Emerging Contaminants from Aqueous Solution by Adsorption on an Activated Carbon. Environ. Technol. 2018, 40, 3017–3030. [Google Scholar] [CrossRef] [PubMed]
  4. Peng, J.; Wang, X.; Yin, F.; Xu, G. Characterizing the Removal Routes of Seven Pharmaceuticals in the Activated Sludge Process. Sci. Total Environ. 2019, 650, 2437–2445. [Google Scholar] [CrossRef] [PubMed]
  5. Rigueto, C.V.T.; Nazari, M.T.; De Souza, C.F.; Cadore, J.S.; Brião, V.B.; Piccin, J.S. Alternative Techniques for Caffeine Removal from Wastewater: An Overview of Opportunities and Challenges. J. Water Process Eng. 2020, 35, 101231. [Google Scholar] [CrossRef]
  6. Rodríguez-Gil, J.L.; Cáceres, N.; Dafouz, R.; Valcárcel, Y. Caffeine and Paraxanthine in Aquatic Systems: Global Exposure Distributions and Probabilistic Risk Assessment. Sci. Total Environ. 2018, 612, 1058–1071. [Google Scholar] [CrossRef]
  7. Dafouz, R.; Cáceres, N.; Rodríguez-gil, J.L.; Mastroianni, N.; López, M.; Alda, D.; Barceló, D.; Gil, Á.; Miguel, D.; Valcárcel, Y. Science of the Total Environment Does the Presence of Caffeine in the Marine Environment Represent an Environmental Risk? A Regional and Global Study. Sci. Total Environ. 2018, 615, 632–642. [Google Scholar] [CrossRef]
  8. Triwiswara, M.; Kang, J.K.; Moon, J.K.; Lee, C.G.; Park, S.J. Removal of Triclosan from Aqueous Solution Using Thermally Treated Rice Husks. Desalination Water Treat. 2020, 202, 317–326. [Google Scholar] [CrossRef]
  9. Li, Y.; Li, M.; Li, Z.; Yang, L.; Liu, X. Effects of Particle Size and Solution Chemistry on Triclosan Sorption on Polystyrene Microplastic. Chemosphere 2019, 231, 308–314. [Google Scholar] [CrossRef]
  10. Kaur, H.; Hippargi, G.; Pophali, G.R.; Bansiwal, A. Biomimetic Lipophilic Activated Carbon for Enhanced Removal of Triclosan from Water. J. Colloid. Interface Sci. 2019, 535, 111–121. [Google Scholar] [CrossRef]
  11. Luo, Z.; He, Y.; Zhi, D.; Luo, L.; Sun, Y.; Khan, E.; Wang, L.; Peng, Y.; Zhou, Y.; Tsang, D.C.W. Current Progress in Treatment Techniques of Triclosan from Wastewater: A Review. Sci. Total Environ. 2019, 696, 133990. [Google Scholar] [CrossRef]
  12. Chaukura, N.; Gwenzi, W.; Tavengwa, N.; Manyuchi, M.M. Biosorbents for the Removal of Synthetic Organics and Emerging Pollutants: Opportunities and Challenges for Developing Countries. Environ. Dev. 2016, 19, 84–89. [Google Scholar] [CrossRef]
  13. Santaeufemia, S.; Abalde, J.; Torres, E. Eco-Friendly Rapid Removal of Triclosan from Seawater Using Biomass of a Microalgal Species: Kinetic and Equilibrium Studies. J. Hazard. Mater. 2019, 369, 674–683. [Google Scholar] [CrossRef] [PubMed]
  14. Ijanu, E.M.; Kamaruddin, M.A.; Norashiddin, F.A. Coffee Processing Wastewater Treatment: A Critical Review on Current Treatment Technologies with a Proposed Alternative. Appl. Water Sci. 2020, 10, 1–11. [Google Scholar] [CrossRef]
  15. Parida, V.K.; Saidulu, D.; Majumder, A.; Srivastava, A.; Gupta, B.; Gupta, A.K. Emerging Contaminants in Wastewater: A Critical Review on Occurrence, Existing Legislations, Risk Assessment, and Sustainable Treatment Alternatives. J. Environ. Chem. Eng. 2021, 9, 105966. [Google Scholar] [CrossRef]
  16. Mushtaq, S.; Aslam, Z.; Ali, R.; Aslam, U.; Naseem, S.; Ashraf, M.; Bello, M.M. Surfactant Modified Waste Ash for the Removal of Chloro and Nitro Group Substituted Benzene from Wastewater. Water Sci. Technol. 2022, 86, 1969–1980. [Google Scholar] [CrossRef]
  17. Zahir, A.; Aslam, Z.; Aslam, U.; Abdullah, A.; Ali, R.; Bello, M.M. Paspalum Notatum Grass-Waste-Based Adsorbent for Rhodamine B Removal from Polluted Water. Chem. Biochem. Eng. Q. 2020, 34, 93–104. [Google Scholar] [CrossRef]
  18. Barka, N.; Abdennouri, M.; El, M.; Qourzal, S. Biosorption Characteristics of Cadmium and Lead onto Eco-Friendly Dried Cactus (Opuntia Ficus Indica) Cladodes. J. Environ. Chem. Eng. 2013, 1, 144–149. [Google Scholar] [CrossRef]
  19. Shamsollahi, Z.; Partovinia, A. Recent Advances on Pollutants Removal by Rice Husk as a Bio-Based Adsorbent: A Critical Review. J. Environ. Manag. 2019, 246, 314–323. [Google Scholar] [CrossRef]
  20. Aslam, U.; Ramzan, N.; Aslam, Z.; Iqbal, T.; Sharif, S.; Hasan, S.W.U.; Malik, A. Enhancement of Fuel Characteristics of Rice Husk via Torrefaction Process. Waste Manag. Res. 2019, 37, 737–745. [Google Scholar] [CrossRef]
  21. Khoriha, N.; Mohd, E.; Hadibarata, T. Triclosan Removal by Adsorption Using Activated Carbon Derived from Waste Biomass : Isotherms and Kinetic Studies. J. Chem. Soc. Dalton Trans. 2018, 65, 951–959. [Google Scholar] [CrossRef]
  22. Portinho, R.; Zanella, O.; Féris, L.A. Grape Stalk Application for Caffeine Removal through Adsorption. J. Environ. Manag. 2017, 202, 178–187. [Google Scholar] [CrossRef] [PubMed]
  23. Balarak, D.; Mostafapour, F.K.; Lee, S.M.; Jeon, C. Adsorption of Bisphenol A Using Dried Rice Husk: Equilibrium, Kinetic and Thermodynamic Studies. Appl. Chem. Eng. 2019, 30, 316–323. [Google Scholar]
  24. N’diaye, A.D.; Kankou, M.S. Sorption of Aspirin from Aqueous Solutions Using Rice Husk as Low Cost Sorbent. J. Environ. Treat. 2020, 8, 1–5. [Google Scholar]
  25. Triwiswara, M.; Lee, C.G.; Moon, J.K.; Park, S.J. Adsorption of Triclosan from Aqueous Solution onto Char Derived from Palm Kernel Shell. Desalin. Water Treat. 2020, 177, 71–79. [Google Scholar] [CrossRef]
  26. Anastopoulos, I.; Pashalidis, I.; Orfanos, A.G.; Manariotis, I.D.; Tatarchuk, T.; Sellaoui, L.; Bonilla-Petriciolet, A.; Mittal, A.; Núñez-Delgado, A. Removal of Caffeine, Nicotine and Amoxicillin from (Waste)Waters by Various Adsorbents. A Review. J. Environ. Manag. 2020, 261, 110236. [Google Scholar] [CrossRef]
  27. Panneerselvam, P.; Morad, N.; Tan, K.A. Magnetic Nanoparticle (F3O4) Impregnated onto Tea Waste for the Removal of Nickel(II) from Aqueous Solution. J. Hazard. Mater. 2011, 186, 160–168. [Google Scholar] [CrossRef]
  28. Quan, B.; Li, X.; Zhang, H.; Zhang, C.; Ming, Y.; Huang, Y.; Xi, Y.; Weihua, X.; Yunguo, L.; Tang, Y. Technology and Principle of Removing Triclosan from Aqueous Media: A Review. Chem. Eng. J. 2019, 378, 122185. [Google Scholar] [CrossRef]
  29. Yaseen, D.A.; Scholz, M. Textile Dye Wastewater Characteristics and Constituents of Synthetic Effluents: A Critical Review. Int. J. Environ. Sci. Technol. 2019, 16, 1193–1226. [Google Scholar] [CrossRef]
  30. Sandoval, R.; Cooper, A.M.; Aymar, K.; Jain, A.; Hristovski, K. Removal of Arsenic and Methylene Blue from Water by Granular Activated Carbon Media Impregnated with Zirconium Dioxide Nanoparticles. J. Hazard. Mater. 2011, 193, 296–303. [Google Scholar] [CrossRef]
  31. ASTM D4442-2020; Standard Test Methods for Direct Moisture Content Measurement of Wood and Wood-Based Materials. American Society for Testing Materials: West Conshohocken, PA, USA, 2020.
  32. ASTM D 1107-2021; Standard Test Method for Ethanol-Toluene Solubility of Wood. American Society for Testing Materials: West Conshohocken, PA, USA, 2021.
  33. ASTM D1110-21; Standard Test Methods for Water Solubility of Wood. American Society for Testing Materials: West Conshohocken, PA, USA, 2021.
  34. ASTM D 1106-2021; Standard Test Method for Acid-Insoluble Lignin in Wood. American Society for Testing Materials: West Conshohocken, PA, USA, 2021.
  35. ASTM-D1109–84(2021); Standard Test Method for 1% Sodium Hydroxide Solubility of Wood. American Society for Testing Materials: West Conshohocken, PA, USA, 2021.
  36. ASTM D1102-84(2021); Standard Test Method for Ash in Wood. American Society for Testing Materials: West Conshohocken, PA, USA, 2021.
  37. ASTM E 872-19; Standard Test Method for Volatile Matter in the Analysis of Particulate Wood Fuels. American Society for Testing Materials: West Conshohocken, PA, USA, 2019.
  38. Almeida-Naranjo, C.E.; Aldás, M.B.; Cabrera, G.; Guerrero, V.H. Caffeine Removal from Synthetic Wastewater Using Magnetic Fruit Peel Composites: Material Characterization, Isotherm and Kinetic Studies. Environ. Chall. 2021, 5, 100343. [Google Scholar] [CrossRef]
  39. Peñafiel, M.E.; Matesanz, J.M.; Vanegas, E.; Bermejo, D.; Mosteo, R.; Ormad, M.P. Comparative Adsorption of Ciprofloxacin on Sugarcane Bagasse from Ecuador and on Commercial Powdered Activated Carbon. Sci. Total Environ. 2021, 750, 141498. [Google Scholar] [CrossRef] [PubMed]
  40. Sotelo, J.L.; Rodríguez, A.; Álvarez, S.; García, J. Removal of Caffeine and Diclofenac on Activated Carbon in Fixed Bed Column. Chem. Eng. Res. Des. 2012, 90, 967–974. [Google Scholar] [CrossRef]
  41. Fakioğlu, M.; Kalpaklı, Y. Mechanism and Behavior of Caffeine Sorption: Affecting Factors. RSC Adv. 2022, 12, 26504–26513. [Google Scholar] [CrossRef]
  42. Ali, I.; Imanova, G.T.; Albishri, H.M.; Alshitari, W.H.; Locatelli, M.; Siddiqui, M.N.; Hameed, A.M. An Ionic-Liquid-Imprinted Nanocomposite Adsorbent: Simulation, Kinetics and Thermodynamic Studies of Triclosan Endocrine Disturbing Water Contaminant Removal. Molecules 2022, 27, 5358. [Google Scholar] [CrossRef]
  43. Cho, E.J.; Kang, J.K.; Moon, J.K.; Um, B.H.; Lee, C.G.; Jeong, S.; Park, S.J. Removal of Triclosan from Aqueous Solution via Adsorption by Kenaf-derived Biochar: Its Adsorption Mechanism Study via Spectroscopic and Experimental Approaches. J. Environ. Chem. Eng. 2021, 9, 106343. [Google Scholar] [CrossRef]
  44. Degermenci, G.; Degermenci, N.; Ayvaoglu, V.; Durmaz, E.; Cakir, D.; Akan, E. Adsorption of Reactive Dyes on Lignocellulosic Waste; Characterization, Equilibrium, Kinetic and Thermodynamic Studies. J. Clean. Prod. 2019, 225, 1220–1229. [Google Scholar] [CrossRef]
  45. Chakraborty, S.; Chowdhury, S.; Das Saha, P. Adsorption of Crystal Violet from Aqueous Solution Onto. Carbohydr. Polym. 2011, 86, 1533–1541. [Google Scholar] [CrossRef]
  46. Kaur, P.; Kaur, P.; Kaur, K. Adsorptive Removal of Imazethapyr and Imazamox from Aqueous Solution Using Modified Rice Husk. J. Clean. Prod. 2020, 244, 118699. [Google Scholar] [CrossRef]
  47. Gajera, Z.R.; Verma, K.; Tekade, S.P.; Sawarkar, A.N. Kinetics of Co-Gasification of Rice Husk Biomass and High Sulphur Petroleum Coke with Oxygen as Gasifying Medium via TGA. Bioresour. Technol. Rep. 2020, 11, 100479. [Google Scholar] [CrossRef]
  48. Daffalla, S.B.; Mukhtar, H.; Shaharun, M.S. Preparation and Characterization of Rice Husk Adsorbents for Phenol Removal from Aqueous Systems. PLoS ONE 2020, 15, e0243540. [Google Scholar] [CrossRef] [PubMed]
  49. Nizamuddin, S.; Siddiqui, M.T.H.; Baloch, H.A.; Mubarak, N.M.; Griffin, G.; Madapusi, S.; Tanksale, A. Upgradation of Chemical, Fuel, Thermal, and Structural Properties of Rice Husk through Microwave-Assisted Hydrothermal Carbonization. Environ. Sci. Pollut. Res. 2018, 25, 17529–17539. [Google Scholar] [CrossRef] [PubMed]
  50. Wei, Q.; Li, X.; Zhang, J.; Hu, B.; Zhu, W.; Liang, W.; Sun, K. Full-Size Pore Structure Characterization of Deep-Buried Coals and Its Impact on Methane Adsorption Capacity: A Case Study of the Shihezi Formation Coals from the Panji Deep Area in Huainan Coalfield, Southern North China. J. Pet. Sci. Eng. 2019, 173, 975–989. [Google Scholar] [CrossRef]
  51. Ata, A.; Nalcaci, O.O.; Ovez, B. Macro Algae Gracilaria Verrucosa as a Biosorbent: A Study of Sorption Mechanisms. Algal Res. 2012, 1, 194–204. [Google Scholar] [CrossRef]
  52. Noreen, S.; Bhatti, H.N.; Nausheen, S.; Sadaf, S.; Ashfaq, M. Batch and Fixed Bed Adsorption Study for the Removal of Drimarine Black CL-B Dye from Aqueous Solution Using a Lignocellulosic Waste: A Cost Affective Adsorbent. Ind. Crops Prod. 2013, 50, 568–579. [Google Scholar] [CrossRef]
  53. Yao, N.; Li, C.; Yu, J.; Xu, Q.; Wei, S.; Tian, Z.; Yang, Z.; Yang, W.; Shen, J. Insight into Adsorption of Combined Antibiotic-Heavy Metal Contaminants on Graphene Oxide in Water. Sep. Purif. Technol. 2020, 236, 116278. [Google Scholar] [CrossRef]
  54. Montaseri, H.; Forbes, P.B.C. A Review of Monitoring Methods for Triclosan and Its Occurrence in Aquatic Environments. TrAC Trends Anal. Chem. 2016, 85, 221–231. [Google Scholar] [CrossRef]
  55. Yokoyama, J.T.C.; Cazetta, A.L.; Bedin, K.C.; Spessato, L.; Fonseca, J.M.; Carraro, P.S.; Ronix, A.; Silva, M.C.; Silva, T.L. Stevia Residue as New Precursor of CO2-Activated Carbon : Optimization of Preparation Condition and Adsorption Study of Triclosan. Ecotoxicol. Environ. Saf. 2019, 172, 403–410. [Google Scholar] [CrossRef]
  56. Shirvanimoghaddam, K.; Trojanowska, E. Sorption of Pharmaceuticals and Personal Care Products (PPCPs) onto a Sustainable Cotton Based Adsorbent. Sustain. Chem. Pharm. 2020, 18, 100324. [Google Scholar] [CrossRef]
  57. Anastopoulos, I.; Katsouromalli, A.; Pashalidis, I. Oxidized Biochar Obtained from Pine Needles as a Novel Adsorbent to Remove Caffeine from Aqueous Solutions. J. Mol. Liq. 2020, 304, 112661. [Google Scholar] [CrossRef]
  58. Tejedor, J.; Guerrero, V.H.; Vizuete, K.; Debut, A. Environmentally Friendly Synthesis of Silicon Dioxide Nanoparticles and Their Application for the Removal of Emerging Contaminants in Aqueous Media. J. Phys. Conf. Ser. 2022, 2238, 012005. [Google Scholar] [CrossRef]
  59. Keerthanan, S.; Rajapaksha, S.M.; Trakal, L.; Vithanage, M. Caffeine Removal by Gliricidia Sepium Biochar: Influence of Pyrolysis Temperature and Physicochemical Properties. Environ. Res. 2020, 189, 109865. [Google Scholar] [CrossRef] [PubMed]
  60. Keerthanan, S.; Bhatnagar, A.; Mahatantila, K.; Jayasinghe, C. Engineered Tea-Waste Biochar for the Removal of Caffeine, a Model Compound in Pharmaceuticals and Personal Care Products (PPCPs), from Aqueous Media. Environ. Technol. Innov. 2020, 19, 100847. [Google Scholar] [CrossRef]
  61. Ma, J.; Zhao, J.; Zhu, Z.; Li, L.; Yu, F. Effect of Microplastic Size on the Adsorption Behavior and Mechanism of Triclosan on Polyvinyl Chloride. Environ. Pollut. 2019, 254, 113104. [Google Scholar] [CrossRef] [PubMed]
  62. Tran, H.N.; You, S.; Hosseini-bandegharaei, A.; Chao, H. Mistakes and Inconsistencies Regarding Adsorption of Contaminants from Aqueous Solutions: A Critical Review. Water Res. 2017, 120, 88–116. [Google Scholar] [CrossRef] [PubMed]
  63. Tran, N.H.; Gin, K.Y.H. Occurrence and Removal of Pharmaceuticals, Hormones, Personal Care Products, and Endocrine Disrupters in a Full-Scale Water Reclamation Plant. Sci. Total Environ. 2017, 599–600, 1503–1516. [Google Scholar] [CrossRef]
  64. Nguyen, L.H.; Van, H.T.; Chu, T.H.H.; Nguyen, T.H.V.; Nguyen, T.D.; Hoang, L.P.; Hoang, V.H. Paper Waste Sludge-Derived Hydrochar Modified by Iron (III) Chloride for Enhancement of Ammonium Adsorption: An Adsorption Mechanism Study. Environ. Technol. Innov. 2021, 21, 101223. [Google Scholar] [CrossRef]
  65. Castillo, N.E.T.; Sierra, J.S.O.; Oyervides-muñoz, M.A.; Sosa-hernández, J.E.; Iqbal, H.M.N.; Parra-saldívar, R.; Elda, M. Exploring the Potential of Coffee Husk as Caffeine Bio-Adsorbent—A Mini-Review. Case Stud. Chem. Environ. Eng. 2020, 3, 100070. [Google Scholar] [CrossRef]
  66. N’diaye, A.D.; Kankou, M.S. Modeling of Adsorption Isotherms of Caffeine onto Groundnut Shell as a Low Cost Adsorbent. J. Environ. Treat. Tech. 2020, 8, 1191–1195. [Google Scholar] [CrossRef]
  67. N’diaye, A.D.; Ahmed Kankou, M.S. Valorization of Balanites Aegyptiaca Seeds from Mauritania : Modeling of Adsorption Isotherms of Caffeine from Aqueous Solution. J. Environ. Treat. Tech. 2019, 7, 450–455. [Google Scholar]
  68. Raninga, M.; Mudgal, A.; Patel, V.K.; Patel, J.; Sinha, M.K. Modification of activated carbon-based adsorbent for removal of industrial dyes and heavy metals: A review. Mat. Today Proc. 2023, 77, 286–294. [Google Scholar] [CrossRef]
  69. Ahmaruzzaman, M.; Ahmed, M.J.K.; Begum, S. Remediation of Eriochrome Black T-Contaminated Aqueous Solutions Utilizing H3PO4-Modified Berry Leaves as a Non-Conventional Adsorbent. Desal. Water Treat. 2015, 56, 1507–1519. [Google Scholar] [CrossRef]
  70. Sivarajasekar, N.; Mohanraj, N.; Baskar, R.; Sivamani, S. Fixed-Bed Adsorption of Ranitidine Hydrochloride Onto Microwave Assisted—Activated Aegle Marmelos Correa Fruit Shell: Statistical Optimization and Breakthrough Modelling. Arab. J. Sci. Eng. 2018, 43, 2205–2215. [Google Scholar] [CrossRef]
  71. Gupta, A.; Garg, A. Adsorption and Oxidation of Ciprofloxacin in a Fixed Bed Column Using Activated Sludge Derived Activated Carbon. J. Environ. Manag. 2019, 250, 109474. [Google Scholar] [CrossRef]
  72. Al-shawabkeh, A.F.; Omar, W.; Hasseine, A.; Al-amayreh, M. Experimental Study of the Application of Date Palm Trunk Fiber as Biosorbent for Removal Cadmium Using a Fixed Bed Column : Investigation of the Influence of Particle Size Experimental Study of the Application of Date Palm Trunk Fiber as Biosorbent for Re. Desal. Water Treat. 2021, 223, 328–334. [Google Scholar] [CrossRef]
  73. Ahmed, M.J.; Hameed, B.H. Removal of Emerging Pharmaceutical Contaminants by Adsorption in a Fixed- Bed Column: A Review. Ecotoxicol. Environ. Saf. 2018, 149, 257–266. [Google Scholar] [CrossRef]
  74. de Franco, M.A.E.; de Carvalho, C.B.; Bonetto, M.M.; Soares, R.d.P.; Féris, L.A. Removal of Amoxicillin from Water by Adsorption onto Activated Carbon in Batch Process and Fixed Bed Column: Kinetics, Isotherms, Experimental Design and Breakthrough Curves Modelling. J. Clean. Prod. 2017, 161, 947–956. [Google Scholar] [CrossRef]
Figure 1. Experimental scheme followed in this study.
Water 16 00197 g001
Figure 2. Point of zero charge for the small (120–150 µm), medium (300–600 µm), and large (800–2000 µm) RH particles.
Water 16 00197 g002
Figure 3. RH characterization: (a) TGA curve of rice husk adsorbent. Inset: physical–chemical characterization and proximal analysis; (b) SEM analysis, nitrogen adsorption/desorption isotherms of RH, and pore radius distribution; (c) FTIR spectra for c left) caffeine, and c right) triclosan, before and after the caffeine/triclosan adsorption. RH small = 120–150 µm; RH medium = 300–600 µm; RH large = 800–2000 µm.
Water 16 00197 g003aWater 16 00197 g003b
Figure 4. Optimal dose/contact time: (a,b) caffeine removal and (c,d) triclosan removal. Caffeine/triclosan concentration= 30 mg/L; agitation rate= 150 rpm. Contact time in the optimal dose test = 180 min. Dose in the contact time test = optimal dose.
Water 16 00197 g004
Figure 5. Kinetics models for adsorption of caffeine and triclosan (concentration = 30 mg/L) on three particle sizes. Doses for caffeine/triclosan: small particles = 4.0/1.5 g/L; medium size particles: 8.5/2.5 g/L; and large particles: 50/10 g/L. Agitation rate = 150 rpm. Black points = experimental data; red line = pseudo-first-order model (PFO); blue line = pseudo-second-order model (PSO); green line = Elovich model (E).
Water 16 00197 g005
Figure 6. Intraparticle diffusion kinetics for adsorption of (a) caffeine and (b) triclosan.
Water 16 00197 g006
Figure 7. Isotherm models for caffeine and triclosan adsorption in three particle sizes.
Water 16 00197 g007
Figure 8. Effect of particle size and contaminant type on breakthrough curve. Bed height = 4 cm; hydraulic loading rate = 2 m3/m2-day.
Water 16 00197 g008
Table 1. Parameters of kinetics and isotherm models for caffeine and triclosan adsorption.
ModelParameterCaffeineTriclosan
Small
RH
Medium
RH
Large
RH
Small
RH
Medium
RH
Large
RH
Kinetics qe experimental [mg/g]5.2421.7870.64818.31112.4662.865
Pseudo-first-orderqe [mg/g]6.3291.8240.69518.05712.3143.038
k1 [min−1]0.0150.1070.0390.3750.3970.105
Pseudo-second-orderqe[mg/g]8.2711.9380.77018.95112.8263.591
k2 [g/(mg min)]0.0020.1060.0750.0430.0750.034
Elovichα [mg/(g min)]0.13713.6130.189110.13966.8880.844
β [mg/g]0.4200.6227.8910.6821.1941.285
Intra
particle
diffusion
Kp1 [mg/(g min1/2)]0.7210.0600.0460.8400.5810.773
C1 [mg/g]−1.6431.2950.22313.7439.502−0.535
R20.9890.9340.8950.9670.9880.999
SSE0.0330.0320.0190.0620.0108.436 × 10−4
Kp2 [mg/(g min1/2)]0.3580.0410.0070.9150.3300.131
C2 [mg/g]0.8781.3630.62112.47310.3832.063
R20.6010.9960.9960.8350.9960.984
SSE0.8806.500 × 10−51.760 × 10−60.4260.0016.944 × 10−4
IsothermsLangmuirqe experimental [mg/g]6.4253.1820.57828.63519.1644.378
qm [mg/g]7.0834.4330.66870.77230.6137.012
KL[L/mg]0.3090.1780.3820.0420.1470.097
R20.9410.9580.8990.9550.9850.996
χ20.3630.0320.0070.2570.0540.003
SSE1.8160.1290.01822.9953.2160.036
FreundlichKF [(mg/g)1−1/n]2.2640.9910.2493.4194.7230.819
1/n0.3430.4380.3160.7680.5800.601
R20.9250.9560.9560.9320.9520.980
χ20.4570.0750.0030.3940.1770.013
SSE2.2830.3000.00835.02710.5450.180
Sipsqm[mg/g]8.1473.4500.81031.40022.5795.747
KL [L/mg]0.2180.2760.2480.1650.2640.148
1/n0.7661.7600.7072.1961.5131.202
R20.9310.9910.9270.9980.9950.998
χ20.4230.0160.0130.0110.0180.001
SSE1.6940.0480.0050.9431.0620.019
Note: C1 and C2 = constant associated with the thickness of the boundary layer in linear zone 1 and 2, respectively. Kp1 and Kp2 = rate constant of the intraparticle diffusion model in linear zone 1 and 2, respectively.
Table 2. Main results of adsorption experiments in fixed-bed columns.
ECParticle
Size
(µm)
Mass
(g)
Vc
(L)
EBTC
(d)
FBU
(%)
hMTZ
(cm)
C/C0 = 0.1C/C0 = 0.9
tb
(min)
Vb
(mL)
qb
(mg/g)
ts
(min)
qs
(mg/g)
Caffeine120–1501.7410.0030.43691.040.36147.150.121690.13
300–6001.68988.070.47105.150.101420.12
800–20001.54576.830.9363.000.081330.10
Triclosan120–1501.74124.003.042613.150.3012591.26
300–6001.48916.623.34126.150.176841.01
800–20001.14514.603.4273.500.123410.84
Table 3. Bohart–Adams parameters for caffeine and triclosan adsorption.
ECParticle Size
(µm)
KAB
[L/(minxmg)]
N0
(mg/L)
R2χ2SSE
Caffeine120–1501.340 × 10−3352.7060.9932.685 × 10−32.706 × 10⁻³
300–6002.114 × 10−3216.7080.9816.151 × 10−30.042
800–20002.828 × 10−3119.9310.9430.0170.101
Triclosan120–1501.172 × 10−43797.2170.9290.0280.245
300–6001.379 × 10−42628.7740.9100.0320.210
800–20002.962 × 10−41240.890.9370.0240.133
Disclaimer/Publisher’s Note: The statements, opinions and data contained in all publications are solely those of the individual author(s) and contributor(s) and not of MDPI and/or the editor(s). MDPI and/or the editor(s) disclaim responsibility for any injury to people or property resulting from any ideas, methods, instructions or products referred to in the content.

