Article

Hydrochemical Characteristics and Formation Mechanism of Geothermal Fluids in Zuogong County, Southeastern Tibet

1
School of Water Resources & Environment, Hebei GEO University, Shijiazhuang 050031, China
2
Key Laboratory of Sustainable Utilization and Development of Water Resources of Hebei Province, Shijiazhuang 050031, China
3
Collaborative Innovation Center of Sustainable Utilization of Water Resources and Optimization of Industrial Structure of Hebei Province, Shijiazhuang 050031, China
4
Applied Technology RESEARCH and Development Center of Eco-Environmental Geology, Hebei Universities, Shijiazhuang 050031, China
5
Hebei Key Laboratory of Mountain Geological Environment, Chengde 067000, China
6
The Geothermal Geological Team of Tibet, Tibet Bureau of Exploration & Development of Geology and Mineral Resources, Lhasa 850032, China
*
Author to whom correspondence should be addressed.
Water 2024, 16(19), 2852; https://doi.org/10.3390/w16192852
Submission received: 13 September 2024 / Revised: 27 September 2024 / Accepted: 7 October 2024 / Published: 8 October 2024
(This article belongs to the Section Hydrogeology)

Abstract

:
Zuogong County is located in the southeast of Tibet, which is rich in hot spring geothermal resources, but its development and utilization degree are low, and the genetic mechanism of the geothermal system is not clear. Hydrogeochemical characteristics of geothermal water are of great significance in elucidating the genesis and evolution of geothermal systems, as well as the sustainable development and utilization of geothermal resources. The hydrogeochemical characteristics and genesis of the geothermal water in Zuogong County were investigated using hydrogeochemical analysis, a stable isotope (δD, δ18O) approach, and an inverse simulation model for water–rock reactions using the PHREEQC. The results indicated that the Zuogong geothermal system is a deep circulation heating type without a magmatic heat source. The chemical types present in the geothermal water from the Zuogong area are HCO3 and HCO3·SO4, and the main cations are Na+ and Ca2+. The groundwater is replenished by atmospheric precipitation and glacier meltwater. The salt content of geothermal water mainly comes from the interaction between water and surrounding rocks during the deep circulation process. The reservoir temperature of geothermal water in Zuogong is 120–176 °C before mixing with non-geothermal water and drops to 62–98 °C after mixing with 58 to 79% of non-geothermal water. According to the proposed conceptual model, geothermal water mainly produces water–rock interaction with aluminosilicate minerals in the deep formation, while in shallow areas it interacts mainly with sulfate minerals. These findings contribute to a better understanding of the geothermal system in Zuogong County, Tibet.

1. Introduction

Geothermal resources play a crucial role in providing green and sustainable clean energy, particularly in the context of achieving carbon neutrality [1,2,3]. It is essential to study the hydrogeochemical characteristics and formation mechanisms of geothermal fluids to understand their chemical composition, groundwater recharge sources, and thermal circulation mechanisms. This understanding is vital for the evaluation and utilization of geothermal resources [4].
The Tibet geothermal zone is an important geothermal resource-rich area in China. In the 1970s, over 600 hydrothermal active areas were discovered in Tibet during the first comprehensive scientific expedition to the Qinghai–Tibet Plateau. These areas have great potential for the utilization of geothermal resources. Since then, many scholars have studied the geothermal resources in Tibet from various aspects, including their geological setting, hydrogeochemistry, and fluid isotopic characteristics [5,6,7,8,9,10]. Currently, there is a lack of systematic research on the medium-low temperature geothermal resources in the Tibet area. Furthermore, the understanding of the formation mechanism and heat source types of geothermal resources in this area is not deep enough. Zuogong County, located in southeastern Tibet, experiences intense geothermal activity, with over 10 medium-low temperature hot springs such as Wuya and Boko. Conducting a study on the hydrogeochemical characteristics of geothermal resources in Zuogong could provide us with a better understanding of the formation process of medium-low temperature geothermal resources in eastern Tibet.
Exploring the causal mechanisms of geothermal systems can help the rational development and utilization of geothermal resources. Hydrochemistry and isotope methods are important for studying the hydrogeochemistry of geothermal water. The characteristics of the hydrochemical components can be used to analyze the degree of water–rock interaction during the deep circulation of geothermal water and to infer the deep thermal storage temperature of geothermal water. Geothermometers obtained from the dissolution equilibrium characteristics of hydrochemical components can be widely used to evaluate the temperature of thermal reservoirs, providing a cost-effective alternative to drilling holes to measure deep thermal reservoir temperatures. The multi-mineral equilibrium method and the silica-enthalpy mixing equation compensate for the significant error of traditional geothermometers in calculating the resulting deep temperature after mixing cold water, enabling a more accurate evaluation of the thermal storage temperature of the geothermal system. Determining the source of recharge is an important part of the geothermal genesis mechanism, and the stable isotope signature of hydrogen and oxygen can be used to determine the source of recharge and the recharge height of the geothermal water to determine the recharge zone [11,12,13,14]. Therefore, it is significant to use the hydrochemical and isotopic characteristics of geothermal water samples to explain the circulation process and formation mechanism of geothermal fluids.
This study explores the recharge mechanism, water–rock interaction processes controlling the chemical characteristics of thermal waters, and thermal reservoir temperature of the geothermal system in Zuogong County. With this aim, multiple geothermal water samples were collected from the area to test their hydrochemical and isotopic (δD, δ18O) composition. Additionally, an inverse simulation model of the study area’s geothermal water was performed to quantitatively analyze the interaction between geothermal water and the surrounding rock minerals during the upwelling process. This paper delves into the genetic model of the geothermal system in Zuogong County and provides a scientific basis for evaluating, developing, and utilizing medium-low temperature geothermal resources in Tibet.

2. Geological Setting

Zuogong County is located in the northern section of the Hengduan Mountains in the eastern part of the Qinghai–Tibet Plateau and the upper reaches of the Nujiang River and Lancang River basin. Its geographical coordinates are 97°04′ to 98°42′ E and 28°26′ to 30°27′ N. The average temperature is 4.6 °C, with precipitation mostly concentrated in summer. Concentrated precipitation combined with hot seasons results in high evaporation. The average annual precipitation is 445.9 mm, while the yearly evaporation is 1680.4 mm, 3.9 times the rainfall. The landform in the area belongs to the Bershula Ridge–Taniantawong sub-region of extremely high mountains and river valleys in eastern Tibet. It describes an alpine canyon geomorphology with rivers and a mountain range NW–SE oriented. The lowest altitude in the area is 2300 m, and the highest is 5806 m. The relative height difference is about 2200 m, and the maximum is 3506 m. In a cross-sectional view, its topography describes several V-shaped troughs related to the inception of the Nujiang River, Yuqu River, and Lancang River from the southwest to the northeast. In the southwest and southeast of Zuogong County, there are glaciers on some high mountains. The regional setting is shown in Figure 1a.
The study area belongs to the Wuqi–Zuogong stratigraphic division, such as the south Qiangtang–Zuogong stratigraphic area, and mainly exposes Mesozoic strata. The exposed lithology corresponds to Upper Triassic Dongdacun Formation (T3ddc) sandstone, Upper Triassic Jiapila Formation (T3j), and Upper Triassic Adula Formation (T3a) slate, with limited outcrops of bioclastic limestone, micrite, and sparite of the Upper Triassic Adula Formation (T3a). A small number of Quaternary rocks are distributed in the gully mouths and mountain pass areas of Yuqu and its tributaries, comprising sand, gravel, and soil layers. The regional magmatic rocks are developed and roughly bounded by the Yuqu Basin. The east side is dominated by Late Triassic acidic intrusive rocks, and the west and north sides are dominated by Jurassic–Early Cretaceous acid intrusive rocks. The lithology is dominated by monzogranite and granodiorite. There are also a small number of intermediate to acidic rock dykes developed in the area, dominated by aplite, diorite porphyrite, and syenogranite.
The groundwater in Zuogong County can be categorized into three types: bedrock fissure water, karst fissure water, and loose rock pore water. Bedrock fissure water is found in fractures, fissures, and folds of layered or block rock masses. It is relatively abundant and forms springs when it encounters impermeable layers. Karst fissure water is mainly found in medium-thick layered limestone, marble, and dolomite formations. It is characterized by small karst caves developed along some cracks. Overall, cracks are the main water-bearing medium. The main water source is vertical infiltration of atmospheric precipitation. Karst fissure water is discharged as springs at the bottom of valleys and enters surface streams. Loose rock pore water is found in river valleys, plains, and tributary valleys, with aquifers ranging in thickness from several meters to tens of meters. Groundwater is plentiful in river valleys and plains, but it is relatively scarce in tributary valleys due to variations in geomorphic units and water-bearing media.

3. Materials and Methods

3.1. Hydrochemical Analysis

In 2022, we collected nine groups of geothermal water samples (four groups of thermal well water and five groups of thermal spring water) and ten groups of non-geothermal water samples (six groups of spring water and four groups of surface water) from Zuogong County (Figure 1b). The temperature, pH, and Total Dissolved Solids (TDS) values were measured in situ using a portable multi − parameter detection device. Water samples were filtered using a 0.45 μm micron membrane and stored in high-density polyethylene (HDPE) bottles, which were rinsed three times with the water samples. Then, 2 mL of dilute nitric acid was added to the samples that needed to be analyzed for metal ions to acidify the water sample (pH < 2). All bottles were sealed with sealing film to prevent leakage and evaporation. Water samples were sent to the central laboratory of the Tibet Autonomous Region Geology and Mineral Exploration and Development Bureau for complete sample analysis and testing. The cations (K+, Na+, Ca2+, and Mg2+) were analyzed by inductively coupled plasma emission spectrometry (ICP-AES). For SiO2 analysis, the thermal water samples were diluted five times using deionized water to prevent SiO2 in the precipitation water. Silicon and other trace elements were detected using ICP-MS. The analytical precision for major cations and trace elements is less than 0.5%. The anions (F, Cl, SO42−, and NO3) were measured using ion chromatography (ICS-100) with a precision of ±2%. Through the anion and cation equilibrium test, the relative error of the hydrochemistry data was within 5%, which could meet the requirement of this study. Moreover, eight groups of isotope samples of natural water (two groups of thermal well water, two groups of thermal spring water, two groups of spring water, and two groups of surface water) were collected and sent to the Ministry of Land and Resources Groundwater of the Key Laboratory of Science and Engineering in the Institute of Hydrogeology and Environmental Geology, Chinese Academy of Geological Sciences. Wavelength scanning-cavity ring-down spectroscopy was used for the analysis of hydrogen and oxygen stable isotopes. The results were reported using standard δ notation relative to Vienna Standard Mean Ocean Water (V-SMOW) [15]. The measurement accuracies were within ±0.1‰ for δD and ±1‰ for δ18O. The test results are shown in Table 1.
By analyzing the hydrogeochemical characteristics and hydrogen and oxygen isotopic characteristics in the Zuogong area, the formation mechanism of geothermal water in the Zuogong area has been summarized. The applicability of the cation thermometer, SiO2 thermometer, mineral saturation index method, and silica-enthalpy mixing model method in calculating the thermal reservoir temperature was comprehensively analyzed in the study area. In addition, the thermal reservoir temperature and circulation depth were determined. Finally, the water–rock interaction inverse simulation model established by PHREEQC was used to quantitatively analyze the water–rock interaction of geothermal water during the deep cycle process.

3.2. Hydrogeochemical Geothermometer

The hydrogeochemical geothermometer is the most common traditional method used to evaluate the temperature utilization of thermal reservoirs. It estimates reservoir temperature based on the equilibrium reactions of multiple minerals and is calibrated empirically or experimentally. The method includes silica and cation geothermometers. The calculation formulas are shown in Table 2.
The multi-mineral equilibrium geothermometer is based on the multi-component chemical equilibrium of the geothermal system to simulate the deep reservoir temperature of geothermal fluid. It has been widely used in thermal reservoir temperature estimation [16]. The basic assumption of the multi-mineral equilibrium geothermometer is that there is a chemical equilibrium (or approximate equilibrium) between the deep geothermal fluid and the mineral combination in the reservoir. The equilibrium of multiple minerals may converge to a small temperature range, and the convergence temperature of this range is considered to be the thermal reservoir temperature.
Table 2. Calculation formulas of hydrogeochemical geothermometers [17,18,19,20,21,22].
GeothermometerCalculation FormulaReference
a. Chalcedony (no loss of steam) T = 1032 4.69 log S i O 2 273.15 Fournier (1977)
b. Chalcedony (maximum steam loss) T = 1112 4.91 log S i O 2 273.15 Arnórsson et al. (1983)
c. Quartz (no loss of steam) T = 1309 5.19 log S i O 2 273.15 Fournier (1977)
d. Quartz (maximum steam loss) T = 1522 5.75 log S i O 2 273.15 Fournier (1977)
e.Na-K T = 1217 l o g N a K + 1.438 273.15 Fournier and Potter (1979)
f.K-Mg T = 4410 13.95 l o g K 2 M g 273.15 Giggenbach (1988)
g.Na-K-Ca T = 1647 l o g N a K + β l o g C a N a + 2.06 + 2.47 273.15
β = 4/3(when t < 100 °C) or β = 1/3(when t > 100 °C)
Fournier and Truesdell (1973)
h.Na-Li T = 1590 l o g N a L i + 0.779 273.15 Kharaka et al. (1982)

3.3. Hydrogeochemical Modeling

According to the hydrochemical characteristics, the geothermal water is mixed with shallow non-geothermal water, and the silica-enthalpy mixing model can be used to calculate the cold water mixing ratio and the thermal reservoir temperature before cold water mixing [23]. The calculation formulas are as follows (1):
S c x + S h 1 - x = S s S i O 2 c + S i O 2 h 1 - x = S i O 2 s
where x denotes the mixing ratio of non-geothermal water; Sc and SiO2c denote the enthalpy of surface water (J/g) and SiO2 content (mg/L), respectively; Sh and SiO2h denote the initial enthalpy (J/g) and initial SiO2 content (mg/L) of geothermal water, respectively; and Ss and SiO2s denote the enthalpy (J/g) and SiO2 content (mg/L) of geothermal water after mixing. The surface water sample YQH1 selected for this calculation has an enthalpy of 2 J/g and a SiO2 content of 7.75 mg/L. Above 100 °C, the relationship between temperature and saturated water enthalpy can be seen in Table 3. Below 100 °C, the saturated water enthalpy is equal to the temperature.
The temperature of geothermal water is positively correlated with the thermal circulation depth of the reservoir. Thus, the following formula can be used to calculate the circulation depth of geothermal water (2) [24]:
H = t 1 t 2 I + h
where H denotes the thermal circulation depth, m; t1 denotes the maximum temperature of thermal water in the deep part, °C; t2 denotes the constant temperature zone temperature, °C; h denotes the thickness of the constant temperature zone, m; and I denote the geothermal gradient. Based on the results of previous data collection, t2 = 5 °C, h = 30 m, and I = 3.5 °C/100 m were taken in this study [25].
Based on the elevation effect of stable isotopes of hydrogen and oxygen, the recharge altitude of groundwater is determined, and the recharge area of groundwater is identified [26,27,28]. The groundwater recharge altitude is calculated as follows (3):
H = ( δ s δ p ) / k + h
where H denotes the altitude of the groundwater recharge area, m; h denotes the height of the sampling point, m; δs denotes the δD (δ18O) of the sampling point; δp denotes the δD (δ18O) of atmospheric precipitation near the sampling point; and k denotes the altitude gradient of atmospheric precipitation δD (δ18O). Since δ18O in water is affected by water–rock interaction, the recharge altitude was calculated using δD. δp was selected in this study to obtain the average δD of surface water (−135‰), and the k value is −2.6‰/100 m [29].
To quantitatively analyze the formation and evolution of geothermal water, the inverse simulation data block in the PHREEQC program can be used to create a water–rock interaction model. This model focuses on the deep circulation process of atmospheric precipitation in the recharge area, which forms geothermal water. By comparing predicted and modeled concentrations, this model can help in deducing and explaining the changes in water–rock interaction [30]. When building an inverse model using PHREEQC, the first step involves determining the hydrochemical components of the initial and final water samples. The second step is to consider the geological background of the study area and select minerals for the water–rock interaction. Finally, specifying uncertainty intervals is necessary, with the typical uncertainty of the inverse model being around 5%. However, since the components of the initial geothermal fluid were derived from model calculations rather than measured data, the uncertainty of the inverse simulation was increased to a maximum tolerance of 10%.
Table 3. Relations between temperature, enthalpy, and SiO2 content.
Temperature (°C)Enthalpy (J/g)SiO2 (mg/L)Temperature (°C)Enthalpy (J/g)SiO2 (mg/L)
5050.013.5200203.6265.0
7575.026.6225230.9365.0
100100.148.0250259.2486.0
125125.180.0275289.0614.0
150151.0125.0300321692
175177.0185.0

4. Results

4.1. Water Chemistry

The sampling temperatures obtained from geothermal and non-geothermal water ranged from 34 °C to 71 °C and 2 °C to 22 °C, respectively. In geothermal water collected from thermal wells, the temperature was higher than that of thermal spring water, with average temperatures of 66 °C and 50 °C, respectively. In non-geothermal water samples, the temperature of spring water was slightly higher than that of surface water, with average temperatures of 10 °C and 5 °C, respectively. The pH value of all underground thermal water was between 6.85 and 8.18, which is neutral to weakly alkaline water. In comparison, the pH of non-geothermal water was slightly higher than that of geothermal water, ranging from 7.68 to 8.58, which is weakly alkaline water. The TDS content of geothermal water ranged from 415.6 to 2627.0 mg/L. The TDS content of thermal well water was 1439.0 to 1673.0 mg/L (average: 1557.0) mg/L, while that of thermal spring water varied greatly, with an average lower than that of thermal well water, with a content between 415.6 and 2627.0 (1008.4) mg/L. The salinity of non-geothermal water was relatively low, with a TDS content of 105.1–511.9 mg/L, of which the spring water was between 105.1 and 511.9 (196.6) mg/L, and the surface water was between 142.7 and 226.0 (190.0) mg/L.
The concentrations of major anions in geothermal water were mainly higher than those in non-geothermal water. The HCO3 content of geothermal water ranged from 277.10 to 1313.00 mg/L (the values of thermal well water and thermal spring water ranged from 1007.00 to 1105.00 mg/L and from 259.50 to 1313.00 mg/L, respectively), and that of non-geothermal water ranged from 63.78 to 346.80 mg/L (the values of spring water and surface water ranged from 63.78 to 346.80 mg/L and from 108.40 to 134.20 mg/L, respectively). The Cl contents of thermal well water and thermal spring water ranged from 23.38 to 29.97 mg/L and from 1.99 to 65.84 mg/L, respectively. In contrast, the Cl contents of spring water and surface water ranged from 0.39 to 4.05 mg/L and from 0.16 to 1.80 mg/L, respectively. The SO42− contents of thermal well water and thermal spring water ranged from 20.30 to 37.12 mg/L and from 35.43 to 454.30 mg/L, respectively. In comparison, the SO42− content of non-geothermal water was between 3.55 and 52.48 mg/L. Geothermal water had a higher SO42− content than thermal well water.
Regarding trace anionic constituents, the F contents of thermal well water and thermal spring water ranged from 3.15 to 7.42 mg/L and from 0.99 to 8.04 mg/L, respectively. The F contents of spring and surface water were lower than those of geothermal water, which ranged from 0.04 to 1.92 mg/L and from 0.10 to 0.69 mg/L, respectively. The NO3 contents of geothermal and non-geothermal water ranged from 0.77 to 2.42 mg/L and from 0.92 to 4.08 mg/L, respectively.
The cationic constituents in geothermal water were higher than those in non-geothermal water. The Na+ content of geothermal water was between 20.09 and 596.80 mg/L (the values of thermal well water and thermal spring water ranged from 365.80 to 388.10 mg/L and from 20.09 to 596.80 mg/L, respectively), and that of non-geothermal water was between 0.76 and 37.37 mg/L (the contents of spring water and surface water ranged from 0.55 to 37.37 mg/L and from 2.75 to 5.04 mg/L, respectively). The Mg2+ content of geothermal water was from 1.40 to 37.32 mg/L (average: 16.69 mg/L), higher than from 0.28 to 3.32 (0.95) mg/L of non-geothermal water. The Ca2+ contents of thermal well water and thermal spring water ranged from 17.85 to 33.38 (26.64) mg/L and from 20.3 to 95.65 (61.12) mg/L, respectively, and those of spring water and surface water ranged from 22.63 to 77.75 (36.36) mg/L and from 19.36 to 40.54 (29.76) mg/L, respectively. The Mg2+ contents of thermal well water and thermal spring water ranged from 4.13 to 9.01 (6.56) mg/L and from 7.41 to 21.67 (13.45) mg/L, respectively. The Ca2+ contents of spring and surface water ranged from 0.71 to 16.86 (5.52) mg/L and from 9.97 to 13.18 (11.99) mg/L, respectively.
The contents of dissolved SiO2, Li, Sr, B, and As in geothermal water were higher than those in non-geothermal water. The contents of SiO2, Li, Sr, B, and As in geothermal water ranged from 24.15 to 76.72 (55.89) mg/L, from 0.06 to 2.96 (0.97) mg/L, from 0.39 to 2.15 (0.95) mg/L, from 0.17 to 8.41 (4.35) mg/L, and from 0.65 to 1130.00 (230.00) µg/L, respectively. However, the contents of SiO2, Li, Sr, B, and As in non-geothermal water were as low as from 5.93 to 12.81 (8.04) mg/L, from 0.0038 to 0.1000 (0.0184) mg/L, from 0.075 to 1.130 (0.267) mg/L, from 0.0028 to 0.2000 (0.3572) mg/L, and 1.10–1130.00 (515.00) µg/L, respectively.

4.2. Hydrogen and Oxygen Isotope Compositions

The δD and δ18O values in geothermal water were lower than those in non-geothermal water. The isotope values ranged from δD = −165 to −149‰ and from δ18O = −21.0 to −19.2‰ for geothermal water samples and from δD = −147 to −134‰ and from δ18O = −18.2 to −17.2‰ for non-geothermal water samples. Further differentiation showed that the δD and δ18O contents of thermal well water (from −165 to −160‰ and from −21 to −19.5‰) were poorer than those of thermal spring water (from −159 to −149‰ and from −19.9 to −19.2‰). The δD and δ18O contents of spring water (from −147 to −138‰ and from −18.2 to −17.2‰) were slightly lower than those of surface water (from −136 to −134‰ and from −17.6 to −17.2‰).

5. Discussion

5.1. Hydrochemical Characteristics of Thermal Groundwater

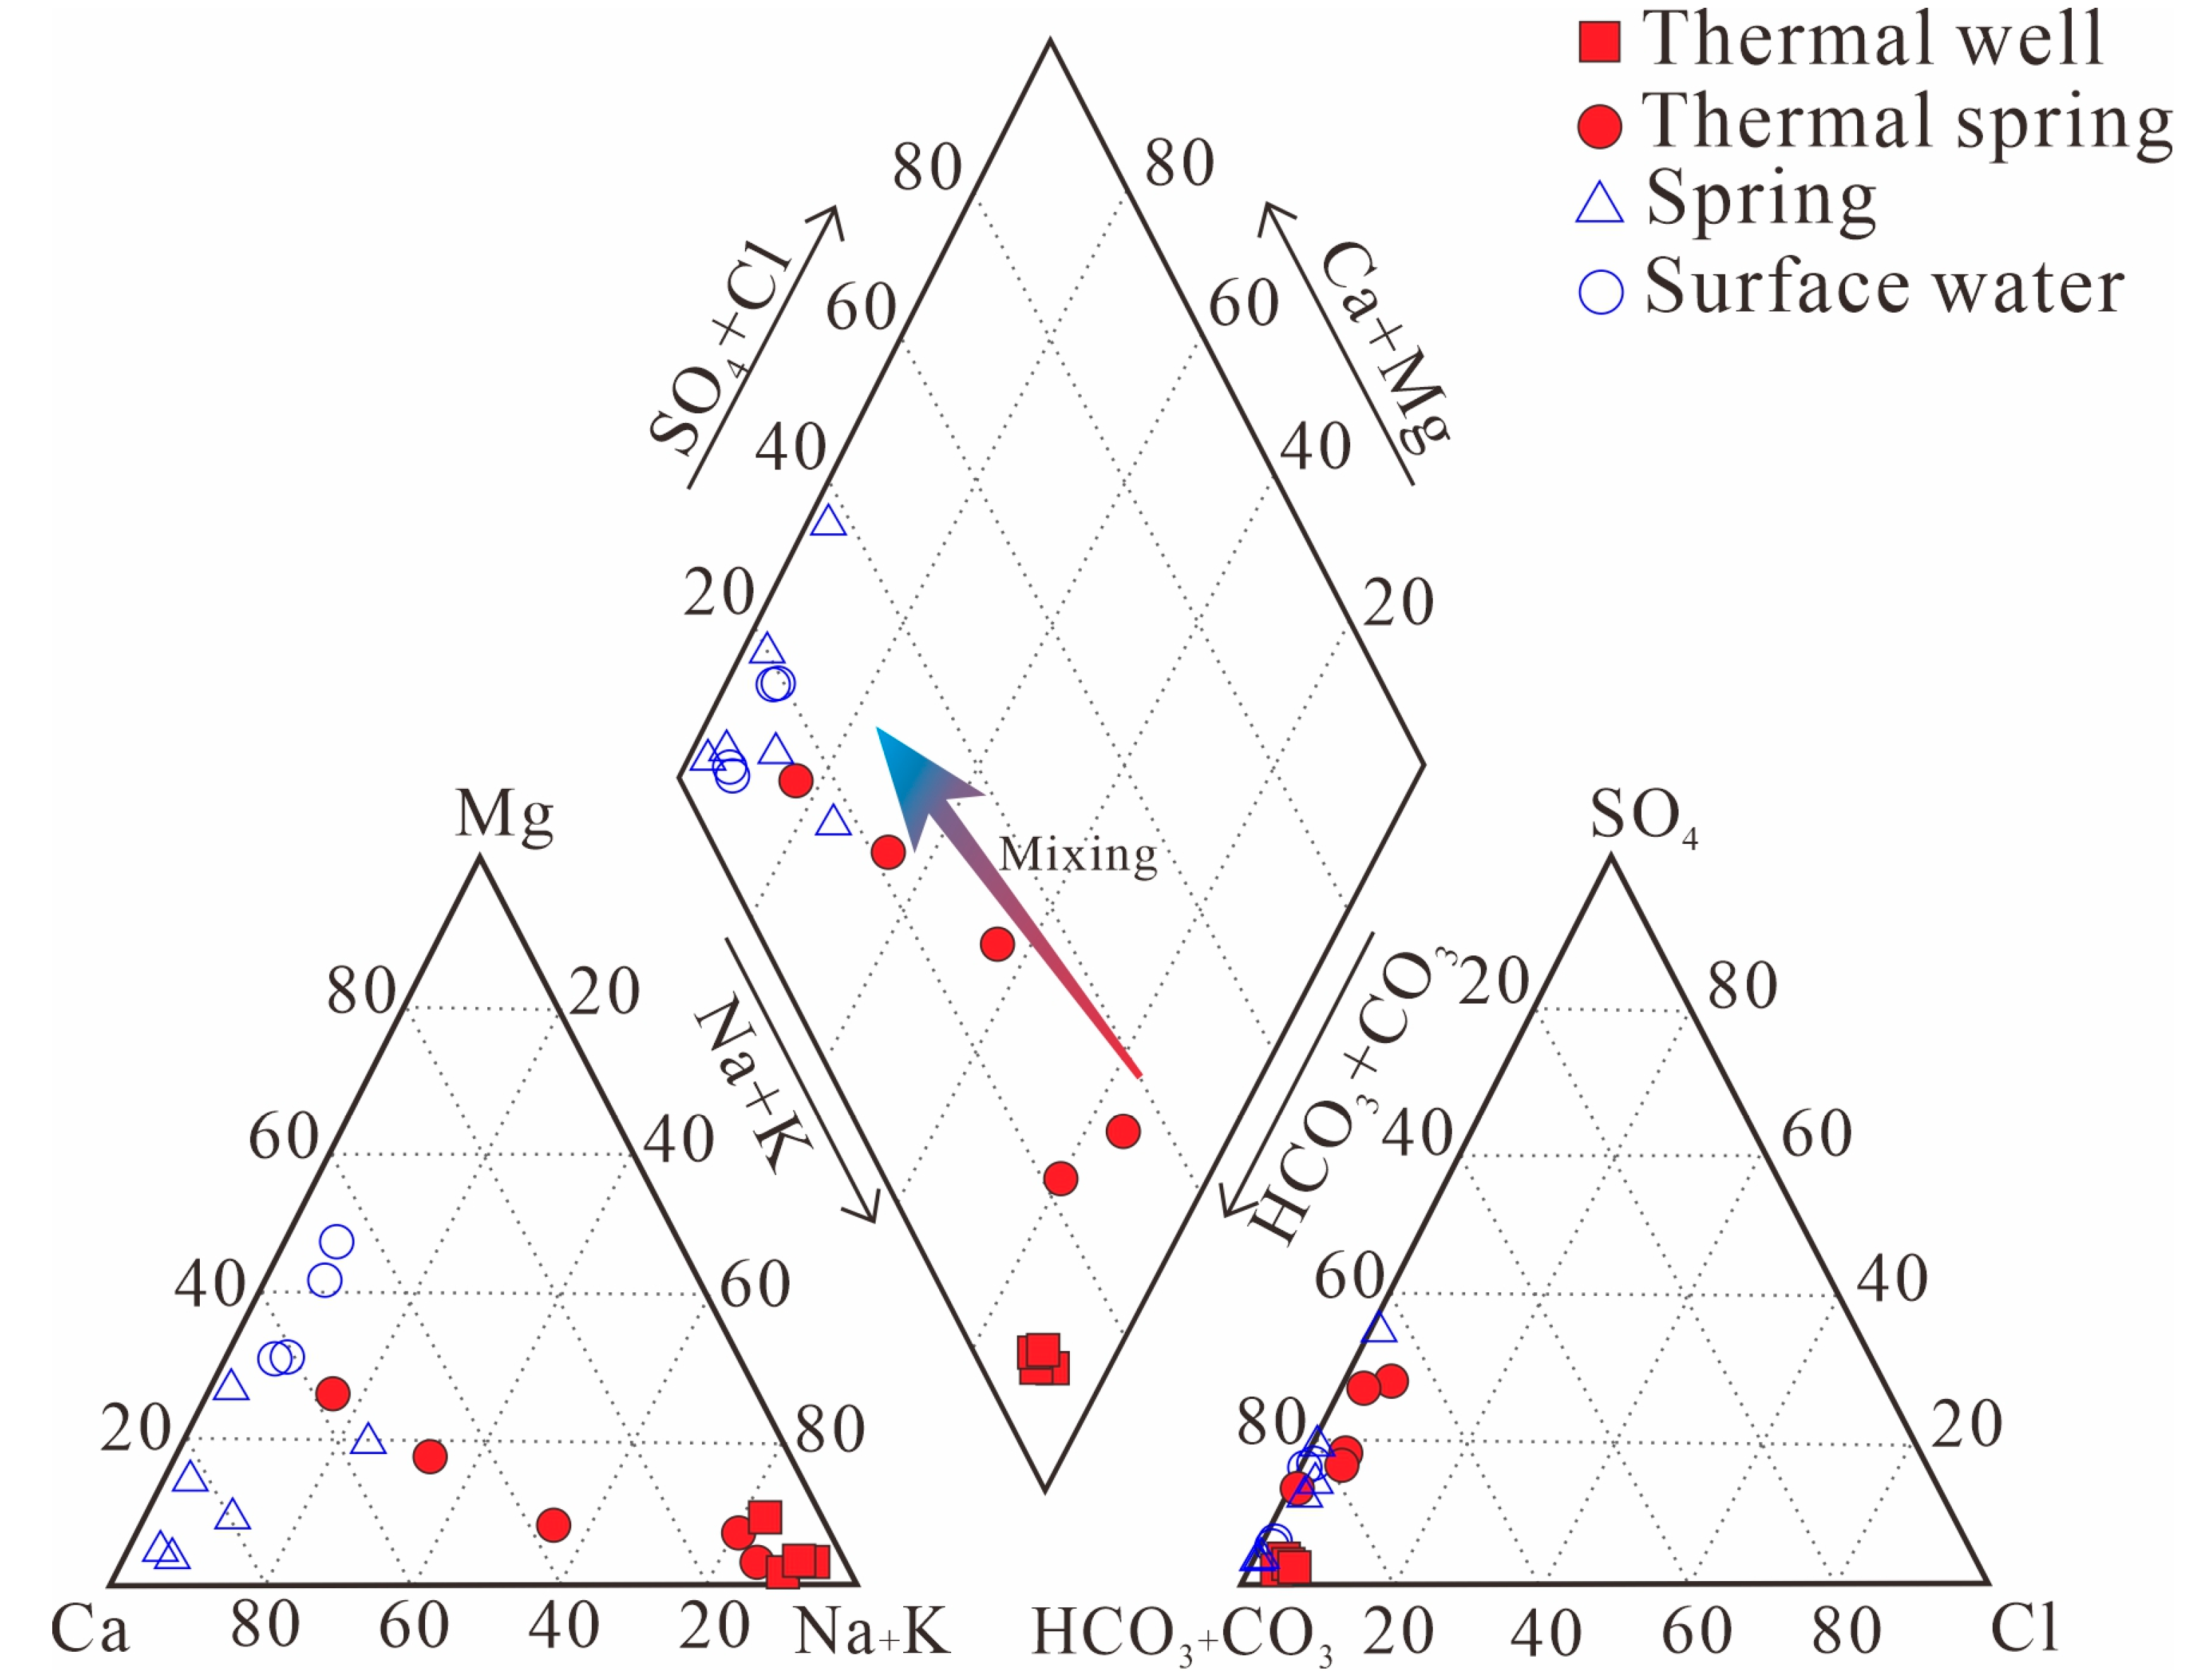
The geothermal water contained HCO3 and HCO3·SO4 water, and the difference in hydrochemical types was primarily reflected in the cation content. The thermal well water had a hydrochemical type of HCO3-Na, while thermal spring water differed slightly. Samples WSDR and DBJB2 belonged to HCO3-Na and HCO3-Ca·Na type water, respectively. As the amount of SO42− in the water increased, the hydrochemical types of DRZG3, DRBX2, and DRCD3 were converted to HCO3·SO4-Na, HCO3·SO4-Ca·Mg, and HCO3·SO4-Na·Ca types (Figure 2). The primary cations in thermal springs change from Na+ to Ca2+, which is thought to be related to the mixing ratio of hot spring water and non-geothermal water. The greater the amount of non-geothermal water mixed in, the higher the concentration of Ca2+ in the thermal spring. Non-geothermal water was HCO3 water, except for KSQ6. The hydrochemical type of spring water was mostly HCO3-Ca type, while that of ZGQ1 and KSQ6 was HCO3-Ca·Na and HCO3·SO4-Ca·Mg type, respectively. The surface water contained mostly HCO3-Ca·Mg and HCO3-Mg·Ca hydrochemical types.
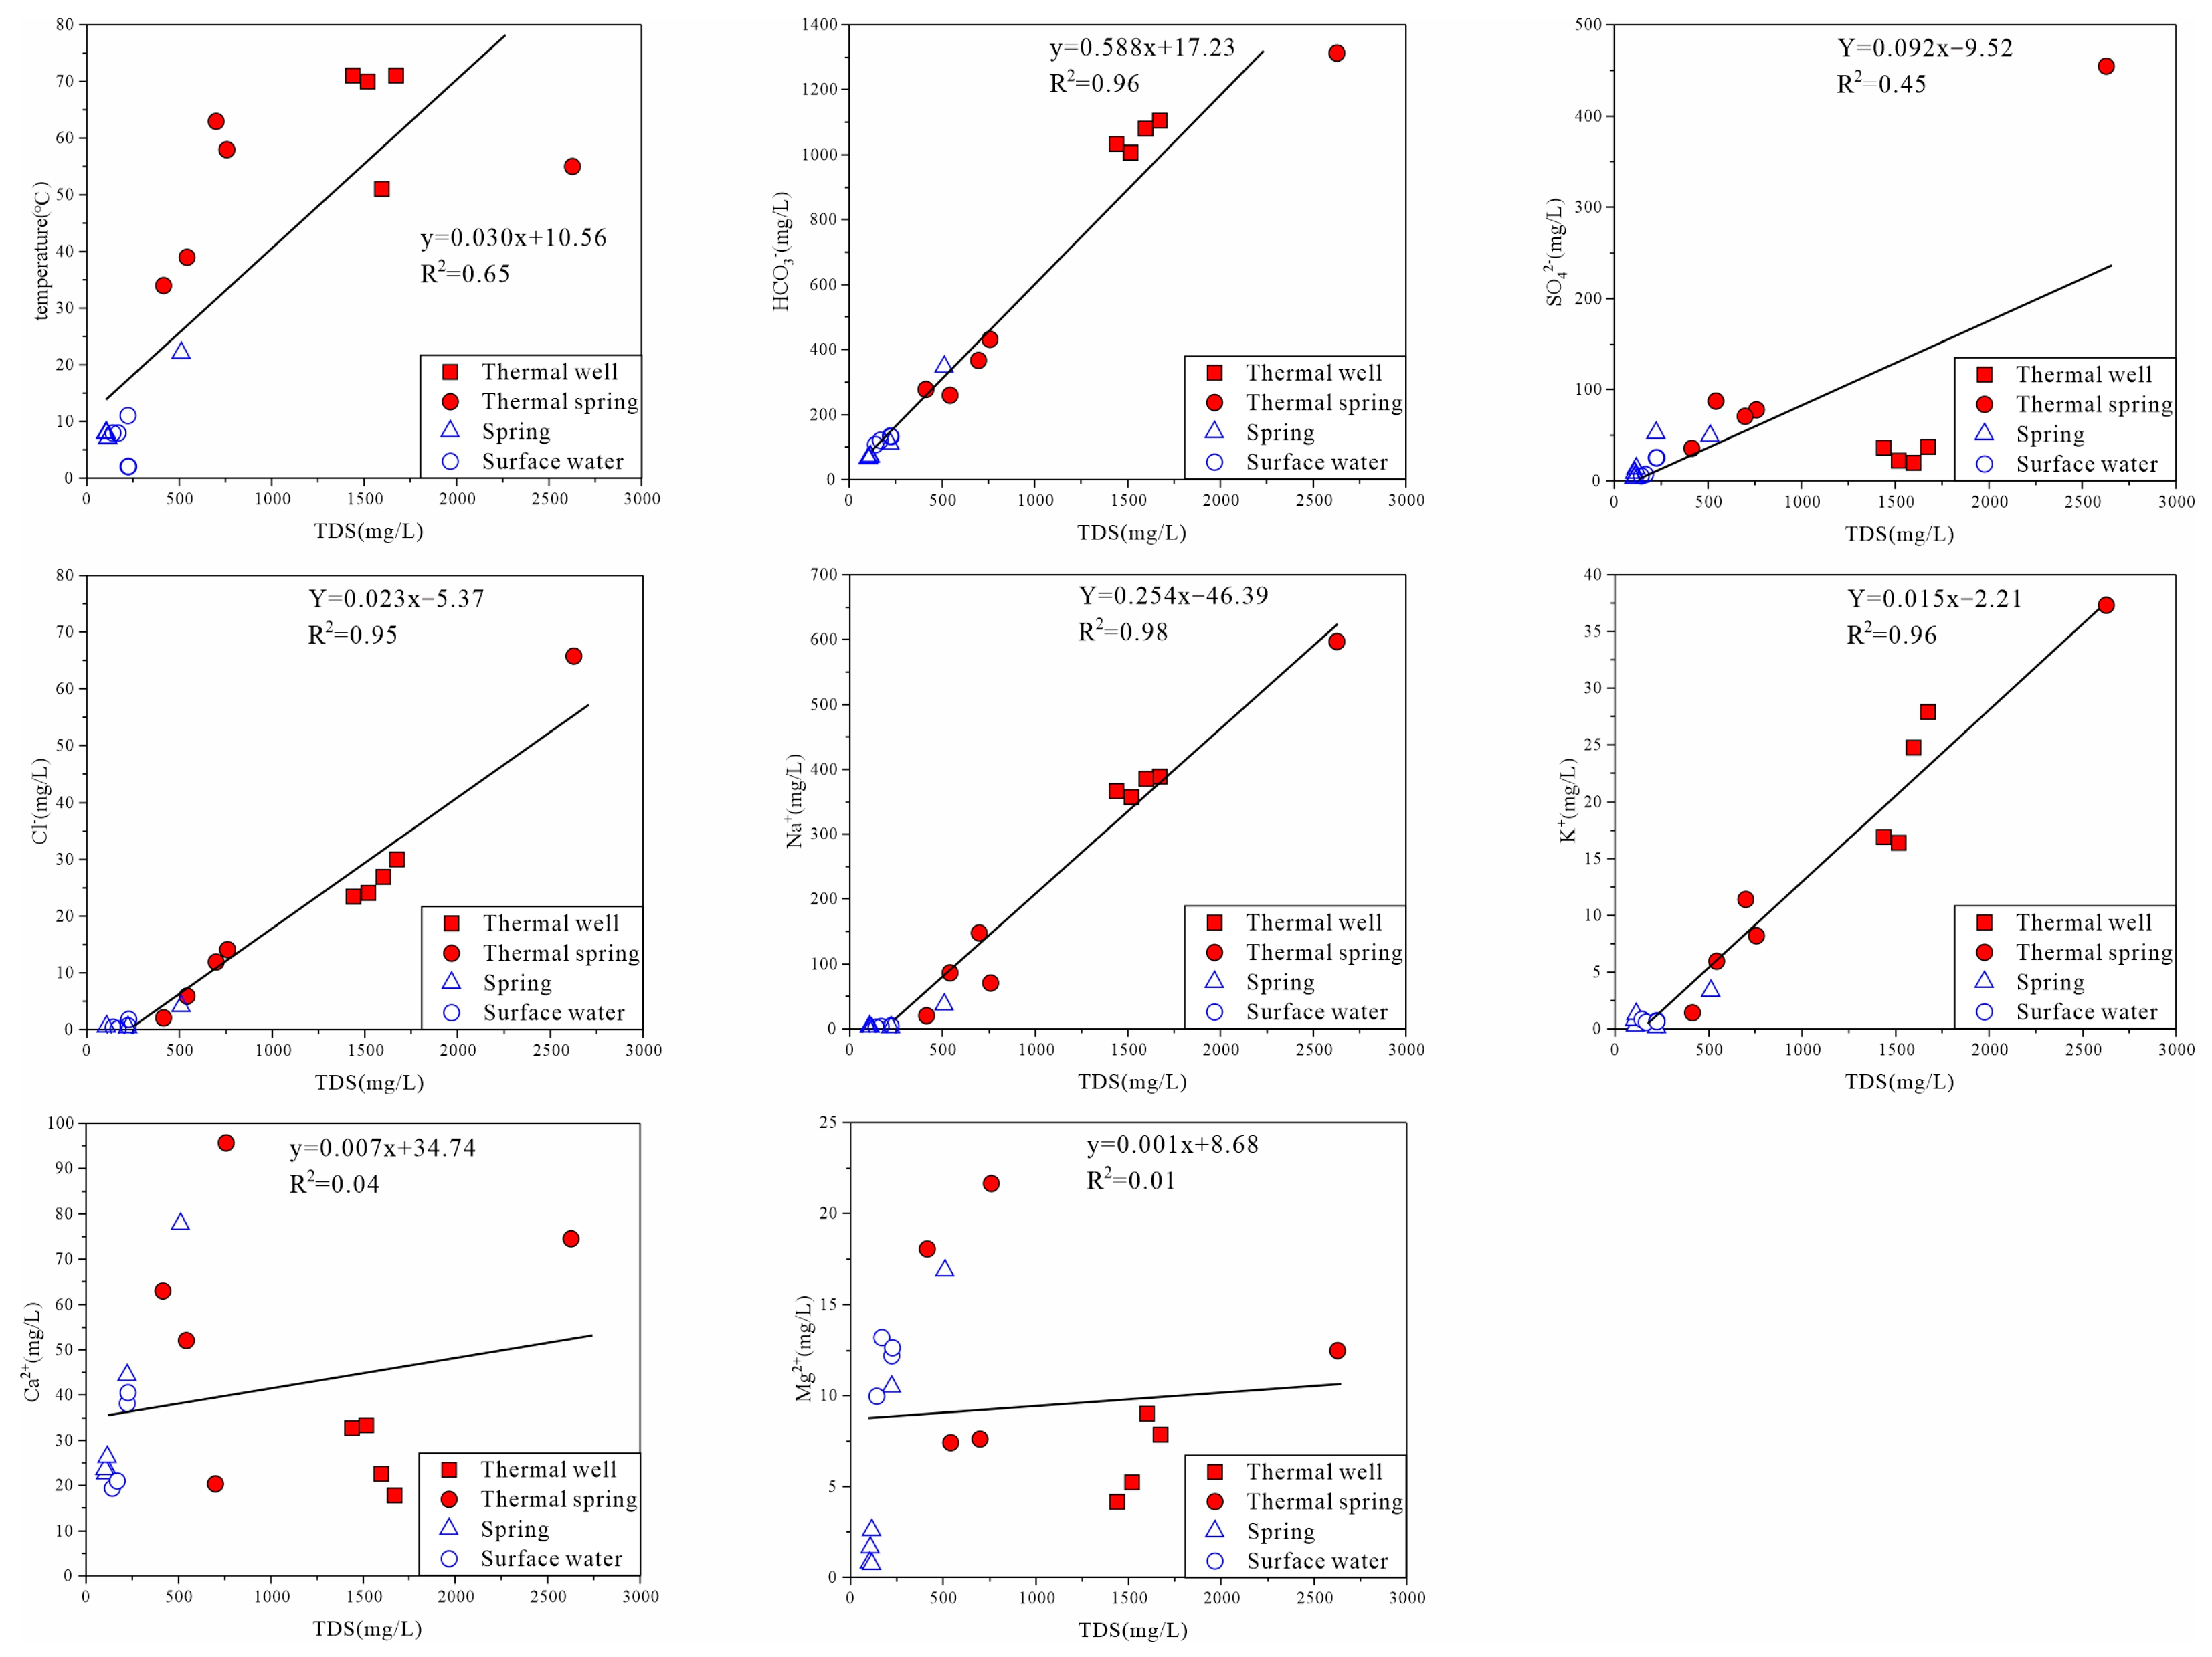
Typically, water samples’ TDS content is mainly influenced by water–rock interactions during the water circulation. For geothermal and non-geothermal water, there was a good positive linear correlation between TDS content and sampling temperature and between HCO3, Cl, Na+, and K+ contents (Figure 3). This indicates that the dissolution of siliciclastic minerals at high temperatures may be an important source of the chemical constitution of geothermal water (4,5). However, TDS had a weak positive correlation with SO42−, Ca2+, and Mg2+ contents. The SO42−, Ca2+, and Mg2+ contents in thermal well water were even lower than those in non-geothermal water. This may be caused by fluid decompression and cooling during the upwelling process of deep geothermal water. The content of thermal spring water was relatively high, which indicates that the increased contents of SO42−, Ca2+, and Mg2+ may be controlled by the dissolution of sulfate minerals such as gypsum in the shallow parts of the earth’s surface. From large to small, the TDS contents of geothermal and non-geothermal water were thermal well water, spring water, and non-geothermal water. This indicates that deep thermal water may have a mixed effect with shallow non-geothermal water during the upwelling process.
4 N a A l S i 3 O 8 + 4 C O 2 + 6 H 2 O 4 N a + + A l 2 S i 2 O 5 ( O H ) 4 + 4 H C O 3 + 8 S i O 2
2 K A l S i 3 O 8 + 2 C O 2 + 3 H 2 O 2 K + + A l 2 S i 2 O 5 ( O H ) 4 + 2 H C O 3 + 4 S i O 2
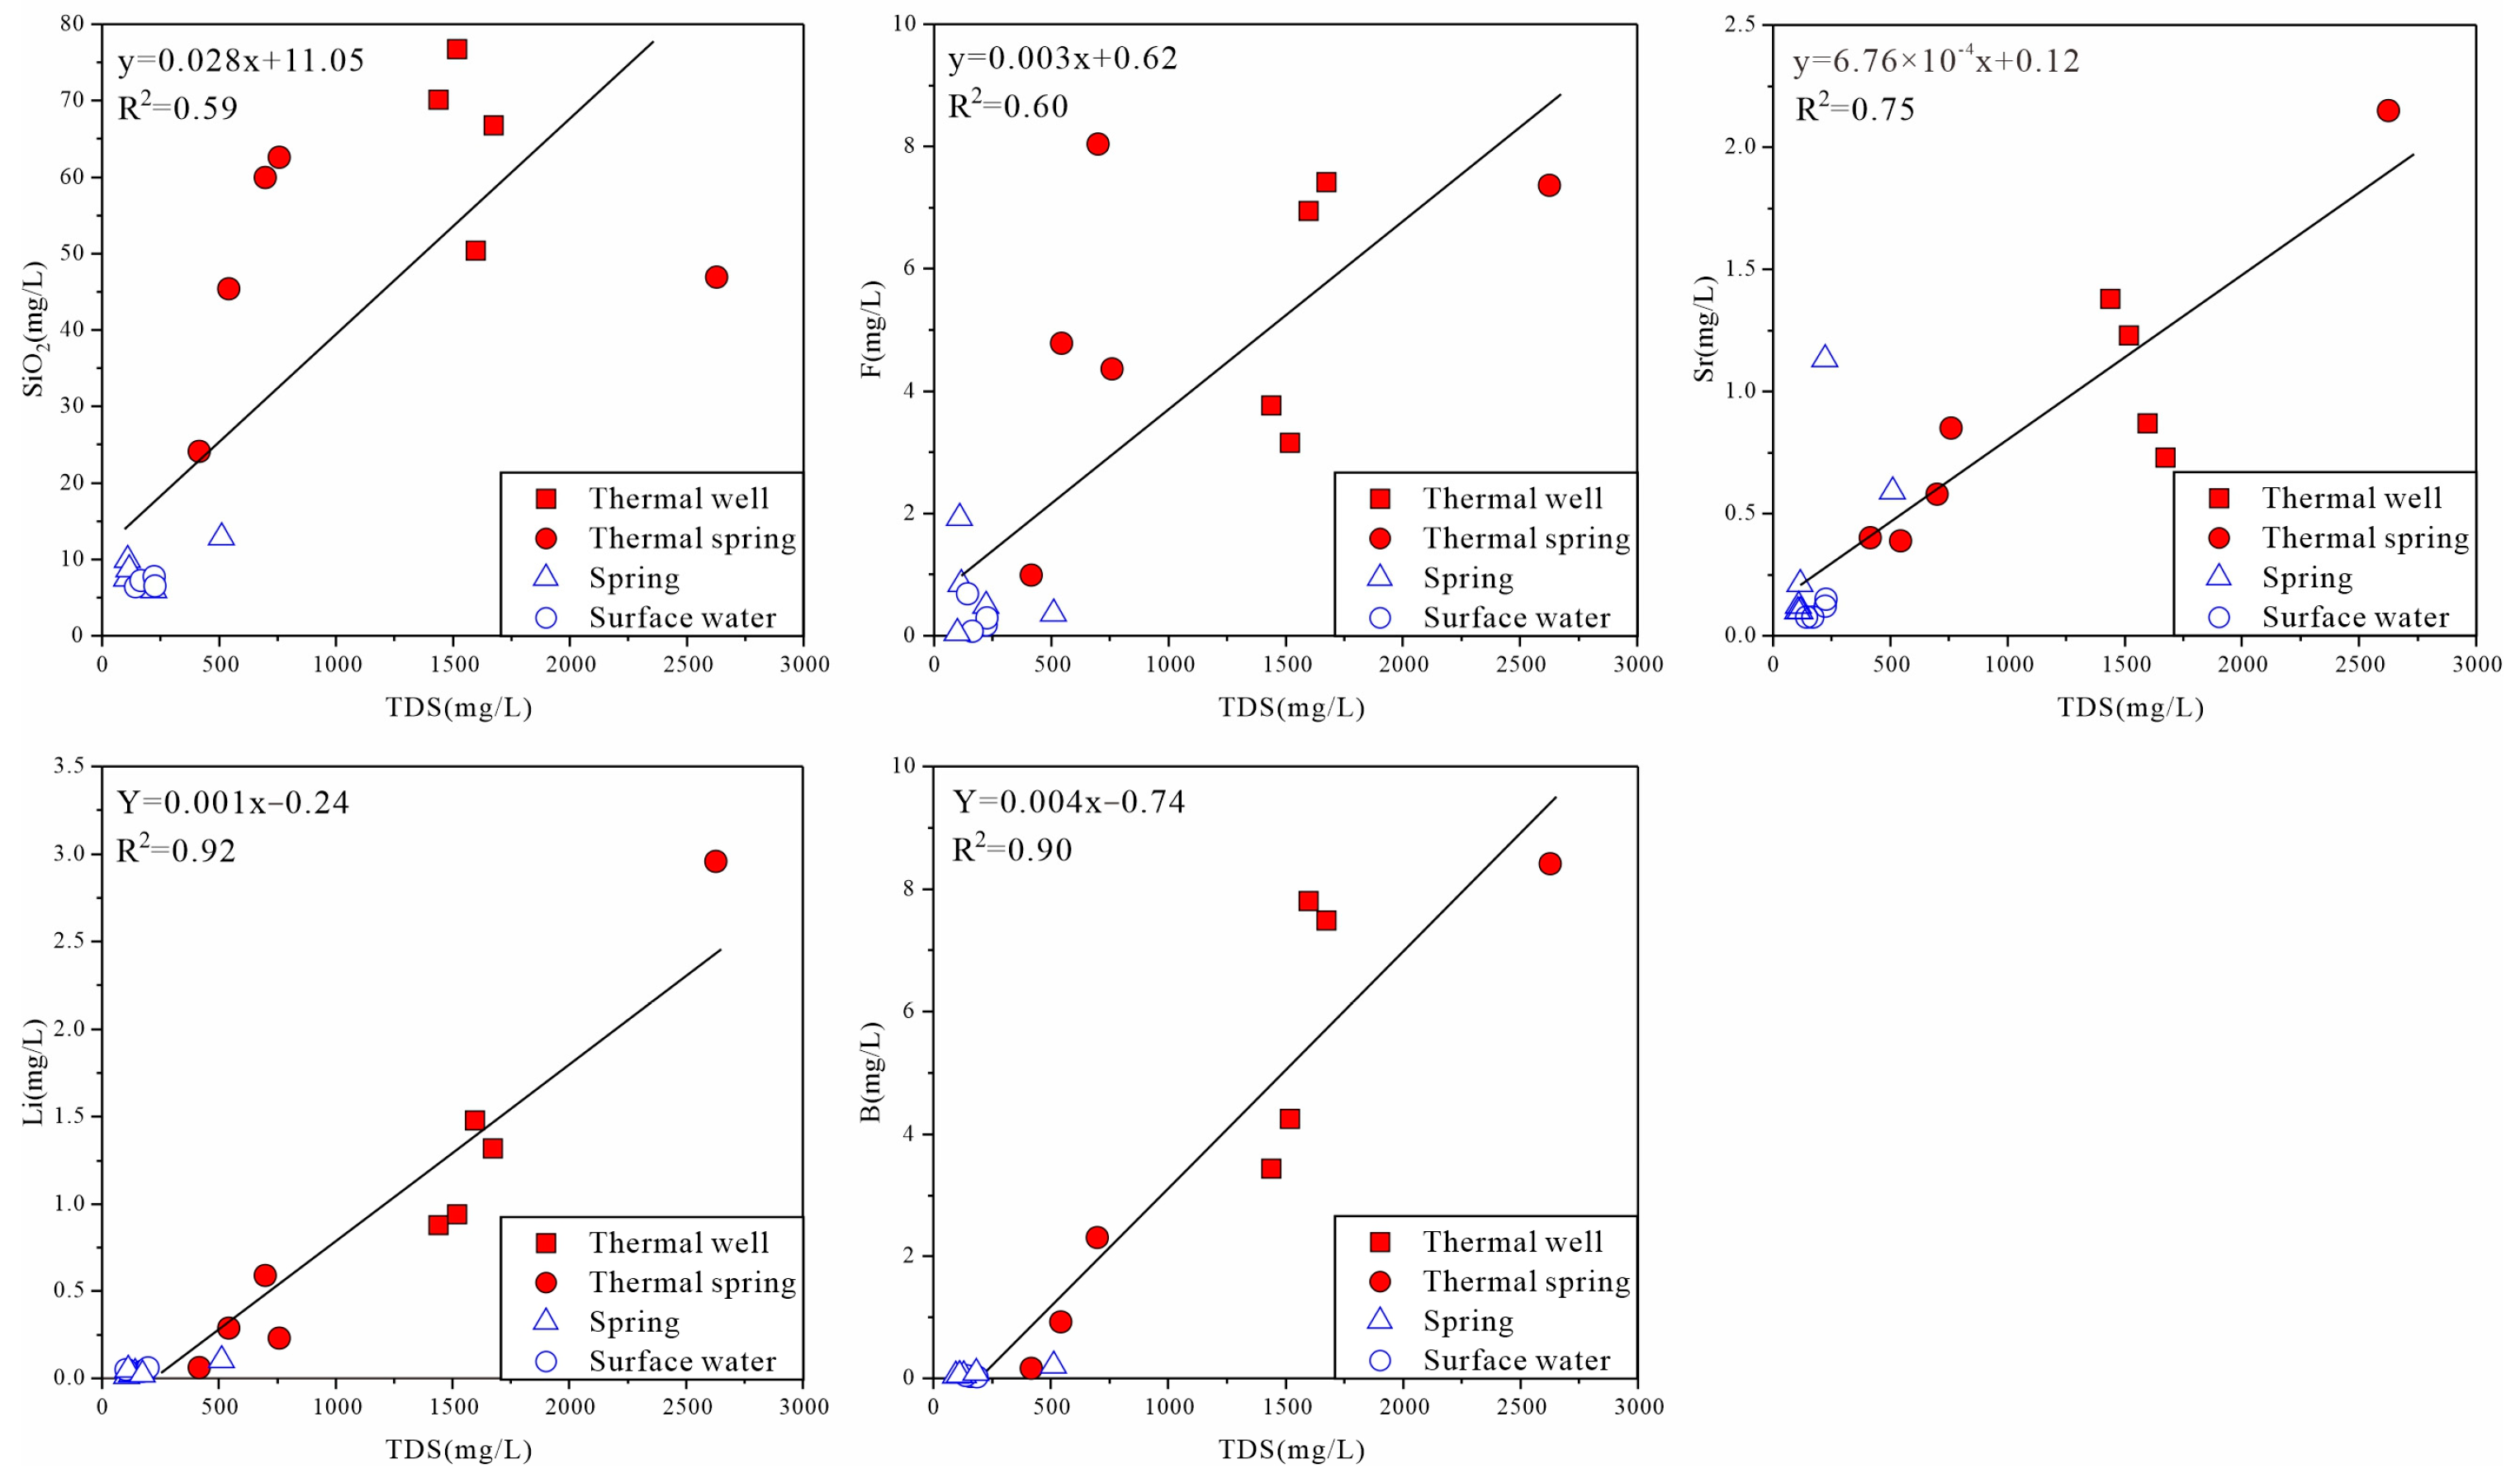
There was a positive correlation between the TDS content in non-geothermal and geothermal water and the typical geothermal components of SiO2, F, Sr, Li, and B (Figure 4). This indicates that the contents of the characteristic components such as SiO2, F, Sr, Li, and B in geothermal water are mainly controlled by water–rock interactions such as mineral dissolution. The R2 between Li and B contents and TDS reached more than 0.9, indicating that Li and B have the same source between geothermal water and non-geothermal water. Water–rock interactions during deep circulation increase Li and B concentrations in geothermal water.
The geothermal system in the Tibet zone can be classified into three genesis types: (1) magma reservoir-type high-temperature geothermal system undergoing cooling in the crust; (2) locally molten geothermal system within the crust in collision zones; and (3) deep circulation heating geothermal system [31,32,33,34]. Geothermal fluids lacking magma heat sources are created by deep heating of groundwater through high heat flow circulation. Wang et al. (2023) relied on the CRUST1.0 model and a large amount of geological data to analyze the distribution characteristics of the crustal heat generation rate in China’s continental areas [35]. The Qinghai–Tibet Plateau was found to have the highest crustal heat flow value (crustal heat flow: 55–75 mW·m−2). This conclusion provides a basis for using a heat source for deep circulation heating geothermal systems. High-temperature geothermal systems such as Yangbajing, Yangyi, Gudui, and Gulu in central and southern Tibet have all been confirmed to have heat sources related to local melting in the crust. Moreover, the chlorine enthalpy model and silicon enthalpy diagram were used to determine the existence of parent geothermal fluid beneath the geothermal field.
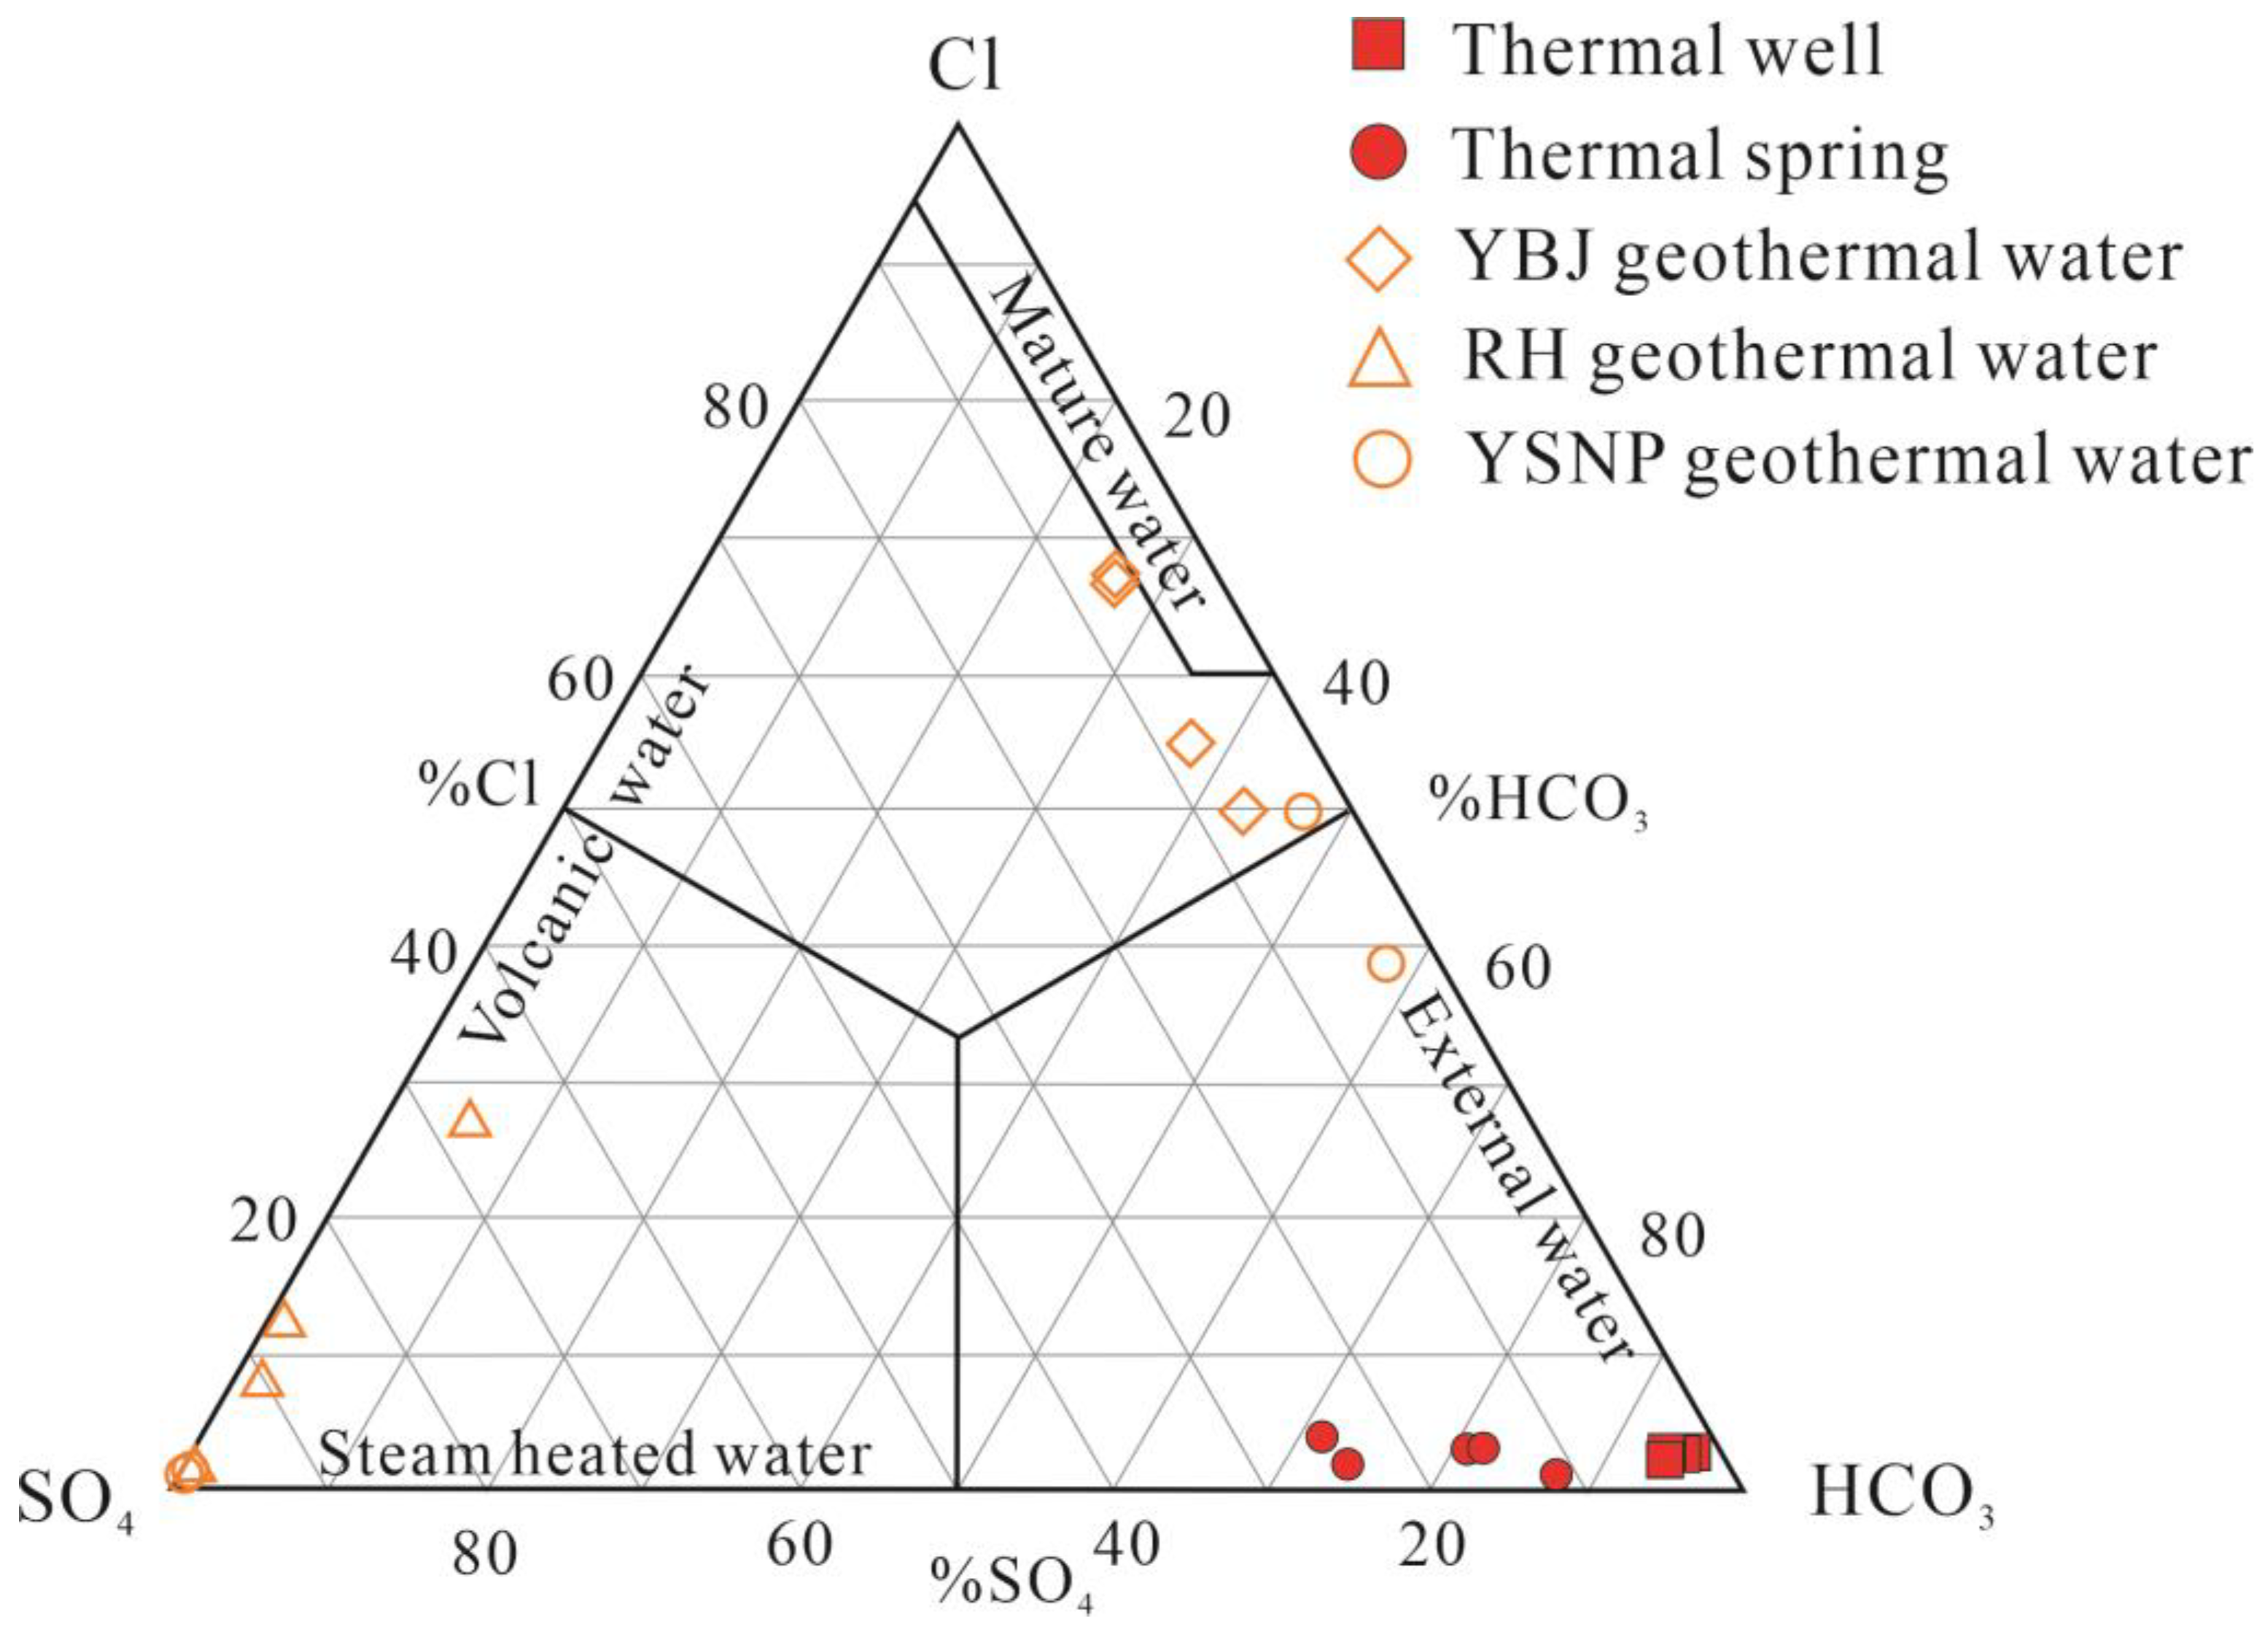
To clarify whether the geothermal water in Zuogong is affected by molten magma, this study used the anion ternary diagram (Cl–SO4–HCO3) to compare the contents of four characteristic elements (Li, B, F, and As) in geothermal water possibly derived from magma with hydrochemical constituents of Tengchong Rehai (RH) in Yunnan, Yangbajing (YBJ) in Tibet, and Yellowstone National Park (YSNP). These locations are known to have clear magma heat sources [36,37,38]. As shown in Figure 5, the geothermal water in the Zuogong area is bicarbonate geothermal water, and water samples are all distributed in the peripheral cycle water area. In terms of the characteristics of the anionic components, Zuogong geothermal water is not affected by the molten magma.
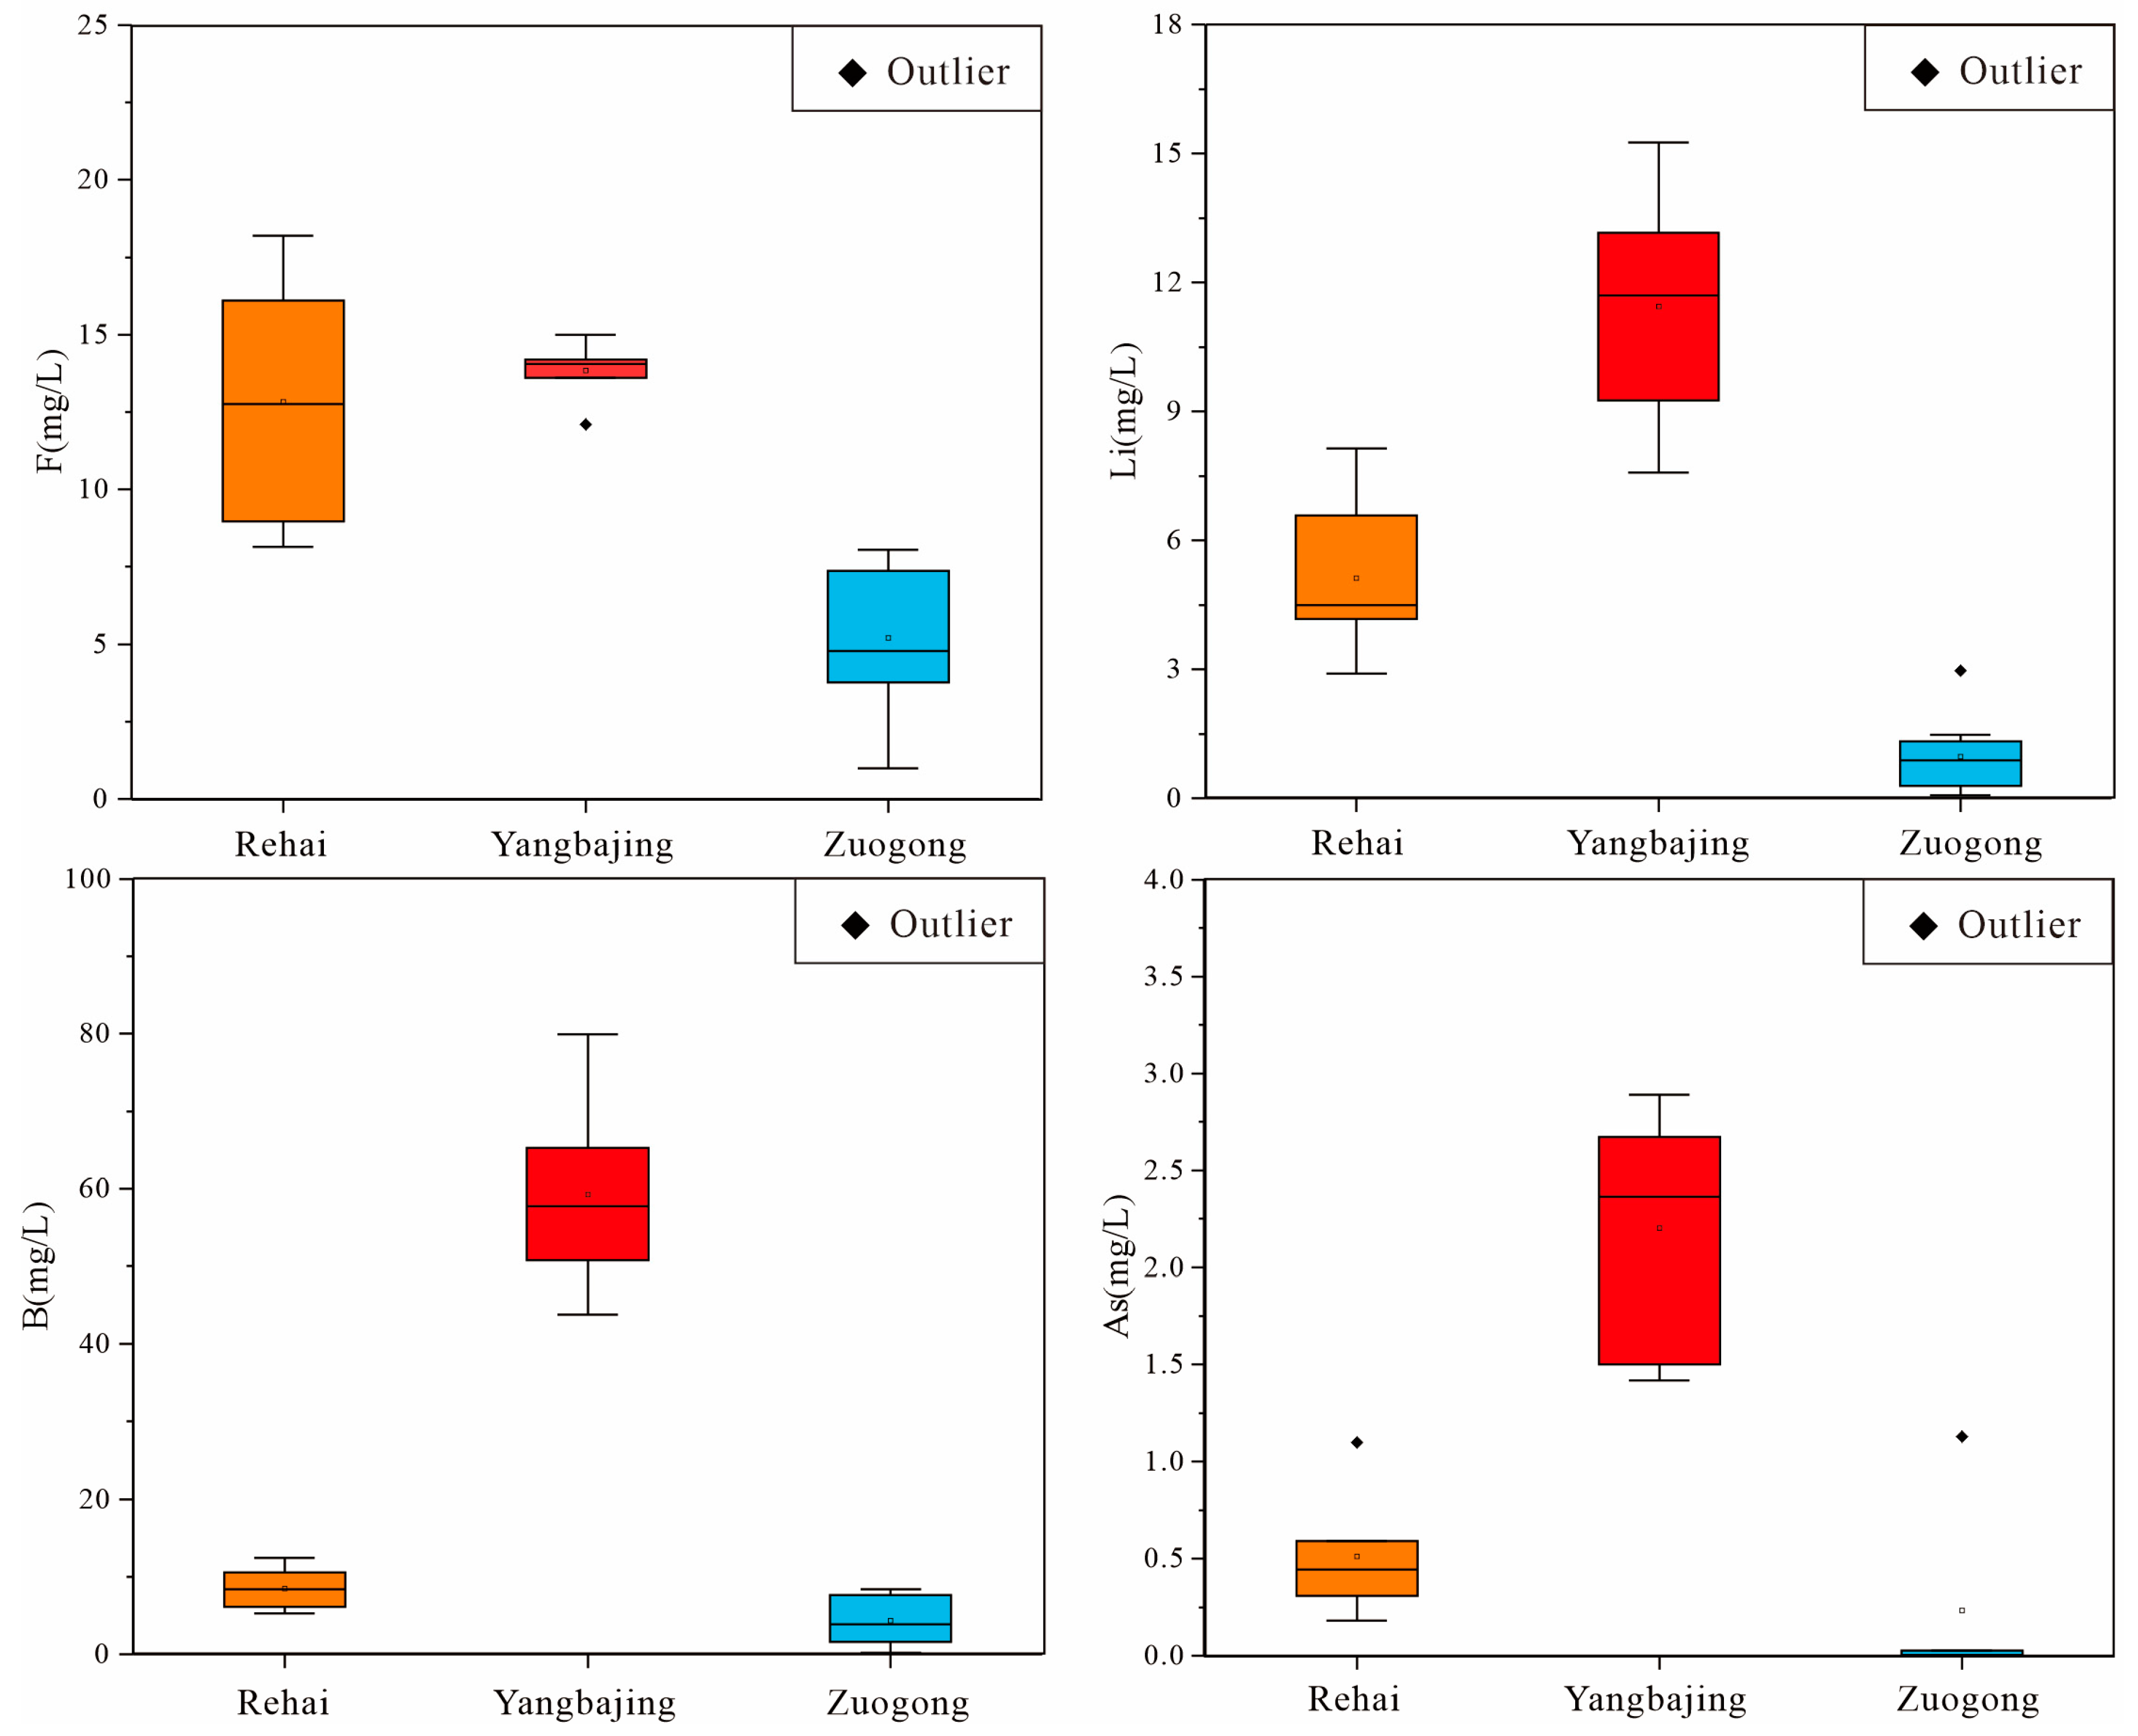
For geothermal water with magmatic heat sources, the four characteristic elements, Li, B, F, and As, may come from volatile substances in the cooling process of deep magma [39,40]. Therefore, Li, B, F, and As elements were simultaneously enriched in geothermal fluid with magmatic heat sources. The Li, B, F, and As element contents of the geothermal water in Yangbajing and Rehai were compared with those of the Zuogong geothermal water (Figure 6). The results showed that the Li, B, F, and As concentrations of the Zuogong area’s geothermal water substantially differed from those in Yangbajing and Rehai with magmatic heat sources. The Li and As contents even reached an order of magnitude difference. The difference could not be attributed to the different degrees of water–rock interaction but was caused by differences in heat sources. The above research shows no magmatic heat source in the geothermal system of the Zuogong area.
The high levels of Na+, K+, HCO3, Cl, SiO2, and TDS in both geothermal and non-geothermal waters suggest that the interaction between water and silicate minerals deep within the earth is responsible for the salts found in geothermal water. Additionally, the strong correlation between TDS and B and Li fractions in the water samples suggests that the interaction between water and B- and Li-bearing minerals during deep circulation is the primary source of B and Li fractions in geothermal water. The presence of SO42− in the hot well water and hot spring water suggests that sulfate minerals near the earth’s surface contribute to the water’s SO42− content. Furthermore, the presence of characteristic ions (F, Li, B, and As) in the geothermal water, along with the Cl-SO4-HCO3 diagram, indicates that there was no mixing of magmatic fluids during the formation of the geothermal water.

5.2. Estimation of Circulation Temperature and Depth for Thermal Groundwater

The results of calculating the thermal reservoir temperature using a geochemical thermometer are shown in Table 4. The thermometer calculation results of chalcedony with no steam loss and maximum steam loss ranged from 39 to 95 °C and from 49 to 96 °C, respectively. The thermal reservoir temperatures calculated by quartz with no steam loss and quartz with the maximum steam loss thermometers ranged from 71 to 123 °C and from 75 to 121 °C, respectively.
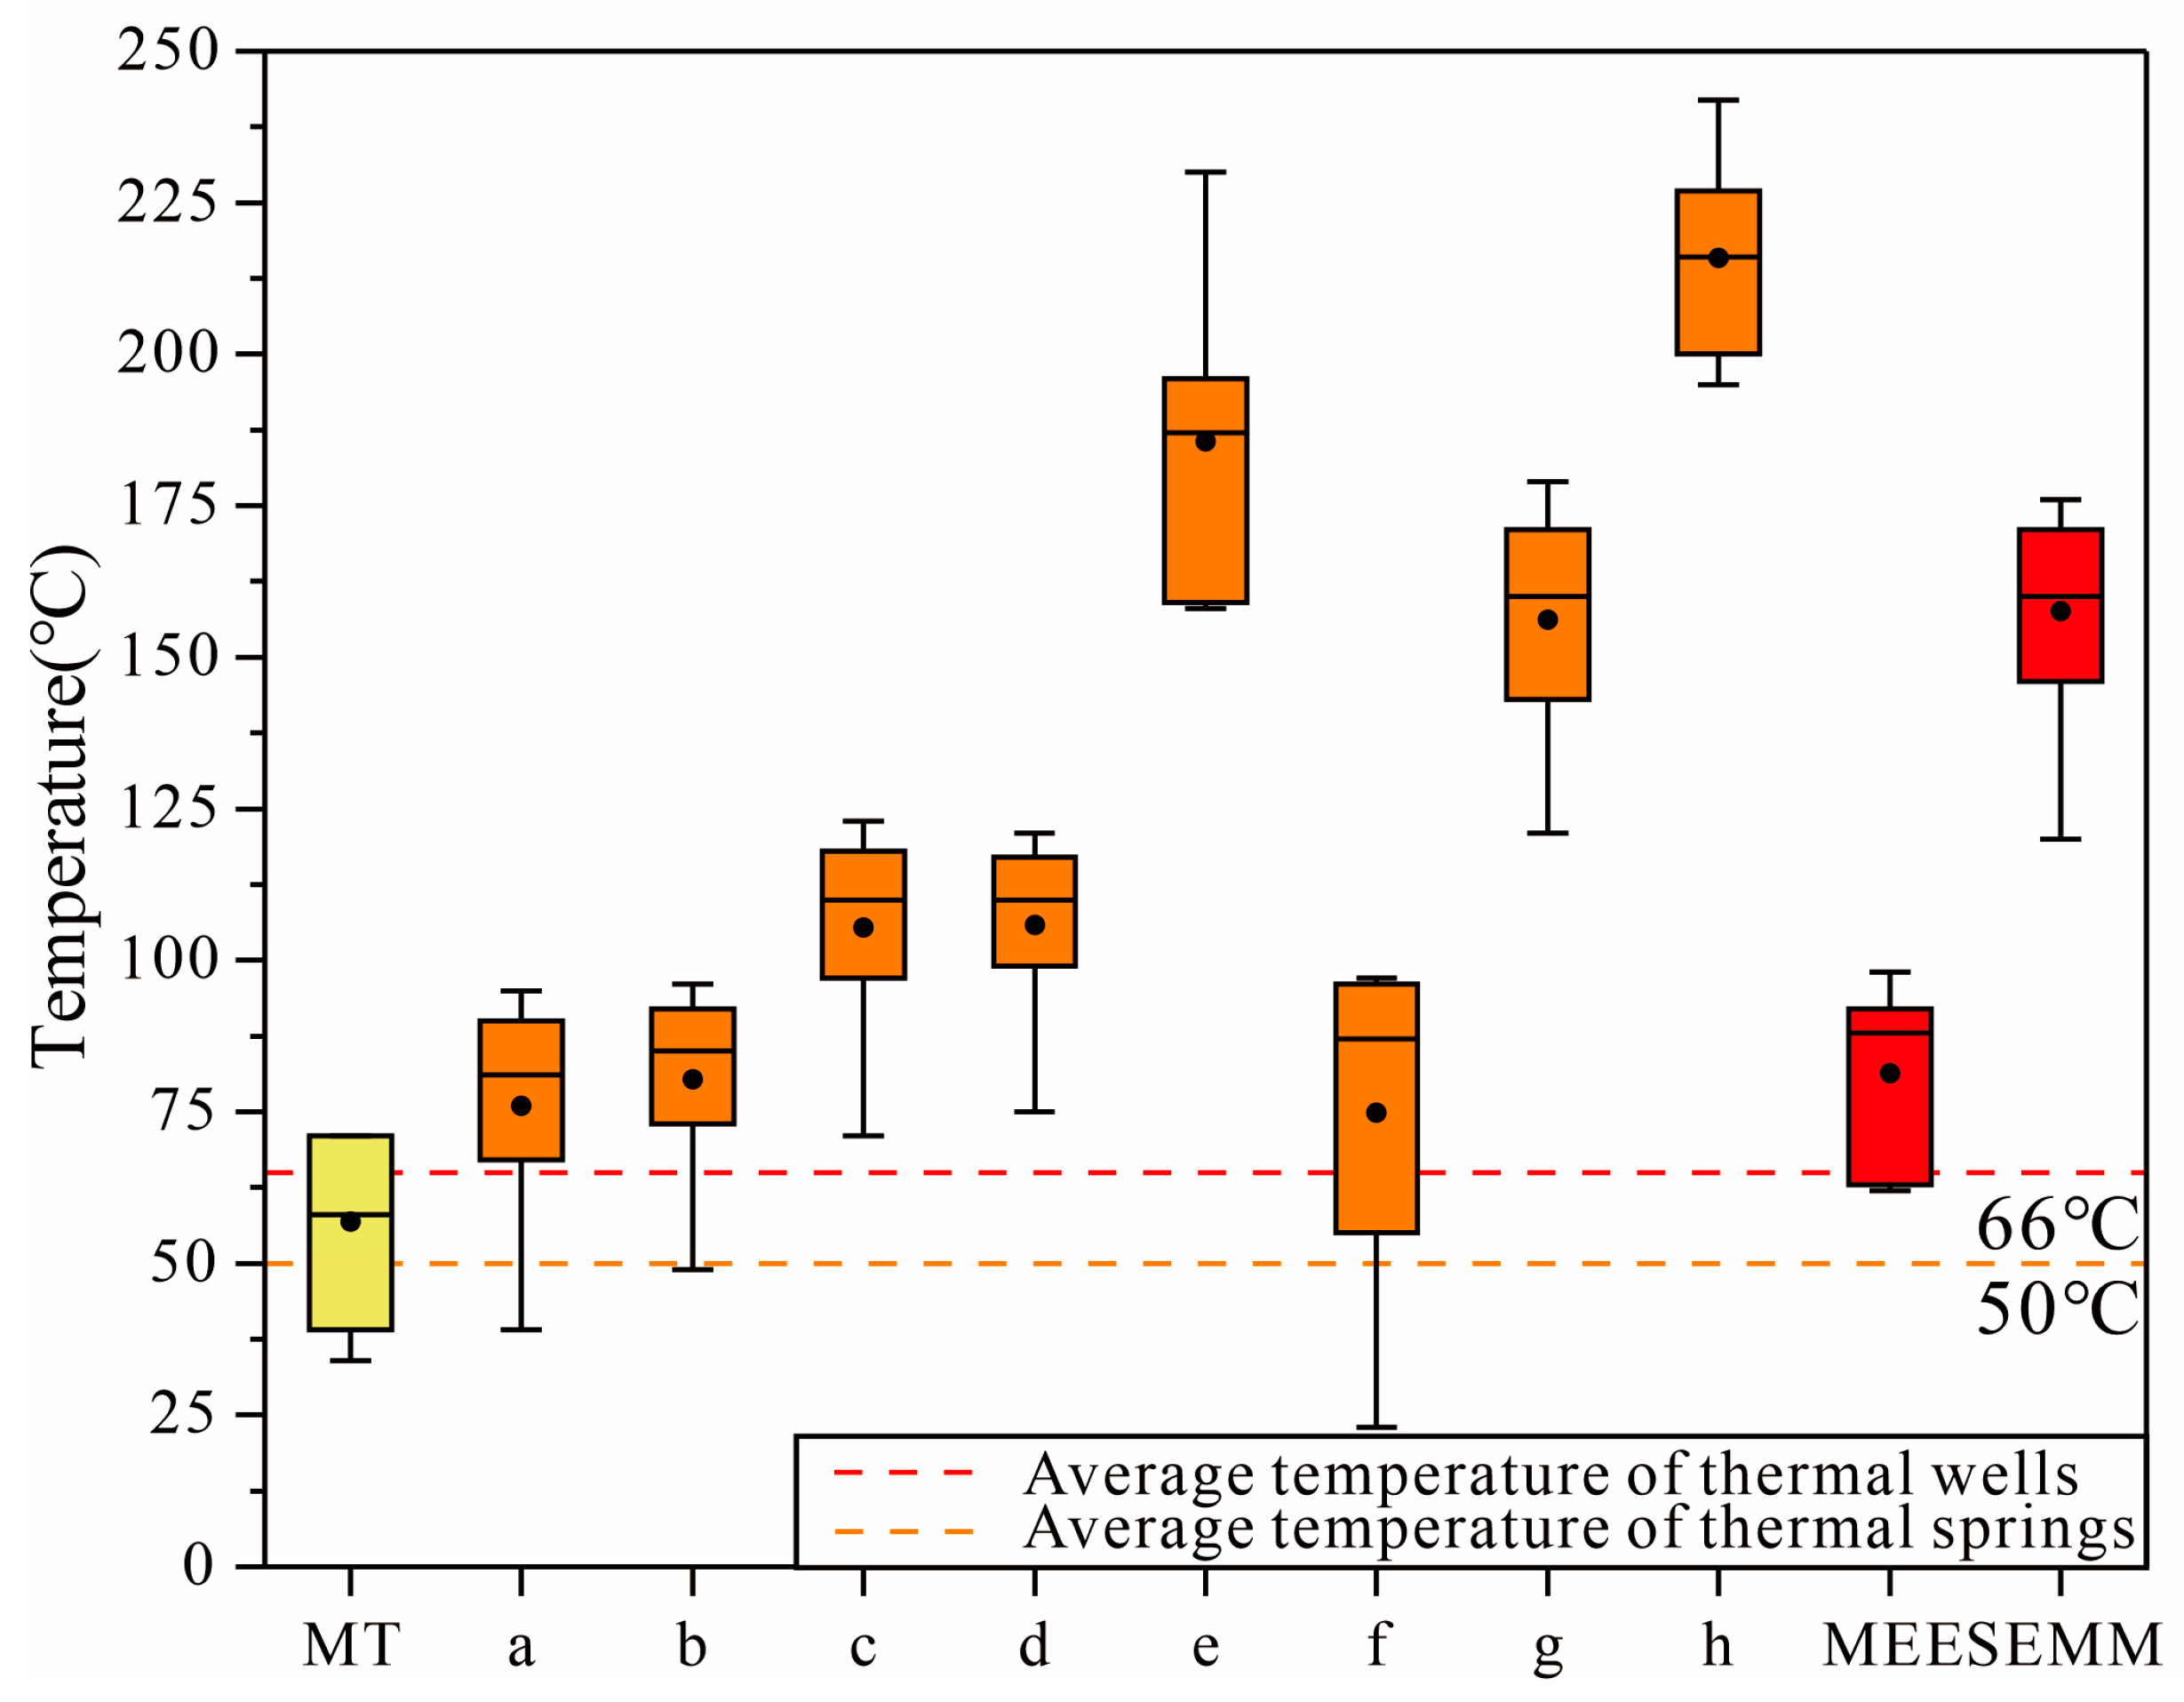
Generally speaking, the higher the SiO2 concentration in the water sample, the higher the thermal reservoir temperature. This is because the solubility of SiO2 changes with temperature. Since the equilibrium concentration controlled by different silica minerals changes differently with temperature, it is necessary to select appropriate silica minerals when selecting a silica geothermometer [41]. The sampling temperatures of geothermal water were all lower than the local boiling point; thus, the maximum steam loss thermometer was unsuitable for this area. The calculated results of the chalcedony and quartz thermometers with no steam loss were both higher than the sampling temperature (Figure 7). It indicates that the results obtained by the silica thermometer may represent the thermal reservoir temperature in the Zuogong area, and the calculated results of the chalcedony thermometer with no steam loss were in good agreement with the temperature estimated by the multi-component mineral equilibrium simulated using the PHREEQC Interactive RC1 software (see below).
The calculation results of the cation thermometer are as follows: The thermal reservoir temperature obtained by the Na-K thermometer was between 158 and 230 °C, the calculated result by the K-Mg thermometer was between 23 and 97 °C, the temperature range obtained by the Na-Li thermometer was between 195 and 242 °C, and the thermal reservoir temperature calculated using the Na-K-Ca thermometer was between 121 and 179 °C.
The results of Na-K and Na-Li thermometers generally yield higher values, which inaccurately characterize the thermal reservoir temperature in the region. The Na-K thermometer is used for the equilibrium control between geothermal water and alkaline feldspar in high-temperature geothermal systems, and it is suitable for thermal water above >150 °C [42]. When the Na-K thermometer is used in medium- and low-temperature geothermal systems, the calculated thermal reservoir temperature will be higher due to the increase in Ca2+ and SO42− contents [43,44]. The calculation results obtained by the Na-Li thermometer were similar to those of the Na-K thermometer. This is because the Na-Li thermometer is also suitable for characterizing the temperature of deep thermal reservoirs and controlling minerals in medium- and low-temperature geothermal systems not to reach equilibrium. The K-Mg thermometer is controlled by the mineral equilibrium between muscovite, K-feldspar, and chlorite, and it is easier to reach equilibrium again than the Na-K thermometer. Therefore, the K-Mg thermometer can represent the thermal reservoir characteristics after mixing with shallow, cold water. However, the calculated results of the geothermal water in the study area using the K-Mg thermometer were lower than the sampling temperature, indicating that the K- and Mg-controlled minerals in the water samples had not reached equilibrium. Therefore, the K-Mg thermometer is not suitable for this analysis. The Na-K-Ca thermometer is a correction to the Na-K thermometer and is suitable for geothermal systems with lower temperatures, especially in geothermal water rich in Ca2+. In this study, the thermal reservoir temperature calculated by the Na-K-Ca thermometer was lower than that of the Na-K and Na-Li thermometers and higher than that of the silica thermometer. It is inferred that the thermal reservoir temperature calculated by the Na-K-Ca thermometer is relatively reliable.
Multicomponent mineral equilibrium temperatures were inferred for the four thermal well samples and five thermal spring samples with the highest measured temperatures using the PHREEQC geochemical code and the lnll thermodynamic database. Based on this field survey and previous research results, minerals that may exist in the reservoir and be used in modeling were selected [45], including calcite, chrysotile, quartz, muscovite, kaolinite, chalcedony, sepiolite, and diopside. Al data in geothermal water are often missing, and the FixAl method needs to be used to force the solution to maintain equilibrium with Al-containing minerals. Microcline is commonly used in forced equilibrium systems with pH values ranging from 5.5 to greater than 9 [46].
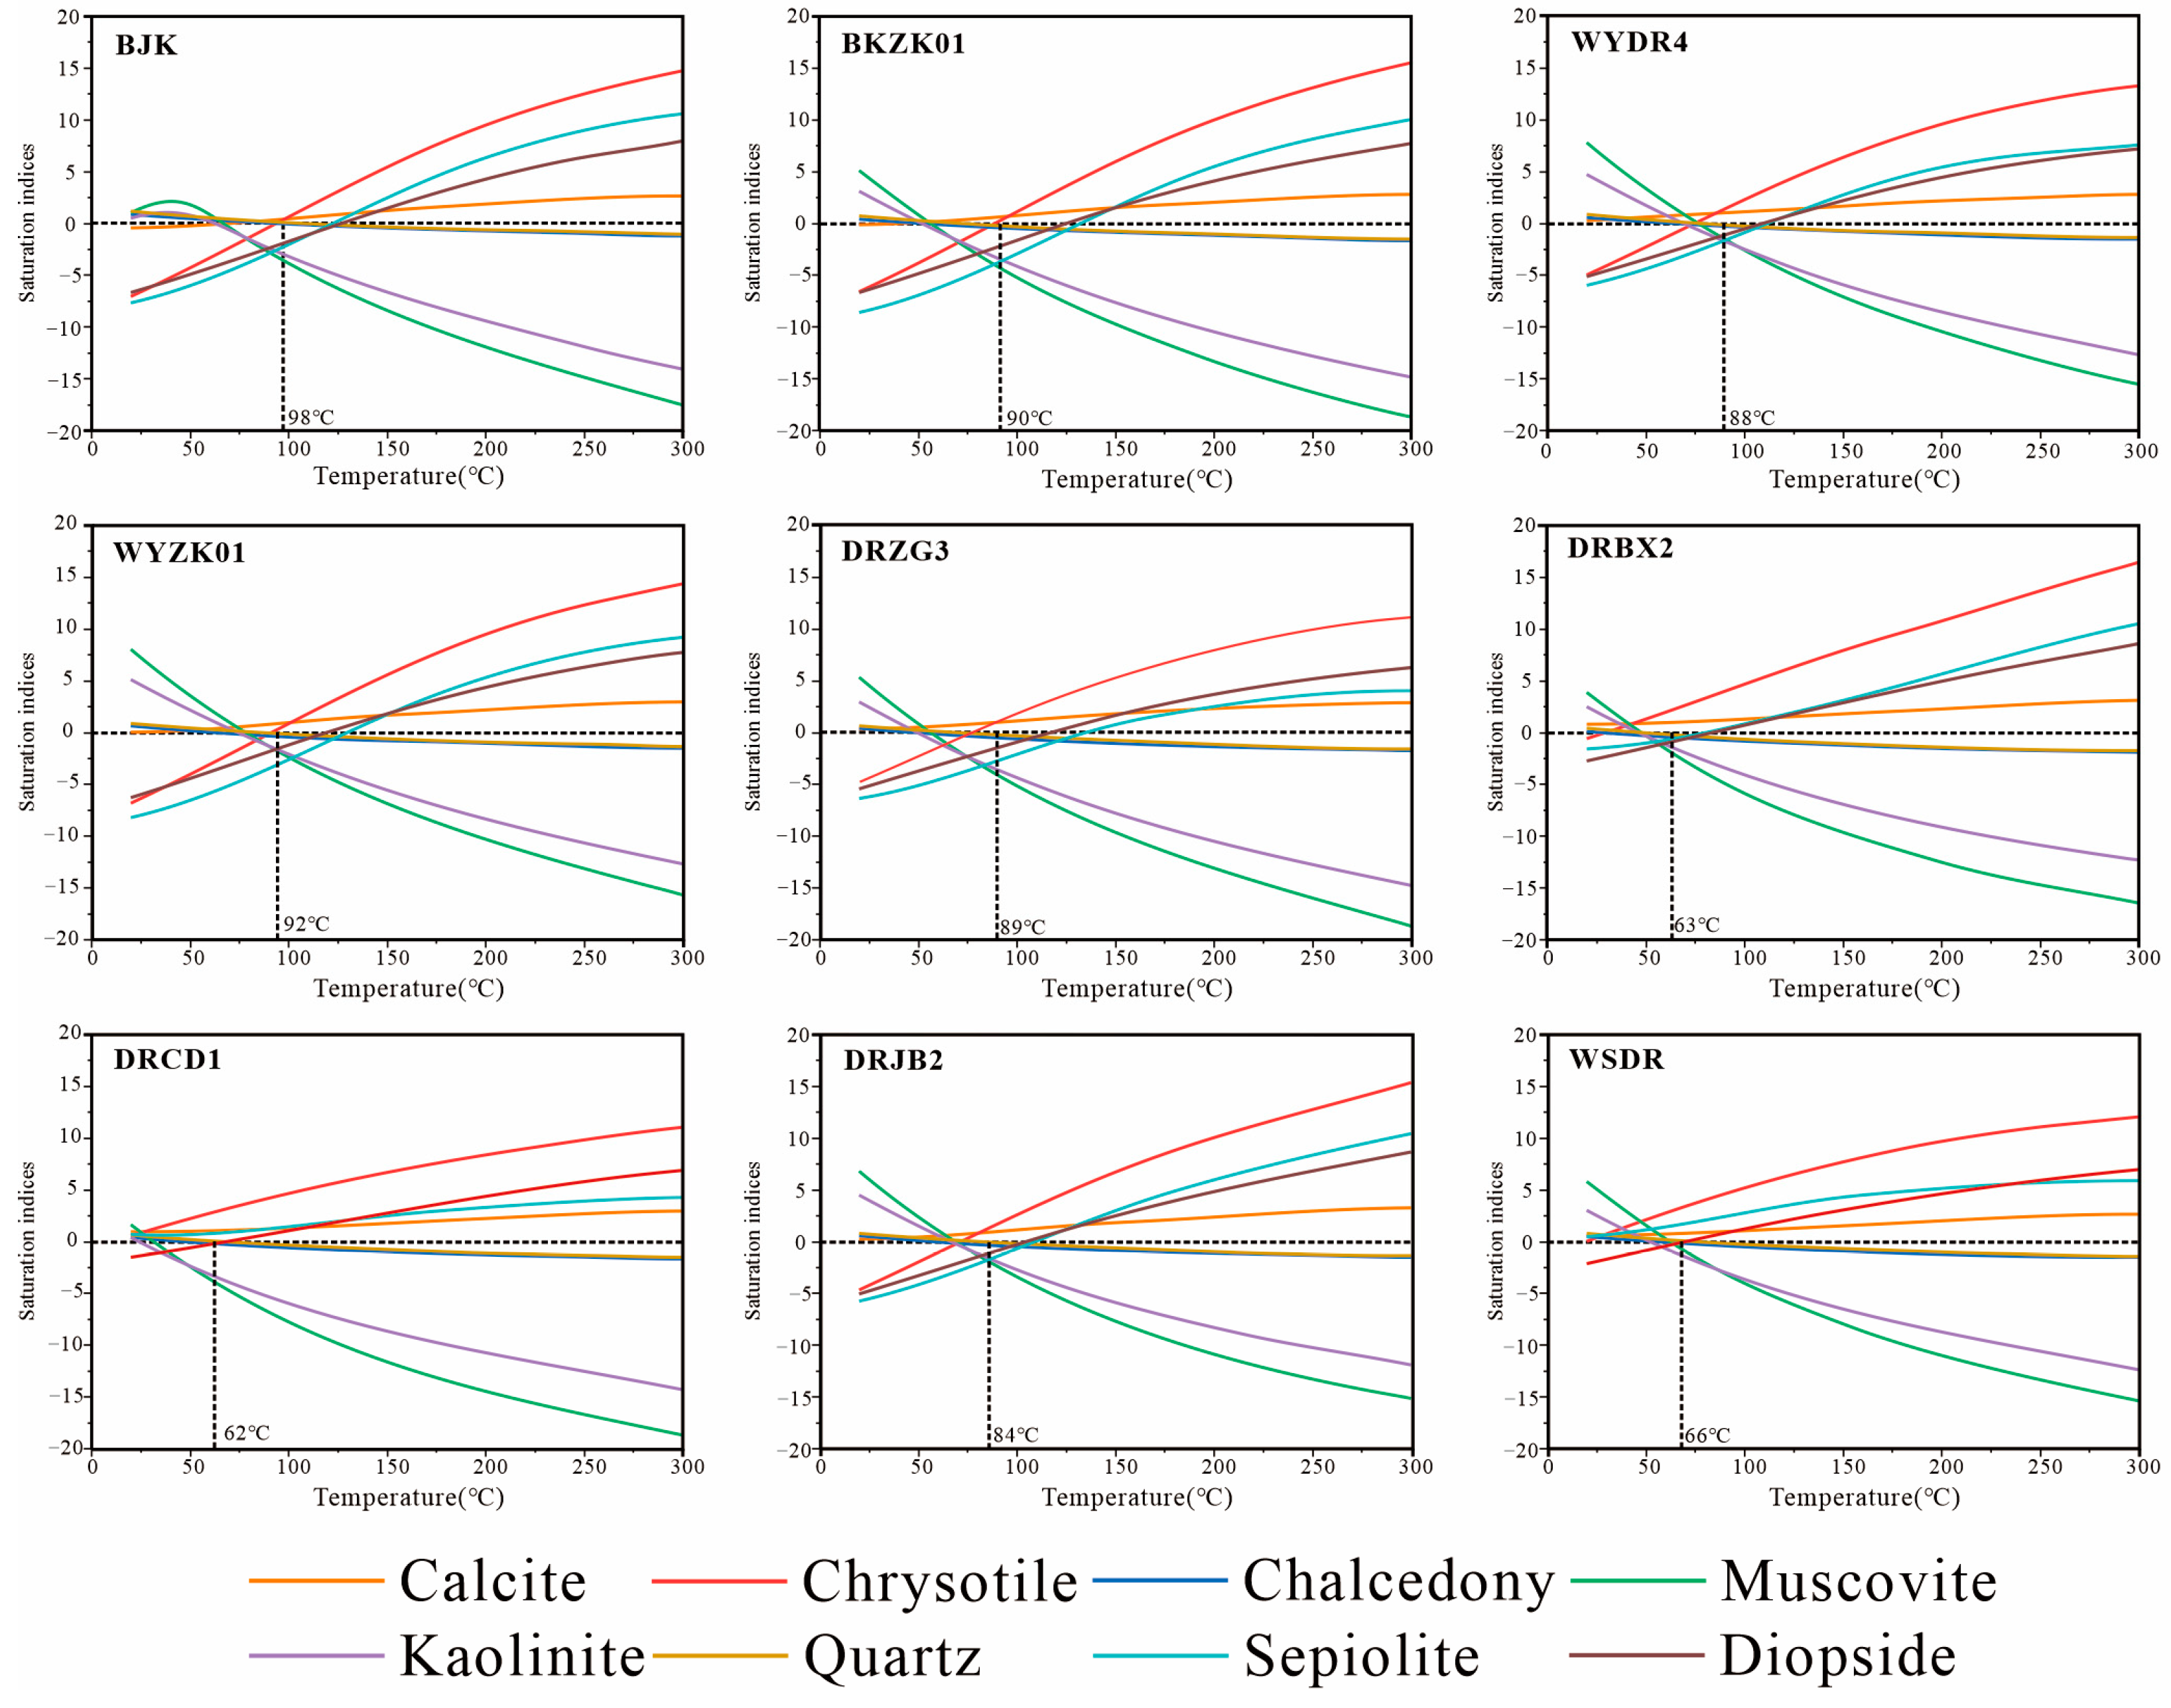
The results of the geothermal thermometer simulation of multiple mineral equilibrium are shown in Figure 8. The predicted thermal reservoir temperature is between 62 and 98 °C. The predicted results are similar to the results of the chalcedony thermometer with no steam loss, proving that the results obtained by this method can represent the thermal reservoir temperature in the Zuogong area. The analysis showed that the temperature of the thermal well water reservoir was 88–98 °C, indicating that the deep thermal reservoir and the degree of water–rock interaction are similar. The simulation result of thermal spring water was 62–89 °C, inferring the degree to which the thermal spring is mixed with shallow non-geothermal water while rising to the shallow part.
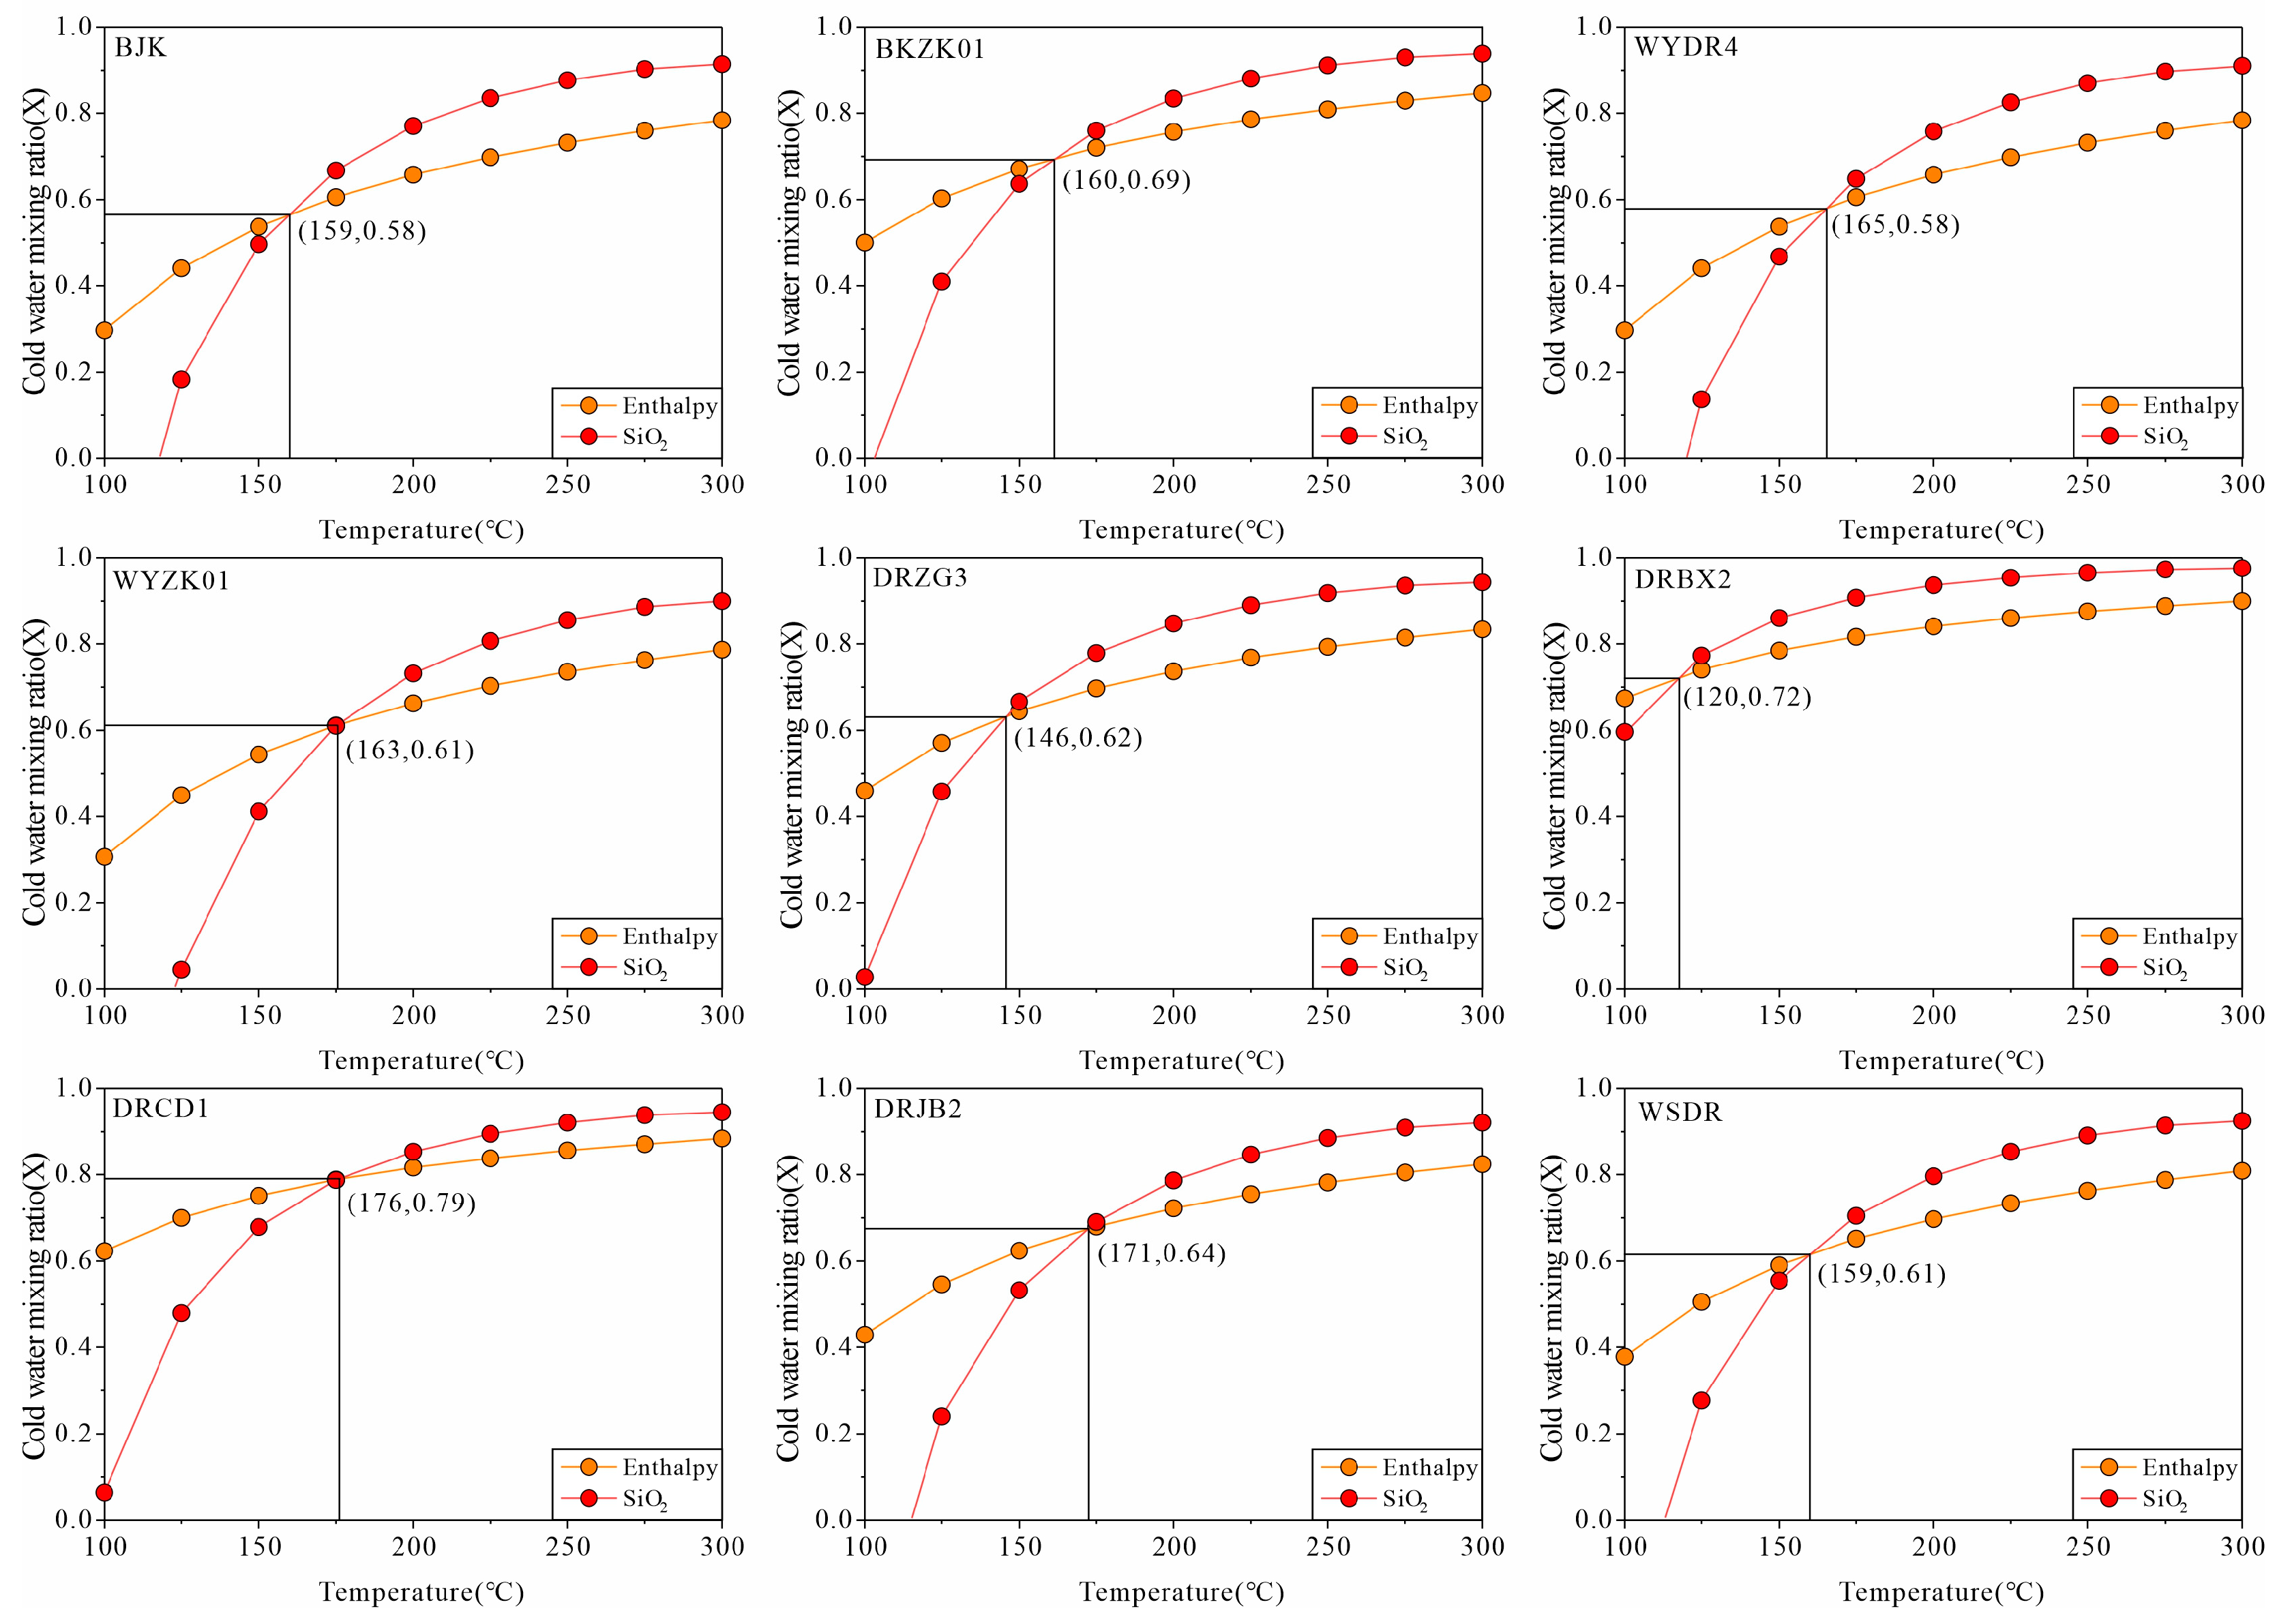
According to the silica-enthalpy mixing model, the mixing ratios of thermal well water, thermal spring water, and non-geothermal water were calculated to be from 58 to 69% (62%) and from 61 to 79% (68%), respectively. The thermal reservoir temperatures before cold water mixing ranged from 159 to 165 °C and from 120 to 176 °C, respectively (Figure 9). The thermal reservoir temperature before the mixing of geothermal water and non-geothermal water was similar to the reservoir temperature obtained by the Na-K-Ca thermometer, indicating that the calculation results of the Na-K-Ca thermometer can be used to characterize the initial reservoir temperature of geothermal fluid in Zuogong County. It is generally believed that the initial temperature of geothermal water before non-geothermal water mixing is between 120 and 176 °C. The mixing ratio of thermal spring water was higher than that of thermal well water. This is because the mixing of cold water is a dynamic process, and the ratio of cold water gradually increases as the geothermal water rises to the shallow part.
According to the calculation results of thermal reservoir temperature, it can be seen that there are two thermal reservoir temperatures during the upwelling process of geothermal water. One is the thermal reservoir temperature after experiencing the mixing of non-geothermal water, which is obtained by the multimineral saturation index method (from 62 to 98 °C). The second is the thermal reservoir temperature before non-geothermal water mixing, obtained by the silica-enthalpy mixing model (from 120 to 176 °C). Since geothermal water inevitably accepts the mixing of non-geothermal water during the circulation process, this study explained the two circulation depths before and after the mixing of non-geothermal water when calculating the geothermal water circulation depth (Table 3). The thermal reservoir cycle depth before mixing is supposed to represent the initial depth of geothermal fluid [47,48]. According to the calculation results of cycle depth (Equation (2)), the thermal reservoir circulation depth of geothermal fluid in Zuogong County was between 1659 and 2687 m after experiencing non-geothermal water mixing from 58 to 79%, while that before non-geothermal water mixing was between 3316 and 4916 m.

5.3. Recharge Source of Geothermal Water

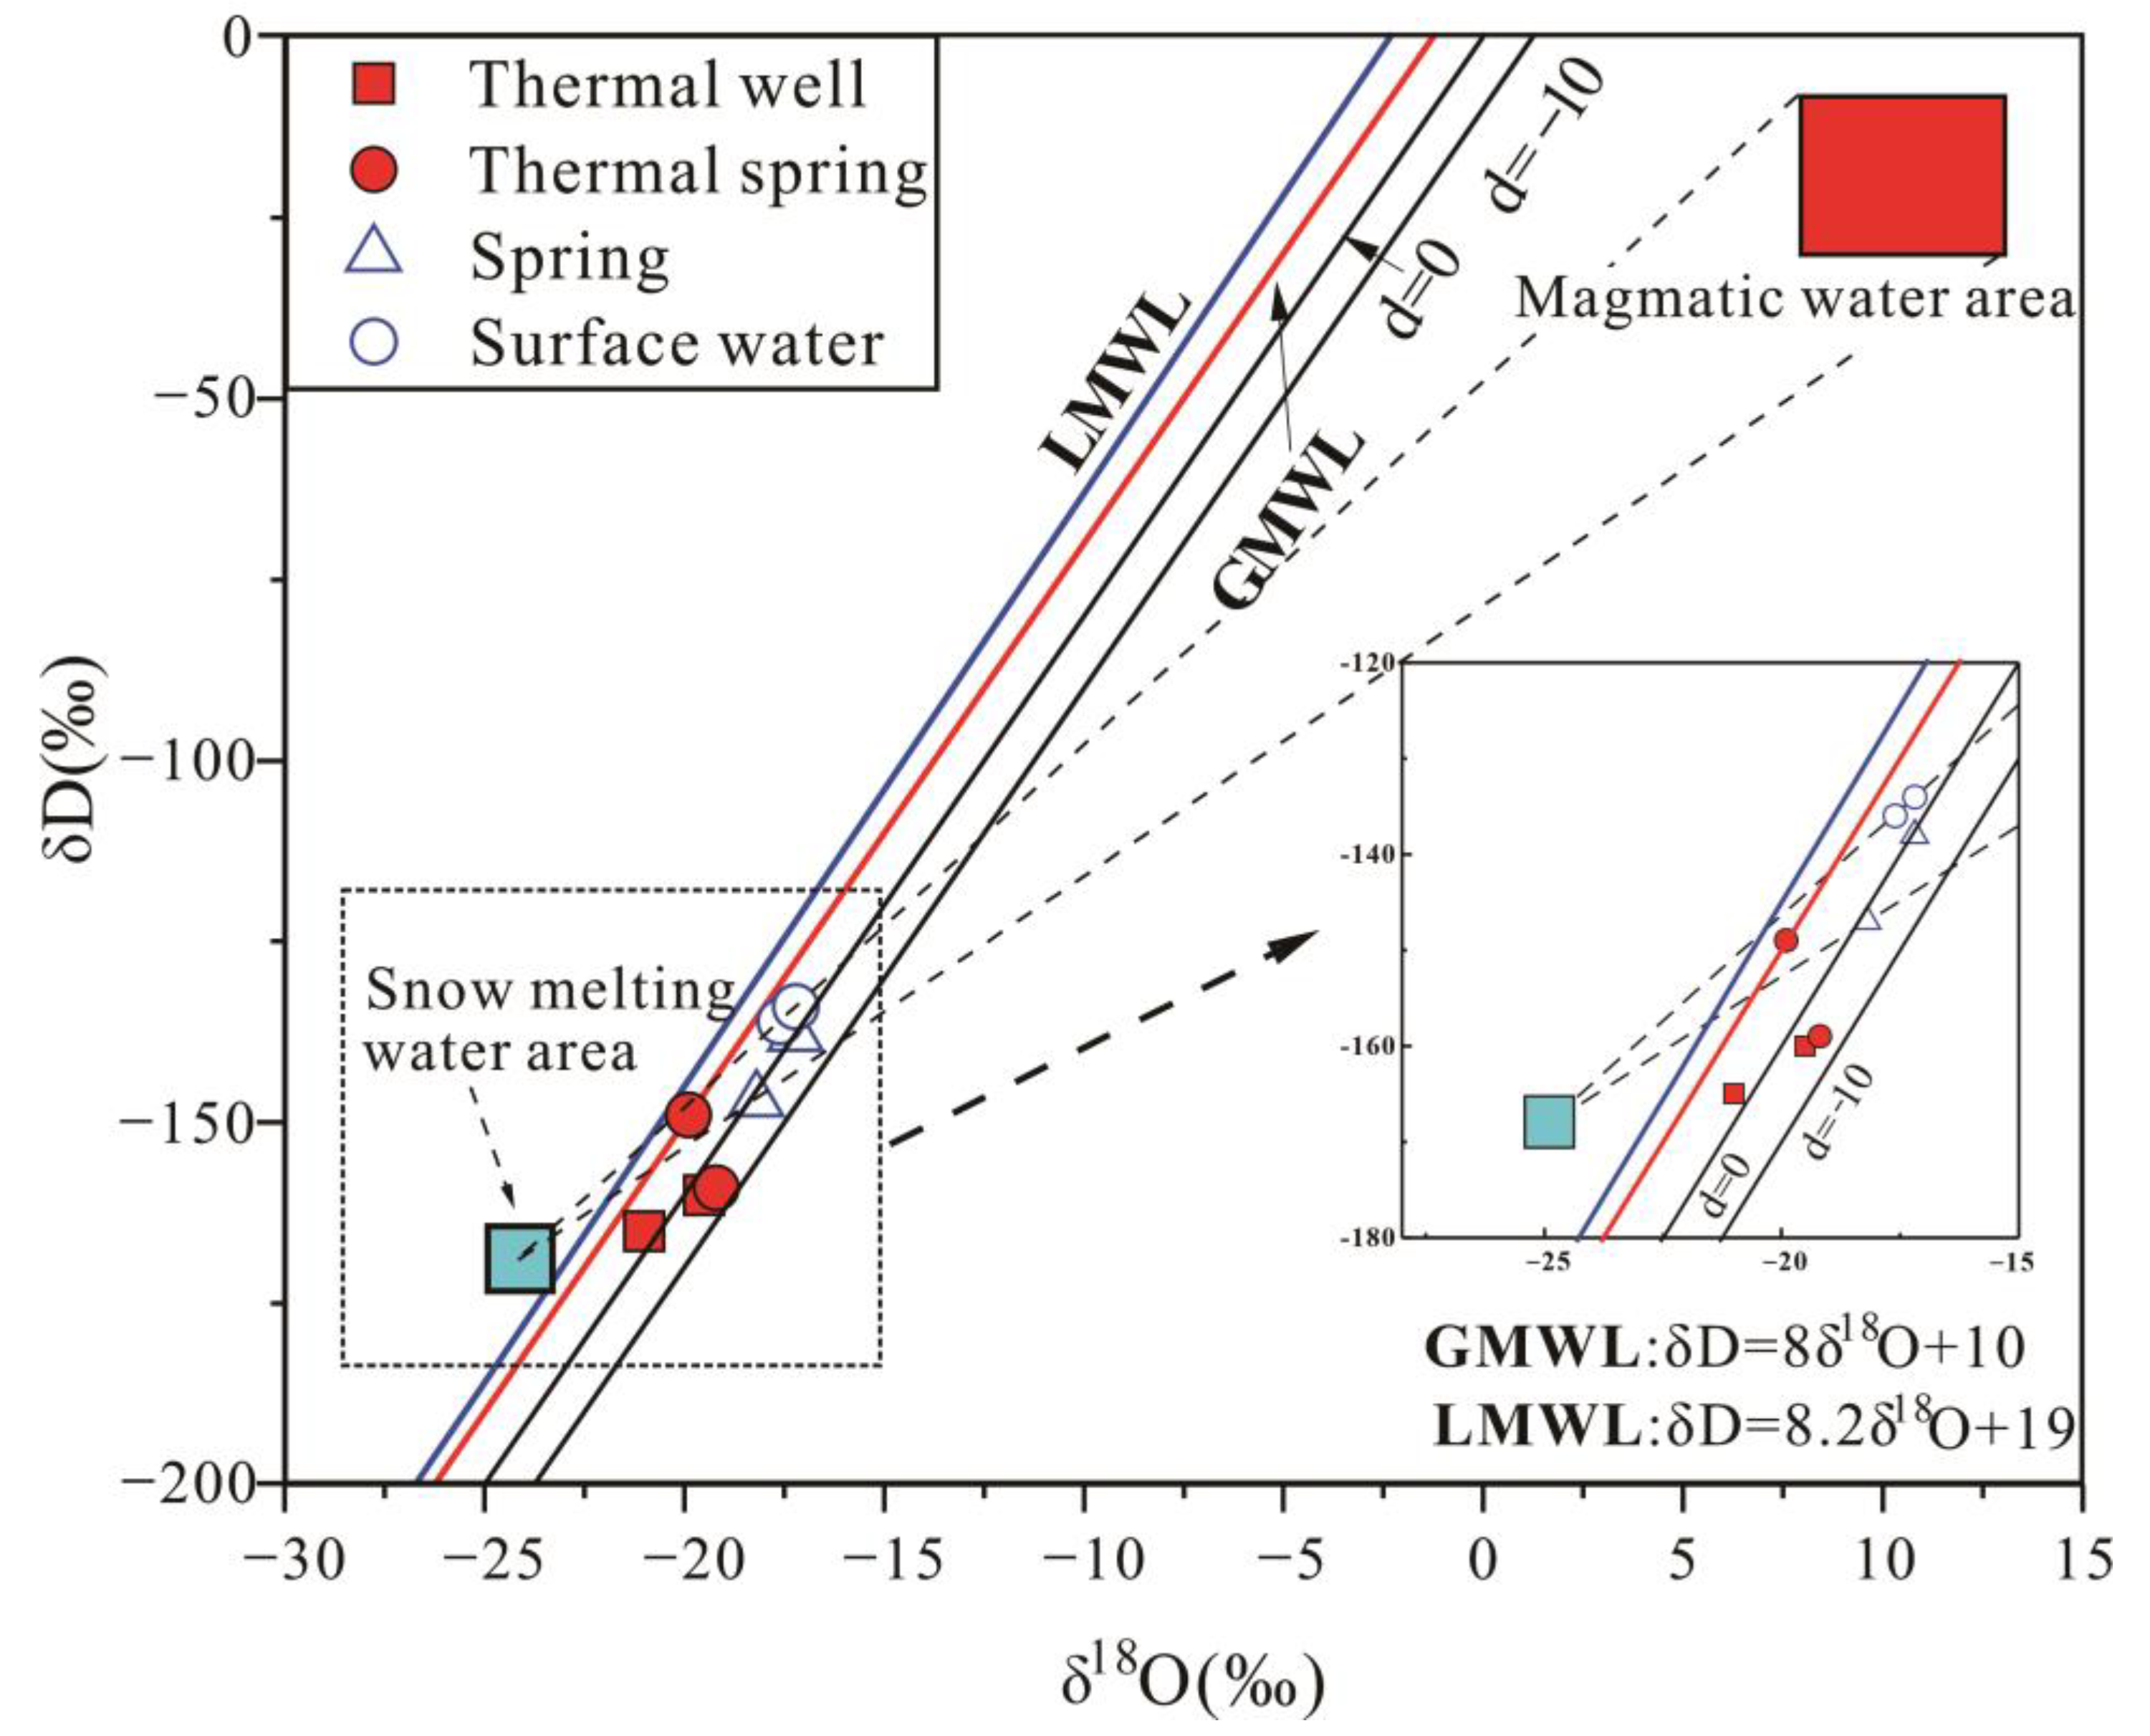
The stable isotope characteristics of hydrogen and oxygen can help determine the source of geothermal water and the scope of the recharge area. Figure 10 shows that both geothermal and non-geothermal waters in Zuogong County are located near the global meteoric water line (GMWL: δD = 8δ18O + 10) and below the local meteoric water line (i.e., the eastern Tibetan Plateau atmospheric precipitation line: LMWL: δD = 8.2δ18O + 19). Non-geothermal water samples were plotted in the straight line between snow-melted water and magmatic water, while geothermal waters reveal an oxygen drift phenomenon compared to snow-melted water. The results showed that the recharge sources of groundwater are atmospheric precipitation and mountain glacier meltwater. During the deep circulation of geothermal water, there is an oxygen isotope exchange between the geothermal water and the surrounding rock, leading to the enrichment of δ18O in the geothermal water.
The isotope elevation effect can be used to calculate the recharge elevation of geothermal water, thus determining the source of geothermal water recharge. Oxygen isotope values are not representative of geothermal water because they are affected by water–rock interaction. On the other hand, stable deuterium isotopes rarely undergo isotope exchange with surrounding aquifer materials, making them the ideal isotope for estimating water recharge elevation. Therefore, deuterium isotopes were used in this study to determine recharge elevations. Table 5 shows the recharge altitude results calculated using the elevation effect of stable hydrogen and oxygen isotopes in the study area (Equation (3)). The recharge altitude of thermal well water and thermal spring water ranged from 3897 to 5014 m, and the average was 4680 m. Based on the recharge altitude of geothermal water and the geological condition of the study area, it is inferred that the groundwater recharge area in the study area is the high mountain area of Zuogong County.
This study analyzed the degree of water–rock interaction during geothermal water circulation. The δ18O and δD were used to determine the degree of water–rock interaction of geothermal water, which is explained according to the δD excessive parameter d (d = δD − 8δ18O) [49,50,51,52]. Generally speaking, the smaller the d value, the slower the groundwater runoff speed, the more closed the geological environment, the weaker the renewable capacity of geothermal water, and the deeper the degree of water–rock interaction. In this study, the d value of geothermal water was between −5.4 and 10.2 (0.95), while that of non-geothermal water was between −1.4 and 4.8 (1.65) (Figure 10). The average values of geothermal and non-geothermal water were greater than 0, indicating that the geothermal water in the study area has not experienced long-term water–rock interaction during the deep circulation process.
The Na-K-Mg diagram can be used to determine the equilibrium of geothermal water (Figure 11). It can be seen in Figure 11 that all thermal well water and thermal spring water in the study area are located in the immature water area, which indicates that it may be that the geothermal fluid did not reach the complete equilibrium with surrounding minerals during the circulation process due to a small degree of water–rock interaction and the mixing and dilution of non-geothermal water. This indicates that the geothermal fluid is in a relatively open environment. Combined with the excessive parameter d value characteristics of hydrogen and oxygen stable isotopes, it is comprehensively shown that the geothermal water in the study area is in a relatively open thermal reservoir environment during the deep circulation process. The geothermal water body has a short runoff path, resulting in a faster renewal rate and shallower water–rock interaction. However, due to the mixing effects, we are unable to use the Na-K-Mg diagram for calculating the thermal storage temperatures.

5.4. Water–Rock Interaction Modeling

When using PHREEQC software to establish an inverse simulation model of geothermal water–rock interaction, it is essential to select the flow path, possible reactant minerals, and the hydrochemical constituents of the initial and final water sample [53]. This study collected two types of geothermal water: thermal well water and thermal spring water. According to previous studies, thermal spring water will also produce water–rock interaction with surrounding rocks while rising to shallow depths. Therefore, the endpoint of this modeling was selected to be one thermal well water (BKZK01) and one thermal spring water (WSDR), and the starting point sample was the surface water (XQ) collected this time. Since both geothermal and thermal spring water have varying degrees of mixing of non-geothermal water, the binary mixing model was used to correct the impact of mixing. The calculation method is as follows (6):
C o n m i x = C o n D ( 1 f c ) + C o n C f c
where Conmix denotes the chemical constituents after thermal water mixing with cold water; ConD and ConC denote the chemical constituents of geothermal water and non-geothermal water before mixing, respectively; and fc denotes the mixing ratio of non-geothermal water (BKZK01:69%; WSDR:61%). The non-geothermal water constituent is the surface water sample (XQ), and the corrected geothermal hydrochemical constituent results are shown in Table 6.
According to the geological conditions and rock mineral constitution of Zuogong County, the reactant minerals of this inverse simulation model were determined to be albite, K-feldspar, clinochlore, kaolinite, muscovite, quartz, calcite, gypsum, halite, celestite, and fluorite. In addition, CO2 (g) was added to balance the dissolution equilibrium of carbonate minerals in geothermal water. The uncertainty of the model was set to 0.06 and 0.05. Based on the rock mineral constitution characteristics and the reaction characteristics of aluminosilicate minerals, an appropriate reaction path was selected from the model’s simulation results. The quantitative simulation results of the interaction between geothermal water samples in the study area are shown in Table 7.
The results of the inverse simulation model showed that during the runoff of thermal well water and thermal spring water, albite, fluorite, celestite, and halite were all dissolved, while calcite and clinochlore were precipitated. Compared with thermal spring water exposed on the surface, aluminosilicate minerals in geothermal water are primarily saturated during deep runoff.
The amount of calcite precipitation and albite dissolution in thermal well water was higher than in thermal spring water, showing that the Na+ concentration in thermal well water was much higher than the Ca2+ concentration. Thermal spring water mixed with non-geothermal water during the upwelling process caused some calcite to be redissolved into the water; thus, the Ca2+ concentration in thermal spring water was higher than that in thermal well water. In addition, the gypsum dissolution process occurs in thermal spring water, and the gypsum minerals in thermal well water do not participate in this reaction. This shows that the SO42− content in thermal spring water originates from the dissolution of sulfate minerals in the shallow parts of the earth’s surface.
Quartz dissolved in thermal well water but precipitated in thermal spring water. It indicates that the cooling of thermal spring water during the upwelling process and the mixing of non-geothermal water lead to the re-precipitation of quartz. Celestite and fluorite were dissolved in thermal well water and spring water, indicating that the fluorine and strontium in geothermal water come from the dissolution of fluorite, celestite, and other minerals rich in fluorine and strontium.

5.5. Geothermal Conceptual Model

Based on the above analysis, atmospheric precipitation and glacial meltwater in the Zuogong area enter the deep stratum along the deep fault structure, receive heating from high-temperature surrounding rocks during the deep circulation process, and form thermal water of 120 to 176 °C in the deep layer. During the runoff process, deep thermal water experiences 58 to 79% non-geothermal water mixing during upwelling along different secondary structural fracture zones, forming a shallow thermal reservoir at 62 to 98 °C near or exposed to the surface. Thermal springs are formed in the valley stage area. The water–rock interaction with surrounding rocks during the runoff process is the main source of salt for geothermal water, creating deep geothermal water of HCO3-Na. During the process of thermal springs exposed on the surface, it dissolves and leaches with shallow sulfate minerals to form HCO3-Na., HCO3·SO4-Na·Ca, and HCO3·SO4-Ca·Mg geothermal water. The presumptive geothermal genetic model is shown in Figure 12.

6. Conclusions

By analyzing the chemical constituents of 19 groups of water samples in Zuogong County, the hydrochemistry of thermal well water in geothermal water is all HCO3-Na type, and the thermal spring water is mainly HCO3 and HCO3·SO4 water. Non-geothermal water is all HCO3 water. According to the correlation between the TDS water sample and water chemical elements, the analysis of the anion ternary diagram and geothermal characteristic ion content (F, Li, B, and As) shows that the geothermal water in Zuogong County has no magmatic heat source, and the salt in the water sample comes from water–rock interaction. Near the atmospheric precipitation line of geothermal water hydrogen and oxygen stable isotopes, the calculated δD recharge altitude is 3897–5014 m. Analysis shows that geothermal water recharge sources are atmospheric precipitation and glacier meltwater from the surrounding mountainous areas.
Cation thermometer, silica thermometer, multicomponent equilibrium method, and silica-enthalpy mixing model have been used to comprehensively calculate the thermal reservoir temperature in the Zuogong area. Comprehensive analysis shows that geothermal resources have two sets of reservoir temperatures before and after cold water mixing: the thermal reservoir temperature after shallow cold water mixing (62–98 °C) and the thermal reservoir temperature before deep cold water mixing (120–176 °C). On this basis, the shallow circulation depth of the thermal reservoir is calculated to be between 1659 and 2687 m, and the deep circulation depth is between 3316 and 4916 m.
The geothermal water samples are all distributed in the immature water area in the Na-K-Mg diagram, indicating that the geothermal water is in a relatively open thermal reservoir environment with a shorter runoff path and a faster renewal rate. Inverse simulation models of water–rock interaction have been established for thermal well water and spring water, respectively. The results show that the water–rock interaction in deep geothermal water is dominated by mineral dissolution and precipitation of aluminosilicates. During the upwelling process of geothermal water, quartz precipitates from the water due to the mixing of non-geothermal water and the cooling effects, while carbonate minerals dissolve again into the water, causing the Ca2+ content in shallow water to increase. The water–rock interaction of sulfate minerals only exists in shallow areas. The dissolution of minerals such as fluorite and celestite is the source of characteristic ions in geothermal water.

Author Contributions

Methodology, S.H. and D.N.; formal analysis, S.H.; investigation, H.Z. and P.X.; resources, Z.L.; data curation, C.B. and N.G.; writing—original draft, S.H. and D.N.; writing—review and editing, S.H. and Y.Z.; supervision, Z.L. All authors have read and agreed to the published version of the manuscript.

Funding

This research was funded by the Key R&D Program of the Tibet Autonomous Region of China (No. XZ202301ZY0042G and No. XZ202101ZY0008G), Local Program guided by the Central Government of the Tibet Autonomous Region of China (No. XZ202201YD0029C and No. XZ202401YD0030), the National Natural Science Foundation of China (No. 41502220), the Natural Science Foundation Programs of Tibet Autonomous Region of China (No. XZ2019ZRG-158, No. XZ202001ZR0026G, and No. XZ202001ZR0044G), Open Program of Laboratory of Deep Earth Sciences and Technology of the Ministry of Natural Resources of the People’s Republic of China (SinoProbe Laboratory) (SinoProbe Lab 202216), and the College Students’ innovation and entrepreneurship training program (202110077017, S202210077013, and S202310077034).

Data Availability Statement

All data analyzed in this study are available from the corresponding authors upon reasonable request.

Acknowledgments

We thank the two anonymous reviewers for their thoughtful comments.

Conflicts of Interest

The authors declare no conflicts of interest.

References

  1. Wang, G.L.; Lin, W.J. Main hydro-geothermal systems and their genetic models in China. Acta Geol. Sin. 2020, 94, 1923–1937. (In Chinese) [Google Scholar]
  2. Yang, B.; Li, W.; Xiong, J.; Yang, J.; Huang, R.; Xie, P. Health Risk Assessment of Heavy Metals in Soil of Lalu Wetland Based on Monte Carlo Simulation and ACPS-MLR. Water 2023, 15, 4223. [Google Scholar] [CrossRef]
  3. Hu, Z.; Xu, T.; Feng, B.; Yuan, Y.; Li, F.; Feng, G.; Jiang, Z. Thermal and Fluid Processes in a Closed-Loop Geothermal System Using CO2 as a Working Fluid. Renew. Energy 2020, 154, 351–367. [Google Scholar] [CrossRef]
  4. Wang, J.; Pang, Z.; Cheng, Y.; Huang, Y.; Jiang, G.; Lu, Z.; Kong, Y. Current state, utilization and prospective of global geothermal energy. Sci. Technol. Rev. 2023, 41, 5–11. [Google Scholar]
  5. Tong, W.; Zhang, M.T.; Zhang, Z.F.; Liao, Z.J.; You, M.Z.; Zhu, M.X.; Guo, J.Y.; Liu, S.B. Geothermy in Xizang; Science Press: Beijing, China, 1981. [Google Scholar]
  6. Zheng, S.H.; Zhang, Z.F.; Ni, B.L.; Hou, F.G.; Shen, M.Z. Hydrogen-oxygen stable isotope study of geothermal water in Xizang. Acta Sci. Nat. Univ. Pekin. 1982, 1, 99–106. (In Chinese) [Google Scholar]
  7. Li, Z.Q. Present Hydrothermal Activities during Collisional Orogenics of the Tibetan Plateau; Chinese Academy of Geologecal Sciences: Beijing, China, 2002. [Google Scholar]
  8. Zhao, P.; Xie, E.J.; Dor, J.; Jin, J.; Hu, X.C.; Du, S.P.; Yao, Z.H. Geochemical characteristics of geothermal gases and their geological implications in Tibet. Acta Petrol. Sin. 2002, 18, 539–550. [Google Scholar]
  9. Klemperer, S.L.; Zhao, P.; Whyte, C.J.; Thomas, H.; Laura, J.; Karl, E.; Liu, T.Z.; Carmen, W.; David, R.; Ding, L. Limited underthrusting of India below Tibet: 3He/4He analysis of thermal springs locates the mantle suture in continental collision. Proc. Natl. Acad. Sci. USA 2022, 119, e2113877119. [Google Scholar] [CrossRef]
  10. Hao, Y.L.; Kuang, X.X.; Feng, Y.Q.; Wang, Y.C.; Zhou, H.; Zheng, C.M. Discovery and genesis of helium-rich geothermal fluids along the India–Asia continental convergent margin. Geochim. Cosmochim. Acta 2023, 360, 175–191. [Google Scholar] [CrossRef]
  11. Mao, X.M.; Zhu, D.B.; Innocent, N.; He, Y.Y.; Shi, Z.D. The mechanism of high-salinity thermal groundwater in Xinzhou geothermal field, South China: Insight from water chemistry and stable isotopes. J. Hydrol. 2021, 593, 125889. [Google Scholar] [CrossRef]
  12. Davraz, A.; Nalbantçılar, M.; Varol, S.; Önden, İ. Hydrogeochemistry and reservoir characterization of the Konya geothermal fields, Central Anatolia/Turkey. Geochemistry 2022, 82, 125867. [Google Scholar] [CrossRef]
  13. Saibi, H.; Joseph, F.B.; Carlos, P. Hydrochemistry and geothermometry of thermal waters from UAE and their energetic potential assessment. Geothermics 2021, 92, 102061. [Google Scholar] [CrossRef]
  14. Zhang, Y.; Yao, R.; Deng, C.; Huang, X.; Lv, G.; Li, X.; Wang, Y. Genetic mechanism of geothermal water in the sandstone reservoir of western Sichuan, SW China: Evidence from hydrochemistry and δD−δ18O isotopes. Ore Geol. Rev. 2024, 167, 105994. [Google Scholar] [CrossRef]
  15. Craig, H. Standards for reporting concentrations of deuterium and oxygen-18 in natural waters. Science 1961, 133, 1833–1834. [Google Scholar] [CrossRef]
  16. Li, Y.M.; Luo, J.; Chen, K.; Huang, T.M.; Tian, J.; Cheng, Y.Z. Genesis of geothermal fluid with high fluorine content and reservoir temperature assessment in Fengliang geothermal field, eastern Guangdong. Geol. Rev. 2023, 69, 1337–1348. (In Chinese) [Google Scholar]
  17. Fournier, R.O. Chemical geothermometers and mixing models for geothermal systems. Geothermics 1977, 5, 41–50. [Google Scholar] [CrossRef]
  18. Arnórsson, S.; Gunnlaugss, E.; Svavarsson, H. The chemistry of geothermal waters in Iceland. III. Chemical geothermometry in geothermal investigations. Geochim. Cosmochim. Acta 1983, 47, 567–577. [Google Scholar] [CrossRef]
  19. Fournier, R.O.; Potter, R.W. Magnesium correction to the Na-K-Ca chemical geothermometer. Geochim. Cosmochim. Acta 1979, 43, 1543–1550. [Google Scholar] [CrossRef]
  20. Giggenbach, W.F. Geothermal solute equilibria-derivation of Na-K-Mg-Ca geoindicators. Geochim. Cosmochim. Acta 1988, 52, 2749–2765. [Google Scholar] [CrossRef]
  21. Kharaka, Y.K.; Lico, M.S.; Law, L.M. Chemical geothermometers applied to formation waters, Gulf of Mexico and California basins. AAPG Bull. 1982, 66, 588. [Google Scholar]
  22. Fournier, R.O.; Truesdell, A.H. Empirical Na-K-Ca geothermometer for natural waters. Geochim. Cosmochim. Acta 1973, 37, 1255–1275. [Google Scholar] [CrossRef]
  23. Lang, X.J.; Lin, W.J.; Liu, Z.M.; Xing, L.X.; Wang, G.L. Hydrochemical Characteristics of Geothermal Water in Guide Basin. Earth Sci. 2016, 41, 1723–1734. (In Chinese) [Google Scholar]
  24. Luo, M.; Ren, R.; Yuan, W. Type, distribution and genesis of geothermal resource in Sichuan. Acta Geol. Sichuan 2016, 361, 47–50. (In Chinese) [Google Scholar]
  25. Guo, N.; Liu, Z.; Nan, D.W.; Sun, H.X.; Li, H.T.; Zhao, H.H. Characteristics and reservoir temperatures of hot springs in Jueyong, Chamdo, Xizang (Tibet). Geol. Rev. 2020, 66, 499–509. [Google Scholar]
  26. Cao, R.; Dor, J.; Cai, Y.Q.; Chen, X.L.; Mao, X.; Meng, H. Geochemical and H–O–Sr–B isotope signatures of Yangyi geothermal fields: Implications for the evolution of thermal fluids in fracture-controlled type geothermal system, Tibet, China. Geotherm. Energy 2023, 11, 23. [Google Scholar] [CrossRef]
  27. Dai, W. The Hydrogeochemical Characteristics and the Evolution of Geothermal Water in Guide Area, Qinghai. Master’s Thesis, China University of Geosciences (Beijing), Beijing, China, 2020. [Google Scholar]
  28. Zhang, H.X.; Wang, G.L.; Zhang, W.; Ma, F.; Zhu, X.; Yue, G.F.; Yu, M.X. Characteristics of the Rongcheng Bulge Geothermal Field and the Evolution of Geothermal Fluids, Xiong’an New Area, China. Water 2022, 14, 2468. [Google Scholar] [CrossRef]
  29. Yu, J.S. Research on Isotopic Geochemistry in China; Science Press: Beijing, China, 1997. [Google Scholar]
  30. Zheng, X.H.; Duan, C.Y.; Xia, B.R.; Jiang, Y.; Wen, J. Hydrogeochemical modeling of the shallow thermal water evolution in Yangbajing geothermal field, Tibet. J. Earth Sci. 2019, 30, 870–878. [Google Scholar] [CrossRef]
  31. Wang, X.; Wang, G.L.; Lu, C.; Gan, H.N.; Liu, Z. Evolution of deep parent fluids of geothermal fields in the Nimu–Nagchu geothermal belt, Tibet, China. Geothermics 2018, 71, 118–131. [Google Scholar] [CrossRef]
  32. Yuan, J.; Guo, Q.; Wang, Y. Geochemical behaviors of boron and its isotopes in aqueous environment of the Yangbajing and Yangyi geothermal fields, Tibet, China. J. Geochem. Explor. 2014, 140, 11–22. [Google Scholar] [CrossRef]
  33. Guo, Q.H.; Wang, Y.X.; Liu, W. Major hydrogeochemical processes in the two reservoirs of the Yangbajing geothermal field, Tibet, China. J. Volcanol. Geotherm. Res. 2007, 166, 255–268. [Google Scholar] [CrossRef]
  34. Liao, Z.J.; Zhao, P. Yunnan−Tibet Geothermal Belt−Geothermal Resources and Case Histories; Science Press: Beijing, China, 1999. [Google Scholar]
  35. Wang, G.L.; Liu, F.; Lin, W.J.; Zhang, W.; Yuan, R.X.; Xi, Y.F.; Wei, S.C.; Liao, Y.Z.; Wang, Y.R. The crustal heat production rate and crustal and mantle heat flow distribution in the land areas of China. Chin. J. Feophysics 2023, 66, 5041–5056. (In Chinese) [Google Scholar]
  36. Guo, Q.H.; Liu, M.L.; Li, J.X.; Zhang, A.B.; Wang, Y.X. Acid hot springs discharged from the Rehai hydrothermal system of the Tengchong volcanic area (China): Formed via magmatic fluid absorption or geothermal steam heating? Bull. Volcanol. 2014, 76, 868. [Google Scholar] [CrossRef]
  37. Guo, Q.H.; Nordstrom, D.K.; McCleskey, R.B. Towards understanding the puzzling lack of acid geothermal springs in Tibet (China): Insight from a comparison with Yellowstone (USA) and some active volcanic hydrothermal systems. J. Volcanol. Geotherm. Res. 2014, 288, 94–104. [Google Scholar] [CrossRef]
  38. Tong, W. Thermal Springs in Tibet; Science Press: Beijing, China, 2000. [Google Scholar]
  39. Tian, J.; Pang, Z.; Guo, Q.; Wang, Y.C.; Huang, T.M.; Kong, Y.L. Geochemistry of geothermal fluids with implications on the sources of water and heat recharge to the Rekeng high-temperature geothermal system in the Eastern Himalayan Syntax. Geothermics 2018, 74, 92–105. [Google Scholar] [CrossRef]
  40. Fan, Y.F.; Pang, Z.H.; Liao, D.W.; Tian, J.; Hao, Y.L.; Huang, T.M.; Li, Y.M. Hydrogeochemical Characteristics and Genesis of Geothermal Water from the Ganzi Geothermal Field, Eastern Tibetan Plateau. Water 2019, 11, 1631. [Google Scholar] [CrossRef]
  41. Fournier, R.O. Water geothermometers applied to geothermal energy. In Application of Geochemistry in Geothermal Reservoir Development; Amore, F.D., Ed.; UNITAR/UNDP: Rome, Italy, 1991. [Google Scholar]
  42. Hai, K. Using Several Methods to Estimate the Temperatures of Deep Geothermal Reservoirs. Master’s Thesis, China University of Geosciences (Beijing), Beijing, China, 2019. [Google Scholar]
  43. Hou, Z.Y.; Xu, T.F.; Li, S.T.; Jiang, Z.J.; Feng, B.; Cao, Y.Q.; Feng, G.H.; Yuan, Y.L.; Hu, Z.X. Reconstruction of different original water chemical compositions and estimation of reservoir temperature from mixed geothermal water using the method of integrated multicomponent geothermometry: A case study of the Gonghe Basin, northeastern Tibetan Plateau, China. Appl. Geochem. 2019, 108, 104389. [Google Scholar]
  44. Wang, C.G.; Zheng, M.P.; Zhang, X.F.; Xing, E.Y.; Ye, C.Y.; Ren, J.H.; Li, M.M.; He, J.T.; Wang, F.X. Hydrochemical characteristics and origins of geothermal fluids in the Gudui high-temperature geothermal system in Comei County, southern Tibet. Acta Geol. Sin. 2024, 98, 558–578. (In Chinese) [Google Scholar]
  45. Sun, H.L.; Ma, F.; Lin, W.J.; Liu, Z.; Wang, G.L.; Nan, D.W. Geochemical Characteristics and Geothermometer Application in High Temperature Geothermal Field in Tibet. Geol. Sci. Technol. Inf. 2015, 34, 171–177. (In Chinese) [Google Scholar]
  46. Pang, Z.H.; Reed, M. Theoretical chemical thermometry on geothermal waters: Problems and methods. Geochim. Cosmochim. Acta 1998, 62, 1083–1091. [Google Scholar] [CrossRef]
  47. Zhao, J.Y.; Wang, G.L.; Zhang, C.Y.; Xing, L.X.; Li, M.; Zhang, W. Genesis of geothermal fluid in typical geothermal fields in Western Sichuan, China. Acta Geol. Sin.-Engl. Ed. 2021, 95, 873–882. [Google Scholar] [CrossRef]
  48. Zhang, Y.H.; Li, X.; Xu, M.; Duo, J.; Wu, X.Y.; Xiao, Y.; Huang, X. Hydrogeochemical Characteristies of Geothermal Waters in the DaofuArea of the Xianshuihe Geothermal Belt. Saf. Environ. Eng. 2021, 28, 42–51. (In Chinese) [Google Scholar]
  49. Zhang, W.; Wang, G.L.; Zhao, J.Y.; Liu, F. Geochemical Characteristics of Medium-high Temperature Geothermal Fluids in West Sichuan and Their Geological Implications. Geoscinece 2021, 35, 188–198. (In Chinese) [Google Scholar]
  50. Cui, Y.; Kang, F.X.; Zhong, Z.N.; Yang, X.C.; Sui, H.P.; Zhao, Q. Gas Isotope Constraints on the Geothermal Heat Source Mechanism in Northwest Shandong Plain, China. Acta Geosci. Sin. 2022, 44, 113–121. [Google Scholar]
  51. Ma, Z.Y.; Yu, J.; Li, Q.; Wang, X.G.; Li, F.; Mu, G.X.; Hu, Y.; Jia, X.B.; Li, W.L. Environmental Isotope Distribution and Hydrologic Geologic Sense of Guanzhong Basin Geothermal Water. J. Earth Sci. Environ. 2008, 30, 396–401. (In Chinese) [Google Scholar]
  52. Wang, S.Q. Hydrogeochemical Processes and Genesis Mechanism of High-Temperature Geothermal System in Gudui, Tibet. Ph.D. Thesis, China University of Geosciences (Beijing), Beijing, China, 2017. [Google Scholar]
  53. Wang, X.; Wang, G.L.; Gan, H.N.; Liu, N.; Nan, D.W.; Liu, Z. Genetic mechanisms of sinter deposit zones in the Yangyi geothermal field, Tibet: Evidence from the hydrochemistry of geothermal fluid. Geothermics 2022, 103, 102408. [Google Scholar] [CrossRef]
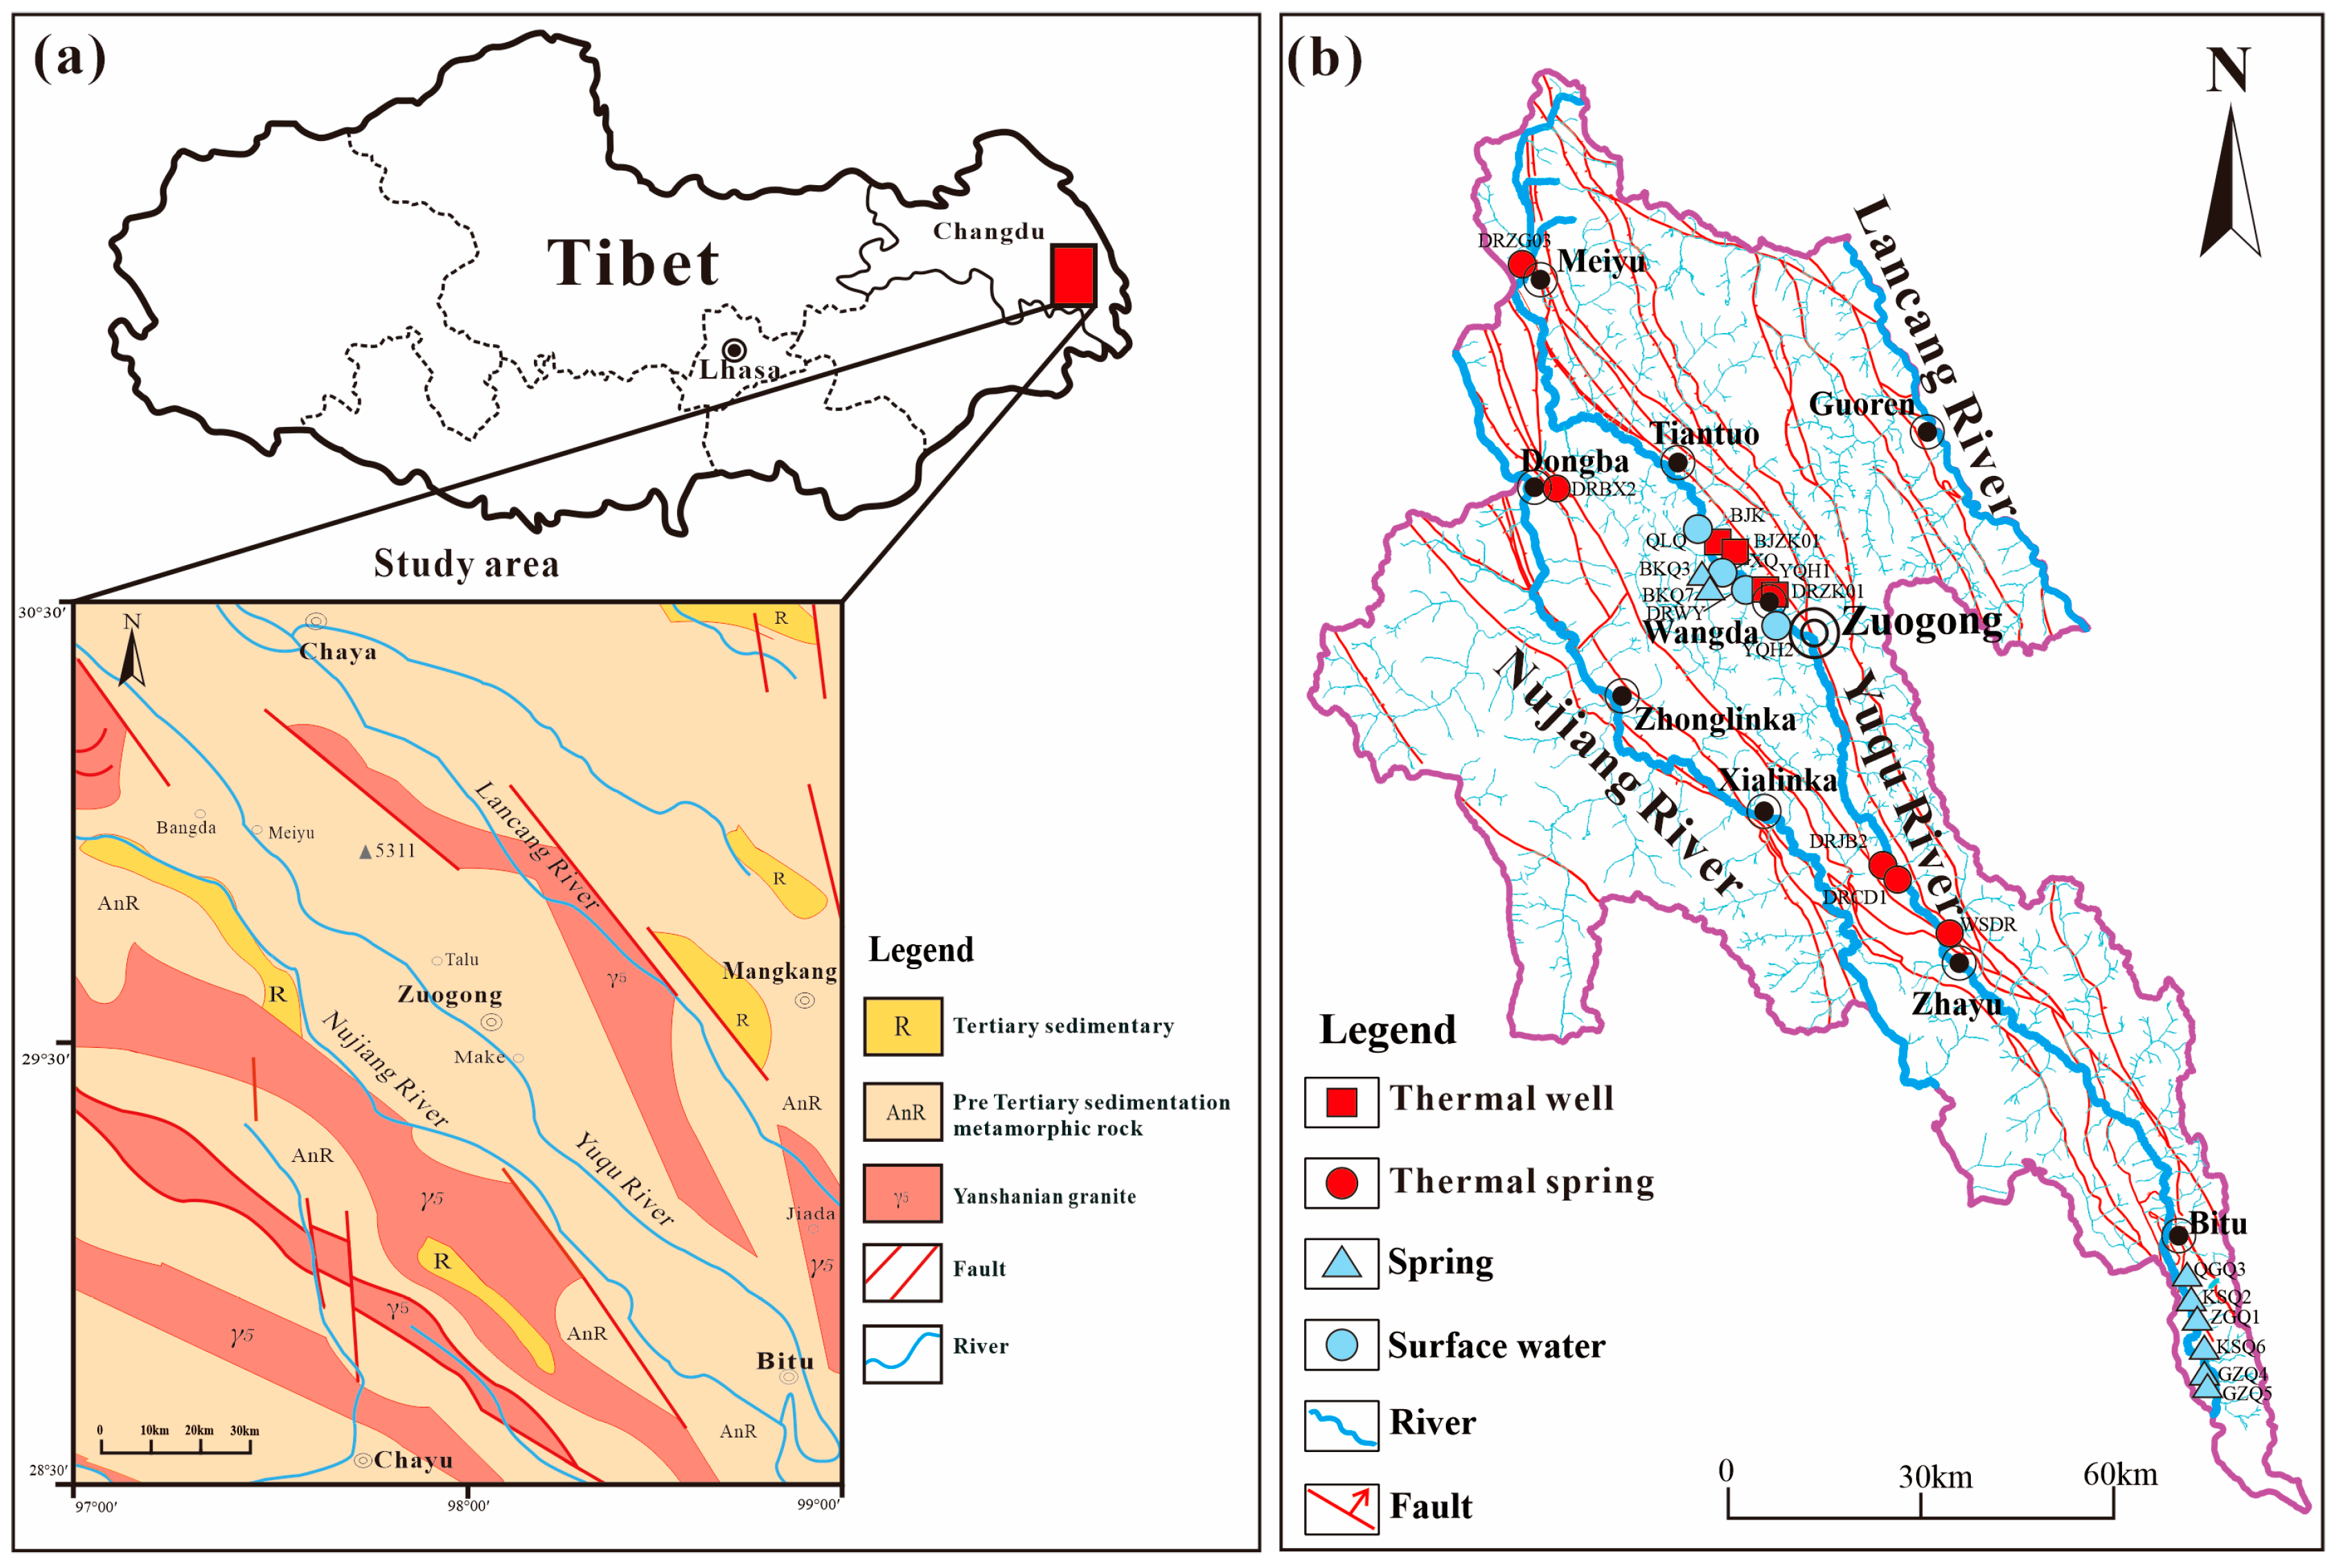
Figure 1. (a) Geological diagram of Zuogong County, Tibet. (b) Sampling location diagram of Zuogong County, Tibet.
Water 16 02852 g001
Figure 2. Piper diagram of thermal groundwater and non-thermal groundwater from Zuogong County, Tibet.
Water 16 02852 g002
Figure 3. The correlations of TDS vs. main anions and cations in thermal groundwater and non-thermal groundwater from Zuogong County, Tibet.
Water 16 02852 g003
Figure 4. The correlations of TDS vs. typical geothermal components in thermal groundwater and non-thermal groundwater from Zuogong County, Tibet.
Water 16 02852 g004
Figure 5. Cl–SO4–HCO3 ternary diagram for the water samples in Zuogong County, Tibet.
Water 16 02852 g005
Figure 6. Box diagram of F, Li, B, and As components in geothermal water from Rehai, Yangbajing, and Zuogong.
Water 16 02852 g006
Figure 7. Box plots for measuring and estimating temperature. (Note: MEE: multicomponent mineral equilibrium; SEMM: silica-enthalpy mixing model).
Water 16 02852 g007
Figure 8. Saturation indices (SIs) vs. temperature to estimate reservoir temperature for four thermal wells and five thermal springs.
Water 16 02852 g008
Figure 9. Si-enthalpy of the thermal reservoir from the Zuogong, Tibet.
Water 16 02852 g009
Figure 10. The δD-δ18O relationship of groundwater in Zuogong County, Tibet.
Water 16 02852 g010
Figure 11. Na-K-Mg ternary diagram for the water samples in Zuogong County, Tibet.
Water 16 02852 g011
Figure 12. Conceptual model of geothermal genesis in Zuogong County, Tibet.
Water 16 02852 g012
Table 1. Hydrochemical and isotopic characteristics of geothermal sampling water in Zuogong County, Tibet.
Sample IDElevationTemperaturepHNaKCaMgHCO3CO3ClSO4
m°C mg/L
BKJthermal well3866716.85388.127.917.857.851105.00029.97BKJ
BKZK01thermal well3899517.04385.424.7822.659.011080.00026.87BKZK01
WYDR4thermal well3826717.41365.816.9232.684.131034.00023.38WYDR4
WYZK01thermal well707.06357.716.433.385.241007.00024.0922.63
DRZG3thermal spring4091557.34596.837.3274.5612.481313065.84DRZG3
DRBX2thermal spring3359347.9520.091.463.0518.06277.1001.99DRBX2
DRCD1thermal spring3558398.1885.955.9352.067.41268.158.655.94DRCD1
DBJB2thermal spring587.170.558.295.6521.67432.20014.0578.26
WSDRthermal spring3424637.95147.7311.3920.37.62365.96011.89WSDR
ZGQ1spring3850227.6837.373.3277.7516.86346.8004.05ZGQ1
KSQ2spring301388.293.730.2822.631.6568.835.050.53KSQ2
QGQ3spring309478.021.26023.552.671.1100.01QGQ3
GZQ4spring269788.30.550.823.580.871.025.770.01GZQ4
GZQ5spring381878.20.761.2626.30.7175.435.050.01GZQ5
KSQ6spring2932118.242.120.1544.3510.5112.882.880.39KSQ6
BKQ7spring4058n.an.an.an.an.an.an.an.an.aBKQ7
BKQ3spring3905n.an.an.an.an.an.an.an.an.aBKQ3
QLQsurface water389087.82.750.8419.369.97108.4000.41QLQ
XQsurface water388088.143.190.5520.9613.18123.993.590.16XQ
YQH1surface water381828.555.040.7338.1812.19144.2910.090.66YQH1
YQH2surface water381528.584.660.6440.5412.62143.5411.541.8YQH2
Sample IDNO3SiO2BFLiSrAsTDSδDδ18OTypes of hydrochemistry
mg/Lug/Lmg/L
BKJthermal well1.1266.797.497.421.320.73n.d1673−160−19.5BKJ
BKZK01thermal welln.d50.377.806.951.480.87n.d1598n.an.aBKZK01
WYDR4thermal well2.370.143.443.770.881.380.71439−165−21WYDR4
WYZK01thermal welln.d76.724.253.150.941.23n.d1519n.an.aWYZK01
DRZG3thermal spring2.4246.898.417.372.962.1511302627−159−19.2DRZG3
DRBX2thermal spring1.4524.150.170.990.060.426415.6−149−19.9DRBX2
DRCD1thermal spring1.0945.390.934.780.290.392.7542.3n.an.aDRCD1
DBJB2thermal springn.d62.63n.d4.370.230.85n.d758.1n.an.aDBJB2
WSDRthermal spring0.7759.972.318.040.590.5811.2699n.an.aWSDR
ZGQ1spring2.0412.810.20.350.100.591.6511.9n.an.aZGQ1
KSQ2spring0.749.880.03751.920.00740.1212108.4n.an.aKSQ2
QGQ3spring0.927.73n.d0.840.00650.2113116.1n.an.aQGQ3
GZQ4spring1.357.40.00375n.d0.00580.0983.8105.1n.an.aGZQ4
GZQ5spring1.778.70.002750.0350.00640.12.5115.2n.an.aGZQ5
KSQ6spring1.295.930.007250.480.0161.136223n.an.aKSQ6
BKQ7springn.an.an.an.an.an.an.an.a−138−17.2BKQ7
BKQ3springn.an.an.an.an.an.an.an.a−147−18.2BKQ3
QLQsurface water4.086.450.02150.690.00380.075n.d142.7−136−17.6QLQ
XQsurface water0.947.260.016250.0950.00460.078n.d167.7−134−17.2XQ
YQH1surface water1.747.750.0160.180.0150.121.2223.6n.an.aYQH1
YQH2surface water2.526.50.01650.290.0180.151.1226n.an.aYQH2
Note: “n.d” indicates undetected, and “n.a” indicates not analyzed.
Table 4. Calculated temperatures using selected chemical geothermometers and the estimated reservoir depth.
SampleMeasured
Temperature
abcdefghMEESEMMThermal Circulation Depth
°CAfter
Mixing (m)
Before Mixing (m)
BKJ718790116115190961792169815826874401
BKZK01517277102103182911712259016024594459
WYDR4719092118117159911501958816524014601
WYZK01709596123121158871502009216325164544
DRZG355697499100180971672428914624304059
DRBX23439497175188231212086312016873316
DRCD13967739799187591432166217616594916
DBJB2588487113112230551602148417122874773
WSDR638185110110196741652276615917734430
Note: MEE: multicomponent mineral equilibrium; SEMM: silica-enthalpy mixing model.
Table 5. The calculation results of the thermal circulation depth of Zuogong County, Tibet.
SampleTypeElevation (m)δD (‰)Recharge Altitude (m)
BKJthermal well3866−1604828
WYDR4thermal well3826−1654980
DRZG3thermal spring4091−1595014
DRBX2thermal spring3359−1493897
Table 6. The concentrations of the major constituents of the initial and final members (mg/L).
Flow PathSampleNaKCaMgHCO3 + CO3ClSO4SiFSr
InitialXQ2.750.8419.369.97108.400.415.696.450.0950.078
FinalBKZK011237.1078.0729.976.873242.5985.7652.8261.4922.212.633
InitialXQ2.750.8419.369.97108.400.415.696.450.0950.078
FinalWSDR374.4927.8921.773.95768.8129.85173.1361.6620.471.368
Table 7. Water–rock interaction models along the flow path from surface fluids to deep geothermal fluids in the Zuogong area. Mole transfer in mmol/L; positive numbers indicate dissolution, and negative numbers indicate precipitation.
Flow PathMode ReactantMole TransferFlow PathMode ReactantMole Transfer
Thermal well
(XQ-BKZK01)
Albite4.73 × 10−2Thermal spring
(XQ-WSDR)
Albite1.51 × 10−2
Calcite−3.88 × 10⁻³Calcite−2.18 × 10⁻³
Celestite2.22 × 10−5Celestite1.48 × 10−5
Clinochlore−6.78 × 10⁻⁴Clinochlore−4.94 × 10⁻⁵
Fluorite5.65 × 10−4Fluorite5.37 × 10−4
Halite2.47 × 10−3Gypsum1.73 × 10−3
Kaolinite−4.42 × 10²Halite8.32 × 10−4
K-Feldspar−4.42 × 10²Kaolinite5.90 × 10−2
Muscovite4.42 × 102K-Feldspar6.75 × 10−2
Quartz8.83 × 102Muscovite−6.68 × 10⁻²
CO2(g)4.43 × 10⁻²Quartz−1.64 × 10⁻¹
CO2(g)1.30 × 10⁻²
Disclaimer/Publisher’s Note: The statements, opinions and data contained in all publications are solely those of the individual author(s) and contributor(s) and not of MDPI and/or the editor(s). MDPI and/or the editor(s) disclaim responsibility for any injury to people or property resulting from any ideas, methods, instructions or products referred to in the content.