Abstract
The increasing global nitrogen input poses a significant threat to aquatic environments, particularly in agricultural watersheds, where intensive human activities and insufficient water protection infrastructure exacerbate the risk of nitrogen pollution. Accurate identification of nitrogen pollution sources and the associated transformation processes is essential for protecting watershed ecosystems. In this study, a combination of hydrochemical analysis, correlation and principal component analysis, and stable nitrate isotopes (δ15N-NO3− and δ18O-NO3−) were employed to trace nitrogen transport pathways and source contributions in both surface water and groundwater within a typical agricultural watershed. The results revealed the presence of nitrogen pollution, including total nitrogen (TN), ammonia nitrogen (NH3-N), and nitrate nitrogen (NO3−-N), with significant spatial and seasonal variations in both surface water and groundwater. The spatiotemporal evolution of hydrochemical indicators and nitrate isotope compositions highlighted multiple potential sources of nitrogen, including soil input, agricultural input, and manure and sewage input. The results from stable isotope analysis in an R (SIAR) model indicated that ammonium fertilizers (7.1~78.4%) and manure and sewage (2.6~69.7%) were the primary sources of nitrates in surface water, while manure and sewage were the main sources in groundwater (67.9~73.7%). This research demonstrated that nitrification, seasonal variations, and human activities significantly impact nitrogen migration and transformation in agricultural watersheds. However, the issue of groundwater severely polluted by manure and sewage has received insufficient attention. To effectively control nitrogen pollution in agricultural watersheds, it is necessary to improve septic tanks and sewage networks, as well as implement scientific fertilization practices.
1. Introduction
Nitrate pollution poses a significant threat to both ecosystems and human health, making it a major global concern [1]. Global nitrogen input to streams increased from 34 to 64 Tg/yr over the 20th century [2], while the global estimate of nitrogen retention by lakes is 28.58 Tg/yr [3]. In China, over 14 million tons of nitrogen are discharged into the freshwater systems annually, which is 2.7 times the safe discharge threshold [4,5]. The nitrogen content in many natural waters significantly exceeds Chinese environmental quality standards (1.0 mg/L) [6]. For instance, the nitrogen content is 1.2–9.1 mg/L in the Taihu Lake basin [7], 1.3–6.0 mg/L in Chaohu Lake [8], and 0.4–4.5 mg/L in Poyang Lake [9]. Nitrate is one of the major forms of nitrogen in water. Excessive intake of nitrates can lead to methemoglobinemia, hypertension, and an increased risk of cancer [10]. Furthermore, high nitrate levels contribute to the eutrophication of aquatic ecosystems, adversely affecting the survival of aquatic organisms [11].
Nitrate in natural waters comes from diverse sources, including atmospheric deposition, soil nitrogen, chemical fertilizers, manure, domestic sewage, and industrial wastewater [12]. More importantly, once nitrate enters the aquatic environment, it experiences various biogeochemical processes, such as assimilation, nitrification, and denitrification [13]. Consequently, the complexity of sources and transformation processes has become a significant challenge in controlling nitrogen pollution in natural waters. Therefore, it is crucial to quantitatively assess the contributions of various nitrate sources and to identify the transformation processes, with the goals of reducing nitrate input, preventing nitrate pollution, and ultimately ensuring the protection of water resources.
Previous studies have proposed various methods for tracing nitrate sources in natural waters, including hydrochemical analysis, statistical approaches, microbial composition studies, stable isotope analysis, and combinations of these techniques [1,14]. However, the diversity of nitrate sources and the complexity of nitrate transformations introduce a high degree of uncertainty in drawing definite conclusions [10]. Compared to traditional methods, the analysis of the NO3− stable isotope, including δ15N-NO3− and δ18O-NO3−, can provide meaningful insight into nitrate sources and transformation processes. This approach has been successfully applied to identify potential sources and biogeochemical processes in natural waters [15,16,17].
Specific δ15N-NO3− values for various nitrate sources have been established; atmospheric deposition ranges from −13‰ to +13‰ [18], soil organic nitrogen ranges from −3‰ to +8‰ [19], nitrate fertilizer ranges from −6‰ to +6‰ [18], ammonium fertilizer ranges from −10‰ to +5‰, and manure/domestic sewage ranges from +7‰ to +20‰ [20]. In addition, δ18O-NO3− values for atmospheric nitrate range from +58‰ to +80‰, while those for soil organic nitrogen range from +0.8‰ to +5.8‰ [21,22]. These isotope values not only clearly identify the sources of nitrate but also reveal the associated transformation processes. For example, denitrification will lead to an enrichment of δ15N-NO3− and δ18O-NO3− in residual nitrate, resulting in the ratios ranging from 1:1.3 to 1:2.1 [10].
Furthermore, the Bayesian isotope mixing model SIAR (stable isotope analysis in R) was developed to calculate the proportional contributions of different sources [23]. Currently, the SIAR model has been widely used to identify the source of nitrate in water. For example, Ji et al. (2022) used δ15N-NO3−, δ18O-NO3−, and the SIAR model to confirm municipal sewage as the primary nitrate source in a rural–urban river network [24]. Cao et al. (2022) estimated the contributions of various nitrate sources and elucidated the nitrogen transformation mechanisms in the Quanshui River watershed by integrating multiple isotopes, hydrochemical data, and the SIAR model [25]. With the help of hydrochemistry and isotope tracers, a clearer understanding of the sources, migration, and transformation processes of nitrogen in aquatic environments can be obtained. This knowledge provides essential theoretical support for the prevention and control of water eutrophication.
Wangmu Lake is situated in a typical agricultural watershed, where villages and cropland are scattered and intermingled. Runoff, groundwater, and tributary water all contribute to the lake water recharge, posing a potential threat to its ecological safety. Investigation and monitoring have revealed serious nitrogen pollution in this area. Although the government has implemented various pollution prevention and control measures, such as strictly controlling the discharge of domestic sewage and industrial wastewater, the water quality of Wangmu Lake has improved significantly but still struggles to consistently meet standards [26]. To better improve the water quality of Wangmu Lake and provide more evidence for pollution prevention in similar areas, it is urgent to identify the nitrogen pollution sources of this typical agricultural watershed and develop more effective measures.
Given these considerations, this study collected samples of lake water, groundwater, and tributary water near Wangmu Lake. Hydrochemical indicators and nitrate stable isotope were measured, and multiple methods including hydrochemical analysis, multivariate statistical analysis, and the isotope tracing method were employed. The main objectives of this study were to (1) investigate the spatial distribution of nitrate and isotope compositions in surface water and groundwater, (2) identify potential nitrate sources and quantify their contributions, and (3) elucidate the key processes involved in nitrogen cycling. This study aims to provide theoretical support for nitrogen pollution control in typical mixed-land-use areas in city boundaries.
2. Materials and Methods
2.1. Study Area
Wangmu Lake, situated near the Yangtze River, is an important wetland conservation area in the Hubei Province of China. As an auxiliary regulating and water storage lake in the 630-square-kilometer Fuhuan River Basin, Wangmu Lake plays a vital role in flood control, agricultural irrigation, preserving the aquatic gene pool, and enhancing the ecological landscape. The lake covers an area of 16 km2, with inflows from the Dengjia River and the Xicha River. The lake water flows from north to south, joining the Fuhuan River, and eventually merging into the Yangtze River. The study area experiences a subtropical continental monsoon climate with distinct seasons and abundant rainfall. The annual precipitation ranges from 1040 to 1230 mm, with 70% of the rainfall occurring between April and September, peaking in July, and reaching its minimum in December.
Geologically, Wangmu Lake is situated at the northern edge of the Jianghan Basin, where the regional lithology is relatively simple, predominantly consisting of Holocene alluvial–lacustrine deposits (Qhzl-al) with a distinct binary structure (Figure 1). These deposits mainly consist of clay, silty clay, and sandy gravel, with quartz and clay minerals as the dominant mineral components. Exposed on both sides of the lake is the Middle Pleistocene Wangjiadian Formation (Qp2w), which serves as a relatively impermeable layer. The primary aquifer in the study area is composed of fine-to-medium sandstone and gravelly sandstone of the Neogene Duodaoshi Formation (Nd), with depths ranging between 14.5 and 32.4 m. Groundwater in this region is primarily recharged from precipitation and upstream surface water and is discharged through artificial pumping or naturally flows into Wangmu Lake.
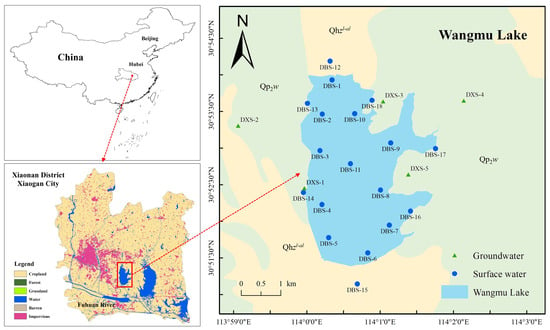
Figure 1.
Locations of the study area and the distribution of sampling sites.
2.2. Sample Collection
Sampling sites for surface water were evenly distributed across various areas of Wangmu Lake, including the inflow area, outflow area, lake area, and shoreline area. Groundwater samples were collected from available wells around Wangmu Lake. In total, 18 surface water samples were collected, with 11 located within Wangmu Lake and 7 positioned at nearby drainage outlets and upstream/downstream areas. Additionally, five wells were designated for groundwater sampling. The locations of the sampling sites are illustrated in Figure 1. Samples were collected in November 2022, May 2023, and September 2023. Considering the relationship between the sampling times and the flood season in the study area, the three sampling periods can be regarded as the dry season, transitional season, and wet season, respectively.
Samples of 2 L were collected 0.5 m below the water surface. The water samples collected on-site were divided into aliquots, with different pretreatment methods applied based on the specific test indicators. For cation analysis, 2% nitric acid (Sinopharm Chemical Reagent Co. Ltd., Shanghai, China) was added on site for acidification and preservation. No filtration was performed for samples tested for chlorophyll-a (Chl-a) and total nitrogen (TN). For all other tests, 0.45 μm microporous membrane filtration was used on site. In situ measurements were conducted for pH, redox potential (Eh), electrical conductivity (EC), and dissolved oxygen (DO). Following collection and pretreatment, the samples were stored in refrigerated containers at temperatures below 5 °C and promptly transported to the laboratory for analysis.
2.3. Physiochemical Parameters and Isotope Analysis
Chemical oxygen demand (COD) was measured using the dichromate method. Chlorophyll-a was measured using the hot ethanol extraction–spectrophotometric method. Total nitrogen was measured using the alkaline persulfate digestion–ultraviolet spectrophotometric method, and ammonia nitrogen (NH3-N) was measured using the Nessler reagent spectrophotometric method. Anion and cation concentrations were detected by ion chromatography (IC, ICS-1100, DIONEX, Sunnyvale, CA, USA) and an atomic absorption spectrophotometer (AAS, WFX-210, Beijing Rayleigh, Beijing, China). All of the tests mentioned above were conducted in accordance with the relevant industry standards established by the Ministry of Ecology and Environment of China. Detailed information is provided in Table S1. HCO3− concentration was determined by titration within 24 h [27]. Nitrate stable isotopes (δ15N-NO3− and δ18O-NO3−) were determined using the bacterial denitrifier method [28]. The analysis was performed with isotope ratio mass spectrometry (IRMS, MAT 253, Thermo Fisher, Waltham, MA, USA) at the Third Institute of Oceanography, Ministry of Natural Resources, China.
To ensure the accuracy and precision of the measurement results, duplicate analyses were performed on 10% of the samples, and standard samples were analyzed, with spike recovery rates ranging between 85% and 115%. All sample analysis errors were maintained below 10%, thereby meeting the quality control standards. For δ15N-NO3− and δ18O-NO3−, two calibrated standards, USGS-34 and USGS-32, were used for normalization, and the quality control of the analysis had a standard deviation of less than 0.5‰.
2.4. Bayesian Isotope Mixing Model
The SIAR model was employed to estimate the relative contributions of various nitrate sources, and the basic algorithm can be expressed as follows [23].
where Xij represents the value of the j-th isotope in the i-th mixture from different sources, where i = 1, 2, 3, …, N and j = 1, 2, 3, …, J. Sjk represents the value of the j-th isotope in the k-th pollution source, where k = 1, 2, 3, …, K; both the mean μjk and the standard deviation ωjk follow a normal distribution. pk represents the contribution proportion of the k-th source among the pollution sources. Cjk represents the fractionation factor of the j-th isotope in the k-th source; both the mean λjk and the standard deviation τjk follow a normal distribution. εij represents the residual error, accounting for the indeterminate variables between different individual mixtures.
2.5. Statistical Analysis
Pearson’s correlation analysis was performed to assess the relationships between hydrochemical indicators and nitrogen concentrations in surface water and groundwater across different seasons. Principal component analysis (PCA) was also used to qualitatively identify the potential sources of nitrogen in the surface water and groundwater.
3. Results
3.1. Hydrochemical Parameters
Table 1 presents the statistical characteristics of hydrochemical parameters in surface water and groundwater samples. The pH of the surface water ranged from neutral to slightly alkaline (6.97 to 8.92), while groundwater was nearly neutral (5.71 to 8.05). The Eh ranges were consistent with the DO concentration, which ranged from 0.97 to 7.25 mg/L and 1.88 to 4.50 mg/L for surface water and groundwater, indicating an oxidizing environment. The average EC of surface water and groundwater was 344 μS/cm and 637 μS/cm, respectively, demonstrating a higher total dissolved solids content in groundwater.

Table 1.
Summary of surface water and groundwater hydrochemistry in Wangmu Lake.
Comparing with the Class III limits of Chinese standards for surface water (GB 3838-2002) [29] and groundwater quality (GB/T 14848-2017) [30] (Table S2), the pollutants exceeding these limits were DO, COD, TN, and NH3-N in surface water, while they were pH, NH3-N, and NO3−-N in groundwater. The similarity of nitrogen pollution indicators in surface water and groundwater implies hydraulic connection. With the changes in seasons, the proportions of sampling sites in surface water exceeding the limits for DO, COD, TN, and NH3-N were 94.44–100%, 55.56–100%, 16.67–33.33%, and a constant 5.56%, respectively. As for groundwater, the proportions for pH, NH3-N, and NO3−-N were a constant 20%, 0–40%, and constant 20%, respectively.
The δ15N-NO3− and δ18O-NO3− values ranged from −16.70‰ to 34.40‰ and from −4.89‰ to 31.43‰ for surface water and from 4.62‰ to 21.10‰ and from −2.11‰ to 8.60‰ for groundwater, respectively. Compared to other water environments globally (Table S3), the N and O isotope variations in surface water within this study area were more pronounced, while those in groundwater were generally similar to other studies. This characteristic suggests that the sources of nitrate in the surface water of this study area are complex and diverse. Seasonal variations significantly influenced isotope abundance ranges, indicating shifts in the source of nitrate. Compared to variable sources of surface water, groundwater was relatively stable in the abundance of nitrate isotopes.
The surface water and groundwater exhibited similar hydrochemical characteristics, with Na+ and Ca2+ as the dominant cations and K+ and Mg2+ as relatively lower concentrations. Among the anions, HCO3− was the most abundant, followed by Cl− and SO42−. The calculated coefficients of variation for these seven major cations and anions, which are not shown here, were all less than 100%, indicating relatively stable quality in the study area.
The Piper diagram is an important tool reflecting hydrochemical characteristics, which is plotted in Figure 2a. From the perspective of cations, 94% samples fell within the no dominant type, with only one surface water sample and two groundwater samples classified as calcium type, and one surface water sample classified as sodium type. For anions, 87% samples belonged to the bicarbonate type, while seven surface water samples and two groundwater samples were classified as no dominant type. According to the Shukarev classification, the surface water in the study area was mainly the HCO3-Na·K·Ca type and the HCO3-Na·K·Ca·Mg type, accounting for 40% and 27%, respectively. Groundwater was primarily the HCO3·Cl-Na·K·Ca type, HCO3-Na·K·Ca type, and HCO3-Na·K·Ca·Mg type, accounting for 41%, 35%, and 15%, respectively. Additionally, ion salinity is an important method for hydrochemical classification [31,32]. As shown in Figure S1, the ion salinity of groundwater was generally higher than that of surface water. Specifically, 96% of the ion salinity in surface water fell within the range of 4–12 meq/L, while the proportion of groundwater with salinity exceeding 12 meq/L reached 33%.
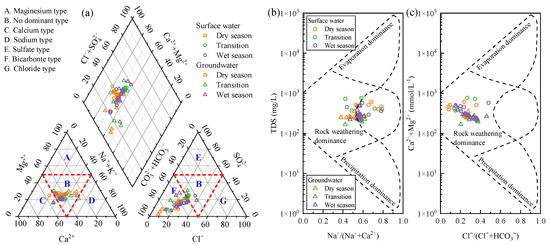
Figure 2.
Piper (a) and Gibbs (b,c) diagrams for surface water and groundwater sampled in the Wangmu Lake.
The Gibbs diagram is widely used to analyze the mechanisms of hydrochemical formation, categorizing the controlling factors of natural water into three types: precipitation dominance, rock weathering dominance, and evaporation dominance [33]. The Gibbs diagrams for the water samples are plotted in Figure 2b,c. All samples fell within the rock weathering dominance area, indicating primary influence by rock weathering.
3.2. Spatiotemporal Variation in N Components
Nitrogen, a major nutrient element in lake water environments, exists in several forms, including NH3-N, NO3−-N, and NO2−-N. The spatiotemporal dynamics of these forms are influenced by various factors, such as precipitation, human activity, and microbial community composition [34,35]. For TN (Figure S2 and Table S4), its spatiotemporal distribution in surface water varied significantly. During the dry season, TN concentrations were higher at the lake inflow sampling site DBS-1 (1.27 mg/L) and the downstream drainage outlet DBS-15 (1.73 mg/L). The concentration at the surrounding sampling site DBS-16 (1.20 mg/L) was also higher than other lake areas. In the transitional season, the concentrations significantly increased at the upstream inflow DBS-12 (2.17 mg/L) and downstream outflow sampling sites DBS-15 (3.18 mg/L), indicating the sources and migration pathways of nitrogen in the lake. In the wet season, high TN concentrations were mainly observed at the outflow sampling site DBS-15 (3.31 mg/L), suggesting that nitrogen was primarily being discharged from the lake at this time. It is noteworthy that the spatiotemporal dynamics of TN are influenced by the combined effects of various nitrogen forms [36]. Therefore, understanding the spatiotemporal evolution of each nitrogen form is crucial for elucidating the spatiotemporal dynamics of TN.
For NH3-N (Figure 3a and Table S4), its spatiotemporal evolution was generally consistent with that of TN, as NH3-N is the primary form of nitrogen in the surface water. Particularly during the dry season, NH3-N accounted for 45.4% to 95.9% of TN. However, different from TN, NH3-N concentrations in the surrounding area were higher than those in the lake during the dry season, with concentrations of 0.66 mg/L, 0.95 mg/L, 1.08 mg/L, and 0.77 mg/L at sampling sites DBS-12, DBS-15, DBS-16, and DBS-17, respectively. This indicated that external nitrogen was converging towards the lake via surface runoff [37]. In the transitional season, the strengthened water dynamics resulted in higher NH3-N concentrations at the upstream inflow (DBS-12) and downstream outflow (DBS-15), with concentration of 0.53 mg/L and 1.01 mg/L, respectively. In the wet season, the spatial distribution pattern of NH3-N was similar to that of TN, with extremely high concentrations (2.20 mg/L) at the lake outflow. Additionally, NH3-N concentrations remained higher in the surrounding area (e.g., DBS-13, DBS-17, and DBS-18) compared to the lake area.
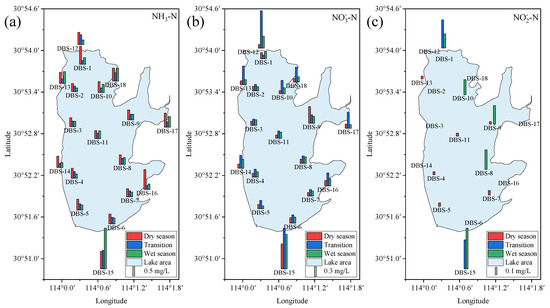
Figure 3.
Spatiotemporal variation in NH3-N (a), NO3−-N (b), and NO2−-N (c) in surface water.
Unlike NH3-N, high NO3−-N concentrations were observed mainly in the inflow and outflow areas, while NO3−-N distribution in the lake area was relatively uniform (Figure 3b and Table S4). Furthermore, during the transitional season, NO3−-N concentrations in the surrounding area were significantly higher than those in the lake area, opposite to the higher concentrations of NH3-N in the surrounding area during the dry and wet seasons. This indicated a dynamic transformation process between NH3-N and NO3−N, influenced by the intensity of surface water circulation, thereby affecting their spatiotemporal distribution patterns.
For NO2−-N, the overall detected concentrations were low, primarily found at a few sampling sites within the lake during the dry season, with concentrations ranging from 0.04 to 0.06 mg/L (Figure 3c and Table S4). This may be related to the fact that groundwater is in an oxidizing environment, as indicated by the Eh values of the water samples (Table 1). During the transitional and wet seasons, the detected concentration range was relatively higher, with high concentrations mainly found in the surface waters at the upstream inflow and downstream outflow sites. This suggested that NO2−-N primarily originated from the transformation of nitrogen in other forms with high concentrations.
The spatiotemporal evolution of nitrogen in groundwater, including NH3-N and NO3−-N, are shown in Figure 4. For NH3-N, its concentration in groundwater exhibited significant spatiotemporal variation. Spatially, higher concentrations were observed at sampling sites DXS-1, DXS-3, and DXS-5. Temporally, higher concentrations were found during the dry season. The spatial distribution of NO3−-N concentrations was similar to that of NH3-N, with higher concentrations at DXS-1, DXS-3, and DXS-5, particularly at DXS-3, where NO3−-N concentrations exceeded the standard in all three periods. However, it is noteworthy that the temporal variation trends of NO3−-N and NH3-N were not consistent, indicating a dynamic transformation process between these two forms. Since NO3−-N concentrations in groundwater were dominant compared to NH3-N, the spatiotemporal evolution pattern of TN in groundwater aligned with that of NO3−-N (Figure S3). From the prospect of spatial connection with surface water, high concentrations of NH3-N and NO3−-N occurred mainly in wells adjacent to Wangmu Lake. This result implied that groundwater in areas that were closely connected with lake surface water may transport pollutants into the lake or receive pollutants from the lake [38,39].
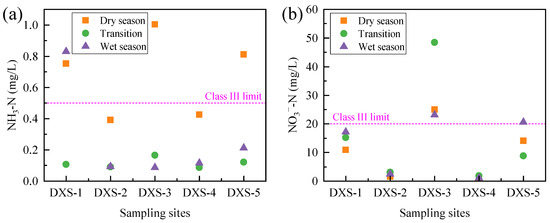
Figure 4.
Spatiotemporal variation in NH3-N (a) and NO3−-N (b) in groundwater.
3.3. Potential Nitrate Sources and Their Contributions
3.3.1. Hydrochemical Indicators
Chloride ion (Cl−) is relatively conservative in aquatic environments and is often used in conjunction with NO3− as a tracer to identify the source of nitrates [40]. Figure 5a shows that there was no correlation between the concentration of Cl− and NO3− in both surface water and groundwater, indicating that their sources were influenced by multiple factors rather than a single pollution source [41,42]. Based on the relationship between Cl− concentration and the NO3−/Cl− molar ratio (Figure 5b), all sampling points in the surface water of Wangmu Lake exhibited a clustered distribution with a lower NO3−/Cl− molar ratio, falling between soil input and manure and sewage (M&S) input. This suggested that the surface water was primarily influenced by soil sources, along with contributions from M&S [43]. By contrast, groundwater displayed a more dispersed distribution across all nitrate inputs, reflecting a broader range of sources, including soil input, agricultural input, and M&S input.
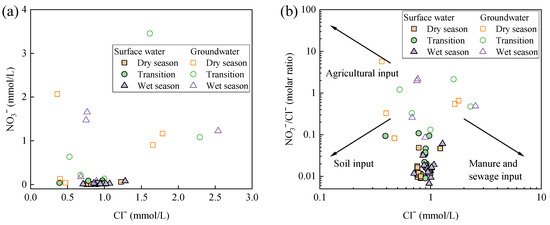
Figure 5.
Relationship analysis for different hydrochemical indicators including (a) concentration of NO3− and Cl− and (b) molar ratio of NO3−/Cl− and concentration of Cl− in surface water and groundwater of Wangmu Lake.
Pearson correlation analysis was performed on the main hydrochemical indicators of surface water and groundwater in Wangmu Lake, and the results are shown in Figure 6. A significant correlation (r > 0.6, p < 0.05) was observed between TN and different nitrogen forms, including NH3-N, NO3−-N, and NO2−-N, indicating the homogeneity and mutual transformation among different forms. Additionally, there were significant correlations (r > 0.3, p < 0.05) between TN, NH3−-N, NO3−-N, NO2−-N, and major ions in the surface water such as K+, Na+, Cl−, and SO42− (Figure 6a). A similar phenomenon was observed in groundwater, as a significant correlation (r > 0.7, p < 0.05) occurred between TN and NO3−-N, K+, Ca2+, and SO42− (Figure 6b). Previous studies on soil amended with organic residues demonstrated that a positive relationship between cations such as K+, Na+, Ca2+, and Mg2+ with NH3−-N and NO3−-N happened during soil leaching [44]. The accelerated loss of these cations from soils should be ascribed to nitrogen fertilizer addition [45]. Therefore, the positive correlation between nitrogen in various forms and the cations in both surface water and groundwater proved the anthropogenic source of nitrogen.
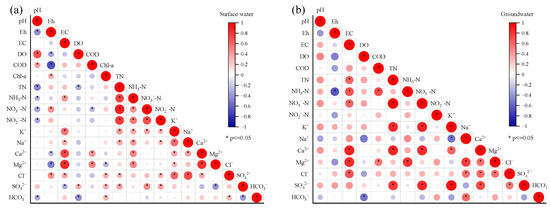
Figure 6.
Pearson correlation analysis based on hydrochemistry of surface water (a) and groundwater (b) in Wangmu Lake.
3.3.2. Principal Component Analysis
Principal component analysis (PCA) utilizes orthogonal transformation to reveal internal relationships among multiple variables by reducing them to a few composite indicators [46]. Two principal components (PCs) were extracted from the hydrochemical indicators of surface water and groundwater, with the cumulative variance contributions of 50.3% and 61.9%, respectively. These two PCs elucidated the primary sources of pollutants in the aquatic environment of Wangmu Lake (Figure 7). There was a strong positive correlation between TN, NH3−-N, NO3−-N, NO2−-N, K+, Na+, Cl−, and PC1 in surface water, while EC, COD, Ca2+, and Mg2+ had a strong positive correlation with PC2. The percentages of sampling sites in surface water, 24.0% and 5.56%, had a concentration of TN, and NH3−-N exceeded the thresholds in the national standard, considered to reveal the influence by human activities. Moreover, the significant correlations among these indicators were observed in correlation analysis, suggesting their same anthropogenic sources resulting in the nitrate contamination. Previous studies on the Poyang Lake Basin also noticed that the PC was associated with Na+, SO42−, Cl−, NO3−, K+, and Mg2+, which contributed to the nitrate contamination affecting the groundwater chemistry [47]. As for the PC2, Ca2+ was the major cation in surface water; its significant positive correlation with EC and Mg2+ indicated rock weathering such as the dissolution of carbonate. This was consistent with a previous study that found that hydrochemistry in the Jianghan Plain is primarily controlled by carbonate rock dissolution [48]. As for groundwater, EC, TN, NO3−-N, K+, Ca2+, and SO42− had a strong positive correlation with PC1, while NH3-N, Na+, and Mg2+ were strongly correlated with PC2. Based on the characteristics of the indicators belonging to different PCs, the PC1 in groundwater should be the combination of human activities and mineral dissolution processes, such as gypsum weathering and pyrite oxidation. Previous research indicated that the weathering zone in the study area is composed of sand and clay containing gypsum [49]. Additionally, the oxidation of reducing pyrite to produce sulfate is ubiquitous during chemical weathering in surface environment of earth [50]. As for PC2, it more likely corresponded to soil leaching. It should be noted that while the principal components of groundwater and surface water were generally similar, the more complex migration processes in groundwater make it more challenging to accurately distinguish its sources.
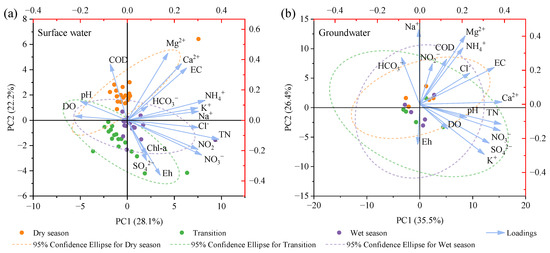
Figure 7.
PCA based on hydrochemistry of surface water (a) and groundwater (b) in Wangmu Lake.
3.3.3. Isotope Compositions
The abundances of δ15N-NO3− and δ18O-NO3− in surface water and groundwater are shown in Figure 8. Compared to the relative stability of groundwater, surface water exhibited distinct seasonal characteristics. Specifically, surface water samples were primarily located in regions influenced by M&S and soil organic nitrogen (SON) during the dry season, whereas the influence of ammonium fertilizers (AFs) increased in the transitional season. During the wet season, atmospheric deposition (AD) contributed to enhancing the source diversity of the nitrate. This seasonal variation was due to changes in nitrate sources, influenced by increased rainfall from the dry to the wet season. The impacts of fertilizers and soil nitrogen sources on nitrate content in Wangmu Lake increased, closely related to local agricultural activities. Surface water samples in Wangmu Lake fell within the AF region, consistent with the predominant use of ammonium-based fertilizers in rapeseed and maize cultivation around the lake [51,52]. The δ15N-NO3− and δ18O-NO3− values exhibited insignificant denitrification trends, indicating that denitrification in surface water was not the prominent process.
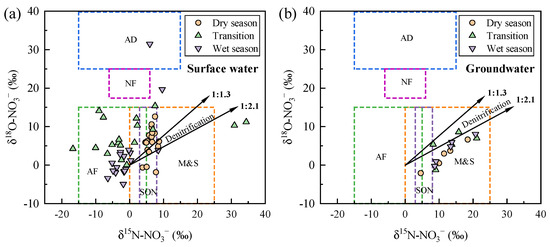
Figure 8.
δ15N-NO3− and δ18O-NO3− values in surface water (a) and groundwater (b) of Wangmu Lake in different seasons. The dashed rectangles represent various sources of NO3−, including atmospheric deposition (AD), ammonium fertilizers (AFs), nitrate fertilizers (NFs), manure and sewage (M&S), and soil organic nitrogen (SON). The solid black lines with arrows indicate the denitrification process that result in the enrichment of δ15N-NO3− and δ18O-NO3−, with ratios ranging from 1:1.3 to 1:2.1.
For groundwater samples, the scatter points of δ15N-NO3− and δ18O-NO3− abundance during the dry, transitional, and wet seasons were mainly distributed in regions influenced by M&S and SON. There were no scatter points in regions influenced by AD and nitrate fertilizers (NFs), indicating that the shallow groundwater around Wangmu Lake was minimally affected by AD and NFs. The different characteristics of groundwater and surface water indicated that groundwater in the study area was less affected by the agricultural activities than the surface water. This phenomenon was similar to the findings in Upper East Region of Ghana, where M&S were the dominant source of NO3− in groundwater, while surface water exhibited complex signatures [43].
3.3.4. Source Apportionment
The SIAR model was used for the quantitative identification of NO3− sources in both surface water and groundwater. The nitrogen and oxygen isotope characteristic values of the five nitrate sources used in the SIAR model are listed in Table 2, while the SIAR results are presented in Figure 9.

Table 2.
δ15N-NO3− and δ18O-NO3− values used in SIAR modeling.
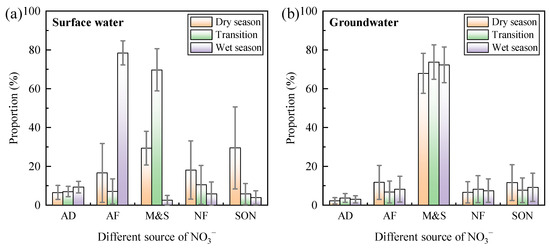
Figure 9.
Contribution of different nitrate sources in surface water (a) and groundwater (b) in different seasons.
For surface water, the contributions from different sources showed significant seasonal variations. Specifically, during the dry season, SON (29.5%) and M&S (29.3%) were the main contributors. In the transitional season, M&S (69.7%) was the primary source, while in the wet season, AFs (78.4%) dominated. By contrast, the sources of groundwater remained relatively stable, with M&S being the predominant contributor (67.9–73.7%). This stability reflected the buffering effect of soil and sediments on groundwater.
M&S were the largest nitrate source for groundwater and significantly contributed to nitrate contents in the surface water during the dry and transitional seasons, which was related to human activities around the lake. The contributions of M&S to nitrate contents in the surface water decreased markedly during the wet season, possibly due to increased terrestrial runoff and sewage treatment in some areas.
Fertilizers (AF+NF) were also important sources of nitrates in the surface water. The highest contributions of fertilizers to nitrate contents in the surface water occurred in November 2022 and September 2023, corresponding with the rapeseed planting season. During this period, nitrogen fertilizers were extensively used to support rapeseed growth. Irrigation after planting led to some nitrogen fertilizer runoff into the surface water, resulting in higher contribution proportions. SON was a major source of nitrates during the dry season, indicating that the loss of soil organic nitrogen from farmland around Wangmu Lake cannot be ignored. AD maintained a low contribution proportion to both surface and groundwater nitrates throughout the year (6.5–9.3%, 2.2–3.7%), due to the low concentration of nitrates in precipitation.
4. Discussion
4.1. Nitrogen Transformation Processes in the Aquatic Environment
Nitrogen and oxygen isotopic composition and the abundance of NO3− in water are influenced by biogeochemical processes within aquatic systems [54,55]. Denitrification occurs under anaerobic conditions (DO < 2 mg/L) [56], where denitrifying bacteria preferentially use the lighter isotopes δ14N-NO3− and δ16O-NO3−, resulting in the simultaneous enrichment of the heavier isotopes δ15N-NO3− and δ18O-NO3− [18]. As shown in Figure 8, some δ15N-NO3− and δ18O-NO3− scatter points in both surface water and groundwater fell within the denitrification range. The DO concentrations in Table 1 suggested that the aquatic environment of Wangmu Lake was generally controlled by oxidative conditions [24], although denitrification may occur at some locations.
Combined with hydrochemical analysis, more evidence can be found for nitrogen transformation. Generally, the denitrification process causes an exponential increase in the δ15N-NO3− of residual nitrate [40]. Therefore, when the concentration of ln(NO3−-N) is negatively correlated with δ15N-NO3− abundance, it is highly likely due to denitrification [25]. As shown in Figure 10a, δ15N-NO3− values were positively correlated with ln(NO3−-N) values in both surface water and groundwater, indicating inconspicuous denitrification. Combining this with the scatter plot of δ15N-NO3− values and molar ratio of NO3−-N to Cl− (Figure 10b), it was evident that the surface water was primarily influenced by fertilizer input and nitrification processes, while groundwater showed less influence from these factors. Instead, the nitrate in groundwater was more likely influenced by the mixing process, as supported by the multiple sources shown in Figure 5b.
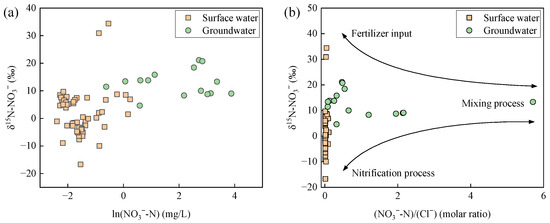
Figure 10.
Plots of NO3−-N concentration versus δ15N-NO3− abundance (a), and moral ratio of NO3−-N to Cl− versus δ15N-NO3− abundance (b) in surface water and groundwater in Wangmu Lake.
4.2. Impact of Hydrological Dynamics and Human Activities
Hydrogeological conditions and human activities significantly affect the nitrogen cycle in aquatic environments. Figure 11a shows that the average NO3− concentration in surface water initially increased and then decreased over time, reflecting dynamic recharge. This variation was attributed to increased rainfall, which accelerated the surface water hydrodynamic cycle from the dry to wet season, which in turn diluted the accumulated nutrients [57,58]. Human activities, particularly seasonal domestic sewage discharge, also impacted NO3− levels (Figure 9a), with higher concentrations in the transitional season due to increased summer water use [59]. The sampling time for the transitional season samples was May, a period characterized by relatively high local temperatures in the study area, during which domestic water use by residents was significantly higher than the dry season. Therefore, the NO3− concentration increased from the dry season to the transitional season, with the sources shifting from a combination of M&S and SON to primarily M&S. In the wet season, rainfall-induced dilution dominated, leading to a reduction in NO3− concentration [60]. The trend in δ15N-NO3− abundance showed that denitrification (Figure 8a), which enriched the heavy N isotope [61,62], was significant in the dry season. This process resulted in higher δ15N-NO3− abundance levels.
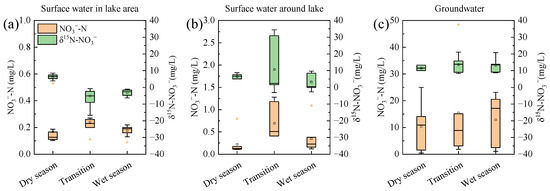
Figure 11.
Change in NO3− concentration and δ15N-NO3− abundance in surface water (a) and groundwater (b) in Wangmu Lake and its surrounding area (c) over time.
In the surrounding surface water (Figure 11b), the NO3− concentration followed a similar pattern to the lake water, with a peak in the transitional season due to the recharge relationship. However, the increase in NO3− concentration in the surrounding water environment was significantly higher than that in the lake water at the transitional season, and the change in δ15N-NO3− abundance even showed an opposite trend. This difference was mainly attributed to the capacity of the receiving water bodies in different water environments. Unlike the lake area, which receives surrounding water and upstream inflows, the scattered surrounding water environment in the Wangmu Lake area has nutrient concentration levels more susceptible to human activities. Combined with the isotopic tracing results (Figure 9a), the main sources of NO3− in surface water during the transitional season were M&S. Therefore, the increase in sewage discharge led to higher NO3− concentration and δ15N-NO3− abundance. The surrounding area of Wangmu Lake is mainly composed of villages and towns with inadequate sewage treatment facilities, leading to the local discharge of sewage and the accumulation of NO3− in the surrounding water environment.
The δ15N-NO3− abundance in groundwater showed less fluctuation over time (Figure 11c), due to the sources of NO3− in groundwater and the buffering effect of soil. As shown in Figure 9b, the nitrogen in the groundwater around the Wangmu Lake area mainly originated from M&S, with insignificant changes over time. Additionally, Table 1 indicates that NO3− was the primary form of nitrogen in groundwater. Seasonal variations in sewage and wastewater discharge and leakage infiltration are less significant compared to the impact of atmospheric precipitation and river recharge on groundwater replenishment [63], which was the main reason why the δ15N-NO3− abundance remain relatively stable. Furthermore, as the dry season transitioned to the wet season, the rise in the groundwater level made it easier for nitrogen fertilizer and soil nitrogen to enter the groundwater, which also increased the leakage of domestic sewage into the groundwater, causing a slight increase in NO3− concentration [12]. Nevertheless, M&S remained the main sources of nitrogen in the groundwater around the Wangmu Lake area (Figure 9b), indicating that the inadequate sewage treatment facilities in rural areas were a major pathway for groundwater pollution risks.
4.3. Uncertainty Analysis and Implications for N Pollution Control
The SIAR model can estimate the contribution proportions of different nitrate sources, but uncertainty persists in source allocations. This uncertainty mainly arises from the high dispersion and significant spatial and temporal variability of nitrate sources, which are influenced by point source pollution. Surface runoff and leaching in the unsaturated zone can introduce nitrogen inputs, such as those from septic tanks, compost piles, and residual fertilizers from farmland, into surface water. These random nitrogen inputs can interfere with source identification. Additionally, isotope fractionation further contributes to variability by obscuring the isotope compositions. The SIAR model identifies nitrate sources based on relatively fixed source value ranges. The use of existing research values may not accurately reflect the isotope characteristics of the study area, potentially resulting in divergence. To reduce the uncertainty in nitrate source apportionment, more comprehensive and extensive measurements of nitrogen and oxygen isotope values for nitrate sources in the study area are necessary. Despite existing uncertainty, this study demonstrates the variety in nitrogen sources and transformations in a typical agricultural area, highlighting the divergence in surface water and groundwater. As a pollutant in water environments but a vital nutrient for the growth and development of crops, nitrogen should be optimally controlled and be recycled from various pollution sources through land absorption, turning waste into a valuable resource and achieving a win–win situation. For nitrogen pollution in agricultural areas, domestic pollution sources should be strictly controlled through the construction of sewage collection and treatment facilities to address the direct discharge of sewage. This potential source may have been previously overlooked but needs serious attention. In addition, measures should be taken to reduce the impact of agricultural activities on surface water, such as scientific fertilizer application, optimized farming practices, and the construction of soil and water conservation facilities.
5. Conclusions
This study integrated hydrochemical analysis, statistics analysis, stable nitrate isotopes, and the SIAR model, which provided a comprehensive understanding of nitrogen sources and transformation processes in both the surface water and groundwater of Wangmu Lake, a typical agricultural watershed in central China. The key conclusions are as follows:
- (1)
- Both the surface water and groundwater in Wangmu Lake were found to be impacted by nitrogen pollution. In the surface water, the proportions of sites exceeding pollution thresholds for TN ranged from 16.67% to 33.33%, with a constant 5.56% for NH3-N. In groundwater, the proportions of sites polluted by NH3-N and NO3−-N ranged from 0 to 40% and remained constant at 20%.
- (2)
- Pearson correlation and principal component analysis suggested that nitrogen pollution in both surface water and groundwater originated from similar anthropogenic sources. The SIAR model further confirmed that agricultural fertilizers (AF, 7.1%~78.4%) and manure and sewage (M&S, 2.6%~69.7%) were the primary sources of nitrates for surface water, while M&S (67.9%~73.7%) were the predominant sources in groundwater.
- (3)
- Nitrification, hydrological dynamics, and human activities played significant roles in shaping the nitrogen cycle, influencing the spatiotemporal evolution of nitrogen in various forms, as well as the enrichment of nitrate stable isotopes.
- (4)
- Seasonal variations in hydrochemical components and stable isotopes provided additional insights into nitrogen transformation processes, thereby reducing the uncertainty in nitrate source identification. To effectively mitigate nitrogen pollution in agricultural watersheds, improvements in septic tanks and sewage networks, alongside the adsorption of scientific fertilization practices, are crucial.
Supplementary Materials
The following supporting information can be downloaded at: https://www.mdpi.com/article/10.3390/w16192803/s1, Figure S1: SO42− vs. Cl−+ HCO3− concentrations for surface water and groundwater samples from Wangmu lake. Total ionic salinity (TIS) lines are drawn for reference; Figure S2: Spatiotemporal variation of TN in surface water; Figure S3: Spatiotemporal variation of TN in groundwater water; Table S1: Test methods for water chemistry analysis; Table S2: The Class III limits of indicators measured in this study as requested by Chinese standard for surface water (GB 3838-2002) [24] and groundwater (GB 14848-2017) [25] quality; Table S3: The reported δ15N-NO3− and δ18O-NO3− values in the typical surface water and groundwater in China; Table S4: Results of different forms of nitrogen in the surface water of Wangmu Lake. References [64,65,66,67,68,69,70,71,72,73,74,75,76,77,78] are cited in the Supplementary Materials.
Author Contributions
Conceptualization, Z.T., Y.X. and S.Y.; Methodology, Z.T., Y.L., S.F., M.Z. and S.Y.; Software, Z.T., J.Y. and S.Y.; Validation, Z.T., Y.L., J.Y. and S.Y.; Formal analysis, Z.T., J.Y., Y.Z., J.Z., S.F. and S.Y.; Investigation, Z.T., Y.X., Y.L., J.Y., F.Y., M.Z., J.P. and S.Y.; Resources, Y.X., Y.Z. and J.Z.; Data curation, Z.T., Y.X., F.Y. and S.Y.; Writing—original draft, Z.T. and Y.L.; Writing—review & editing, Y.X. and S.Y.; Visualization, S.Y.; Supervision, Y.X., Y.Z., J.Z. and S.F.; Project administration, Y.Z., J.Z. and S.F.; Funding acquisition, Z.T. All authors have read and agreed to the published version of the manuscript.
Funding
This study was funded by the Hubei Provincial Natural Science Foundation of China (No. 2023AFD222), the Science and Technology Project of Hubei Geological Bureau (No. KJ2023-30), and the Science and Technology Project of the Six Geological Team of the Hubei Geological Bureau (No. DKJ2022-02).
Data Availability Statement
Data will be made available on request.
Conflicts of Interest
The authors declare that they have no known competing financial interests or personal relationships that could have appeared to influence the work reported in this paper.
References
- Biddau, R.; Dore, E.; Da Pelo, S.; Lorrai, M.; Botti, P.; Testa, M.; Cidu, R. Geochemistry, stable isotopes and statistic tools to estimate threshold and source of nitrate in groundwater (Sardinia, Italy). Water Res. 2023, 232, 119663. [Google Scholar] [CrossRef] [PubMed]
- Beusen, A.H.; Bouwman, A.F.; Van Beek, L.P.; Mogollón, J.M.; Middelburg, J.J. Global riverine N and P transport to ocean increased during the 20th century despite increased retention along the aquatic continuum. Biogeosciences 2016, 13, 2441–2451. [Google Scholar] [CrossRef]
- Wu, Z.; Li, J.; Sun, Y.; Peñuelas, J.; Huang, J.; Sardans, J.; Jiang, Q.; Finlay, J.C.; Britten, G.L.; Follows, M.J.; et al. Imbalance of global nutrient cycles exacerbated by the greater retention of phosphorus over nitrogen in lakes. Nat. Geosci. 2022, 15, 464–468. [Google Scholar] [CrossRef]
- Yu, C.; Huang, X.; Chen, H.; Godfray, H.C.J.; Wright, J.S.; Hall, J.W.; Gong, P.; Ni, S.; Qiao, S.; Huang, G.; et al. Managing nitrogen to restore water quality in China. Nature 2019, 567, 516–520. [Google Scholar] [CrossRef] [PubMed]
- Wu, Y.; Ju, H.Y.; Jiang, H.; Zhang, G.X.; Qi, P.; Li, Z. Identifying nitrate sources and transformations in an agricultural watershed in Northeast China: Insights from multiple isotopes. J. Environ. Manag. 2023, 340, 118023. [Google Scholar] [CrossRef]
- Zhang, X.; Zhang, Y.; Shi, P.; Bi, Z.L.; Shan, Z.X.; Ren, L.J. The deep challenge of nitrate pollution in river water of China. Sci. Total Environ. 2021, 770, 144674. [Google Scholar] [CrossRef]
- Guo, J.; Wang, L.; Yang, L.; Deng, J.; Zhao, G.; Guo, X. Spatial-temporal characteristics of nitrogen degradation in typical Rivers of Taihu Lake Basin, China. Sci. Total Environ. 2020, 713, 136456. [Google Scholar] [CrossRef]
- Wang, Y.; Kong, X.; Peng, Z.; Zhang, H.; Hu, W.; Zhou, X. Retention of nitrogen and phosphorus in Lake Chaohu, China: Implications for eutrophication management. Environ. Sci. Pollut. Res. 2020, 27, 41488–41502. [Google Scholar] [CrossRef]
- Liu, Z.; Wang, X.; Jia, S.; Mao, B. Multi-methods to investigate spatiotemporal variations of nitrogen-nitrate and its risks to human health in China’s largest fresh water Lake (Poyang Lake). Sci. Total Environ. 2023, 863, 160975. [Google Scholar] [CrossRef]
- Yuan, B.; Guo, M.; Zhou, X.; Li, M.; Xie, S. Defining the sources and the fate of nitrate by using dual isotopes and a Bayesian isotope mixing model: Water–nitrate management in cascade dams of Lancang River. Sci. Total Environ. 2023, 886, 163995. [Google Scholar] [CrossRef]
- Isaza, D.F.G.; Cramp, R.L.; Franklin, C.E. Living in polluted waters: A metaanalysis of the effects of nitrate and interactions with other environmental stressors on freshwater taxa. Environ. Pollut. 2020, 261, 114091. [Google Scholar] [CrossRef] [PubMed]
- Cui, R.; Zhang, D.; Hu, W.; Zhao, X.; Yan, H.; Liu, G.; Chen, A. Nitrogen in soil, manure and sewage has become a major challenge in controlling nitrate pollution in groundwater around plateau lakes, Southwest China. J. Hydrol. 2023, 620, 129541. [Google Scholar] [CrossRef]
- Shang, Y.; Wang, F.; Sun, S.; Zhu, B.; Wang, P. Sources and transformations of nitrate in Qixiangcuo Lake and its inflow rivers in the northern Tibetan plateau. Environ. Sci. Pollut. Res. 2023, 30, 4245–4257. [Google Scholar] [CrossRef] [PubMed]
- Kazakis, N.; Matiatos, I.; Ntona, M.M.; Bannenberg, M.; Kalaitzidou, K.; Kaprara, E.; Manassis, M.; Ioannidou, A.; Vargemezis, G.; Konstantinos, V. Origin, implications and management strategies for nitrate pollution in surface and ground waters based on a δ15N-NO3− and δ18O-NO3− isotope approach. Sci. Total Environ. 2020, 724, 138211. [Google Scholar] [CrossRef] [PubMed]
- Lu, M.; Yue, F.; Wang, X.; Liu, Z.; Shi, Z.; Zhang, P. Identify nitrogen transport paths and sources contribution in karst valley depression area using isotopic approach. J. Environ. Manag. 2023, 337, 117751. [Google Scholar] [CrossRef] [PubMed]
- Burgis, C.R.; Hayes, G.M.; Zhang, W.; Henderson, D.A.; Macko, S.A.; Smith, J.A. Tracking denitrification in green stormwater infrastructure with dual nitrate stable isotopes. Sci. Total Environ. 2020, 747, 141281. [Google Scholar] [CrossRef]
- Hong, S.; Han, Y.; Kim, J.; Lim, B.R.; Park, S.Y.; Choi, H.; Park, M.R.; Kim, E.; Lee, S.; Huh, Y.; et al. A quantitative approach for identifying nitrogen sources in complex yeongsan river watershed, Republic of Korea, based on dual nitrogen isotope ratios and hydrological model. Water 2023, 15, 4275. [Google Scholar] [CrossRef]
- Xue, D.; Botte, J.; De Baets, B.; Accoe, F.; Nestler, A.; Taylor, P.; Van Cleemput, O.; Berglund, M.; Boeckx, P. Present limitations and future prospects of stable isotope methods for nitrate source identification in surface- and groundwater. Water Res. 2009, 43, 1159–1170. [Google Scholar] [CrossRef]
- Choi, W.J.; Kwak, J.H.; Lim, S.S.; Park, H.J.; Chang, S.X.; Lee, S.M.; Arshad, M.A.; Yun, S.I.; Kim, H.Y. Synthetic fertilizer and livestock manure differently affect δ15N in the agricultural landscape: A review. Agric. Ecosyst. Environ. Times 2017, 237, 1–15. [Google Scholar] [CrossRef]
- Mayer, B.; Boyer, E.W.; Goodale, C.; Jaworski, N.A.; Van Breemen, N.; Howarth, R.W.; Seitzinger, S.; Billen, G.; Lajtha, K.; Nadelhoffer, K.; et al. Sources of nitrate in rivers draining sixteen watersheds in the northeastern U.S.: Isotopic constraints. In The Nitrogen Cycle at Regional to Global Scales; Boyer, E.W., Howarth, R.W., Eds.; Springer: Dordrecht, The Netherlands, 2002; pp. 171–197. [Google Scholar]
- Durka, W.; Schulze, E.D.; Gebauer, G.; Voerkeliust, S. Effects of forest decline on uptake and leaching of deposited nitrate determined from 15N and 18O measurements. Nature 1994, 372, 765–767. [Google Scholar] [CrossRef]
- Piatek, K.B.; Mitchell, M.J.; Silva, S.R.; Kendall, C. Sources of nitrate in snowmelt discharge: Evidence from water chemistry and stable isotopes of nitrate. Water Air Soil Pollut. 2005, 165, 13–35. [Google Scholar] [CrossRef]
- Parnell, A.C.; Inger, R.; Bearhop, S.; Jackson, A.L. Source partitioning using stable isotopes: Coping with too much variation. PLoS ONE 2010, 5, e9672. [Google Scholar] [CrossRef]
- Ji, X.; Shu, L.; Chen, W.; Chen, Z.; Shang, X.; Yang, Y.; Dahlgren, R.A.; Zhang, M. Nitrate pollution source apportionment, uncertainty and sensitivity analysis across a rural-urban river network based on δ15N/δ18O-NO3− isotopes and SIAR modeling. J. Hazard. Mater. 2022, 438, 129480. [Google Scholar] [CrossRef]
- Cao, M.; Yin, X.; Zhang, J.; Jin, M.; Huang, X. Sources and transformations of nitrogen in an agricultural watershed on the Jianghan Plain, China: An integration of δ15N–NH4+, δ15N–NO3−, δ18O–NO3− and a Bayesian isotope mixing model. Appl. Geochem. 2022, 142, 105329. [Google Scholar] [CrossRef]
- Li, J.; Chen, Y.; Wang, Z. Effect of pollution load reduction on water quality in rural lakes in the shallow hill water network area. Water Sci. Technol. Water Supply 2022, 22, 6213–6229. [Google Scholar] [CrossRef]
- APHA. Standard Methods for the Examination of Water and Wastewater, 20th ed.; APHA-AWWA-WET: Washington, DC, USA, 1998. [Google Scholar]
- Zhu, A.; Chen, J.; Gao, L.; Shimizu, Y.; Liang, D.; Yi, M.; Cao, L. Combined microbial and isotopic signature approach to identify nitrate sources and transformation processes in groundwater. Chemosphere 2019, 228, 721–734. [Google Scholar] [CrossRef]
- GB 3838-2002; Environmental Quality Standard for Surface Water. Ministry of Ecology and Environment of People’s Republic of China: Beijing, China, 2002.
- GB/T 14848-2017; Standards for Groundwater Quality. General Administration of Quality Supervision, Inspection and Quarantine of China, and Standardization Administration of China: Beijing, China, 2017.
- Apollaro, C.; Caracausi, A.; Paternoster, M.; Randazzo, P.; Aiuppa, A.; De Rosa, R.; Fuoco, I.; Mogelli, G.; Muto, F.; Vanno, E.; et al. Fluid geochemistry in a lowenthalpy geothermal field along a sector of southern Apennines chain (Italy). J. Geochem. Explor. 2020, 219, 106618. [Google Scholar] [CrossRef]
- Apollaro, C.; Buccianti, A.; Vespasiano, G.; Vardè, M.; Fuoco, I.; Barca, D.; Bloise, A.; Miriello, D.; Cofone, F.; Servidio, A.; et al. Comparative geochemical study between the tap waters and the bottled mineral waters in Calabria (Southern Italy) by compositional data analysis (CoDA)developments. Appl. Geochem. 2019, 107, 19–33. [Google Scholar] [CrossRef]
- Marandi, A.; Shand, P. Groundwater chemistry and the Gibbs Diagram. Appl. Geochem. 2018, 97, 209–212. [Google Scholar] [CrossRef]
- Wang, H.; Liu, X.; Wang, Y.; Zhang, S.; Zhang, G.; Han, Y.; Li, M.; Liu, L. Spatial and temporal dynamics of microbial community composition and factors influencing the surface water and sediments of urban rivers. J. Environ. Sci. 2023, 124, 187–197. [Google Scholar] [CrossRef]
- Zhang, W.; Li, H.P.; Li, Y. Spatio-temporal dynamics of nitrogen and phosphorus input budgets in a global hotspot of anthropogenic inputs. Sci. Total Environ. 2019, 656, 1108–1120. [Google Scholar] [CrossRef]
- Lü, J.; Wang, S.; Liu, B.; Song, X. Spatiotemporal heterogeneity of nitrogen transformation potentials in a freshwater estuarine system. Sci. Total Environ. 2023, 859, 160335. [Google Scholar] [CrossRef]
- Corman, J.R.; Bertolet, B.L.; Casson, N.J.; Sebestyen, S.D.; Kolka, R.K.; Stanley, E.H. Nitrogen and phosphorus loads to temperate seepage lakes associated with allochthonous dissolved organic carbon loads. Geophys. Res. Lett. 2018, 45, 5481–5490. [Google Scholar] [CrossRef]
- Sophocleous, M. Interactions between groundwater and surface water: The state of the science. Hydrogeol. J. 2002, 10, 52–67. [Google Scholar] [CrossRef]
- Shaw, G.D.; White, E.S.; Gammons, C.H. Characterizing groundwater–lake interactions and its impact on lake water quality. J. Hydrol. 2013, 492, 69–78. [Google Scholar] [CrossRef]
- Su, C.; Jiang, J.; Xie, X.; Han, Z.; Wang, M.; Li, J.; Shi, H. Sources and Cycling Processes of Nitrogen Revealed by Stable Isotopes and Hydrochemistry in a Typical Agricultural Lake Basin. Appl. Geochem. 2023, 156, 105662. [Google Scholar] [CrossRef]
- Cao, X.; Yang, S.; Wu, P.; Liu, S.; Liao, J. Coupling stable isotopes to evaluate sources and transformations of nitrate in groundwater and inflowing rivers around the Caohai karst wetland, Southwest China. Environ. Sci. Pollut. Res. 2021, 28, 45826–45839. [Google Scholar] [CrossRef]
- Cao, M.; Hu, A.; Gad, M.; Adyari, B.; Qin, D.; Zhang, L.; Sun, Q.; Yu, C.P. Domestic wastewater causes nitrate pollution in an agricultural watershed, China. Sci. Total Environ. 2022, 823, 153680. [Google Scholar] [CrossRef]
- Gibrilla, A.; Fianko, J.R.; Ganyaglo, S.; Adomako, D.; Anornu, G.; Zakaria, N. Nitrate contamination and source apportionment in surface and groundwater in Ghana using dual isotopes (15N and 18O-NO3) and a Bayesian isotope mixing model. J. Contam. Hydrol. 2020, 233, 103658. [Google Scholar] [CrossRef]
- Zarabi, M.; Jalali, M. Leaching of nitrogen and base cations from calcareous soil amended with organic residues. Environ. Technol. 2012, 33, 1577–1588. [Google Scholar] [CrossRef]
- Lucas, R.W.; Klaminder, J.; Futter, M.N.; Bishop, K.H.; Egnell, G.; Laudon, H.; Högberg, P. A meta-analysis of the effects of nitrogen additions on base cations: Implications for plants, soils, and streams. For. Ecol. Manag. 2011, 262, 95–104. [Google Scholar] [CrossRef]
- Jafarzadegan, M.; Safi-Esfahani, F.; Beheshti, Z. Combining hierarchical clustering approaches using the PCA method. Expert Syst. Appl. 2019, 137, 1–10. [Google Scholar] [CrossRef]
- Mao, H.; Wang, G.; Rao, Z.; Liao, F.; Shi, Z.; Huang, X.; Chen, X.; Yang, Y. Deciphering spatial pattern of groundwater chemistry and nitrogen pollution in poyang Lake Basin (eastern China) using self-organizing map and multivariate statistics. J. Clean. Prod. 2021, 329, 129697. [Google Scholar] [CrossRef]
- Zhou, Y.; Wang, Y.; Li, Y.; Zwahlen, F.; Boillat, J. Hydrogeochemical characteristics of central Jianghan Plain, China. Environ. Earth Sci. 2012, 68, 765–778. [Google Scholar] [CrossRef]
- Hu, M.; Zhou, P. Hydro-geochemical evolution characteristics of shallow groundwater in northeast of Jianghan Plain, China. Carbonates Evapor. 2021, 36, 1–15. [Google Scholar] [CrossRef]
- Kim, D.M.; Yun, S.T.; Yoon, S.; Mayer, B. Signature of oxygen and sulfur isotopes of sulfate in ground and surface water reflecting enhanced sulfide oxidation in mine areas. Appl. Geochem. 2019, 100, 143–151. [Google Scholar] [CrossRef]
- Ma, R.; Yu, K.; Xiao, S. Data-driven estimates of fertilizer-induced soil NH3, NO and N2O emissions from croplands in China and their climate change impacts. Glob. Change Biol. 2022, 28, 1008–1022. [Google Scholar] [CrossRef]
- Ji, C.; Zhai, Y.; Zhang, T.; Shen, X.; Bai, Y.; Hong, J. Carbon, energy and water footprints analysis of rapeseed oil production: A case study in China. J. Environ. Manag. 2021, 287, 112359. [Google Scholar] [CrossRef]
- Zhao, Y.; Zheng, B.; Jia, H.; Chen, Z. Determination sources of nitrate into the three gorges reservoir using nitrogen and oxygen isotopes. Sci. Total Environ. 2019, 687, 128–136. [Google Scholar] [CrossRef]
- Granger, J.; Wankel, S.D. Isotopic overprinting of nitrification on denitrification as a ubiquitous and unifying feature of environmental nitrogen cycling. Proc. Nat. Acad. Sci. USA 2016, 113, E6391–E6400. [Google Scholar] [CrossRef]
- McMahon, P.B.; Böhlke, J.K. Denitrification and mixing in a stream-aquifer system: Effects of nitrate loading to surface water. J. Hydrol. 1996, 186, 105–128. [Google Scholar] [CrossRef]
- Guo, X.; Tang, Y.; Xu, Y.; Zhang, S.; Ma, J.; Xiao, S.; Ji, D.; Yang, Z.; Liu, D. Using stable nitrogen and oxygen isotopes to identify nitrate sources in the Lancang River, upper Mekong. J. Environ. Manag. 2020, 274, 111197. [Google Scholar] [CrossRef]
- Arheimer, B.; Liden, R. Nitrogen and phosphorus concentrations from agricultural catchments—Influence of spatial and temporal variables. J. Hydrol. 2000, 227, 140–159. [Google Scholar] [CrossRef]
- Xing, J.; Song, J.; Yuan, H.; Li, X.; Li, N.; Duan, L.; Kang, X.; Wang, Q. Fluxes, seasonal patterns and sources of various nutrient species (nitrogen, phosphorus and silicon) in atmospheric wet deposition and their ecological effects on Jiaozhou Bay, North China. Sci. Total Environ. 2017, 576, 617–627. [Google Scholar] [CrossRef]
- Wang, C.; Feng, B.; Wang, P.; Guo, W.; Li, X.; Gao, H.; Zhang, B.; Chen, J. Revealing factors influencing spatial variation in the quantity and quality of rural domestic sewage discharge across China. Process Saf. Environ. Prot. 2022, 162, 200–210. [Google Scholar] [CrossRef]
- Su, C.; Su, Y.; Zhang, R.; Xu, X.; Li, J. Spatio-Temporal Variations in Nitrate Sources and Transformations in the Midstream of the Yellow River Determined Based on Nitrate Isotopes and Hydrochemical Compositions. Water 2024, 16, 1173. [Google Scholar] [CrossRef]
- Li, X.; Sardans, J.; Qi, M.; Ni, X.; Zhang, M.; Peñuelas, J.; Yue, K.; Wu, F. Nitrous oxide concentration and flux in min River Basin of Southeast China: Effects of land use, stream order and water variables. J. Hydrol. 2022, 614, 128507. [Google Scholar] [CrossRef]
- Knöller, K.; Vogt, C.; Haupt, M.; Feisthauer, S.; Richnow, H.H. Experimental investigation of nitrogen and oxygen isotope fractionation in nitrate and nitrite during denitrification. Biogeochemistry 2011, 103, 371–384. [Google Scholar] [CrossRef]
- Pastén-Zapata, E.; Ledesma-Ruiz, R.; Harter, T.; Ramírez, A.I.; Mahlknecht, J. Assessment of sources and fate of nitrate in shallow groundwater of an agricultural area by using a multi-tracer approach. Sci. Total Environ. 2014, 470, 855–864. [Google Scholar] [CrossRef]
- HJ/T 399-2007; Water Quality Determination of the Chemical Oxygen Demand (COD) Fast Digestion-Spectrophotometric Method. Ministry of Ecology and Environment of People’s Republic of China: Beijing, China, 2007.
- HJ 897-2017; Water Quality—Determination of Chlorophyll a Spectrophotometric Method. Ministry of Ecology and Environment of People’s Republic of China: Beijing, China, 2017.
- HJ 636-2012; Water Quality-Determination of Total Nitrogen-Alkaline Potassium Persulfate Digestion UV Spectrophotometric Method. Ministry of Ecology and Environment of People’s Republic of China: Beijing, China, 2012.
- HJ 535-2009; Water Quality―Determination of Ammonia Nitrogen―Nessler’s Reagent Spectrophotometry. Ministry of Ecology and Environment of People’s Republic of China: Beijing, China, 2009.
- HJ 84-2016; Water Quality-Determination of Inorganic Anions (F−, Cl−, NO2−, Br−, NO3−, PO43−, SO32−, SO42−) -Ion Chromatography. Ministry of Ecology and Environment of People’s Republic of China: Beijing, China, 2016.
- GB 11904-89; Water Quality-Determination of Potassium and Sodium-Flame Atomic Absorption Spectrophotometry. Ministry of Ecology and Environment of People’s Republic of China: Beijing, China, 1989.
- GB 11905-89; Water Quality-Determination of Calcium and Magnesium-Atomic Absorption Spectrophotometric Method. Ministry of Ecology and Environment of People’s Republic of China: Beijing, China, 1989.
- Zeng, H.; Wu, J. Tracing the nitrate sources of the Yili River in the Taihu Lake watershed: A dual isotope approach. Water 2014, 7, 188–201. [Google Scholar] [CrossRef]
- Li, Q.; Wang, F.; Yu, Q.; Yan, W.; Li, X.; Lv, S. Dominance of nitrous oxide production by nitrification and denitrification in the shallow Chaohu Lake, Eastern China: Insight from isotopic characteristics of dissolved nitrous oxide. Environ. Pollut. 2019, 255, 113212. [Google Scholar] [CrossRef]
- Fadhullah, W.; Yaccob, N.S.; Syakir, M.I.; Muhammad, S.A.; Yue, F.-J.; Li, S.-L. Nitrate sources and processes in the surface water of a tropical reservoir by stable isotopes and mixing model. Sci. Total Environ. 2020, 700, 134517. [Google Scholar] [CrossRef]
- Vrzel, J.; Vuković-Gačić, B.; Kolarević, S.; Gačić, Z.; Kračun-Kolarević, M.; Kostić, J.; Aborgiba, M.; Farnleitner, A.; Reischer, G.; Linke, R.; et al. Determination of the sources of nitrate and the microbiological sources of pollution in the Sava River Basin. Sci. Total Environ. 2016, 573, 1460–1471. [Google Scholar] [CrossRef]
- Kruk, M.K.; Mayer, B.; Nightingale, M.; Laceby, J.P. Tracing nitrate sources with a combined isotope approach (δ15NNO3, δ18ONO3 and δ11B) in a large mixed-use watershed in southern Alberta, Canada. Sci. Total Environ. 2019, 703, 135043. [Google Scholar] [CrossRef]
- Matiatos, I.; Lazogiannis, K.; Papadopoulos, A.; Skoulikidis, N.T.; Boeckx, P.; Dimitriou, E. Stable isotopes reveal organic nitrogen pollution and cycling from point and non-point sources in a heavily cultivated (agricultural) Mediterranean river basin. Sci. Total Environ. 2023, 901, 166455. [Google Scholar] [CrossRef]
- Soldatova, E.; Guseva, N.; Sun, Z.X.; Bychinsky, V.; Boeckx, P.; Gao, B. Sources and behaviour of nitrogen compounds in the shallow groundwater of agricultural areas (Poyang Lake basin, China). J. Contam. Hydrol. 2017, 202, 59–69. [Google Scholar] [CrossRef]
- Harris, S.J.; Cendon, D.I.; Hankin, S.I.; Peterson, M.A.; Xiao, S.; Kelly, B.F.J. Isotopic evidence for nitrate sources and controls on denitrification in groundwater beneath an irrigated agricultural district. Sci. Total Environ. 2022, 817, 152606. [Google Scholar] [CrossRef]
Disclaimer/Publisher’s Note: The statements, opinions and data contained in all publications are solely those of the individual author(s) and contributor(s) and not of MDPI and/or the editor(s). MDPI and/or the editor(s) disclaim responsibility for any injury to people or property resulting from any ideas, methods, instructions or products referred to in the content. |
© 2024 by the authors. Licensee MDPI, Basel, Switzerland. This article is an open access article distributed under the terms and conditions of the Creative Commons Attribution (CC BY) license (https://creativecommons.org/licenses/by/4.0/).