Article

LSTM Model Integrated Remote Sensing Data for Drought Prediction: A Study on Climate Change Impacts on Water Availability in the Arid Region

by
Haitham Abdulmohsin Afan
1,2,*,
Atheer Saleem Almawla
1,
Basheer Al-Hadeethi
1,
Faidhalrahman Khaleel
3,4,
Alaa H. AbdUlameer
5,
Md Munir Hayet Khan
2,
Muhammad Izzat Nor Ma’arof
2 and
Ammar Hatem Kamel
1,6
1
Upper Euphrates Basin Developing Center, University of Anbar, Anbar 31001, Iraq
2
Faculty of Engineering & Quantity Surveying (FEQS), INTI International University (INTI-IU), Persiaran Perdana BBN, Nilai 71800, Negeri Sembilan, Malaysia
3
Department of Civil Engineering, Atatürk University, 25240 Erzurum, Turkey
4
Ministry of Electricity, The State Company of Electricity Production GCEP Middle Region, 10009 Baghdad, Iraq
5
Building and Construction Techniques Engineering Department, College of Engineering and Engineering Techniques, Al-Mustaqbal University, 51001 Babylon, Iraq
6
Dams and Water Resources Engineering Department, College of Engineering, University of Anbar, Anbar 31001, Iraq
*
Author to whom correspondence should be addressed.
Water 2024, 16(19), 2799; https://doi.org/10.3390/w16192799
Submission received: 7 August 2024 / Revised: 5 September 2024 / Accepted: 6 September 2024 / Published: 1 October 2024
(This article belongs to the Section Water and Climate Change)

Abstract

:
Climate change is one of the trending terms in the world nowadays due to its profound impact on human health and activity. Extreme drought events and desertification are some of the results of climate change. This study utilized the power of AI tools by using the long short-term memory (LSTM) model to predict the drought index for Anbar Province, Iraq. The data from the standardized precipitation evapotranspiration index (SPEI) for 118 years have been used for the current study. The proposed model employed seven different optimizers to enhance the prediction performance. Based on different performance indicators, the results show that the RMSprop and Adamax optimizers achieved the highest accuracy (90.93% and 90.61%, respectively). Additionally, the models forecasted the next 40 years of the SPEI for the study area, where all the models showed an upward trend in the SPEI. In contrast, the best models expected no increase in the severity of drought. This research highlights the vital role of machine learning models and remote sensing in drought forecasting and the significance of these applications by providing accurate climate data for better water resources management, especially in arid regions like that of Anbar province.

1. Introduction

Drought and desertification are considered two of the most complicated extreme weather situations in comparison to other hazards or natural disasters [1]. They have a significant influence on peoples’ lives and their properties. Generally, they have a direct impact on reducing vegetation cover and decreasing soil and vegetation moisture. As a result, these effects lead to a decrease in crop productivity, shortage of water surfaces, and deterioration in the number of animals [2,3].
Drought can be defined as a decrease in precipitation for an extended period (season or more), leading to water scarcity that can affect agricultural or environmental activities [4]. It is a progressive process that starts with a lack of rainfall, which is expressed as a meteorological drought. It is divided into four categories: meteorological, agricultural, hydrological, and socioeconomic. Periods of low rainfall describe meteorological droughts and are the source of hydrological droughts [5]. Agricultural drought is the sharp decrease in soil moisture that leads to crop failure. Drought can develop and worsen, causing a socioeconomic drought related to natural water reserves. So, hydraulic structure projects that were designed by human action cannot satisfy the demand for water [6].
Therefore, if the drought is not evaluated promptly and the appropriate treatments are not adopted, it will severely impact the economies of the affected countries. Features of drought must be estimated accurately to plan optimal water resource management and usage for agricultural productivity [7]. According to the UN, Iraq is one of the most vulnerable regions to climate change. Most of the researchers in Iraq suffer from a lack of access to quantitative and qualitative climate data, which reflects the very few studies related to evidence and trends of climate change in the country [8,9,10,11,12]. Some of those studies have concluded that the diurnal temperature range has increased in recent decades over Iraq [13,14,15,16]. The main reason is that the maximum temperatures are warming at a higher rate than the minimum temperatures. Because of the scarcity of data on Iraq, remote sensing has become a better alternative to access information that is challenging to obtain by other means as it provides spatial and temporal benefits [17]. Recently, data extracted from various satellite-based platforms have been widely used in drought research. Moreover, algorithm development and improvement and cloud-based processing, as well as storage capacity, have considerably expanded the application potential of remote sensing for drought study. In addition to providing an autonomous experimental capability, remote sensing data can be used to minimize uncertainty, cost, modeling efforts, and time aimed at drought evaluations. In recent years, Iraq has witnessed the increasing intensity and frequency of severe events such as droughts, heat waves, sandstorms, and floods. Scientists refer to the effects of climate change as the cause of these events [18].
Climate change can be estimated by statistically significant changes in the average or variability of long-term climate parameters. It inevitably results in changes in climate variability and in the intensity, frequency, duration, timing, and spatial extent of extreme climate events [19]. Changes in the frequency or intensity of extreme climate events will have a more significant impact than changes in the average climate because these events are more sensitive to climate change than the average climate [20]. So, understanding extreme climate events is more urgent than tracking changes in the average climate during global warming. More than 100 drought indices are used to determine drought globally. Among all these drought indices, the standardized precipitation index (SPI) is one of the most widely used to identify and characterize drought in different regions around the world [21]. Because it is uncomplicated and easy to use or understand and calculate at various periods, SPI is recommended [22]. It uses few meteorological parameters (such as precipitation and temperature) and predicts both short- and long-term agricultural and meteorological droughts. Also, the SPI can be directly tied to short durations of soil moisture and related to reservoir storage as well as groundwater for more extended periods. Extreme climate indices can widely quantify the changes in extreme climate events in climate studies [23]. Globally, the number of warm days (or nights) shows an overall increasing trend in comparison with the numbers of cold days (or nights) that show an opposite trend in regions that have sufficient data [24].
On the other hand, machine learning (ML) approaches have been implemented extensively to address various environmental issues [3,25,26]. ML approaches made significant strides in predicting drought phenomena by providing an efficient performance in predicting SPEI values [27,28]. Fang et al. [29] explored the application of various ML algorithms in predicting drought conditions. The strength of these models relies on the simplicity of model construction, fewer data needed for model construction, fast performance, lower computational cost, and performance comparable to or better than physical models [30,31]. The time series technique and ML are considered the traditional approaches to predicting drought. On the other hand, deep learning (DL) approaches, which are a subset of ML, show substantial potential in unveiling the complex relationship between drought and its parameters, providing deep insight into its patterns and behavior. Additionally, with regard to series prediction, long short-term memory (LSTM) and one-dimensional convolutional neural network (1D CNN) are considered more effective in this regard [31,32,33,34]. However, utilizing DL algorithms to predict drought is relatively uncommon. A. Dikshit et al. [35] utilized the LSTM model to predict drought indices (SPEI-1 and SPEI-3) for the years 1901–2018 in New South Wales in Australia based on several parameters, such as precipitation, evapotranspiration, temperature, cloud cover, and vapor pressure. Following the same concept, another study utilized hydrometeorological and climatic variables to predict the SPEI in Australia [36]. Another study by S. Poornima [28] utilizes the LSTM model to predict drought indices (SPI and SPEI) for the period of 1958–2014. Finally, based on remote sensing data, R. Shen et al. [37] utilized the LSTM model to predict the SPEI for 2001–2013 in Wuhan, China.
In the present study, remote sensing techniques and satellite images were used to determine the impact of climate change on drought in Anbar Governorate, western Iraq, by knowing and estimating drought indices in order to find solutions to the problems of drought resulting from climate change and to compensate for the lack of data and measurements in the region, which requires effort, time, and high costs. Furthermore, this study explores the application of the deep learning presented in long short-term memory (LSTM) in predicting the SPEI in arid regions. Moreover, to increase the prediction accuracy of the adopted model, seven different optimizers have been implemented to select the one that offers the best performance.
The importance of the Anbar Desert is presented by its vast area, which includes many valleys; hence, this plays an essential role in terms of water availability and climate resilience for local people and ecosystems. Possible changes in the climate may lead to a severe lack of water, affecting agriculture and livelihoods amongst the locals, and they may further lead to broader ecological changes. The present study provides some of the missing knowledge on climate extremes in arid regions in Anbar province and is developed to (a) study and analyze trends in the indices of temperature and precipitation (monthly) in Iraqi arid regions (Anbar) and (b) study the temporal variation in these extremes to provide a critical database to support studies on climate extremes in arid and semi-arid regions.

2. Case Study, Data Acquisition, and Description

Anbar province, as shown in Figure 1, with 138.57 km 2 total area, located in the arid region of western Iraq with a 33.43 ° N latitude and 43.33 ° E longitude, is a critical area facing significant challenges due to climate change. Anbar province has an average altitude of 384.64 m, with extreme average temperatures ranging from 40 in the summer to 9 in the winter. A harsh subtropical desert climate characterizes Anbar province, with scarce precipitation, great contrasting temperatures between day and night, and a relative humidity between 19 and 82%. Winds are south-westerly and north-westerly, with a maximum speed of about 21 m/s. The rainy season is from September to May, with an average annual rainfall of about 115 mm [38,39]. A percentage of 49.5% of this rainfall occurs between November and January, 36.3% between February and April, and 14.8% between September and October. The average annual evaporation is of about 3000 mm, which raises the dryness coefficient (evaporation/rain) by 25–35.
With its unique geographic, climatic, and environmental characteristics, Anbar is particularly vulnerable to the effects of climate change, including rising temperatures, changing rainfall patterns, and increased drought. These changes can have severe consequences on the availability of water resources and exacerbate drought conditions, posing a significant threat to both the environment and the livelihoods of local communities. The original data are presented in monthly SPEI records for the years 1903–2021 obtained from the Earth Engine Data Catalog website [40]. For model development, the data were divided into two parts: training data, which present the records from 1903 to 1997, and testing part, which present the records from 1998 to 2021. Some statistical characteristics of the data are presented in Figure 2. The maximum value of the SPEI (2.54) was recorded in 1980, while the lowest value of the SPEI (−2.14) was in 2000, where this year showed a high drop in the value of the SPEI due to climate change and desertification in the region. Other statistics, such as the average, the median, and the data distribution over the quartiles, have been shown in Figure 2. Simple processing of the data was conducted to show the trend, seasonality, and residual. Furthermore, the trend was found by applying the moving average technique to the observed data. Meanwhile, seasonality was obtained by utilizing the average of the data for the monthly period over all cycles. Finally, the residual calculation was obtained by subtracting the trend and the seasonal component from the observed data.
It is clear from the figures that there has been a steep drop in the trend, especially in the last twenty years. After removing the trend from the data, the seasonality of the data shows systematic changes over the years, with minimal values of about ± 0.005, and this systematic behavior is due to the repetitive cycles of drought over the year. Finally, the residuals highlight the fluctuation of data over time, where it is seen from the figure that the highest variation started from 1944 to 1994. By analyzing the extreme drought event that was recorded below, the lowest quartile was around the year 1960, the second lowest was in 1980, and the third was in 2000, which is the most extreme drought. Thus, every 20 years, a new lowest value is recorded. It was expected that this would happen in 2020, where the data show less severity in terms of drought for this year due to the lockdown as a result of the Coronavirus pandemic. Here, it can be concluded that the study area is susceptible to global climate change in spite of low human activity in the study area.

3. Methodology

3.1. SPEI Calculation

The World Metrological Organization (WMO) in 2009 endorsed the standardized precipitation evapotranspiration index (SPEI) as the primary meteorological drought indicator, presenting nations worldwide with a powerful tool to monitor and assess various drought conditions [41] at various time scales (1, 3, 6, 9, 12, and 24 months) [42]. The SPEI utilizes the variance between precipitation and evapotranspiration as a metric to characterize drought at the regional level [43]. The SPEI is calculated using the following procedure.
D r = P r ET r
D n k = r = 0 k 1 ( P n r ET n r ) ,   n k
where D r denotes the monthly water balance, and P r and ET r are the monthly precipitation and potential monthly evapotranspiration, respectively. k = 6 for SPEI-6 denotes the aggregation timescale, and n is the sixth month for June. Given the scale ( α ), shape ( β ), and location parameters ( γ ), the cumulative distribution function F x is calculated as follows:
F x = 1 + α x γ β 1
The probability (P) for definite D r is as follows:
P = 1 F x
For P 0.5 ,
w = 2 ln P  
SPEI = w C 2 w + C 1 w + C 0 1 + D 3 W + D 2 w + D 1 w
For P > 0.5 ,
w = 2 ln 1 P
SPEI = w C 2 w + C 1 w + C 0 1 + D 3 W + D 2 w + D 1 w
where C 0 = 2.515517 , C 1 = 0.802853 , C 2 = 0.010328 , D 1 = 1.432788 , D 2 = 0.189269 , and D 3 = 0.001308 . The classification of drought levels utilizing the SPEI is depicted in Table 1.

3.2. Long Short-Term Memory

The long short-term memory network (LSTM) is a form of recurrent neural network (RNN) designed specifically for learning long-term relationships in sequential input. LSTM was proposed in 1997 by Hochreiter and Schmidhuber [45] to solve the issue of blowing up or declining error backflow in original RNNs. LSTM uses many recurrently linked blocks to regulate the memory of each neural layer. These memory blocks are made up of three major components: input, output, and forget gates. The gates are multiplicative units that may be activated or deactivated in order to regulate the error flow [46]. Figure 3 depicts a schematic illustration of a typical LSTM model [47]. In this figure, the (Xt) represents the time t input sequence, (ht) is the time t output of the LSTM network cells, and σ and (tanh) are the sigmoid and tanh activation functions, respectively.
The equations for calculating each component in the LSTM model can be expressed in Equations (9)–(14) [48].
f t =   σ     W f .   SPEI t 1 ,   SPEI t +   b f
i t =   σ   ( W i .   SPEI t 1 ,   SPEI t + b i
C t ˜ = tanh ( W c   .   SPEI t 1 ,   SPEI t + b c
C t = f t .   SPEI C t 1 i t .   C t ˜
o t =   σ   ( W o .   SPEI t 1 ,   SPEI t + b o
h t = o t . tanh C t  
where a forget gate is denoted by the symbol (f). (t) represents the time step. Meanwhile, ( W f   ,   W i   ,   W c   ,   W o ) represent the weight matrices for the forgetting, inputs, cell, and outputs gate, respectively. (b) is a bias vector. The (tanh and σ) denote the hyperbolic tangent and sigmoid activation functions, respectively, which can be computed by using Equations (15) and (16). The old cell state (Ct − 1) is updated to the new cell state (Ct).
σ x = 1 1 + e x  
tanh x = e x e x e x + e x    
The training process of the LSTM involves setting the number of epochs to 100, ensuring sufficient iteration to the network to capture underlying patterns in the data. Furthermore, a look-back period of 48 months is considered for the prediction process to capture long-term dependencies efficiently.

4. Result and Discussion

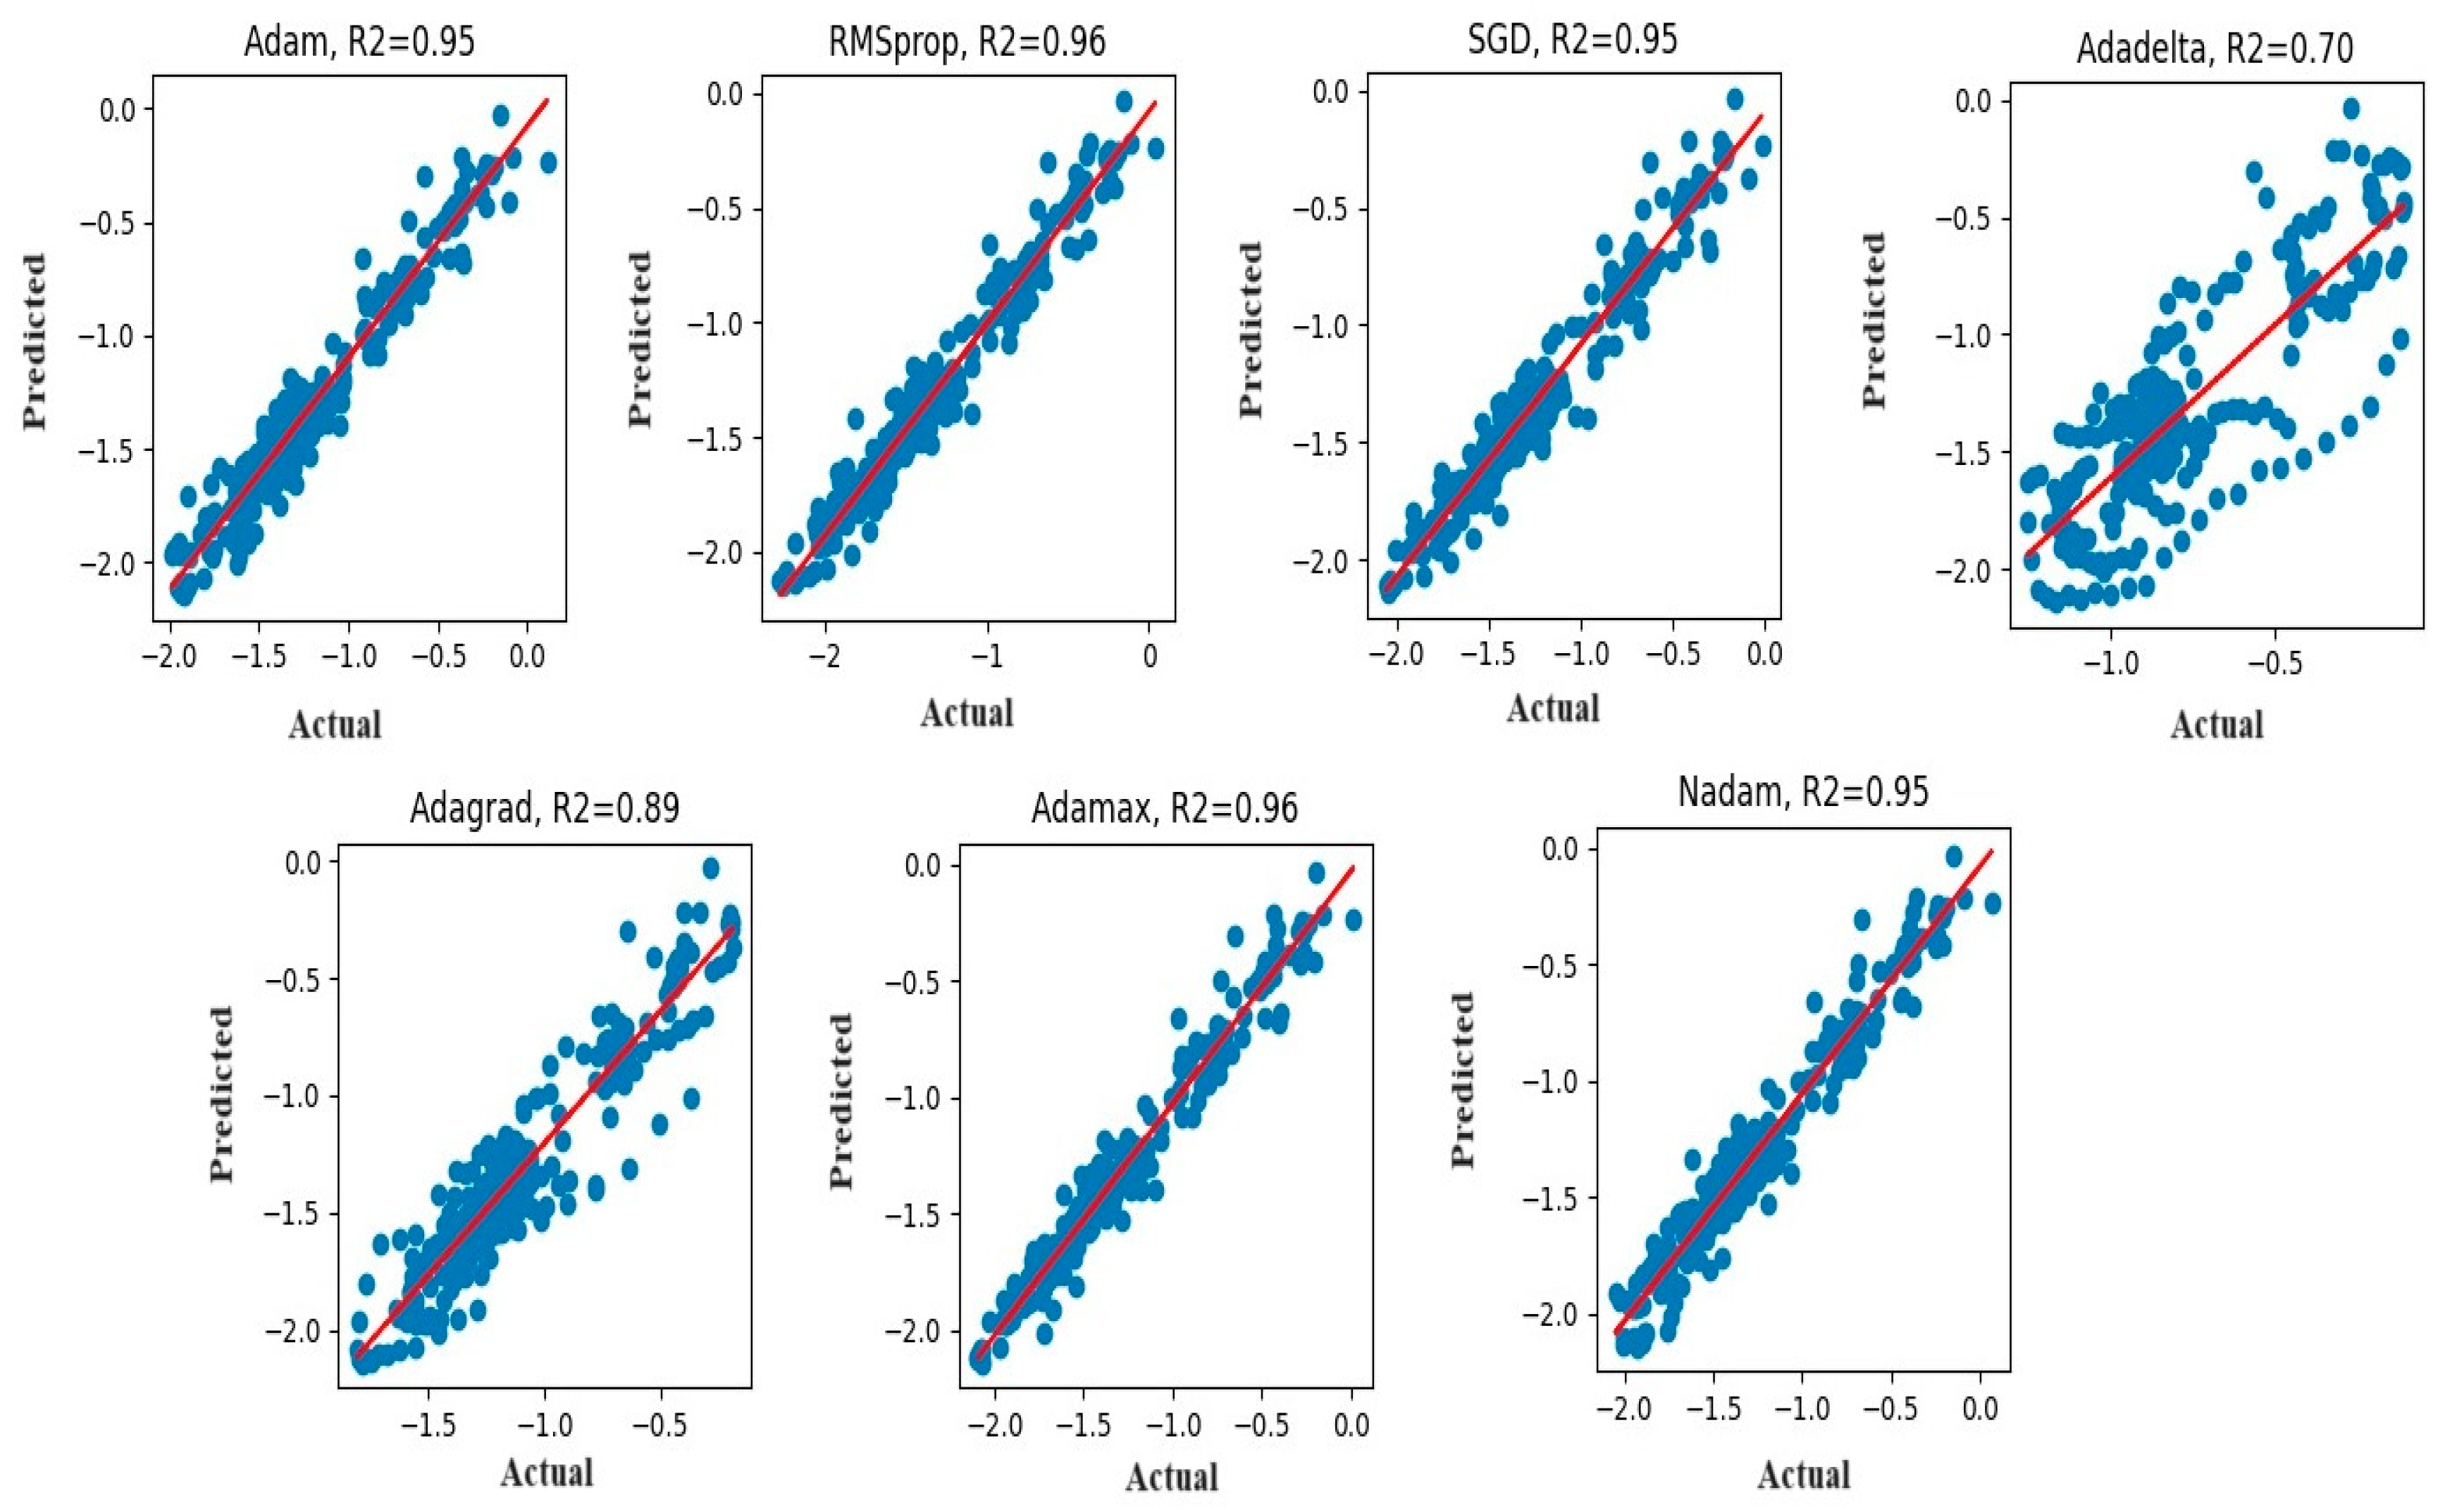
In the current study, a new model is presented to investigate the data set of the standardized precipitation evapotranspiration index (SPEI) for 118 years and to forecast the drought for 40 years in Anbar Province. This model employed the long short-term memory (LSTM) model as a robust AI tool for this purpose. The forecasting is applied in an arid region that is characterized by extreme weather conditions with prolonged drought periods and short light rain seasons. Despite the powerful models that other researchers have introduced, some of these models were applied in semi-arid regions, were applied with large timescales, or did not include optimizers that could improve the forecasting result [28,35,49,50,51,52]. In the current study, the drought conditions were investigated by utilizing the long short-term memory (LSTM) model. Seven optimizers were adopted to enhance the model’s performance for drought prediction. The modeling process was performed using the Keras package in Python, and the models were run using the Google colab T4 processor. Figure 4 shows the scatter plot of the comparisons between the predicted result and actual observations for the SPEI for each optimizer. To analyze each optimizer’s efficiency, the Pearson correlation coefficient (R2) is adopted. It was found that the model with the RMSprop optimizer and Adamax optimizer has the highest value of R2 = 0.96, indicating that the model is able to explain 96% of the variance in data, demonstrating the highest performance. The lowest performance was found when the Adadelta optimizer was adopted, with R2 = 0.7, showing the model’s ability to explain only 70% of the variance in the data. A good performance was introduced by the Adam optimizer, SGD optimizer, and Nadam optimizer with R2 = 0.95.
More investigations were executed to assess the efficiency of the optimizers and to find the most efficient optimizer capable of enhancing the performance of the LSTM model. For that purpose, four different performance indicators, such as Relative error (RE), Mean Absolute Error (MAE), Root Mean Square Error (RMAE), and Mean Bias Error (MBE), were employed.
Table 2 demonstrates the performance indicator values that were chosen to assess the efficiency of each optimizer. It was found that model accuracy was at the lowest level when the Adadelta optimizer was employed. It is recorded as 55.29%. The performance indicators MAE, RMAE, and MBE have high values, which are greater than 0.5, while RE = −44.7053%, which is a very low value, indicating that there is significant variance between the actual and predicted values. Better accuracy was found when the Adagrad optimizer was utilized. The result shows a 23.3% improvement in the model accuracy, and the performance indicators were enhanced to about 50% compared to the Adadelta optimizer. Good improvement in the model accuracy was achieved when the Adam optimizer, SGD optimizer, and Nadam optimizer were utilized. These optimizers enhanced the performance indicators values and increased the model accuracy to approximately 87.32%, 88.17%, and 89.15%, respectively.
The highest accuracy in model performance was achieved with the RMSprop optimizer and Adamax optimizer, in which the values were 90.63% and 90.61%, respectively. In the case of the RMSprop optimizer, the MEB is −0.01992, which indicates that the performance is underestimated, while it is found to be overestimated in the case of the Adamax optimizer. Despite that, model accuracy with the RMSprop optimizer outperforms the Adamax optimizer case, but the RMSE and MAE indicators show higher values for the first case. The RE indicator has a better value in the case of the RMSprop optimizer than in the Adamax optimizer’s case. The comparison of the performance indicators shows the superiority of the model that employed the RMSprop optimizer.
Table 3 demonstrates the statistical analysis of the actual values compared to the predicted result with different optimizers. In this compression, six statistical indicators, mean values, median value, standard deviation, sample variance, kurtosis, and skewness were utilized. It is obvious that the model with the Adadelta optimizer had the most significant difference in values compared to the actual values. The result shows gradual improvement in the model with the Adagrad optimizer, Adam optimizer, SGD optimizer, and Nadam optimizer, respectively. The best results were obtained when the RMSprop optimizer and Adamax optimizer were employed. The results indicate the supremacy of the RMSprop optimizer over all optimizers.
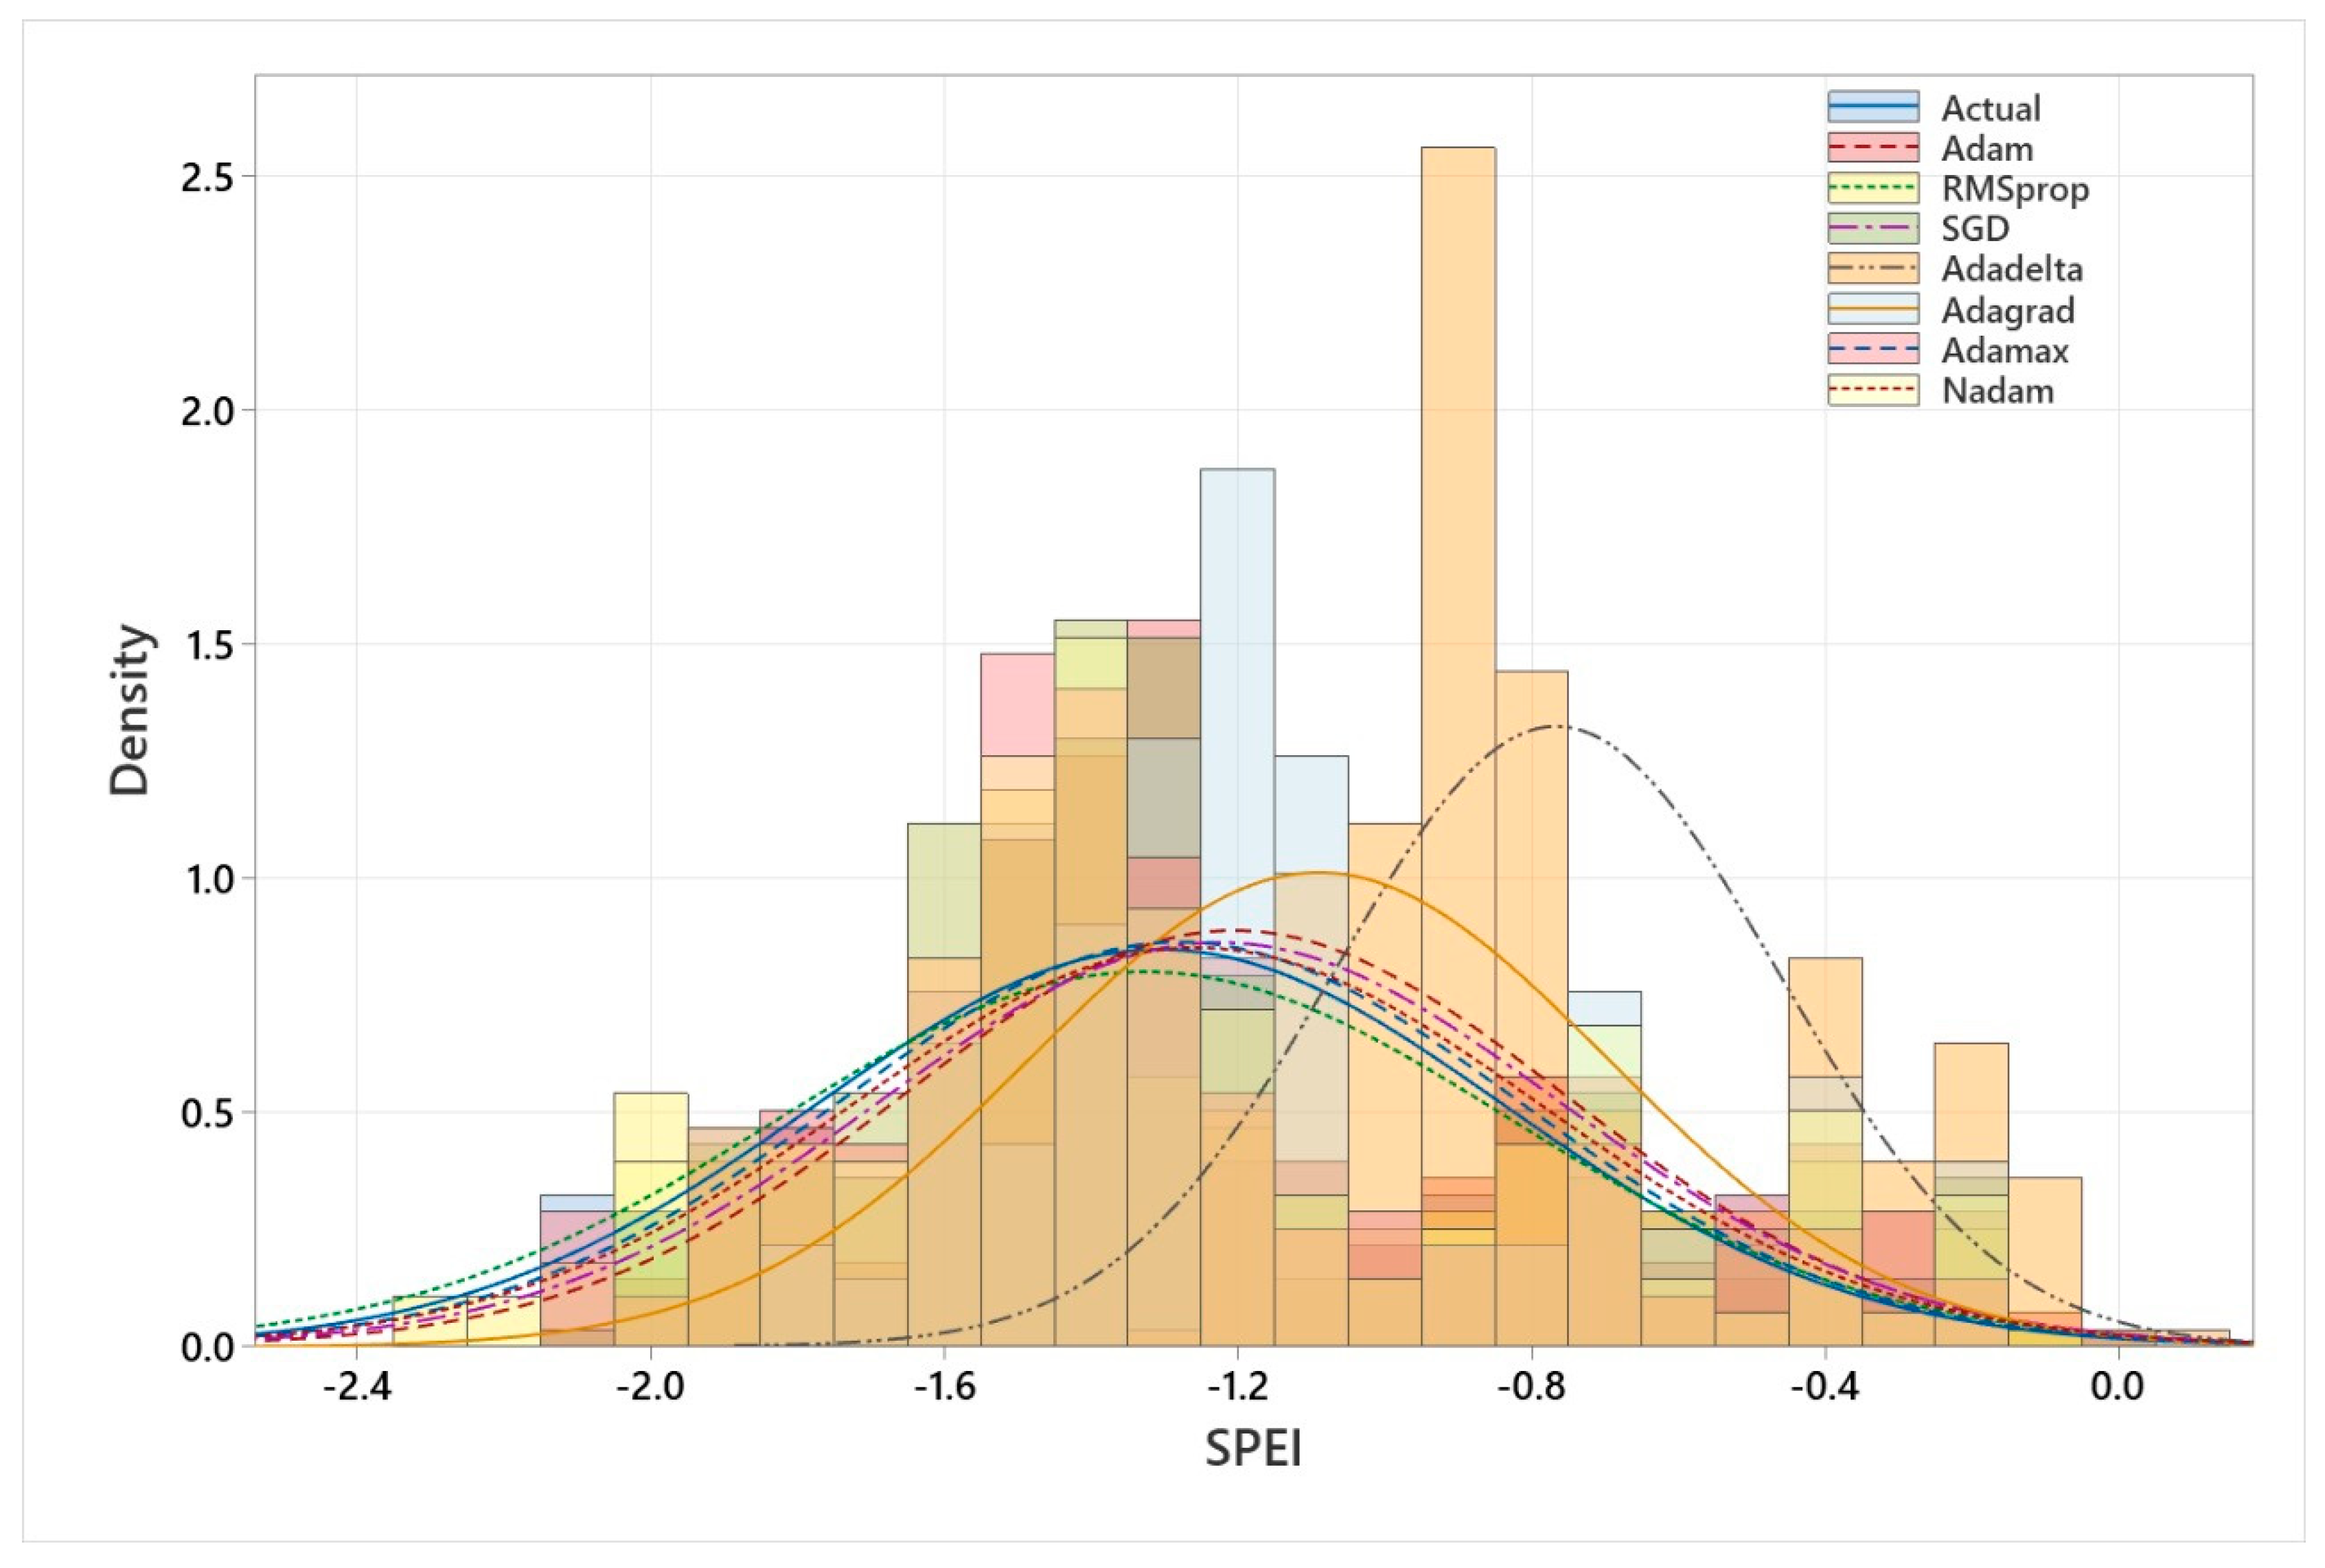
Figure 5 demonstrates the normal distribution of each optimizer’s results in comparison to the actual data. It was found that the Adamax optimizer and RMSprop optimizer have bell curves similar to the actual data, where their mean values are equal to −1.3. The Adagrad optimizer and Adadelta optimizer show different bell curves where the mean values equal −1.1 and −0.75, respectively.
To demonstrate the forecast comparison of the model with different optimizers, Figure 6 was introduced. The figure shows the forecasting of the drought for a 40-year period beginning in 2023 and ending in 2063. The models indicate that the increase in values occurs despite the fact that these values are not going to reach the zero value, where the drought vanishes. The Adagrad optimizer, the purple curve, shows the lowest drought values during the next 40 years. Similarities in tendencies were found for the Adadelta optimizer, the red curve, and the SGD optimizer, the green curve. An extreme drought period was found for the Adam optimizer, the blue curve, in 2025, and then it declined with noticeable fluctuations until 2044. After that, the curve began to smooth. The model with the Nadam optimizer, the pink curve, shows a decrease in drought values. The RMSprop optimizer, the orange curve, and the Adamax optimizer, the brown curve, indicate very close value forecasts. The two forecasted curves were plotted parallelly despite the difference in the two time periods. The first time period where the Adamax model shows higher drought values was found to have started in 2023 and ended in 2036. Meanwhile, the RMSprop model shows lower values during the period from 2047 to 2063. Generally, both the RMSprop model and the Adamax model produced more trusted results.

5. Conclusions

This study used the capability of remote sensing in data collection and machine learning in the prediction of the SPEI of an arid region. The LSTM neural network model shows superior performance in the prediction of a long time series over 118 years of data and could capture the pattern of high nonlinearity in the SPEI data. The RMSprop and Adamax optimizers accomplished the highest accuracy, with 90.63% and 90.61%. This study approved the proposed methodology, which provided an accurate vision for the future of drought in the region despite the limitation of climate data availability. Here, it can be concluded that the integration of remote sensing and machine learning is one of the best ways to tackle climate change prediction. It is recommended to include additional climatic variables and expand the study area, which may increase the model’s performance and allow it to become more generalized. Hence, it can be carried out by studying the impact of drought prediction on water resources management, human activities, and agriculture productivity, which can help in developing strategies for mitigating drought and desertification in the region. Based on the results of this study, it is essential for future studies to detect vulnerable areas that are affected by severe drought by utilizing spatial data.

Author Contributions

Conceptualization, H.A.A. and F.K.; data curation, B.A.-H.; formal analysis, H.A.A., A.H.A. and A.H.K.; investigation, A.S.A.; methodology, B.A.-H.; resources, A.S.A. and A.H.A.; supervision, M.I.N.M. and A.H.K.; visualization, M.M.H.K.; writing—original draft, H.A.A.; writing—review and editing, F.K., M.M.H.K. and M.I.N.M. All authors have read and agreed to the published version of the manuscript.

Funding

This research is funded by INTI International University.

Data Availability Statement

Data will be available upon request.

Acknowledgments

The authors would like to thank Al-Mustaqbal University and the University of Anbar for partially supported this research.

Conflicts of Interest

Faidhalrahman Khaleel was employed by the Ministry of Electricity, The State Company of Electricity Production GCEP Middle Region, Baghdad, Iraq. The remaining authors declare that the research was conducted in the absence of any commercial or financial relationships that could be construed as a potential conflict of interest.

References

  1. Sayl, K.N.; Sulaiman, S.O.; Kamel, A.H.; Muhammad, N.S.; Abdullah, J.; Al-Ansari, N. Minimizing the Impacts of Desertification in an Arid Region: A Case Study of the West Desert of Iraq. Adv. Civ. Eng. 2021, 2021, 5580286. [Google Scholar] [CrossRef]
  2. Kolawole, E.S.; Okonkwo, W.I. Impacts of Climate Change on Environment and the Remedies. Int. J. Weather Clim. Chang. Conserv. Res. 2022, 8, 1–9. [Google Scholar] [CrossRef]
  3. Afan, H.A.; Mohtar, W.H.M.W.; Aksoy, M.; Ahmed, A.N.; Khaleel, F.; Khan, M.H.; Kamel, A.H.; Sherif, M.; El-Shafie, A. Geneticizing input selection based advanced neural network model for sediment prediction in different climate zone. Ain Shams Eng. J. 2024, 15, 102760. [Google Scholar] [CrossRef]
  4. Oukaddour, K.; Le Page, M.; Fakır, Y. Toward a Redefinition of Agricultural Drought Periods—A Case Study in a Mediterranean Semi-Arid Region. Remote Sens. 2023, 16, 83. [Google Scholar] [CrossRef]
  5. de Jesus, E.T.; Amorim, J.d.S.; Junqueira, R.; Viola, M.R.; de Mello, C.R. Meteorological and hydrological drought from 1987 to 2017 in doce river basin, Southeastern Brazil. Rev. Bras. Recur. Hidricos 2020, 25, 1–10. [Google Scholar] [CrossRef]
  6. Almawla, A.S.; Kamel, A.H.; Lateef, A.M. Modelling of Flow Patterns over Spillway with CFD (Case Study: Haditha Dam in Iraq). Int. J. Des. Nat. Ecodynamics 2021, 16, 373–385. [Google Scholar] [CrossRef]
  7. Nagpal, M.; Heilemann, J.; Klauer, B.; Gawel, E.; Klassert, C.; Nagpal, M.; Heilemann, J.; Klauer, B.; Gawel, E.; Klassert, C. Hydro-economic assessment of biophysical drought impacts on agriculture. In Proceedings of the EGU General Assembly 2024, Vienna, Austria, 14–19 April 2024. EGU24-17486. [Google Scholar]
  8. Kamel, A.H.; Afan, H.A.; Sherif, M.; Ahmed, A.N.; El-Shafie, A. RBFNN versus GRNN modeling approach for sub-surface evaporation rate prediction in arid region. Sustain. Comput. Inform. Syst. 2021, 30, 100514. [Google Scholar] [CrossRef]
  9. Sulaiman, S.O.; Kamel, A.H.; Sayl, K.N.; Alfadhel, M.Y. Water resources management and sustainability over the Western desert of Iraq. Environ. Earth Sci. 2019, 78, 495. [Google Scholar] [CrossRef]
  10. Al-Salihi, Z.A.; Kamel, A.H.; Abdulhameed, I.M. Effects of the Climate Change on the Tigris River Basin in Iraq. Int. J. Des. Nat. Ecodynamics 2022, 17, 585–593. [Google Scholar] [CrossRef]
  11. Jaafar, Q.N.; Sayl, K.N.; Kamel, A.H. Numerical Modelling of River Training Work: A review. IOP Conf. Ser. Earth Environ. Sci. 2023, 1222, 12010. [Google Scholar] [CrossRef]
  12. Al-Salihi, Z.A.; Kamel, A.H.; Abdulhameed, I.M. Effect of Climate Changes on Water Resources in Iraq: A Review Study. AIP Conf. Proc. 2024, 3009, 030079. [Google Scholar] [CrossRef]
  13. Hakeem, M.; Abu-Alshaeer, M.; Ahemd, M. Impact of Land Surface Changes on Air Temperatures in Baghdad City. Kuwait J. Sci. 2020, 47, 118–126. [Google Scholar]
  14. Salman, S.A.; Shahid, S.; Ismail, T.; Chung, E.-S.; Al-Abadi, A.M. Long-term trends in daily temperature extremes in Iraq. Atmos. Res. 2017, 198, 97–107. [Google Scholar] [CrossRef]
  15. KA, A.S.H. Analysis of some extreme temperature indices over Iraq. MAUSAM 2020, 71, 423–430. [Google Scholar]
  16. Mohammed, A.S.; Al-Hadeethi, B.; Almawla, A.S. Daily Evapotranspiration Prediction at Arid and Semiarid Regions by Using Multiple Linear Regression Technique at Ramadi City in Iraq Region. IOP Conf. Ser. Earth Environ. Sci. 2023, 1222, 12033. [Google Scholar] [CrossRef]
  17. Yehia, M.A.; Al-Taai, O.T.; Ibrahim, M.K. Spatiotemporal Distribution of Minimum-Maximum Temperature over Iraq for the Period (1980–2017). IOP Conf. Ser. Earth Environ. Sci. 2022, 1060, 012026. [Google Scholar] [CrossRef]
  18. Mohammed, D.R.; Mohammed, R.K. Climate Change’s Impacts on Drought in Upper Zab Basin, Iraq: A Case Study. Tikrit J. Eng. Sci. 2024, 31, 161–171. [Google Scholar] [CrossRef]
  19. Zorko, M.; Kovač, I.; Kovač, S.; Stanko, D.; Pandzic, K. Impact of global warming onaverage annual air temperature in Varaždin. Environ. Eng. 2022, 9, 95–103. [Google Scholar] [CrossRef]
  20. Alves, L.M.; Fowler, H.; de Jesus da Costa Barreto, N.; Llopart, M. Climate Change and Climate Variability. In Precipitation: Earth Surface Responses and Processes; Elsevier: Amsterdam, The Netherlands, 2021; pp. 53–68. ISBN 9780128226995. [Google Scholar] [CrossRef]
  21. Faiz, M.A.; Zhang, Y.; Tian, X.; Tian, J.; Zhang, X.; Ma, N.; Aryal, S. Drought index revisited to assess its response to vegetation in different agro-climatic zones. J. Hydrol. 2022, 614, 128543. [Google Scholar] [CrossRef]
  22. Singh, I.; Mishra, A.K.; Suryavanshi, S.; Sherring, A.; Kumar, M. A Comparison of the Frequency and Intensity of Standardized Precipitation Index (SPI) and the Rainfall Anomaly Index (RAI) during the Meteorological Drought across Harohar-Punpun Basin (India). Int. J. Environ. Clim. Chang. 2024, 14, 36–47. [Google Scholar] [CrossRef]
  23. Madonna, F.; Essa, Y.H.; Marra, F.; Serva, F.; Gardiner, T.; Sarakhs, F.K.; Tramutola, E.; Rosoldi, M. Uncertainties on Climate Extreme Indices Estimated from U.S. Climate Reference Network (USCRN) Near-Surface Temperatures. J. Geophys. Res. Atmos. 2023, 128, e2022JD038057. [Google Scholar] [CrossRef]
  24. Almawla, A.S.; Al-Hadeethi, B.; Mohammed, A.S.; Kamel, A.H. Predictive Modeling of Daily Evapotranspiration in Arid Regions Using Artificial Neural Networks. Int. J. Des. Nat. Ecodynamics 2024, 19, 955–962. [Google Scholar] [CrossRef]
  25. Hameed, M.M.; Khaleel, F.; Khaleel, D. Employing a robust data-driven model to assess the environmental damages caused by installing grouted columns. In Proceedings of the 2021 Third International Sustainability and Resilience Conference: Climate Change, Sakheer, Bahrain, 15–17 November 2021; pp. 305–309. [Google Scholar]
  26. Alawsi, M.A.; Zubaidi, S.L.; Al-Ansari, N.; Al-Bugharbee, H.; Ridha, H.M. Tuning ANN hyperparameters by CPSOCGSA, MPA, and SMA for short-term SPI drought forecasting. Atmosphere 2022, 13, 1436. [Google Scholar] [CrossRef]
  27. Yang, W.; Doulabian, S.; Shadmehri Toosi, A.; Alaghmand, S. Unravelling the Drought Variance Using Machine Learning Methods in Six Capital Cities of Australia. Atmosphere 2023, 15, 43. [Google Scholar] [CrossRef]
  28. Poornima, S.; Pushpalatha, M. Drought prediction based on SPI and SPEI with varying timescales using LSTM recurrent neural network. Soft Comput. 2019, 23, 8399–8412. [Google Scholar] [CrossRef]
  29. Fung, K.F.; Huang, Y.F.; Koo, C.H.; Soh, Y.W. Drought forecasting: A review of modelling approaches 2007–2017. J. Water Clim. Chang. 2020, 11, 771–799. [Google Scholar] [CrossRef]
  30. Al Moteri, M.; Alrowais, F.; Mtouaa, W.; Aljehane, N.O.; Alotaibi, S.S.; Marzouk, R.; Hilal, A.M.; Ahmed, N.A. An enhanced drought forecasting in coastal arid regions using deep learning approach with evaporation index. Environ. Res. 2024, 246, 118171. [Google Scholar] [CrossRef]
  31. Mohammadi, B. Modeling various drought time scales via a merged artificial neural network with a firefly algorithm. Hydrology 2023, 10, 58. [Google Scholar] [CrossRef]
  32. Zhou, Y.; Chang, F.-J.; Chang, L.-C.; Kao, I.-F.; Wang, Y.-S. Explore a deep learning multi-output neural network for regional multi-step-ahead air quality forecasts. J. Clean. Prod. 2019, 209, 134–145. [Google Scholar] [CrossRef]
  33. Sayeed, A.; Choi, Y.; Eslami, E.; Lops, Y.; Roy, A.; Jung, J. Using a deep convolutional neural network to predict 2017 ozone concentrations, 24 hours in advance. Neural Netw. 2020, 121, 396–408. [Google Scholar] [CrossRef]
  34. Son, H.; Kim, C. A deep learning approach to forecasting monthly demand for residential–sector electricity. Sustainability 2020, 12, 3103. [Google Scholar] [CrossRef]
  35. Dikshit, A.; Pradhan, B.; Huete, A. An improved SPEI drought forecasting approach using the long short-term memory neural network. J. Environ. Manag. 2021, 283, 111979. [Google Scholar] [CrossRef] [PubMed]
  36. Dikshit, A.; Pradhan, B.; Alamri, A.M. Long lead time drought forecasting using lagged climate variables and a stacked long short-term memory model. Sci. Total Environ. 2021, 755, 142638. [Google Scholar] [CrossRef] [PubMed]
  37. Shen, R.; Huang, A.; Li, B.; Guo, J. Construction of a drought monitoring model using deep learning based on multi-source remote sensing data. Int. J. Appl. Earth Obs. Geoinf. 2019, 79, 48–57. [Google Scholar] [CrossRef]
  38. Mohammed, S.S.; Sayl, K.N.; Kamel, A.H. Ground Water Recharge Mapping in Iraqi Western Desert. Int. J. Des. Nat. Ecodynamics 2022, 17, 913–920. [Google Scholar] [CrossRef]
  39. Mohammed, S.S.; Sayl, K.N.; Kamel, A.H. Modeling of Spatially Distributed Soil Moisture in the Iraqi Western Desert. AIP Conf. Proc. 2024, 3009, 030058. [Google Scholar] [CrossRef]
  40. SPEIbase: Standardised Precipitation-Evapotranspiration Index database, Version 2.8 [Deprecated]. Earth Engine Data Catalog. Google for Developers. Available online: https://developers.google.com/earth-engine/datasets/catalog/CSIC_SPEI_2_8 (accessed on 13 April 2024).
  41. Xu, D.; Zhang, Q.; Ding, Y.; Zhang, D. Application of a hybrid ARIMA-LSTM model based on the SPEI for drought forecasting. Environ. Sci. Pollut. Res. 2022, 29, 4128–4144. [Google Scholar] [CrossRef]
  42. Vicente-Serrano, S.M.; Beguería, S.; López-Moreno, J.I. A multiscalar drought index sensitive to global warming: The standardized precipitation evapotranspiration index. J. Clim. 2010, 23, 1696–1718. [Google Scholar] [CrossRef]
  43. Bo, M.; Guo, Y.; Tao, H.; Liu, G.; Li, S.; Pu, W. SPEIPM-Based research on drought impact on maize yield in North China Plain. J. Integr. Agric. 2015, 14, 660–669. [Google Scholar]
  44. Rhee, J.; Im, J. Meteorological drought forecasting for ungauged areas based on machine learning: Using long-range climate forecast and remote sensing data. Agric. For. Meteorol. 2017, 237–238, 105–122. [Google Scholar] [CrossRef]
  45. Hochreiter, S.; Schmidhuber, J. Long Short-Term Memory. Neural Comput. 1997, 9, 1735–1780. [Google Scholar] [CrossRef]
  46. Liu, M.-D.; Ding, L.; Bai, Y.-L. Application of hybrid model based on empirical mode decomposition, novel recurrent neural networks and the ARIMA to wind speed prediction. Energy Convers. Manag. 2021, 233, 113917. [Google Scholar] [CrossRef]
  47. Ding, Y.; Yu, G.; Tian, R.; Sun, Y. Application of a Hybrid CEEMD-LSTM Model Based on the Standardized Precipitation Index for Drought Forecasting: The Case of the Xinjiang Uygur Autonomous Region, China. Atmosphere 2022, 13, 1504. [Google Scholar] [CrossRef]
  48. Vo, T.Q.; Kim, S.-H.; Nguyen, D.H.; Bae, D.-H. LSTM-CM: A hybrid approach for natural drought prediction based on deep learning and climate models. Stoch. Environ. Res. Risk Assess. 2023, 37, 2035–2051. [Google Scholar] [CrossRef]
  49. Shang, J.; Zhao, B.; Hua, H.; Wei, J.; Qin, G.; Chen, G. Application of informer model based on SPEI for drought forecasting. Atmosphere 2023, 14, 951. [Google Scholar] [CrossRef]
  50. Tao, H.; Abba, S.I.; Al-Areeq, A.M.; Tangang, F.; Samantaray, S.; Sahoo, A.; Siqueira, H.V.; Maroufpoor, S.; Demir, V.; Dhanraj Bokde, N.; et al. Hybridized Artificial Intelligence Models with Nature-Inspired Algorithms for River Flow Modeling: A Comprehensive Review, Assessment, and Possible Future Research Directions. Eng. Appl. Artif. Intell. 2024, 129, 107559. [Google Scholar] [CrossRef]
  51. Yalçın, S.; Eşit, M.; Çoban, Ö. A new deep learning method for meteorological drought estimation based-on standard precipitation evapotranspiration index. Eng. Appl. Artif. Intell. 2023, 124, 106550. [Google Scholar] [CrossRef]
  52. Taylan, E.D. An Approach for Future Droughts in Northwest Türkiye: SPI and LSTM Methods. Sustainability 2024, 16, 6905. [Google Scholar] [CrossRef]
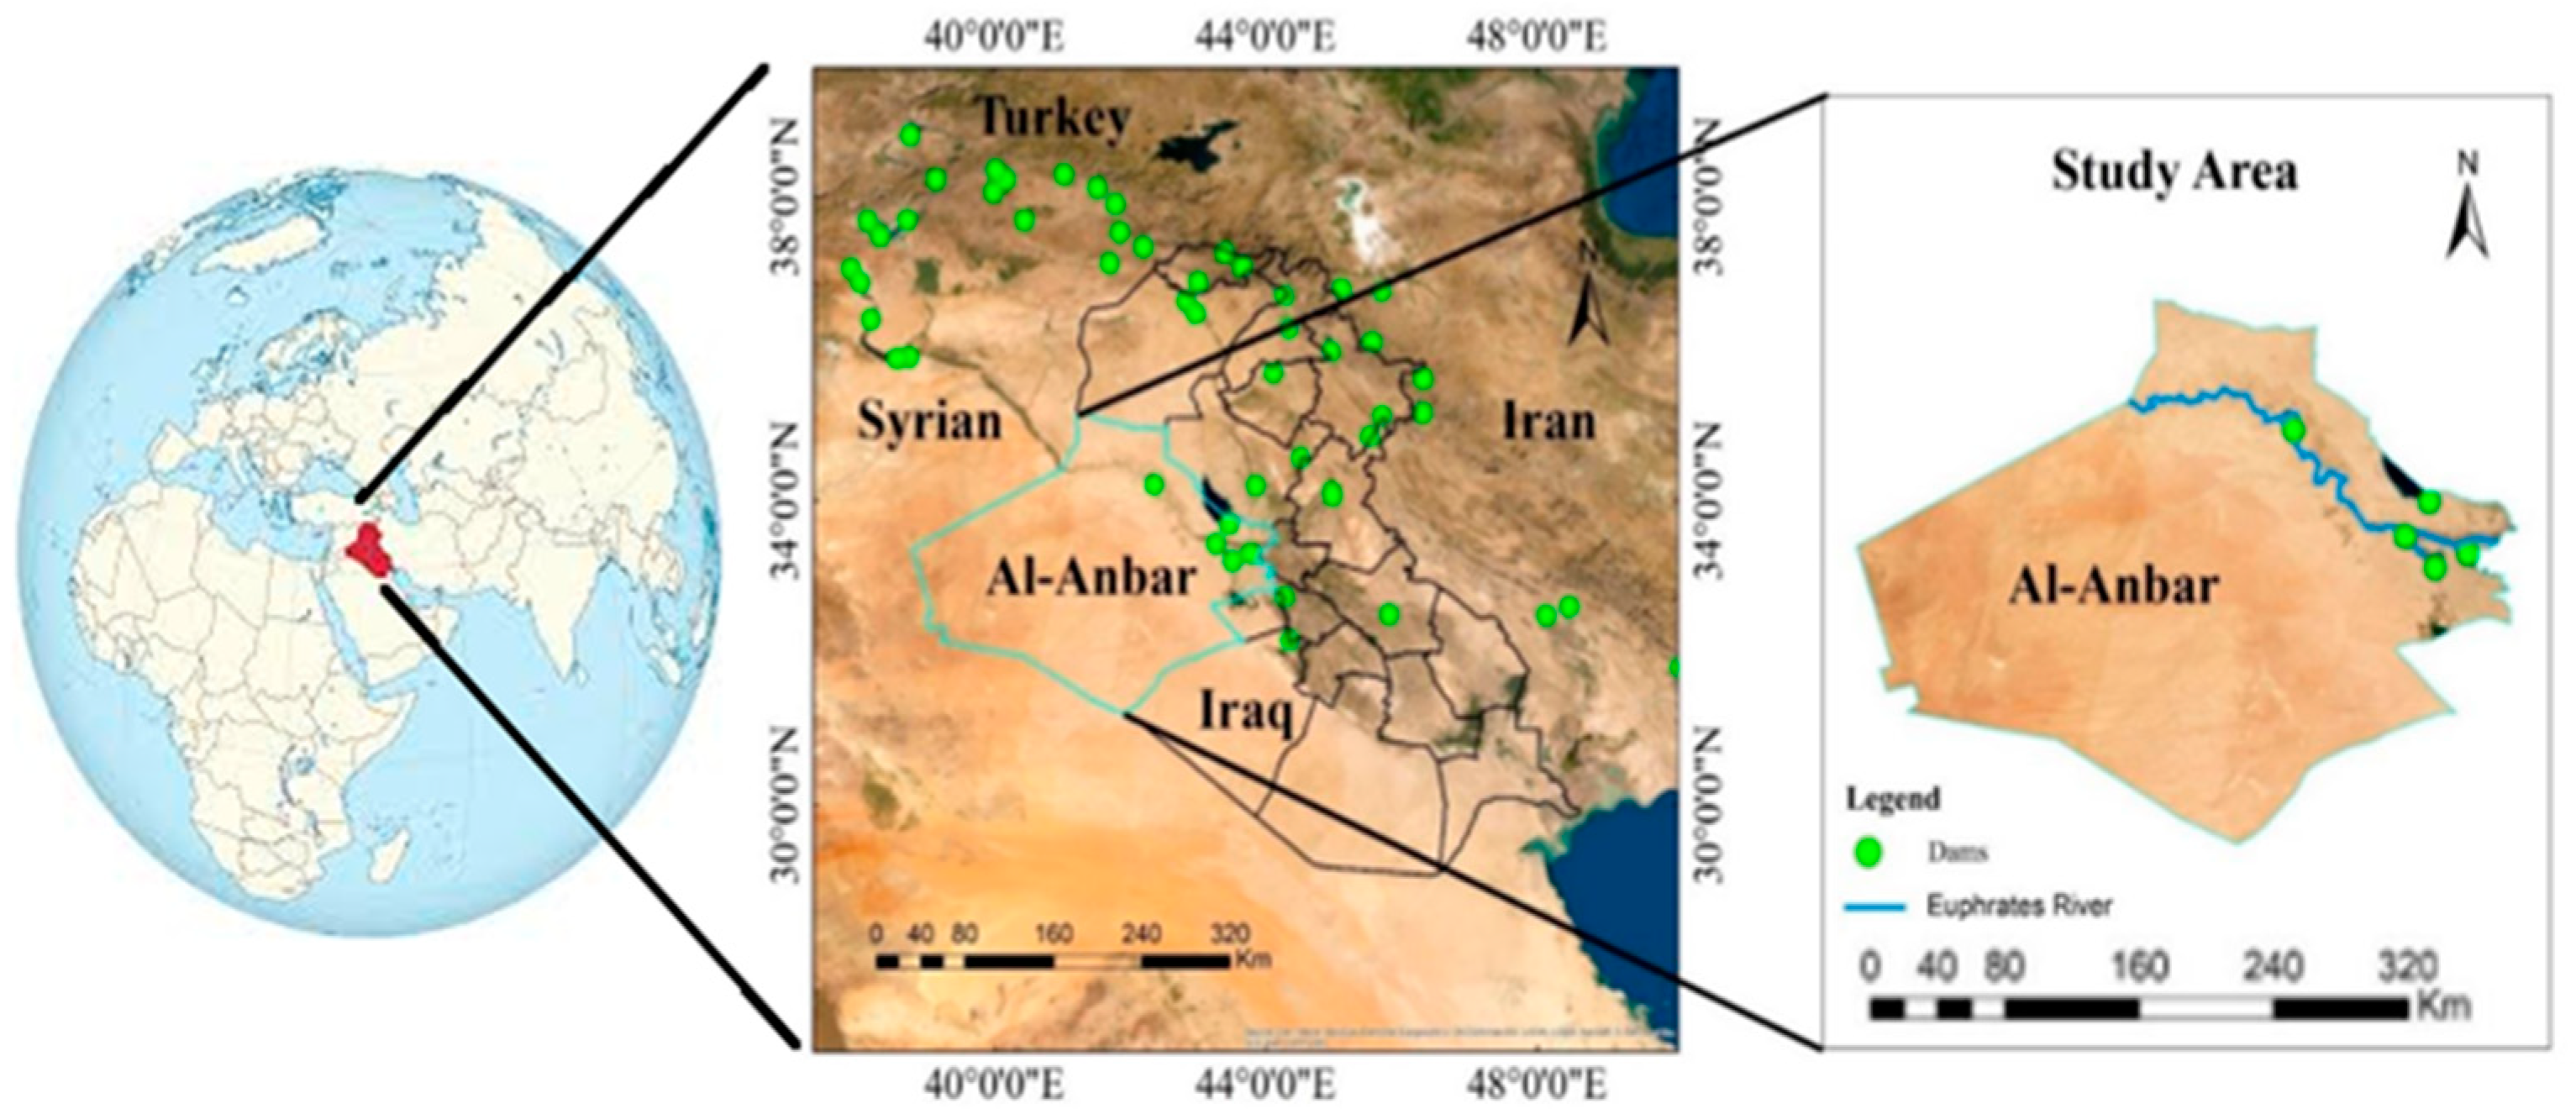
Figure 1. Case study location.
Water 16 02799 g001
Figure 2. Summary of the statistics of the SPEI with the seasonal and residual trend analysis.
Water 16 02799 g002
Figure 3. Structure diagram of the LSTM model.
Water 16 02799 g003
Figure 4. Scatter plot of the comparisons between the predicted SPEI results and actual observations of the SPEI for different types of LSTM optimizers.
Water 16 02799 g004
Figure 5. The normal distribution of LSTM optimizers for the test data sets.
Water 16 02799 g005
Figure 6. The forecast of the SPEI for the next 40 years.
Water 16 02799 g006
Table 1. Drought level classification based on SPEI [44].
LevelDrought TypeSPEI Range
0Wet 0.5 SPEI
1No drought 0.5 SPEI < 0.5
2Mild drought 1.0 SPEI < 0.5
3Moderate drought 1.5 SPEI < 1.0
4Severe drought 2.0 SPEI < 1.5
5Extreme drought SPEI 2.0
Table 2. Model accuracy and performance indicators for different optimizers.
OptimizerREMAERMSEMBEModel Accuracy
Adam−12.67860.1210550.1473210.10241387.32139818
RMSprop−9.365540.0754860.102766−0.0199290.6344634
SGD−11.82190.1048440.1315420.08221988.17809699
Adadelta−44.70530.546950.6058950.54096755.29469714
Adagrad−21.3610.2299130.2695940.21636378.63902355
Adamax−9.38540.0691420.093680.02779390.61459933
Nadam−10.84580.0934850.1186570.05088889.15421041
Table 3. Statistical indicators of different LSTM optimizers.
IndicatorsMeanMedianStandard DeviationSample VarianceKurtosisSkewness
Actual−1.3066−1.4150.470120.22102−0.22530.6568
Adam−1.2042−1.30510.449030.20162−0.14770.67171
RMSprop−1.3265−1.43160.498590.2486−0.22810.60479
SGD−1.2244−1.31940.462380.21379−0.29480.59212
Adadelta−0.7656−0.86010.301110.09067−0.53870.71359
Adagrad−1.0902−1.18680.393860.15513−0.32020.65514
Adamax−1.2788−1.37080.461890.21335−0.21290.63049
Nadam−1.2557−1.37010.468390.21939−0.24550.68273
Disclaimer/Publisher’s Note: The statements, opinions and data contained in all publications are solely those of the individual author(s) and contributor(s) and not of MDPI and/or the editor(s). MDPI and/or the editor(s) disclaim responsibility for any injury to people or property resulting from any ideas, methods, instructions or products referred to in the content.