Abstract
The operational efficiency, stability, and lifespan of hydroelectric power plants operating on sediment-laden rivers are affected by sediment erosion. A numerical simulation of the sand–water flow in the water-intake components of a turbine at a specific power station was conducted using the Euler–Lagrange method. Additionally, sediment erosion tests were carried out on the water-intake components coated with epoxy mortar material. The results indicate that sediment erosion on the stay vane surface mainly occurs on the front face, with the most severe erosion at the head, while sediment erosion on the stay ring surface primarily occurs near the stay vane head. The extent of erosion is mainly influenced by the distribution characteristics of sediment particles. The wear of epoxy mortar coating material is minimally affected by the spraying thickness. Adding 30% hardener to the epoxy mortar material can significantly improve the erosion resistance of the stay vane surface by about 30%. The erosion rate on the frontside of the stay vane is approximately 2.6 times that of the backside. Based on the sediment erosion tests and numerical simulation results of the sand–water flow, an estimation formula for the sediment erosion rate of the epoxy mortar erosion-resistant coating was established. This formula can be used to predict the anti-sediment erosion performance of epoxy mortar materials applied to the water-intake components of this turbine and similar river turbines.
1. Introduction
The Francis turbine is widely used due to its broad applicable head range (approximately 20–700 m), simple structure, stable operation, and high efficiency, making it the most extensively applied type of turbine currently. However, during actual operation, it often faces complex operating environments, with one of the most common issues being sediment erosion. As a critical component of the Francis turbine, the stay vane frequently suffers severe erosion on its surface due to the high-speed impact and friction of sediment particles. This not only affects the performance of the turbine but also shortens its operational lifespan and increases maintenance costs. Therefore, studying sediment erosion in the water-intake components of Francis turbines is of great significance.
Currently, research on sediment erosion in Francis turbines mainly focuses on numerical simulation and experimental studies. Scholars utilize fluid mechanics, engineering tribology, and multiphase flow theory to conduct numerical simulations of sand–water flow through various flow components of Francis turbines. This has elucidated the patterns and mechanisms of sediment erosion, providing a theoretical basis for optimizing turbine design and manufacturing. At the same time, numerous erosion tests with different types of solid particles have been conducted, establishing sediment erosion prediction models for turbines based on various material properties and particle impact methods [1,2,3,4]. Based on the existing erosion models, Thapa S B et al. [5] established an improved empirical wear model to estimate the erosion rate and runner efficiency loss of Francis turbines. Noon A [6] and Koirala R et al. [7] mentioned that sediment erosion in turbine components generally depends on the concentration, size, shape, and velocity of sediment particles, as well as the material properties and operational duration of the flow components. Erosion alters the geometric shape of turbine components, thereby reducing hydraulic efficiency. Meanwhile, during actual power station operation, the guide vane opening and operating water head also influence the distribution of sediment erosion. In small opening conditions, sediment erosion is mainly distributed on the suction side of the blade, while at large openings, it is primarily concentrated on the pressure side outlet [8]. Sharma et al. [9] studied the effect of particle diameter on sediment erosion of CA6NM material used in turbines and found that the erosion rate and particle size follow a power-law relationship, with the exponent ranging from 1.16 to 1.30. Zhang R [10,11] used the RNG turbulence model to numerically analyze the guide vanes and volutes of turbines, revealing the erosion conditions of volutes and guide vanes at different sediment concentrations. Zhao X Y et al. [12], using the standard k-ε model for solid–liquid two-phase flow, found that the guide vanes suffer severe sediment erosion near the head and tail positions. Pang J Y et al. [13,14] employed the N-S equations and the standard k-ε turbulence model for a full-channel numerical simulation of sand–water flow inside a high-head Francis turbine. Combining this with single-channel sediment erosion tests on the turbine runner blades, they identified the main locations and extent of sediment erosion and derived an erosion rate formula for the base material of the runner blades. Peng G J et al. [15] conducted solid–liquid two-phase numerical simulations using the Euler–Lagrange method under different sediment contents and normal operating conditions, predicting erosion using the Finnie model. The wear on the guide vane is mainly concentrated at the leading and trailing edges, which is directly related to the inflow velocity and direction [16]. Koirala R et al. [17] conducted experiments using the 3GV cascade system designed by Thapa S B [18] to observe the effects of wear on turbine guide vanes. Hu L W et al. [19] studied the characteristics of multiphase flow based on the Eulerian multiphase flow model. Tian W W et al. [20] compared the sediment erosion patterns of 1Cr18N9Ti and Q345 turbine stay vanes through experiments, finding that at higher sand–water circumfluence velocities, 1Cr18N9Ti material exhibits better erosion resistance than Q345 material, but at lower velocities, the erosion resistance of both materials is similar. Gandhi [21] and Nguyen [22], through experimental methods, analyzed the impact of particle size and size distribution on impact wear. Their research indicated that the weighted average particle size of fine-grained sediment can serve as the effective particle size for impact wear in multi-particle sediment-laden water, and that the degree of erosion damage increases with particle size. They suggested that the most economical and effective method for already-worn flow components is to use surface engineering technology to apply protective coatings on the flow surfaces to enhance their erosion resistance.
Erosion-resistant coating materials can form a high-hardness, highly erosion-resistant protective film on the surface of stay vanes, significantly reducing sediment erosion and improving the lifespan and performance of the stay vanes. In recent years, with the development of materials science and coating technology, various new erosion-resistant coating materials have been continuously developed and applied. Through experiments, Sharma et al. [23] discovered that the wear on the surface of CA6NM material blades mainly manifests as abrasion grooves, deep ploughing, and platelets, while some cracks appear at the leading edge. Casteletti L C [24], Bolelli G [25], and Fu L et al. [26] used high-velocity oxygen fuel (HVOF) technology to coat the surfaces of stainless steel test pieces with metal, ceramic erosion-resistant coating materials. They evaluated the protective effects of the coatings in terms of compressive strength, erosion resistance, toughness, and plasticity. The results indicated that these coatings can significantly extend the service life of hydraulic machinery. Zhao X Y et al. [27] compared the sediment erosion of movable guide vanes made of ZG06Cr13Ni4Mo before and after being coated with tungsten carbide. The results showed that the erosion resistance of the movable guide vanes was significantly improved after being coated with tungsten carbide. Maharajan S et al. [28] also pointed out through erosion tests that materials coated with carbides have better erosion resistance. Xing Z G et al. [29] modified epoxy resin coatings using polyurethane (PU) as a toughening agent. The PU chains can randomly penetrate the epoxy chains, forming an interpenetrating polymer network (IPN), which significantly improves the toughness of the epoxy resin coating and enhances the adhesion between the SiC reinforcement phase and the resin matrix, thereby increasing the erosion resistance of the coating. Zhang et al. [30] conducted cavitation and erosion tests on three protective materials applied to turbine movable guide vanes. By fitting the relationship between erosion rate and time, they inferred the service life of each coating. Hu S K et al. [31] chemically grafted hydroxyl-terminated polybutadiene (HTPB) liquid rubber onto epoxy resin, then cured it with tetraethylenepentamine to create an HTPB-modified epoxy resin composite material. They added 300% ceramic bead erosion-resistant filler to produce the coating material. After six months of operation on turbine blades, the coating showed no signs of peeling or significant wear marks, effectively protecting the turbine blades. However, there is limited research on the sediment erosion patterns and anti-wear measures for stay vanes in Francis turbines. Further research and exploration are needed to select and optimize anti-wear coating materials and coating thickness suitable for stay vanes in Francis turbines.
This study is based on fluid mechanics and kinematic similarity theory to design a sediment erosion circumfluence test device for the turbine water-intake components at a power station. Numerical simulations of sand–water flow inside the turbine water-intake components were conducted, and erosion tests were performed on the water-intake components coated with modified epoxy mortar erosion-resistant coatings. Based on the results of the sand–water flow calculations and sediment erosion tests, the erosion resistance performance and erosion mechanisms of the modified epoxy mortar coating materials on the turbine water-intake components were explored, and an erosion prediction model for the erosion-resistant coating materials was established.
2. Numerical Simulation of Sand and Water Flow
2.1. Mathematical Model
Using the Euler–Lagrange model, the trajectories of sediment particles in the flow passage of the turbine water-intake components and the effects of sediment particles moving with the water flow on the stay vanes are simulated [32]. In this model, the water phase in the flow field is treated as the continuous phase, while the sediment particles are treated as the discrete phase, with sediment particles assumed to be standard spheres of the same size. The Euler–Lagrange method solves the continuous phase using the Navier-Stokes equations and tracks a large number of particles based on the computed flow field to solve for the discrete phase, thus obtaining the distribution pattern of the discrete phase [33]. The working flow chart of the Euler–Lagrange method is shown in Figure 1.
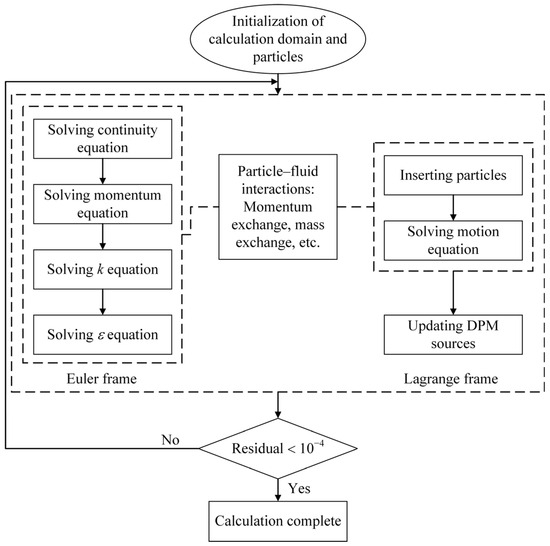
Figure 1.
Working flow chart of the Euler−Lagrange method.
The governing equation for the discrete particle phase is based on Newton’s second law to describe the motion of particles, and its expression [34] is as follows:
where mp is the particle mass; u and up are the fluid phase velocity and particle velocity, respectively; ρ and ρp are the fluid density and particle density, respectively; g is the gravitational acceleration; F is the additional force; ; dp is the particle diameter; μ is the dynamic viscosity coefficient of the fluid; CD is the drag coefficient; Rep is the sediment particle Reynolds number, .
The Realizable k-ε turbulence model used for the continuous phase is a two-equation turbulence model that predicts the characteristics of turbulence by solving two transport equations. These include turbulent velocity fluctuations, the production and dissipation of turbulent energy, and the impact of turbulence on fluid flow.
The turbulent kinetic energy k equation describes the generation and transport of turbulent energy and is typically expressed as follows:
The turbulent kinetic energy dissipation rate ε equation describes the process of turbulent energy dissipation and is generally expressed as follows:
where , , ; C1ε ≈ 1.44; C2 ≈ 1.9; C3ε ≈ 1.2; σk ≈ 1.0; σε ≈ 1.2; μt is the eddy viscosity; Gk is the generation of turbulence kinetic energy due to the mean velocity gradients; Gb is the generation of turbulence kinetic energy due to buoyancy; Ym represents the contribution of the fluctuating dilatation in compressible turbulence to the overall dissipation rate; the subscripts i and j are the tensor coordinates.
2.2. Geometric Model and Computational Mesh Discretization
Based on the design data of the turbine water-intake component flow passage from the Dadu River Gongzui Hydropower Station and using similarity principles, a corresponding single-flow passage test device model was established [35]. This model ensures similarity and consistency of the sand–water flow field movement and flow pattern between the test device and the actual turbine water-intake component. The test device model includes sections for a circular pipe, a contraction section, a diffusion section, and a test chamber section. The test device also includes two guide vanes and two stay vanes, creating three flow passages to reduce the impact of the test chamber walls on the sand–water flow pattern. The three-dimensional water model of the test section is shown in Figure 2 and also serves as the geometric model for numerical calculations of sand–water flow within the turbine water-intake component.

Figure 2.
Three-dimensional water model.
Mesh quality is one of the key factors affecting the accuracy and stability of numerical simulations. To improve calculation accuracy and accommodate limited computational resources, mesh independence verification is required. Using ANSYS ICEM CFD 2022 R1 software, five sets of hexahedral meshes were generated for the three-dimensional model of the test device, with mesh counts of 405,000, 963,000, 1,911,000, 3,121,000, and 5,982,000. Mesh independence verification was performed using the average pressure at the outlet cross-section as the criterion, as shown in Figure 3. When the mesh count exceeds 3,121,000, the variation in the average pressure at the outlet cross-section is within 0.26%, so the fourth set of meshes was chosen as the computational mesh. The mesh model of the test section is shown in Figure 4. The maximum grid size for the fourth mesh set is 2.5 mm, with a refined size of 1 mm set for the near-wall surfaces of the stay vanes and guide vanes. The first layer of the boundary layer mesh near the wall surface of the stay vanes and guide vanes is 0.015 mm, with a growth rate of 1.2, for a total of 14 layers. The Y+ values near the wall surfaces of the stay vanes and guide vanes range from 0.5 to 6, with most being around 3.
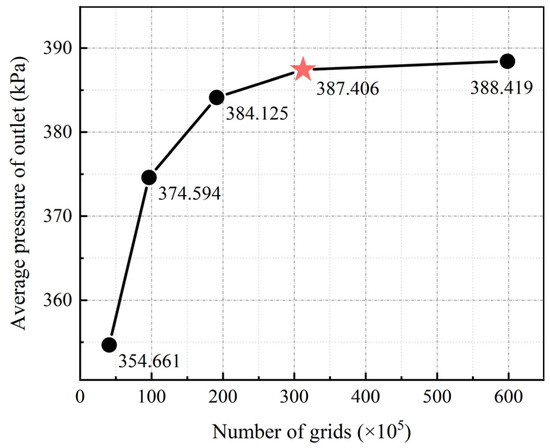
Figure 3.
Mesh independence verification. The figure represents the mesh independence validation, and the fourth set of grids, i.e., represented by the star symbols, was chosen in this study to carry out the numerical simulation calculations and subsequent analyses.
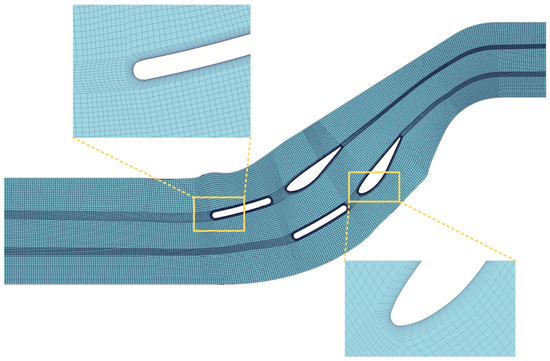
Figure 4.
Computational mesh for numerical simulation of the test section.
2.3. Boundary Condition
Based on the measured inlet pressure and outlet flow rate data during the experiment, the inlet boundary condition for the numerical simulation was set as total pressure, and the outlet boundary condition was set as flow rate outlet. The pressure and flow rate changes recorded over 65 h of testing are shown in Figure 5. The calculations yielded an outlet flow rate of 300 m3/h and an inlet total pressure of 42 m. For continuous viscous fluids, a no-slip wall boundary condition is used. The DPM (Discrete Phase Model) calculations were set with the maximum sediment concentration during the flood season at the power station being 5.0 kg/m3, with a median sediment particle size of 0.1 mm. The calculations were consistent with the parameters of the experimental conditions. Based on the general CFD solver Ansys Fluent 2022 R1, the pressure–velocity coupling algorithm and the finite volume method were used to discretize the equations. The pressure discretization method is Second Order, and the momentum discretization method is Second Order Upwind. The convergence criterion is set to a residual of less than 10−4. The turbulence model used is the Realizable k-ε model.
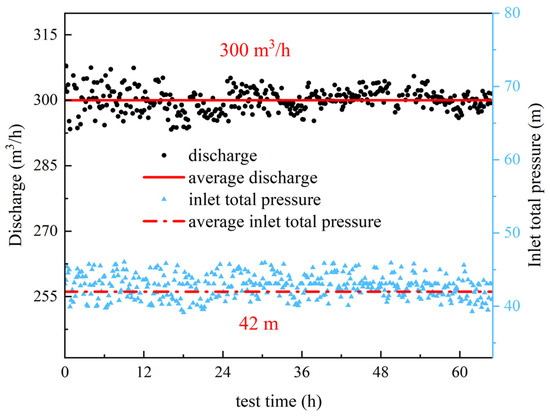
Figure 5.
Test inlet total pressure and discharge.
2.4. Numerical Simulation Results and Analysis
Figure 6 shows the sediment concentration distribution at 50% of the blade height in the test section and the variation curve of sediment concentration on the surface of the stay vanes. The airfoil chord line (0–1) represents the relative position along the chord length of the stay vane, with 0 being the head position and 1 being the tail position. As sand–water flows through the test section, sediment particles collide with and rub against the head and tail of the stay vanes, leading to the accumulation of a large amount of sediment in these areas, resulting in higher sediment concentrations at the head and tail positions of the stay vanes. Higher sediment concentration means more sediment is involved in wearing the surface material of the stay vanes. Overall, the sediment concentration on the surface of the stay vanes shows a decreasing trend, with the sediment concentration on the back of the stay vanes following a similar trend to the front but being lower overall.
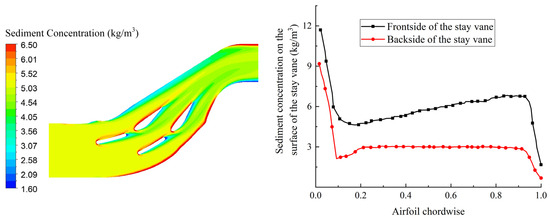
Figure 6.
Sediment concentration distribution at 50% blade height of the stay vane in the test section.
Figure 7 shows the sediment velocity distribution at 50% of the blade height in the test section and the variation curve of sediment velocity near the wall surface of the stay vanes. It can be observed that from the inlet to the outlet of the test section, the sediment velocity gradually increases, reaching its maximum value at the turning backside near the outlet of the test section. For the stay vanes, the sediment velocity near the wall surface decreases initially from the head to the tail and then increases. The sediment velocity trend on the back of the stay vanes is similar to that on the front but is generally lower. The sediment velocity at the head and tail positions of the stay vanes is higher.
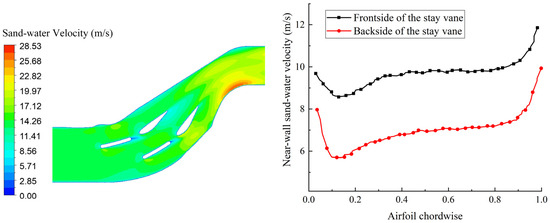
Figure 7.
Sand-water velocity distribution at 50% blade height of the stay vane in the test section.
Figure 8 shows the sediment concentration distribution on the wall surface of the test section. It can be seen that the regions with higher sediment concentration are mainly located near the head and front areas of the stay vanes. This indicates that sediment particles with high concentrations impact the surface of the stay ring more frequently, leading to severe wear on the stay ring surface.
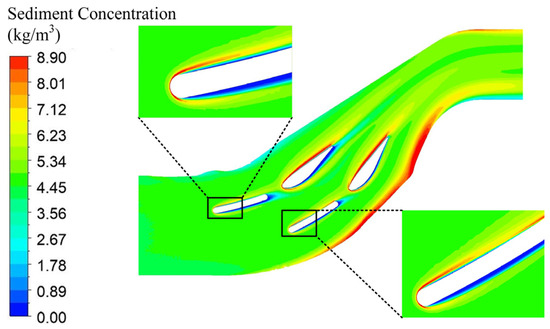
Figure 8.
Sediment concentration distribution on the upper wall of the test section.
3. Test Study on Sediment Erosion of Coating Materials
3.1. Physical Properties of Coating Materials
Epoxy mortar is a composite material known for its high strength, excellent corrosion resistance, and low curing shrinkage. The erosion-resistant material selected uses EP-512 as the primer and EP-530 as the topcoat. Its main components include modified epoxy resin as the film-forming agent, modified amine hardener, thixotropic agents, and anti-wear aggregate fillers. This coating material exhibits good wear and impact resistance. The technical specifications for the erosion-resistant and anti-corrosion coatings EP-512 and EP-530 are listed in Table 1.

Table 1.
Technical specifications of the erosion-resistant and anti-corrosion coating.
3.2. Test System
The sediment erosion test system consists of a power system, sand–water mixing system, cooling system, and test section. The power system has a maximum capacity of 630 kW. The sand–water mixing system uses stirring to ensure uniform mixing of sand and water. The cooling system employs heat exchange tubes to regulate the temperature of the sand–water mixing tank, maintaining it within an appropriate temperature range. The test pipeline uses φ200 stainless steel pipes. The sediment erosion test system is shown in Figure 9.
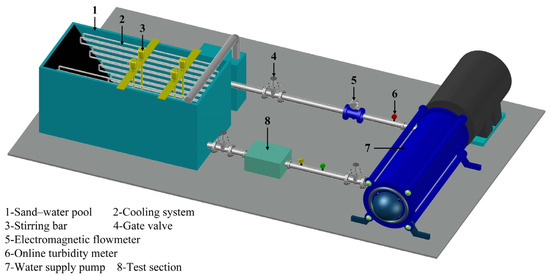
Figure 9.
Sediment erosion test system.
The test section was manufactured based on the single-flow passage three-dimensional model shown in Figure 10. The stay vanes were fixed in the insertion slots of the reference plane and matched with a small gap between the mounting slots. The stay vanes were machined using CNC technology and thinned according to the coating thickness, ensuring that the surface of the test specimen, after spraying with the erosion-resistant coating, matched the designed stay vane thickness. To study the effect of sediment-laden water flow on the stay ring, a stay ring test block was segmented from the test chamber at the location of the stay vanes, and an erosion-resistant coating was sprayed on its surface. The completed test chamber is shown in Figure 11. The sediment erosion test was conducted with reference to ASTM G73 [36] and G76 [37] standards.

Figure 10.
Single-flow channel three-dimensional model structure diagram.
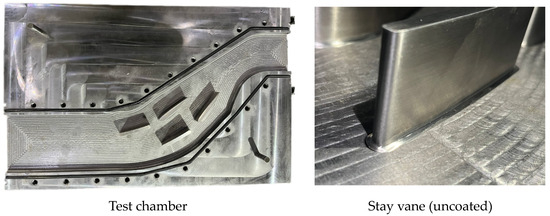
Figure 11.
Photographs of the test device.
To investigate the erosion resistance performance of epoxy mortar materials with different thicknesses and properties, erosion-resistant epoxy mortar coatings were uniformly sprayed on the surfaces of three stay vane test specimens. The coating materials consisted of EP-512 epoxy anti-corrosion paint and EP-530 epoxy anti-corrosion paint. For test specimen 3, the coating material included 30% hardener, with the thickness matching that of test specimen 1. Specific parameters of the coating materials are listed in Table 2.

Table 2.
Epoxy mortar coating information for the stay vane.
3.3. Measurement Method
This study used the erosion depth testing method to measure the three-dimensional surface profile of the epoxy mortar erosion-resistant coating material on the stay vanes before and after sediment erosion tests, in order to assess the sediment erosion condition on the stay vane surfaces. The spatial position of the specimens is shown in Figure 12, with the coordinate system defined as follows: the x-axis along the chord direction of the stay vane, and the y-axis along the height direction of the stay vane. A total of 17 reference lines were marked on the baseline of the stay vanes along the direction of sediment-laden water flow in the test rig.
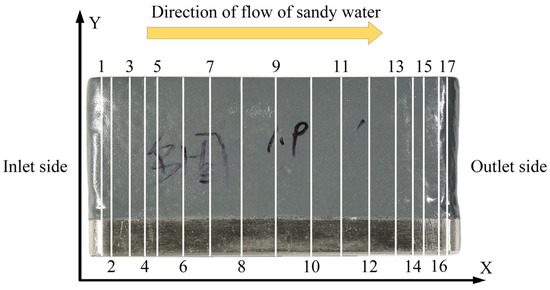
Figure 12.
Schematic diagram of the spatial coordinate position of the test specimens.
Using a 3D laser scanning device, the surface heights z1 and z2 at the measurement positions before and after erosion testing were measured. The difference Δz = z1-z2 represents the erosion depth on the surface of the stay vanes.
3.4. Analysis of Test Results
This experiment was conducted in two groups. The first group included specimens 1 and 2, and a test block of the stay ring. The second group included specimen 3 and a test block of the stay ring. Both groups of experiments were conducted under constant pressure and flow conditions. The base material for the stay vanes and the stay ring test blocks was 15MnMoVCu, and the coating material was modified epoxy mortar. Sediment samples (with a SiO2 content of 59.62%) were collected from the forebay of the Gongzui Hydropower Station on the Dadu River. Sediment particles smaller than 0.131 mm were separated using a vibrating screen, and a water–sand ratio was prepared based on the power station’s measured average sediment concentration of 5.0 kg/m3.
After 65 h of testing, the wear conditions of the three stay vanes and the stay ring test blocks coated with modified epoxy mortar are shown in Figure 13. All three stay vanes in the test apparatus showed varying degrees of wear, with the head portion being particularly severely worn. The coating had noticeably peeled off, exposing the base material. The sediment-laden water caused flow separation at the heads of the stay vanes, with particles impacting the head at high velocities. The front surfaces of the stay vanes exhibited noticeable grooves, with the large worn surfaces showing continuous directional damage marks, while the back surfaces were less damaged. The wear patterns and mechanisms of the three coated stay vane specimens were consistent, with the heads primarily experiencing impact wear and the surfaces undergoing micro-cutting wear by sediment particles. Due to the significant accumulation of sediment particles in the area where the stay ring test block contacts the head of the stay vanes, severe coating wear was observed in this region. The coating near the head on the back side was worn through. The stay ring experienced noticeable wear around the areas of contact with the stay vanes, while areas farther away showed minimal wear marks.
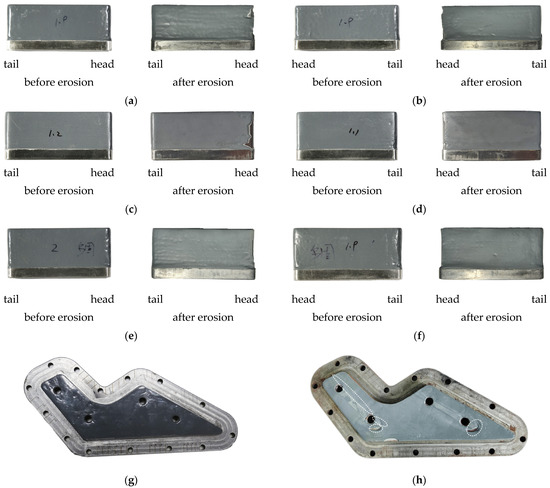
Figure 13.
Comparison of the test specimen surfaces before and after wear. (a) comparison of test specimen 1 before and after erosion on the front side. (b) comparison of test specimen 1 before and after erosion on the back side. (c) comparison of test specimen 2 before and after erosion on the front side. (d) comparison of test specimen 2 before and after erosion on the back side. (e) comparison of test specimen 3 before and after erosion on the front side. (f) comparison of test specimen 3 before and after erosion on the back side. (g) stay ring test block before erosion. (h) stay ring test block after erosion.
Figure 14 illustrates the distribution of erosion rates on the surfaces of the stay vanes before and after the experiment. To ensure the accuracy of the test results and avoid errors caused by machinery or human factors, each contour line was measured three times before and after the erosion tests, and the average of the three measurements was used as the statistical result for the erosion rate analysis. The error analysis results are marked with error bars in the figures. Along the flow direction, from the head to the tail of the vanes, the erosion rates on both the front and back surfaces of the vanes exhibited a slight increasing trend, with the erosion rates on the front surfaces of all three specimens being higher than those on the back surfaces. The erosion rates of the three specimens were on the order of E1 > E2 > E3, indicating that under the same conditions, specimen 3 had better sediment erosion resistance than specimens 1 and 2, thus better reducing the wear damage on the surfaces of the stay vanes.
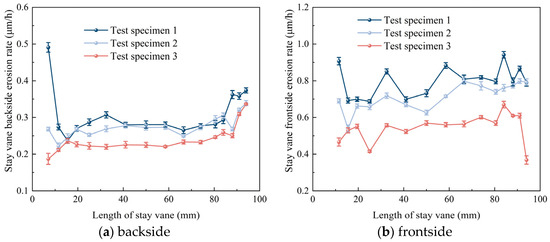
Figure 14.
Erosion rate of the test specimen surfaces.
4. Erosion Estimation Model for the Erosion-Resistant Coating Material
Due to the variability of the power station operating conditions, the velocity of particle impact on the surfaces of the flow-through components and the sediment concentration passing through the machine change accordingly under different conditions. Establishing erosion rate calculation formulas allows for timely and accurate assessment of sediment erosion on the turbine flow-through components, thereby predicting their operational lifespan. The particle impact velocity and sediment concentration on the surfaces of the turbine flow-through components are the main factors affecting the erosion rate. The erosion rate calculation formulas can be described as follows:
where represents the erosion rate of the flow component material per unit time; ks is the sediment particle characteristic coefficient; km is the characteristic coefficient of the material of the flow component; CV is the sediment concentration; m is the concentration index, generally equal to 1; Vp is the velocity of particles impacting the material surface; and n is the velocity index.
In this study, since the sediment concentration for the tests is fixed at 5.0 kg/m3 and the characteristics of the abrasion-resistant modified epoxy mortar coatings on the stay vanes are also established, with all three specimens having a base material of 15MnMoVCu and coatings consisting of standard and 30% hardener epoxy mortar, the sediment erosion rate Formula (4) can be simplified under a given river sediment concentration as follows:
The wear distribution at each scribed line on the specimens after the sediment erosion tests was obtained. The sediment particle velocities at the corresponding scribed lines were extracted from the numerical simulation results of the sand–water flow. Using a custom fitting model in Origin 2018, the erosion rates of the effective points of the three specimens and the corresponding flow-around velocities at the scribed points were imported into Origin for nonlinear curve fitting to solve for the unknown coefficients. The resulting erosion rate calculation formulas for the three erosion-resistant coatings at a sediment concentration of 5.0 kg/m3 are:
where , , and represent the erosion rates of the epoxy mortar erosion-resistant coatings for the three specimens within a unit of time, respectively.
To estimate the wear amount under different sediment concentrations, the variable of sediment concentration is introduced into the erosion rate calculation Formulas (6)–(8), resulting in the erosion rate calculation formulas for the three types of erosion-resistant coatings as follows:
The in the fitting results is a statistical indicator used to measure the degree of fit between the fitted curve and the actual data. The closer it is to 1, the better the model fits. Here, the values of the fitted sediment erosion models are 0.94, 0.95, and 0.97, indicating that the fitting results are reliable.
By comparing the coefficients k and velocity exponents n in the wear prediction Formulas (9)–(11), it is evident that the thickness of the coating material has little effect on the erosion resistance of the epoxy mortar coating on the stay vanes. However, adding 30% hardener to the epoxy mortar coating can increase the erosion resistance of the stay vane surface by approximately 30%.
This study compared the protective performance of coatings with different thicknesses and material ratios on the surfaces of stay vanes subjected to sediment erosion. For the erosion on the leading edge of the stay vanes, although it is known that impingement erosion causes severe damage, even leading to coating detachment, further research is needed to determine the effectiveness of selecting a suitable anti-erosion coating material for the protection of the leading edge.
5. Conclusions
A numerical simulation of the sediment-laden water flow inside the turbine intake components of a hydropower station was conducted, along with sediment abrasion tests on components with modified epoxy mortar coatings. These studies provided insights into the flow characteristics of the sediment-laden water and the abrasion mechanisms of sediment particles on the component surfaces. The results showed that a large number of sediment particles impact the leading edge of the stay vanes at high speeds, causing impact wear and leading to the detachment of the coating material from the vane heads. The surface of the stay vanes primarily experiences cutting wear from sediment particles, creating noticeable striated wear pits. The abrasion resistance of the epoxy mortar coating with a thickness of 1 mm is slightly higher than that with a thickness of 2 mm. Increasing the hardener content by 30% enhances the abrasion resistance of the epoxy mortar coating by approximately 30%. The most severe wear occurred at the junction between the seat ring test block and the leading edge of the stay vanes, with significant impact pits observed, while friction wear was present at the connection with the leading edge’s front surface, showing rough damage traces.
Combining the results of the sediment-laden water flow numerical simulation and sediment abrasion tests, an erosion rate expression for the modified epoxy mortar coatings on stay vanes was fitted. This expression can be used to estimate the performance of different thicknesses of modified epoxy mortar coatings applied to the flow surfaces of Francis turbines.
Author Contributions
Methodology, Y.G. and X.L. (Xiaobing Liu); Software, L.S.; Validation, T.W., Y.C. and J.P.; Investigation, X.L. (Xiaofei Li); Writing—original draft, Y.W. All authors have read and agreed to the published version of the manuscript.
Funding
The research was supported by the National Natural Science Foundation of China Regional Innovation and Development Joint Fund project “Air doping erosion reduction mechanism and control of cavitation wear coupling damage of pump turbine in high altitude area” (No: U23A20669).
Data Availability Statement
Data available in a publicly accessible repository.
Conflicts of Interest
Authors Yongfei Wang, Lei Su, Tong Wang, Yinhui Cai and Xiaofei Li were employed by the company CHN Energy Dadu River Repair & Installation Co., Ltd. The remaining authors declare that the research was conducted in the absence of any commercial or financial relationships that could be construed as a potential conflict of interest.
References
- Finnie, I. Erosion of surfaces by solid particle. Wear 1960, 3, 87–103. [Google Scholar] [CrossRef]
- Tabakoff, W.; Kotwal, R.; Hamed, A. Erosion study of different materials affected by coal ash particles. Wear 1979, 52, 161–173. [Google Scholar] [CrossRef]
- McLaury, B.S. A Model to Predict Solid Particle Erosion in Oilfeld Geometries. Ph.D. Thesis, University of Tulsa, Tulsa, OK, USA, 1993. [Google Scholar]
- Oka, Y.I.; Okamura, K.; Yoshida, T. Practical estimation of erosion damage caused by solid particle impact. Wear 2005, 259, 95–101. [Google Scholar] [CrossRef]
- Thapa, S.B.; Thapa, B.; Dahlhaug, G.O. Empirical modelling of sediment erosion in Francis turbines. Energy 2012, 41, 386–391. [Google Scholar] [CrossRef]
- Aslam Noon, A.; Kim, M.H. Erosion wear on Francis turbine components due to sediment flow. Wear 2017, 378–379, 126–135. [Google Scholar] [CrossRef]
- Koirala, R.; Thapa, B.; Neopane, H.P.; Zhu, B.; Chhetry, B. Sediment erosion in guide vanes of Francis turbine: A case study of Kaligandaki Hydropower Plant, Nepal. Wear 2016, 362–363, 53–60. [Google Scholar]
- Wei, X.Y.; Pei, J.; Wang, W.Q.; Yu, Z.F. Numerical study on sediment erosion characteristics of Francis turbine runner. Eng. Fail. Anal. 2024, 161, 108270. [Google Scholar] [CrossRef]
- Sharma, S.; Gandhi, B.K. Assessment of erosion wear in low specific speed Francis turbine due to particulate flow. Adv. Powder Technol. 2023, 34, 104065. [Google Scholar] [CrossRef]
- Zhang, R. Wear analysis of hydraulic turbine shell based on solid-liquid two-phase flow. Value Eng. 2022, 41, 83–85. [Google Scholar]
- Zhang, R. CFD-based study of hydraulic turbine guide vane sediment erosion. Yunnan Water Power 2023, 39, 224–227. [Google Scholar]
- Zhao, X.Y.; Liu, X.B.; Chen, J.R. Sediment wear of hydraulic turbine moving guide vane at Yingxiuwan hydropower station. Chin. J. Hydrodyn. 2021, 36, 728–734. [Google Scholar]
- Pang, J.Y.; Zhang, H.Z.; Yang, J.M.; Chen, Y.; Liu, X.B. Numerical and experimental study on sediment erosion of Francis turbine runner for hydropower stations. Chin. J. Hydrodyn. 2020, 35, 436–443. [Google Scholar]
- Pang, J.Y.; Liu, H.Z.; Liu, X.B.; Yang, H.; Peng, Y.; Zeng, Y.; Yu, Z. Study on sediment erosion of high head Francis turbine runner in Minjiang River basin. Renew. Energy 2022, 192, 849–858. [Google Scholar] [CrossRef]
- Peng, G.J.; Wang, Z.W.; Xiao, Y.X.; Yongyao, L. Abrasion predictions for Francis turbines based on liquid–solid two-phase fluid simulations. Eng. Fail. Anal. 2013, 33, 327–335. [Google Scholar]
- Pan, J.L.; Liu, Q.; Pang, J.Y.; Zhang, F.; Tao, R.; Xiao, R.; Zhou, L.; Liu, W. Comparative evaluation of sand erosion in reversible turbine at pump mode and turbine mode. J. Energy Storage 2024, 79, 110185. [Google Scholar] [CrossRef]
- Koirala, R.; Neopane, P.H.; Zhu, B.; Thapa, B. Effect of sediment erosion on flow around guide vanes of Francis turbine. Renew. Energy 2019, 136, 1022–1027. [Google Scholar] [CrossRef]
- Thapa, S.B.; Trivedi, C.; Dahlhaug, G.O. Design and development of guide vane cascade for a low speed number Francis turbine. J.Hydrodyn. Ser. B 2016, 28, 676–689. [Google Scholar] [CrossRef]
- Hu, L.W.; Liang, A.; Li, H.C.; Zhang, W.; Zhu, B. Impact of rotor-stator axial spacing on the gas-liquid-solid flow characteristics of a multiphase rotodynamic pump based on the Euler multi-fluid model. Phys. Fluids. 2024, 36, 1–17. [Google Scholar] [CrossRef]
- Tian, W.W.; Liu, X.B.; Li, J.N.; Yuan, S.; Lu, S.Y.; Li, Y.B. Experimental study on sediment wear of guide vanes of Francis turbine in high head hydropower station. J. Chin. Soc. Power Eng. 2020, 40, 686–692. [Google Scholar]
- Gandhi, B.K.; Borse, S.V. Effect of particle size and size distribution on estimating erosion wear of cast iron in sand-water slurries. Indian J. Eng. Mater. Sci. 2002, 9, 480–486. [Google Scholar]
- Nguyen, V.B.; Nguyen, Q.B.; Zhang, Y.W.; Lim, C.Y.; Khoo, B.C. Effect of particle size on erosion characteristics. Wear 2016, 348, 126–137. [Google Scholar] [CrossRef]
- Sharma, S.; Gandhi, B.K. Experimental investigation on rotating domain wear of hydrodynamic machine due to particulate flow. Powder Technol. 2022, 410, 117884. [Google Scholar] [CrossRef]
- Casteletti, L.C.; Arnoni, E.A.B.; Neto, A.L.; Fernandes, F.A.; Totten, G.E. Effect of binders and surface finish on wear resistance of HVOF coatings. Surf. Eng. 2010, 26, 440–446. [Google Scholar] [CrossRef]
- Bolelli, G.; Berger, L.M.; Börner, T.; Koivuluoto, H.; Lusvarghi, L.; Lyphout, C.; Markocsan, N.; Matikainen, V.; Nylén, P.; Sassatelli, P.; et al. Tribology of HVOF- and HVAF-sprayed WC–10Co4Cr hardmetal coatings: A comparative assessment. Surf. Coat. Technol. 2015, 265, 125–144. [Google Scholar] [CrossRef]
- Fu, L.; Chen, X.M.; Liu, W.; Wei, G.Y.; Mao, P.Z.; Zhao, J. Organizational structure and anti-wear properties of HVOF sprayed Cr3C2-25NiCr coatings and WC-12Co coatings. Corros. Prot. 2022, 43, 56–60. [Google Scholar]
- Zhao, X.Y.; Peng, Y.J.; Yang, J.X.; Chen, J.; Xu, L.; Tang, W.; Liu, X. Sediment wear of turbine guide vane before and after tungsten carbide treatment. Adv. Mech. Eng. 2022, 14, 16878132221089435. [Google Scholar] [CrossRef]
- Maharajan, S.; Ravindran, D.; Rajakarunakaran, S.; Khan, M.A. Analysis of surface properties of tungsten carbide (WC) coating over austenitic stainless steel (SS316) using plasma spray process. Mater. Today Proc. 2020, 27, 2463–2468. [Google Scholar] [CrossRef]
- Xing, Z.G.; Lv, Z.L.; Cui, Y. Erosion resistance of polyurethane toughened modified epoxy resin bonded SiC particles wear-resistant coatings. Mater. Mech. Eng. 2010, 34, 84–87+100. [Google Scholar]
- Zhang, L.; Chen, W.J.; Li, G.; Zhou, H.; Cui, T.F.; Shi, G.S. Research on Abrasion Resistance of Movable Guide Vane Protection Material for Hydraulic Turbine. Water Resour. Power 2023, 41, 211–214. [Google Scholar]
- Hu, S.K.; Deng, C.H.; Yu, J. Application of HTPB-modified epoxy resin composites on hydraulic turbine blades. Rubber Sci. Technol. 2012, 10, 26–27+30. [Google Scholar]
- Liang, A.; Li, H.C.; Zhang, W.W.; Yao, Z.; Zhu, B.; Wang, F. Study on pressure fluctuation and rotating stall characteristics in the vaneless space of a pump-turbine in pump mode. J. Energy Storage 2024, 94, 1–19. [Google Scholar] [CrossRef]
- Koirala, R.; Thapa, B.; Neopane, P.H.; Zhu, B. A review on flow and sediment erosion in guide vanes of Francis turbines. Renew. Sustain. Energy Rev. 2016, 75, 1054–1065. [Google Scholar] [CrossRef]
- ANSYS Inc. ANSYS Fluent Theory Guide; ANSYS Inc.: Canonsburg, PA, USA, 2022. [Google Scholar]
- Pang, J.Y.; Chang, X.; Gang, Y.Y.; Zhou, Z.; Xiang, W.; Zhou, L.; Liu, X.; Wang, Z. Design and Study of a Sediment Erosion Test Device for a Single-Flow Channel in the Guide Apparatus of a Reaction Hydraulic Turbine. J. Mar. Sci. Eng. 2024, 12, 777. [Google Scholar] [CrossRef]
- ASTM G73-10; Standard Test Method for Liquid Impingement Erosion Using Rotating Apparatus. ASTM International: West Conshohocken, PA, USA, 2010.
- ASTM G76-18; Standard Test Method for Conducting Erosion Tests by Solid Particle Impingement Using Gas Jets. ASTM International: West Conshohocken, PA, USA, 2018.
Disclaimer/Publisher’s Note: The statements, opinions and data contained in all publications are solely those of the individual author(s) and contributor(s) and not of MDPI and/or the editor(s). MDPI and/or the editor(s) disclaim responsibility for any injury to people or property resulting from any ideas, methods, instructions or products referred to in the content. |
© 2024 by the authors. Licensee MDPI, Basel, Switzerland. This article is an open access article distributed under the terms and conditions of the Creative Commons Attribution (CC BY) license (https://creativecommons.org/licenses/by/4.0/).