1. Introduction
Water is an indispensable resource, essential for sustaining life, supporting ecosystems, and driving economic development [
1,
2]. It plays a critical role in various sectors, including drinking water supply, sanitation, agriculture, industry, and energy production, making it a cornerstone of human survival and societal progress. However, the availability and management of water resources have become increasingly critical issues worldwide, particularly in regions facing severe water scarcity [
3,
4].
In arid and semi-arid regions such as Saudi Arabia, the importance of water is even more pronounced. The country faces significant challenges due to its limited renewable water sources and the growing demands driven by population growth and economic development [
5,
6,
7]. Surface water, though scarce, remains vital for recharging aquifers and providing water for agricultural and domestic use [
8,
9]. Understanding the dynamics of surface water availability and runoff is therefore crucial for developing sustainable water management strategies [
10,
11].
Accurate and detailed studies on surface water availability and runoff are essential for informed decision-making in water resource management. These studies provide valuable data that help to understand the spatial and temporal distribution of water resources, enabling more efficient allocation and equitable distribution among various sectors, including agriculture, industry, and domestic use [
10,
11,
12,
13]. Without this knowledge, efforts to manage and conserve water resources would be severely hindered.
Comprehensive assessments of surface water resources form the scientific foundation for national water policies and strategies [
14,
15]. Evidence-based insights are crucial for formulating and implementing policies aimed at water conservation, resource allocation, and infrastructure development [
16]. Effective water governance depends on robust scientific data to address the complexities of water management and meet the diverse needs of stakeholders.
Saudi Arabia relies on a mix of surface water, renewable and non-renewable groundwater, desalinated water, and treated wastewater to meet its water needs [
17]. As the largest country in the world without permanent rivers or lakes, Saudi Arabia depends heavily on non-renewable groundwater and desalination to supply drinking water and meet agricultural demands. Despite the critical importance of surface water, existing research on Saudi Arabia’s surface water resources has often been limited in scope. Most studies focus on specific basins, lacking a comprehensive national perspective that could inform broader water management strategies.
Current research primarily centers on flood analysis in wadis (dry riverbeds that occasionally flow with seasonal rains), with studies aiming to predict flood events and their return periods [
18,
19,
20,
21,
22,
23,
24,
25,
26,
27,
28,
29,
30]. Moreover, existing estimates of available surface water in Saudi Arabia vary widely, ranging from 2 to 8 billion cubic meters [
31,
32,
33]. These studies often fail to provide detailed information on the distribution of surface water across the country’s administrative regions.
The study of water availability in arid and semi-arid regions requires accurate, comprehensive, and timely data, which is often scarce [
34]. Remote sensing technology offers a powerful solution, providing comprehensive, real-time, and historical information on water resources. This technology enables a more accurate and efficient approach to water management, especially in regions where traditional data collection methods are challenging [
35,
36]. Additionally, these studies aim to develop mechanisms and methodologies that can be applied to other regions within the Kingdom, allowing for detailed estimates of surface water quantities that can inform decision-makers. One of the objectives of this study is to refine such a mechanism using satellite technologies and advanced imaging techniques to methodologically measure the available surface water resources.
This study aims to comprehensively assess surface water availability across the Riyadh region, a critical resource for policymakers and water managers. The primary goals are to estimate the current quantity of surface water using remote sensing techniques, determine the potential for rainwater and floodwater harvesting in different administrative regions, and develop a methodology that can be applied to other regions in the Kingdom. By analyzing satellite data spanning up to 23 years, the study will provide detailed estimates of renewable surface water availability in the Riyadh region. This research represents the first comprehensive analysis of the spatial and temporal distribution of renewable surface water in the region, offering valuable insights to enhance water resource management and sustainability across Saudi Arabia.
Study Area
The Riyadh region is one of the key administrative regions in the Kingdom of Saudi Arabia, with its emirate based in Riyadh, the nation’s capital. Centrally located in the heart of the Arabian Peninsula, it is the second-largest region in the country by both area and population, following the Eastern Province and the Mecca Region, respectively.
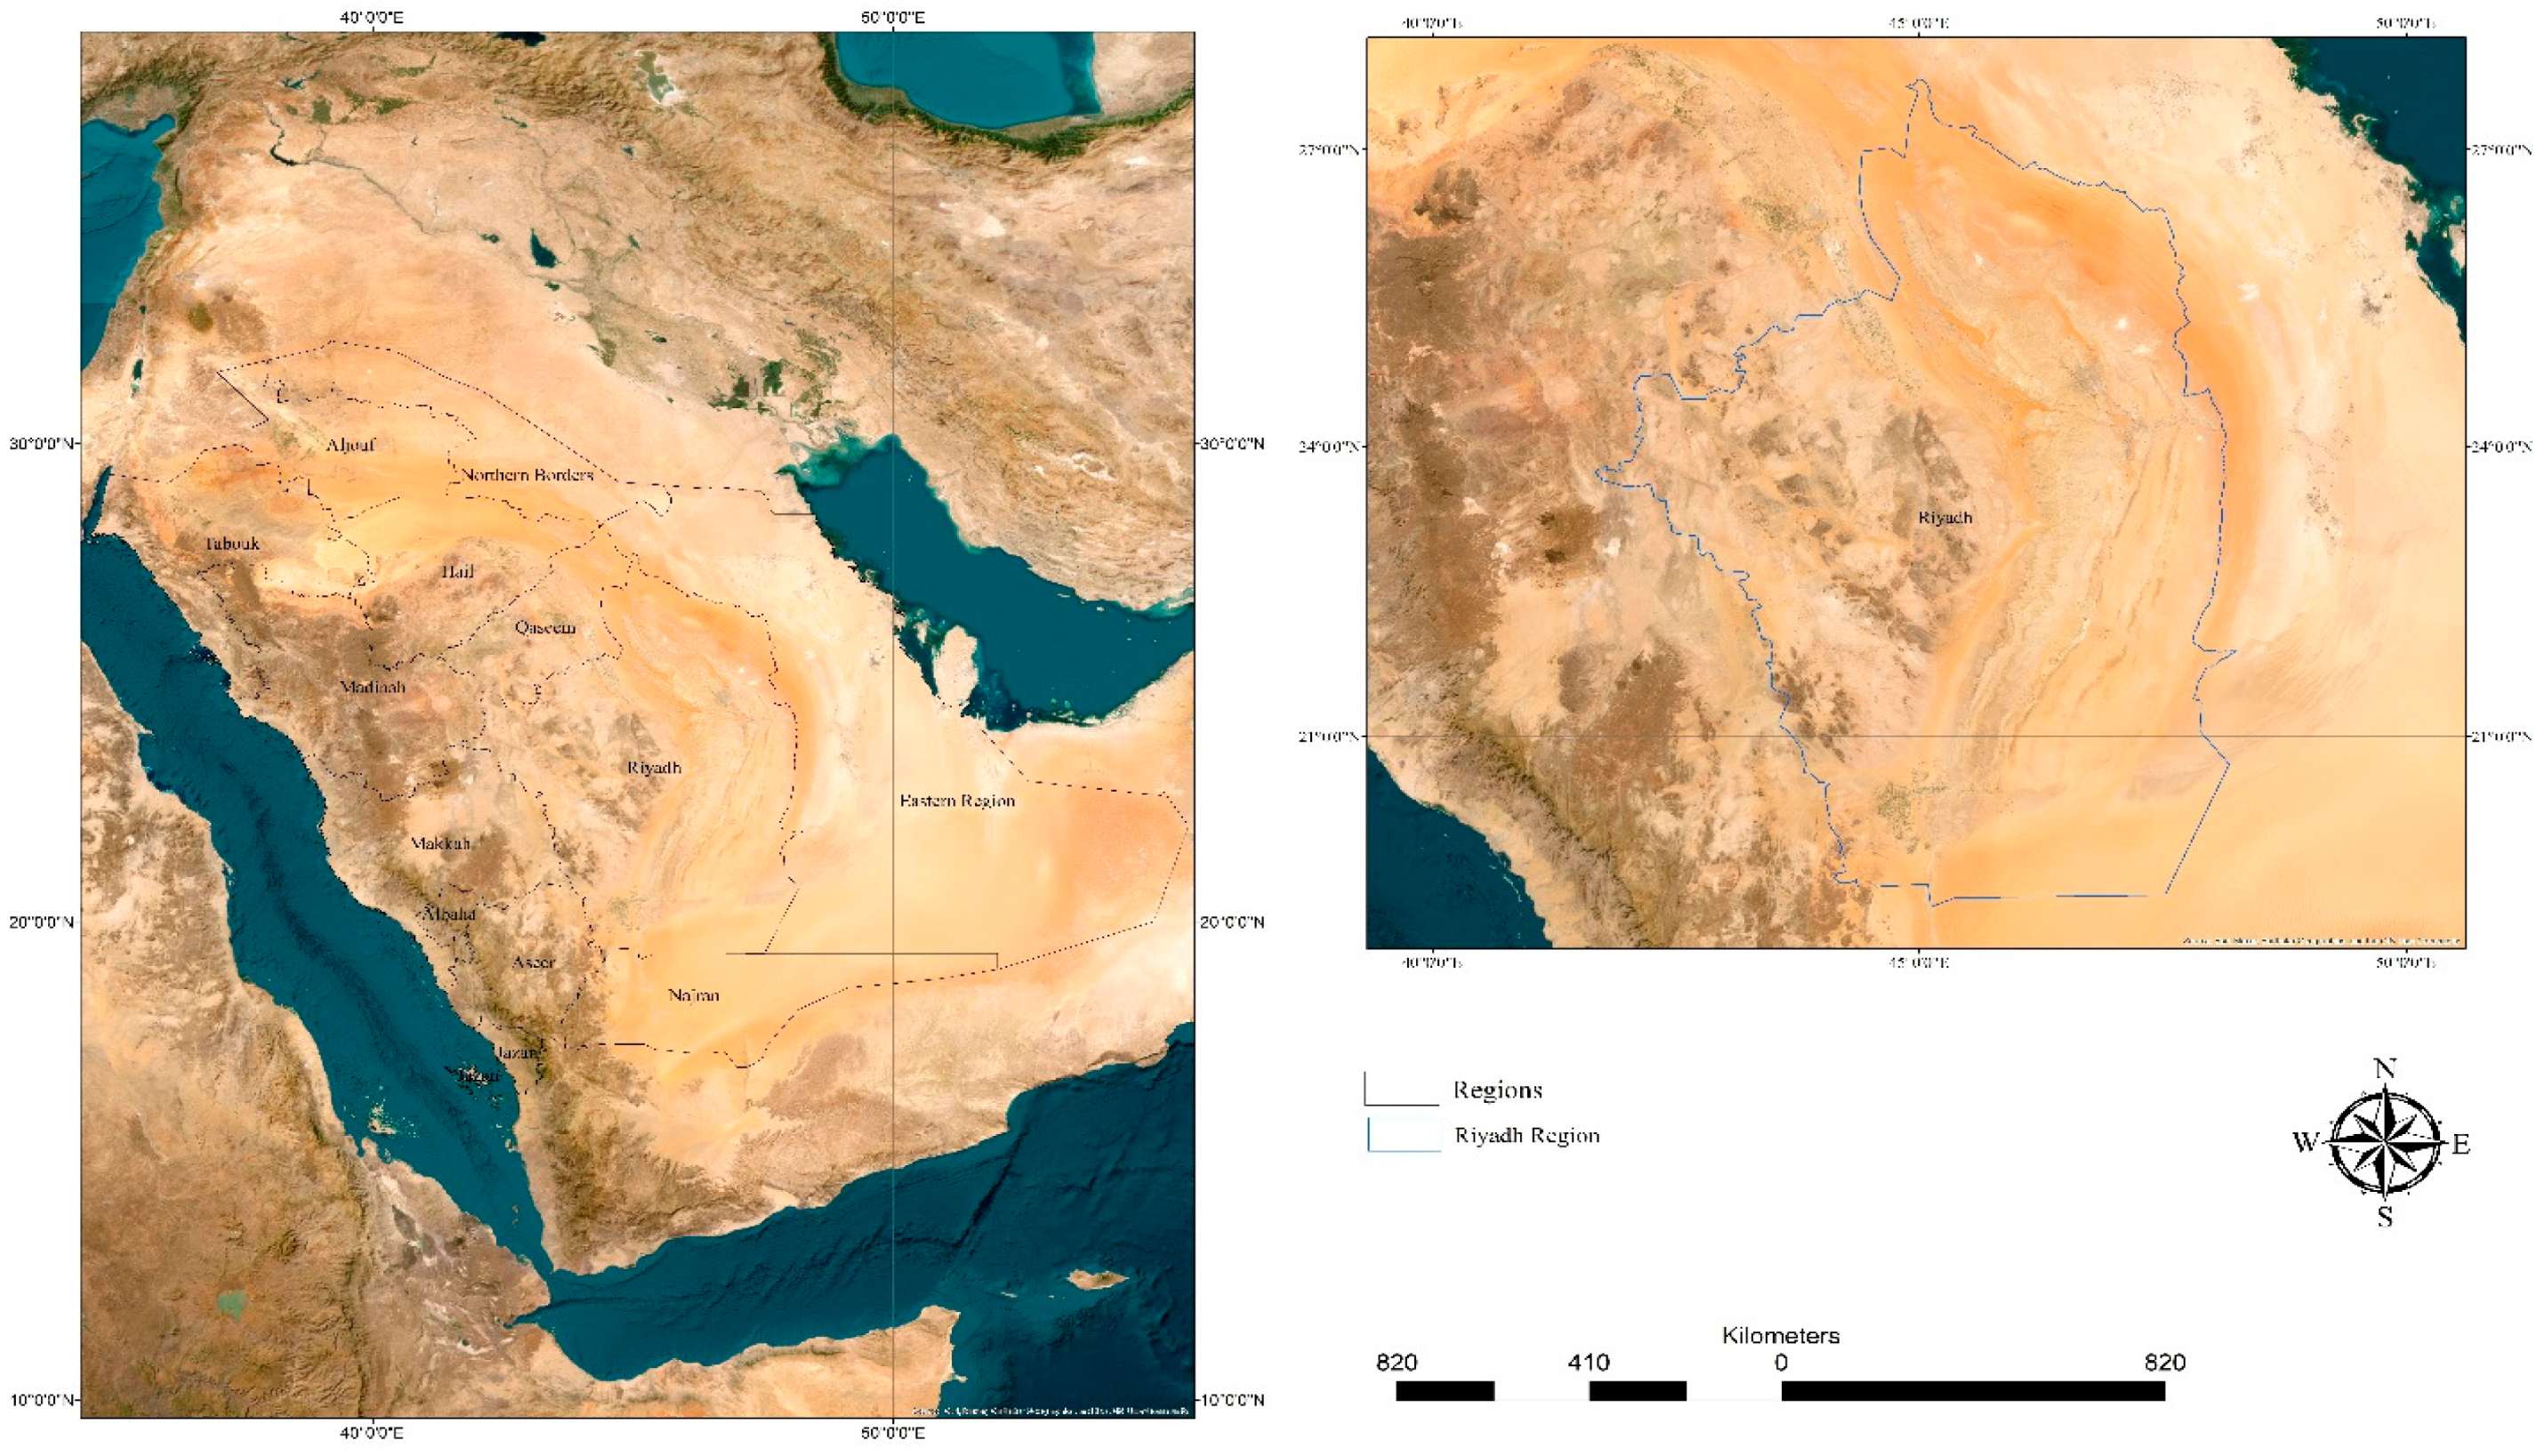
Geographically, the Riyadh region is positioned between longitudes 42°00′ and 48°17′ east and latitudes 19°00′ and 27°45′ north, as shown in
Figure 1. It is bordered by the Eastern Province to the north and east, the Qassim region and the Northern Borders to the northwest, the Najran region to the south, the Asir region to the southwest, and the Mecca and Medina regions to the west. The region stretches northward to the Artawiya center in Al-Majma’ah Governorate (approximately 305 km) and extends southward to Al-Khamasin and other centers in Wadi Al-Dawasir (around 700 km). Its northern and eastern boundaries reach the centers associated with Remah Governorate (over 150 km), while its western extension reaches Afif Governorate and its centers (approximately 500 km).
Covering an area of about 380,000 km2, the Riyadh region constitutes approximately 17% of the total area of the Kingdom, ranking second in size after the Eastern Province. The city of Riyadh, situated in the eastern part of the region at a latitude of 24°39′ and a longitude of 46°43′, serves as both the regional capital and the national capital. This strategic location has significantly influenced the region’s development and its surrounding areas.
The region experiences a desert-continental climate characterized by hot, dry summers and cold winters. Rainfall is moderate and unpredictable, with significant daily and seasonal temperature fluctuations. The average temperature is 25 °C, with an average humidity of 33.1% and annual rainfall of 84.4 mm.
2. Materials and Methods
2.1. Precipitation Estimation from Remotely Sensed Information Using Artificial Neural Networks–Dynamic Infrared Rain Rate Near-Real-Time
Over the past three decades, several satellite precipitation products (SPPs) have been developed as alternative tools for estimating precipitation. Unlike rainfall gauges, which are often limited in spatial coverage, SPPs provide detailed data on the spatial distribution of rainfall with high temporal and spatial resolution [
37]. This capability is particularly beneficial for hydrological and climatological studies, as accurate rainfall estimates can be achieved in areas with limited or no monitoring stations [
38].
For this study, the PDIR-Now dataset was selected due to its superior performance compared to other available satellite precipitation products. PDIR-Now is part of the PERSIANN (Precipitation Estimation from Remotely Sensed Information Using Artificial Neural Networks) product line, developed by the Center for Hydrometeorology and Remote Sensing (CHRS) at the University of California, Irvine (UCI). It is a quasi-global, near-real-time precipitation product that offers a comprehensive and continuous record of precipitation estimates from 2001 up to today, with a spatial resolution of 0.04° × 0.04° [
39]. The PDIR-Now dataset includes the distribution of rainfall for every hour, 3 h, 6 h, daily, monthly, and yearly, making it highly versatile for various hydrological applications. In this study, the annual rainfall depth was used to analyze the spatial distribution of precipitation across the Riyadh region.
The dataset specifically utilized in this research covers the period from 2001 to 2003. This time frame was chosen to analyze the rainfall patterns and trends during these initial years of the PDIR-Now dataset’s coverage. The annual rainfall depth in the Riyadh region, as captured by the PDIR-Now dataset, ranges from 37 mm to over 200 mm per year, demonstrating significant spatial variability. To provide a clear visual representation of this variability, Figure 5 shows the spatial distribution of mean annual rainfall across the Riyadh region. The map highlights the variation in rainfall depths, with the lowest values (blue shades) concentrated in the central and southern parts of the region and higher values (yellow to red shades) in the northern and northeastern areas. This visualization underscores the heterogeneous nature of rainfall distribution within the study area.
The choice of PDIR-Now is supported by its demonstrated superior performance, as highlighted in recent research [
40]. It has been found to outperform other satellite precipitation products in arid regions in terms of rainfall detection, correlation, and spatial distribution, making it a viable alternative to traditional rain gauges. Additionally, the effectiveness of PDIR-Now in capturing heavy rainfall over Saudi Arabia has been emphasized in a study by [
38]. The dataset excels in detecting extreme precipitation, particularly in the “Heavy Rain” category, which is crucial for accurate hydrological modeling in arid regions.
The PDIR-Now dataset surpasses other near-real-time products from CHRS in precipitation detection. Climatological data are used to correct errors by linking brightness temperature with rain rate, and high-frequency infrared image sampling enables rainfall estimates to be generated shortly after precipitation begins. The underlying algorithm, based on the PERSIANN-CCS framework, includes dynamic adjustments to the cloud-top temperature and rainfall rate curves, and the precipitation threshold was lowered from 273 K to 263 K to improve the detection of warm precipitation [
39].
The enhanced capabilities of PDIR-Now make it a valuable tool for hydrological modeling, particularly in regions where ground-based precipitation measurements are sparse [
38]. By providing high-resolution, near-real-time precipitation data, PDIR-Now significantly contributes to the accuracy and reliability of hydrological studies and water resource management.
2.2. Ground-Based Observations
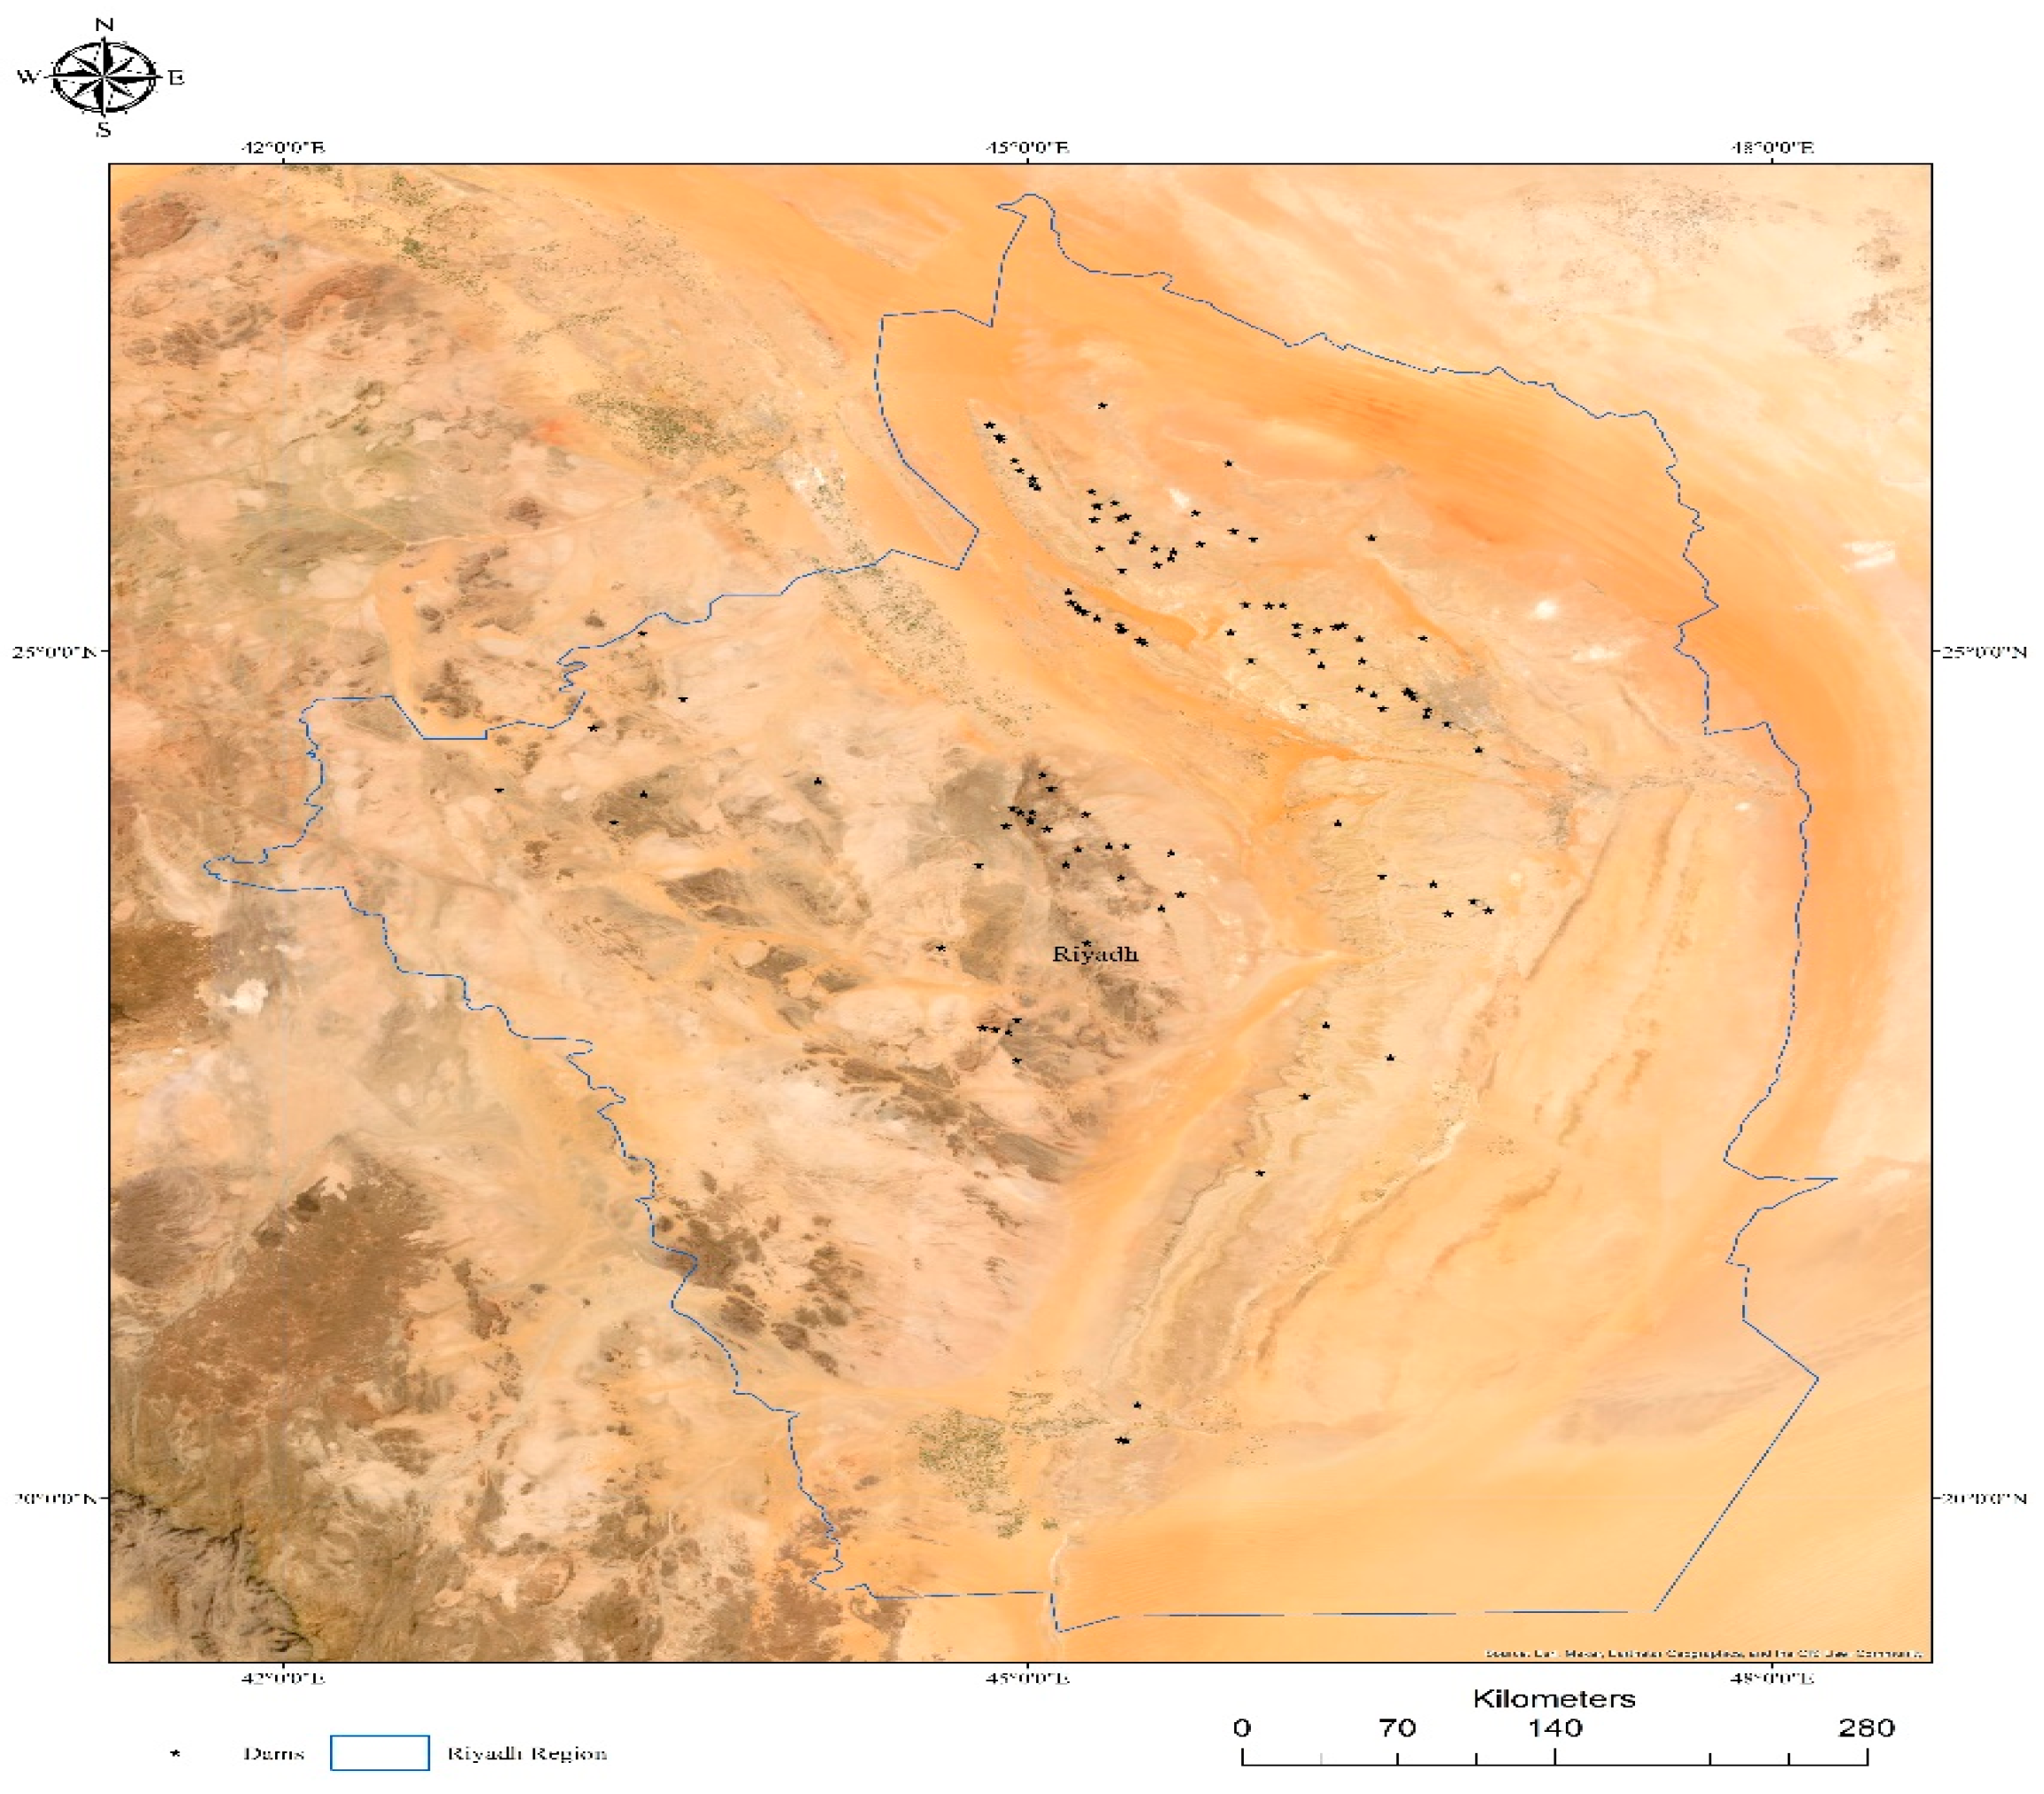
The Riyadh region relies heavily on seasonal precipitation for its surface water resources, which are vital for recharging shallow groundwater aquifers. To effectively manage these resources, the region has developed a comprehensive dam infrastructure consisting of 117 dams with a total storage capacity of approximately 105.17 million cubic meters. This infrastructure is critical to the region’s strategic water resource management and sustainable development.
As illustrated in
Figure 2, Riyadh’s dams are divided into two key categories: protection dams and recharge dams. The region operates 93 protection dams, with a combined storage capacity of 88.53 million cubic meters, designed primarily to mitigate flood risks and ensure environmental stability. In addition, 24 recharge dams, with a capacity of 16.64 million cubic meters, play a crucial role in maintaining groundwater levels, further highlighting the interconnected nature of surface and groundwater resources in the region.
The primary data source for this study is the historical record of daily runoff reaching each dam, provided by the Ministry of Environment, Water, and Agriculture through the General Administration of Water Resources. In the Riyadh region, there are no dedicated gauging stations for measuring runoff directly in river channels or streams. Therefore, the only available measurements are those recorded at the dams. These records include daily measurements of runoff water stored behind the dams and serve as an indirect method of assessing surface water flow. These records are essential for tracking changes in water stock, particularly during flood events, and are the main dataset for analyzing runoff patterns in the region.
By analyzing variations in the dam records, insights can be gained into the contributions of seasonal rainfall to surface runoff. This data is crucial for evaluating the annual runoff coefficient, which links the management of dam infrastructure to the broader understanding of water resource dynamics in the Riyadh region. However, the reliance on dam records presents certain limitations. The absence of gauging stations means there is no spatially distributed runoff data across the region. This limitation poses challenges for capturing the full variability of runoff events and for validating satellite-derived precipitation estimates, as the ground-based records may not reflect real-time changes in surface water availability. Additionally, the highly variable nature of rainfall and the occurrence of flash floods in the region can result in abrupt changes in runoff, which may not be fully captured by dam records alone.
Despite these challenges, the integration of dam records with satellite observations is crucial for providing a more comprehensive assessment of surface water dynamics. Satellite data offer broader spatial coverage and real-time monitoring of precipitation, which helps address some of the limitations of ground-based measurements. This integrated approach enhances the accuracy and reliability of surface water assessments and supports the effective management of water resources in the Riyadh region.
2.3. Mean Annual Runoff Coefficient
The runoff coefficient (CR) represents the proportion of rainfall that promptly converts to surface runoff. It is determined by the ratio of the annual runoff volume to the annual rainfall volume within the same basin area. Accurate estimation of the mean runoff coefficient is essential for effective rainwater harvesting and runoff water management, particularly in semi-arid and arid regions like Riyadh, where there are considerable variations in altitude and rainfall intensity. In addition to rainfall characteristics such as intensity, duration, and distribution, specific physical factors of the catchment area also play a significant role in influencing the runoff coefficient.
Evaluating the surface runoff coefficient involves quantifying runoff volumes and analyzing rainfall levels within specific catchment areas. Given the limited availability of runoff gauges in the study area, dams will be utilized as reference points to estimate runoff volumes. The analysis will focus on the average annual rainfall depth, a crucial factor for accurately determining the flow coefficient. While shorter timeframes may be affected by various factors such as short-term weather variations, storm intensity, land-use changes, and evaporation rates, the annual rainfall depth provides a more accurate estimation of the runoff coefficient over longer periods.
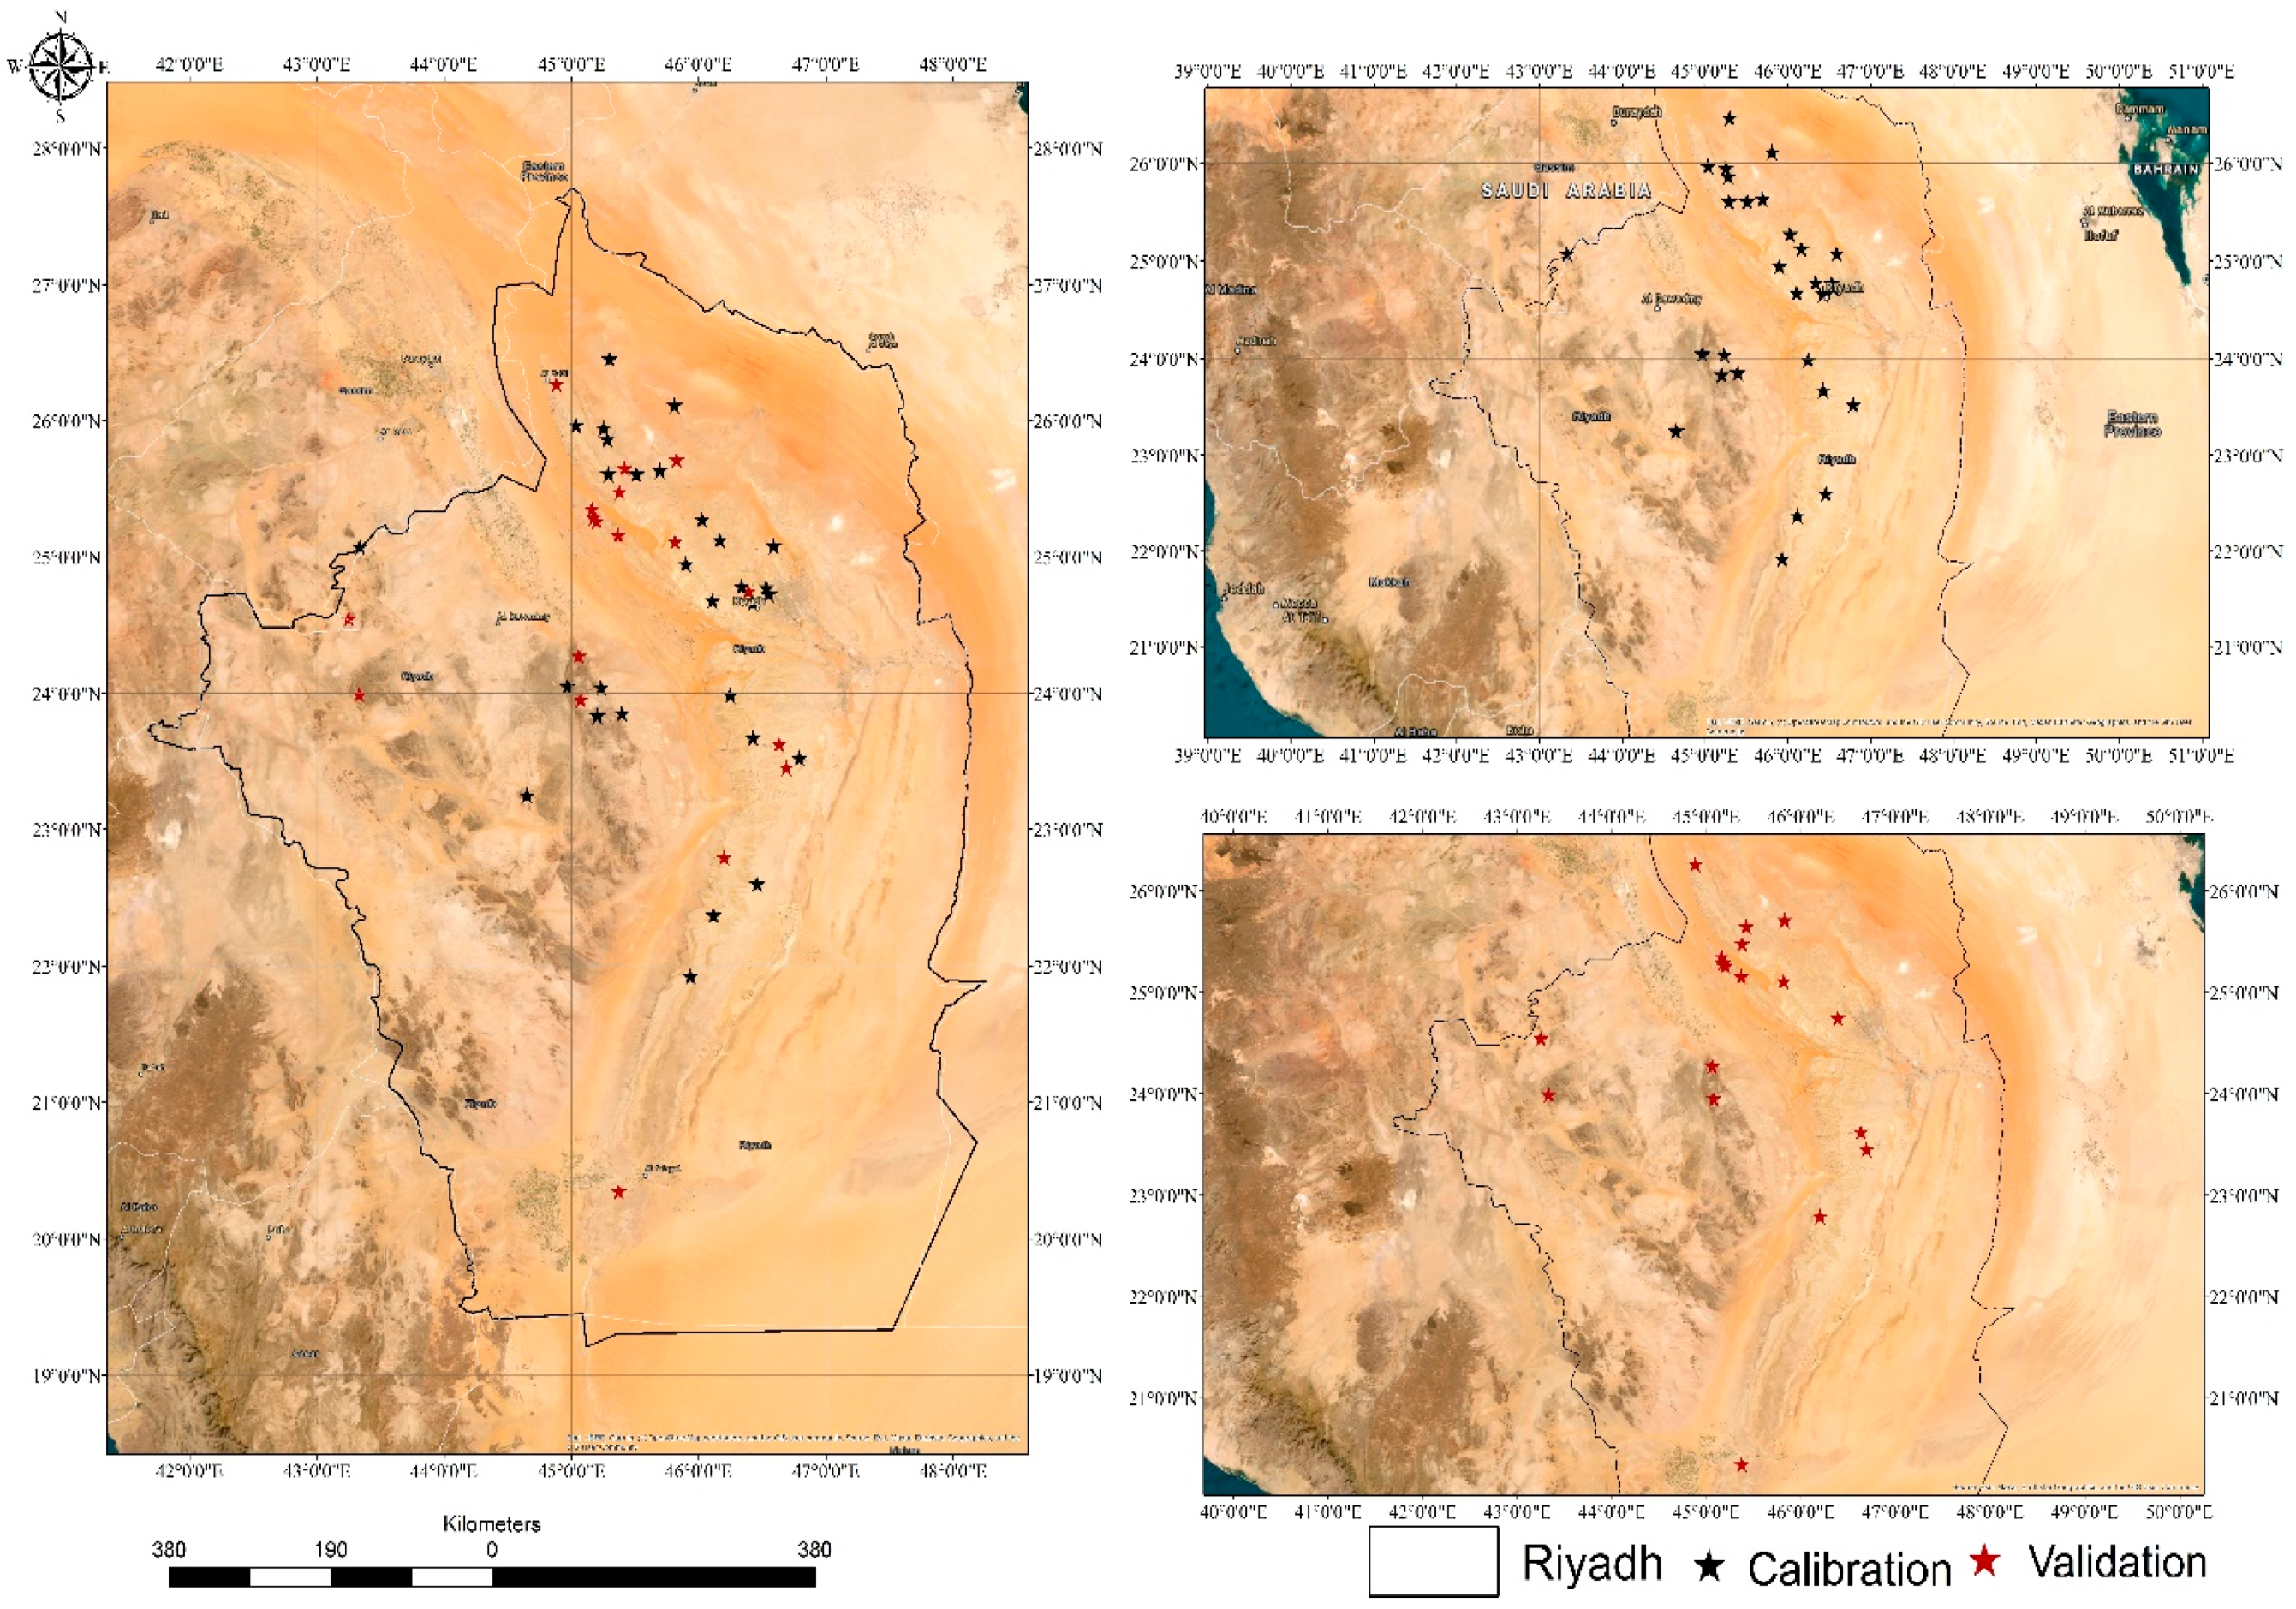
This study methodologically divides the dams with available records into two categories: calibration and validation. Calibration dams, marked in black in
Figure 3, are used to calibrate the runoff coefficient, while validation dams, indicated in red, serve to validate the methodology using their records. This systematic approach ensures a comprehensive evaluation of the runoff coefficient under varying conditions and datasets.
The assignment of dams into the calibration (29 dams) and validation (10 dams) datasets was conducted randomly. This random selection was employed to ensure an unbiased representation of the dams within the region, thereby allowing the calibration and validation sets to reflect the overall variability in runoff patterns. While random assignment may introduce some variability, it helps prevent the introduction of selection bias and ensures that the model’s performance is tested across a diverse set of conditions.
2.4. Evaluation
When assessing the accuracy of the annual runoff coefficient (CR), statistical metrics such as Mean Bias (MB) and Root Mean Square Error (RMSE) are essential. These metrics provide insights into the deviation of the calculated runoff coefficient from the observed values, ensuring the reliability of water resource management practices.
Mean Bias (MB)
Mean Bias (MB) measures the average difference between the calculated and observed runoff coefficient values. It indicates whether there is a systematic overestimation or underestimation in the calculations. MB is calculated as follows:
where
represents the calculated runoff volume,
represents the observed runoff coefficient, and n is the total number of observations.
Positive MB: Indicates that the calculated runoff coefficient tends to be higher than the observed values.
Negative MB: Indicates that the calculated runoff coefficient tends to be lower than the observed values.
Zero MB: Implies no systematic bias in the calculated values.
By analyzing MB, we can determine if the calculations consistently overestimate or underestimate the runoff coefficient.
Root Mean Square Error (RMSE)
Root Mean Square Error (RMSE) measures the average magnitude of errors between the calculated and observed values. It provides a comprehensive measure of the accuracy of the calculated runoff coefficient. RMSE is calculated as follows:
Lower RMSE: Indicates better accuracy, with calculated values closer to the observed values.
Higher RMSE: Indicates poorer accuracy, with larger deviations from the observed values.
RMSE accounts for both the variance and bias in the calculations, making it a robust metric for evaluating the overall accuracy of the runoff coefficient.
In this study, MB and RMSE will be used to evaluate the accuracy of the annual runoff coefficient derived from observed data. The steps involved are:
Data Collection: Gather observed runoff coefficient values from dam records and rainfall data for the study area.
Calculation of MB and RMSE: Compute the MB and RMSE for the collected data to evaluate the accuracy of the runoff coefficient.
Analysis of Results: Analyze the MB to identify any systematic biases and the RMSE to assess the overall accuracy of the calculated runoff coefficient.
By employing MB and RMSE, this study aims to ensure the accuracy and reliability of the runoff coefficient estimates, which are critical for effective water resource management in semi-arid and arid regions such as Saudi Arabia.
2.5. Estimation of Water Availability
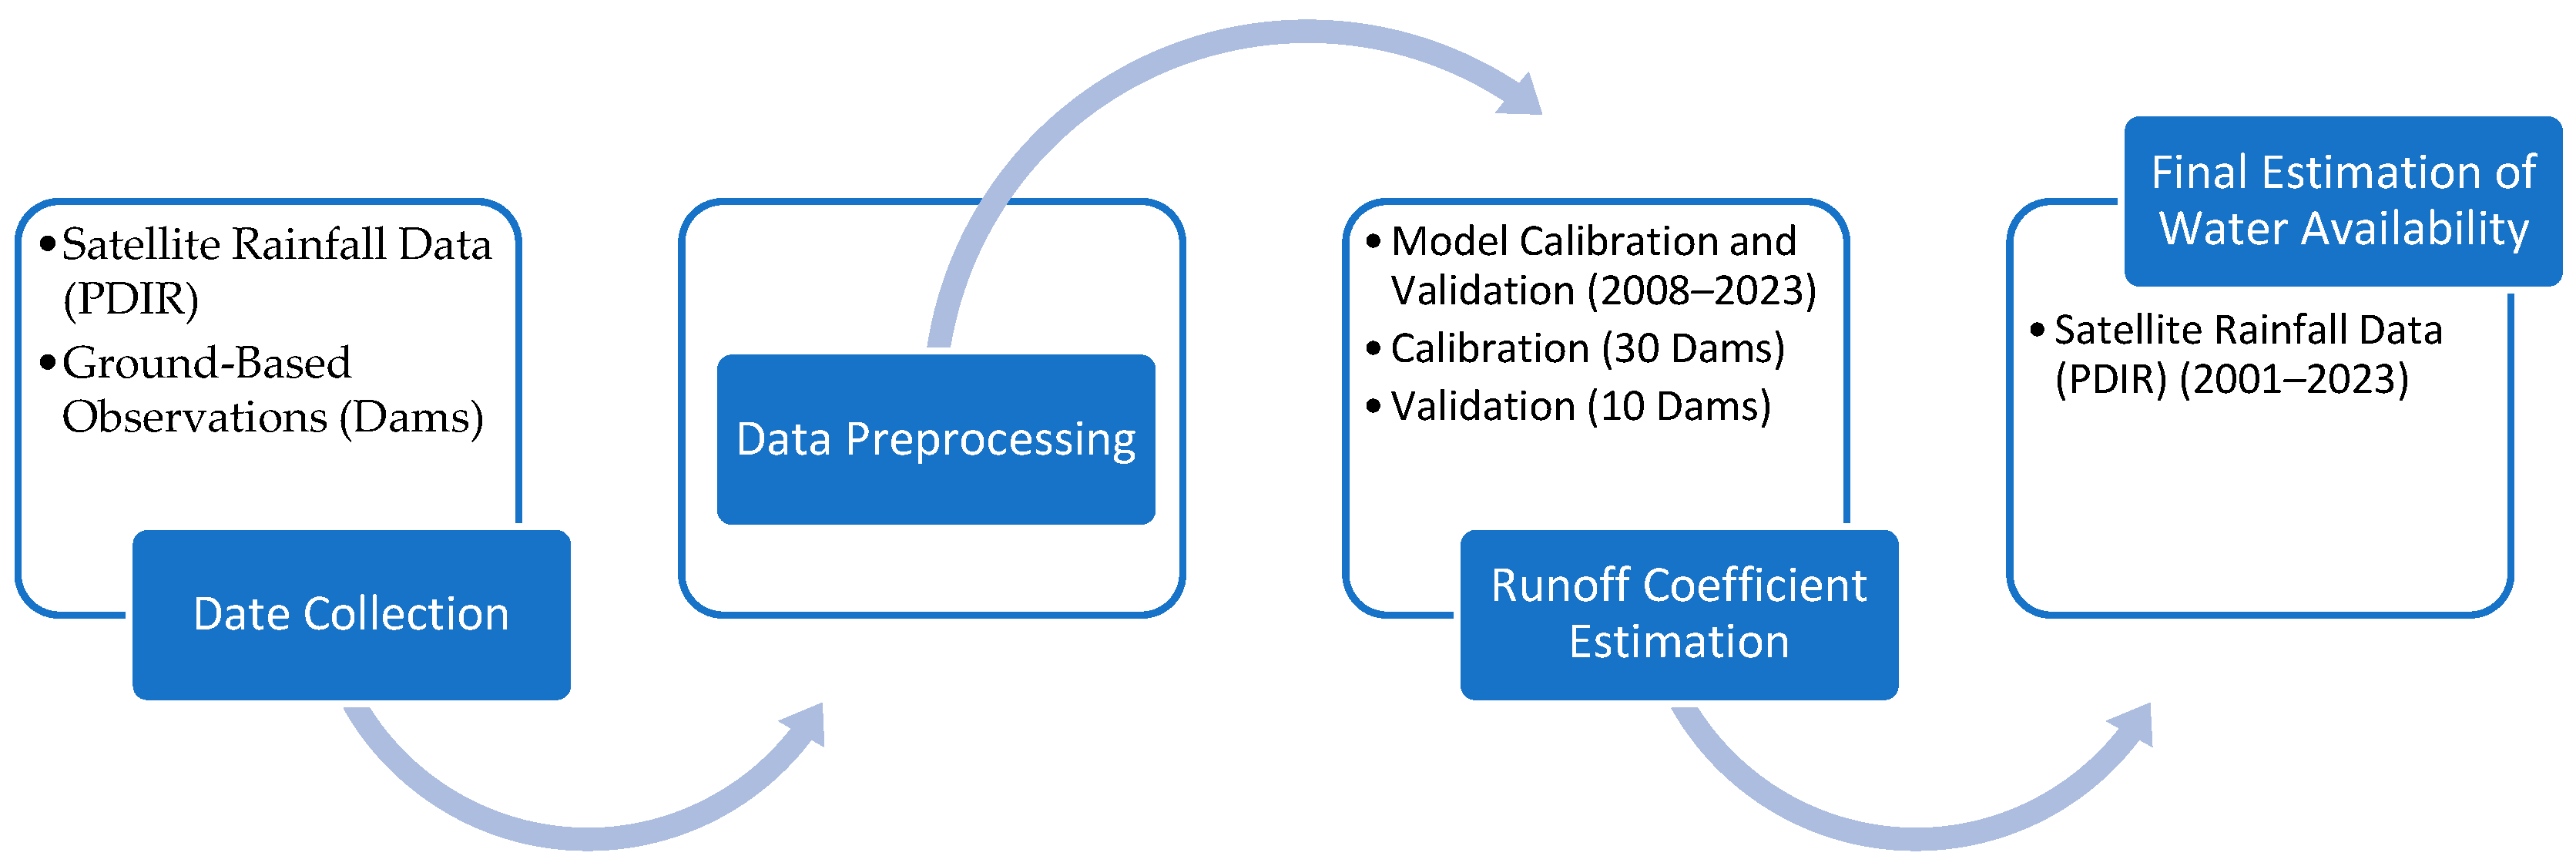
Following calibration and validation, the model was applied to estimate total surface water availability across the Riyadh region. This final stage involved integrating the estimated runoff coefficients with long-term precipitation data to generate comprehensive estimates of water resources.
Figure 4 illustrates the flowchart depicting the conceptual framework for the estimation of water availability.
3. Results
3.1. Mean Annual Rainfall Analysis (2008–2024)
In
Figure 5, the spatial distribution of mean annual rainfall across the Riyadh region is illustrated, revealing significant variability in precipitation levels. The analysis of rainfall data from 2008 to 2024 highlights crucial spatial differences that are essential for understanding and planning water resource management in the region.
The western and southern parts of the Riyadh region exhibit the lowest mean annual rainfall, ranging from 37 to 46 mm per year, indicating the arid conditions prevalent in these areas. In contrast, the central areas, including the city of Riyadh, experience moderate rainfall levels, with mean annual values between 54 and 86 mm per year. This moderate rainfall supports various water resource management activities, emphasizing the need for efficient runoff and storage strategies.
The northeastern part of the Riyadh region receives the highest annual rainfall, ranging from 143 to 207 mm per year. The higher rainfall in this area is likely influenced by topographical elevation, which enhances rainfall accumulation.
The spatial variability in rainfall has significant implications for water resource management. Regions with higher rainfall are expected to contribute more significantly to surface runoff, affecting storage levels in dams. Therefore, an accurate estimation of the runoff coefficient (CR) is critical for effective rainwater harvesting and runoff management.
Moreover, the detailed rainfall data for the period 2008–2024 was instrumental in calibrating hydrological models, which are necessary for predicting water availability and planning for domestic and agricultural water needs. The alignment of rainfall analysis with dam storage records provided a robust basis for improving the accuracy of runoff coefficient estimations and enhancing water management strategies in semi-arid and arid regions like Riyadh. This comprehensive analysis underscores the importance of understanding spatial rainfall patterns to develop effective water management strategies that ensure the sustainability of water resources in the Riyadh region.
3.2. Total Annual Observed Runoff (2008–2023)
The analysis of total annual observed runoff from 2008 to 2023, as presented in
Table 1, provides critical insights into the variability and trends in surface water availability across the Riyadh region. The total annual observed runoff, expressed in million cubic meters (mil. m
3), represents the cumulative runoff from all dams each year.
Significant fluctuations in annual runoff were observed throughout the study period. The highest total annual runoff was recorded in 2013, with approximately 75.58 mil. m3, which can be attributed to exceptionally high rainfall that year. Similarly, 2018 experienced a high total annual runoff, reaching nearly 63.94 mil. m3, reflecting another period of substantial rainfall. These peak runoff years underscore the direct influence of rainfall variability on surface water availability.
In contrast, the lowest annual runoff was recorded in 2021, with just about 4.57 mil. m3, highlighting the region’s vulnerability to low rainfall periods. Other years with notably low runoff include 2010 and 2012, with annual totals of 36.22 mil. m3 and 30.10 mil. m3, respectively. These variations illustrate the sporadic nature of rainfall events in the region, which can fluctuate dramatically from year to year.
To further highlight the variability in annual runoff, the standard deviation and coefficient of variation were calculated. The standard deviation of the annual runoff over this period is 20.16 mil. m3, indicating significant deviations from the mean annual runoff of 41.14 mil. m3. A higher standard deviation reflects the considerable year-to-year fluctuations in runoff volumes. The coefficient of variation, calculated at 49.00%, provides a relative measure of this variability, showing that the annual runoff can fluctuate by nearly half of the mean value. This high coefficient of variation emphasizes the irregular and unpredictable pattern of rainfall events in the Riyadh region.
These statistical measures not only quantify the extent of variability in surface water availability but also demonstrate the region’s susceptibility to extreme hydrological conditions. By understanding these fluctuations, water resource managers can anticipate periods of surplus and deficit more effectively. This comprehensive assessment of annual runoff variability underscores the necessity for flexible and adaptive water resource management strategies in the Riyadh region to ensure sustainable surface water use under variable climatic conditions.
3.3. Runoff Coefficient Estimation
3.3.1. Rainfall–Runoff Relationship
The calibration of the rainfall–runoff relationship involved categorizing the dams into two groups: calibration dams and verification dams. A total of 30 dams were designated for calibration, while 18 were set aside for verification. The calibration dams included records from various periods, with data ranging from 2008 to 2024. These varying timeframes were carefully considered when calculating and recording the rainfall and runoff data.
During the calibration process, the recorded rainfall data were systematically compared with the corresponding runoff data for each dam based on the available annual records. This comparison was essential in establishing a precise relationship between the amount of rainfall and the resulting runoff within the basins of these dams.
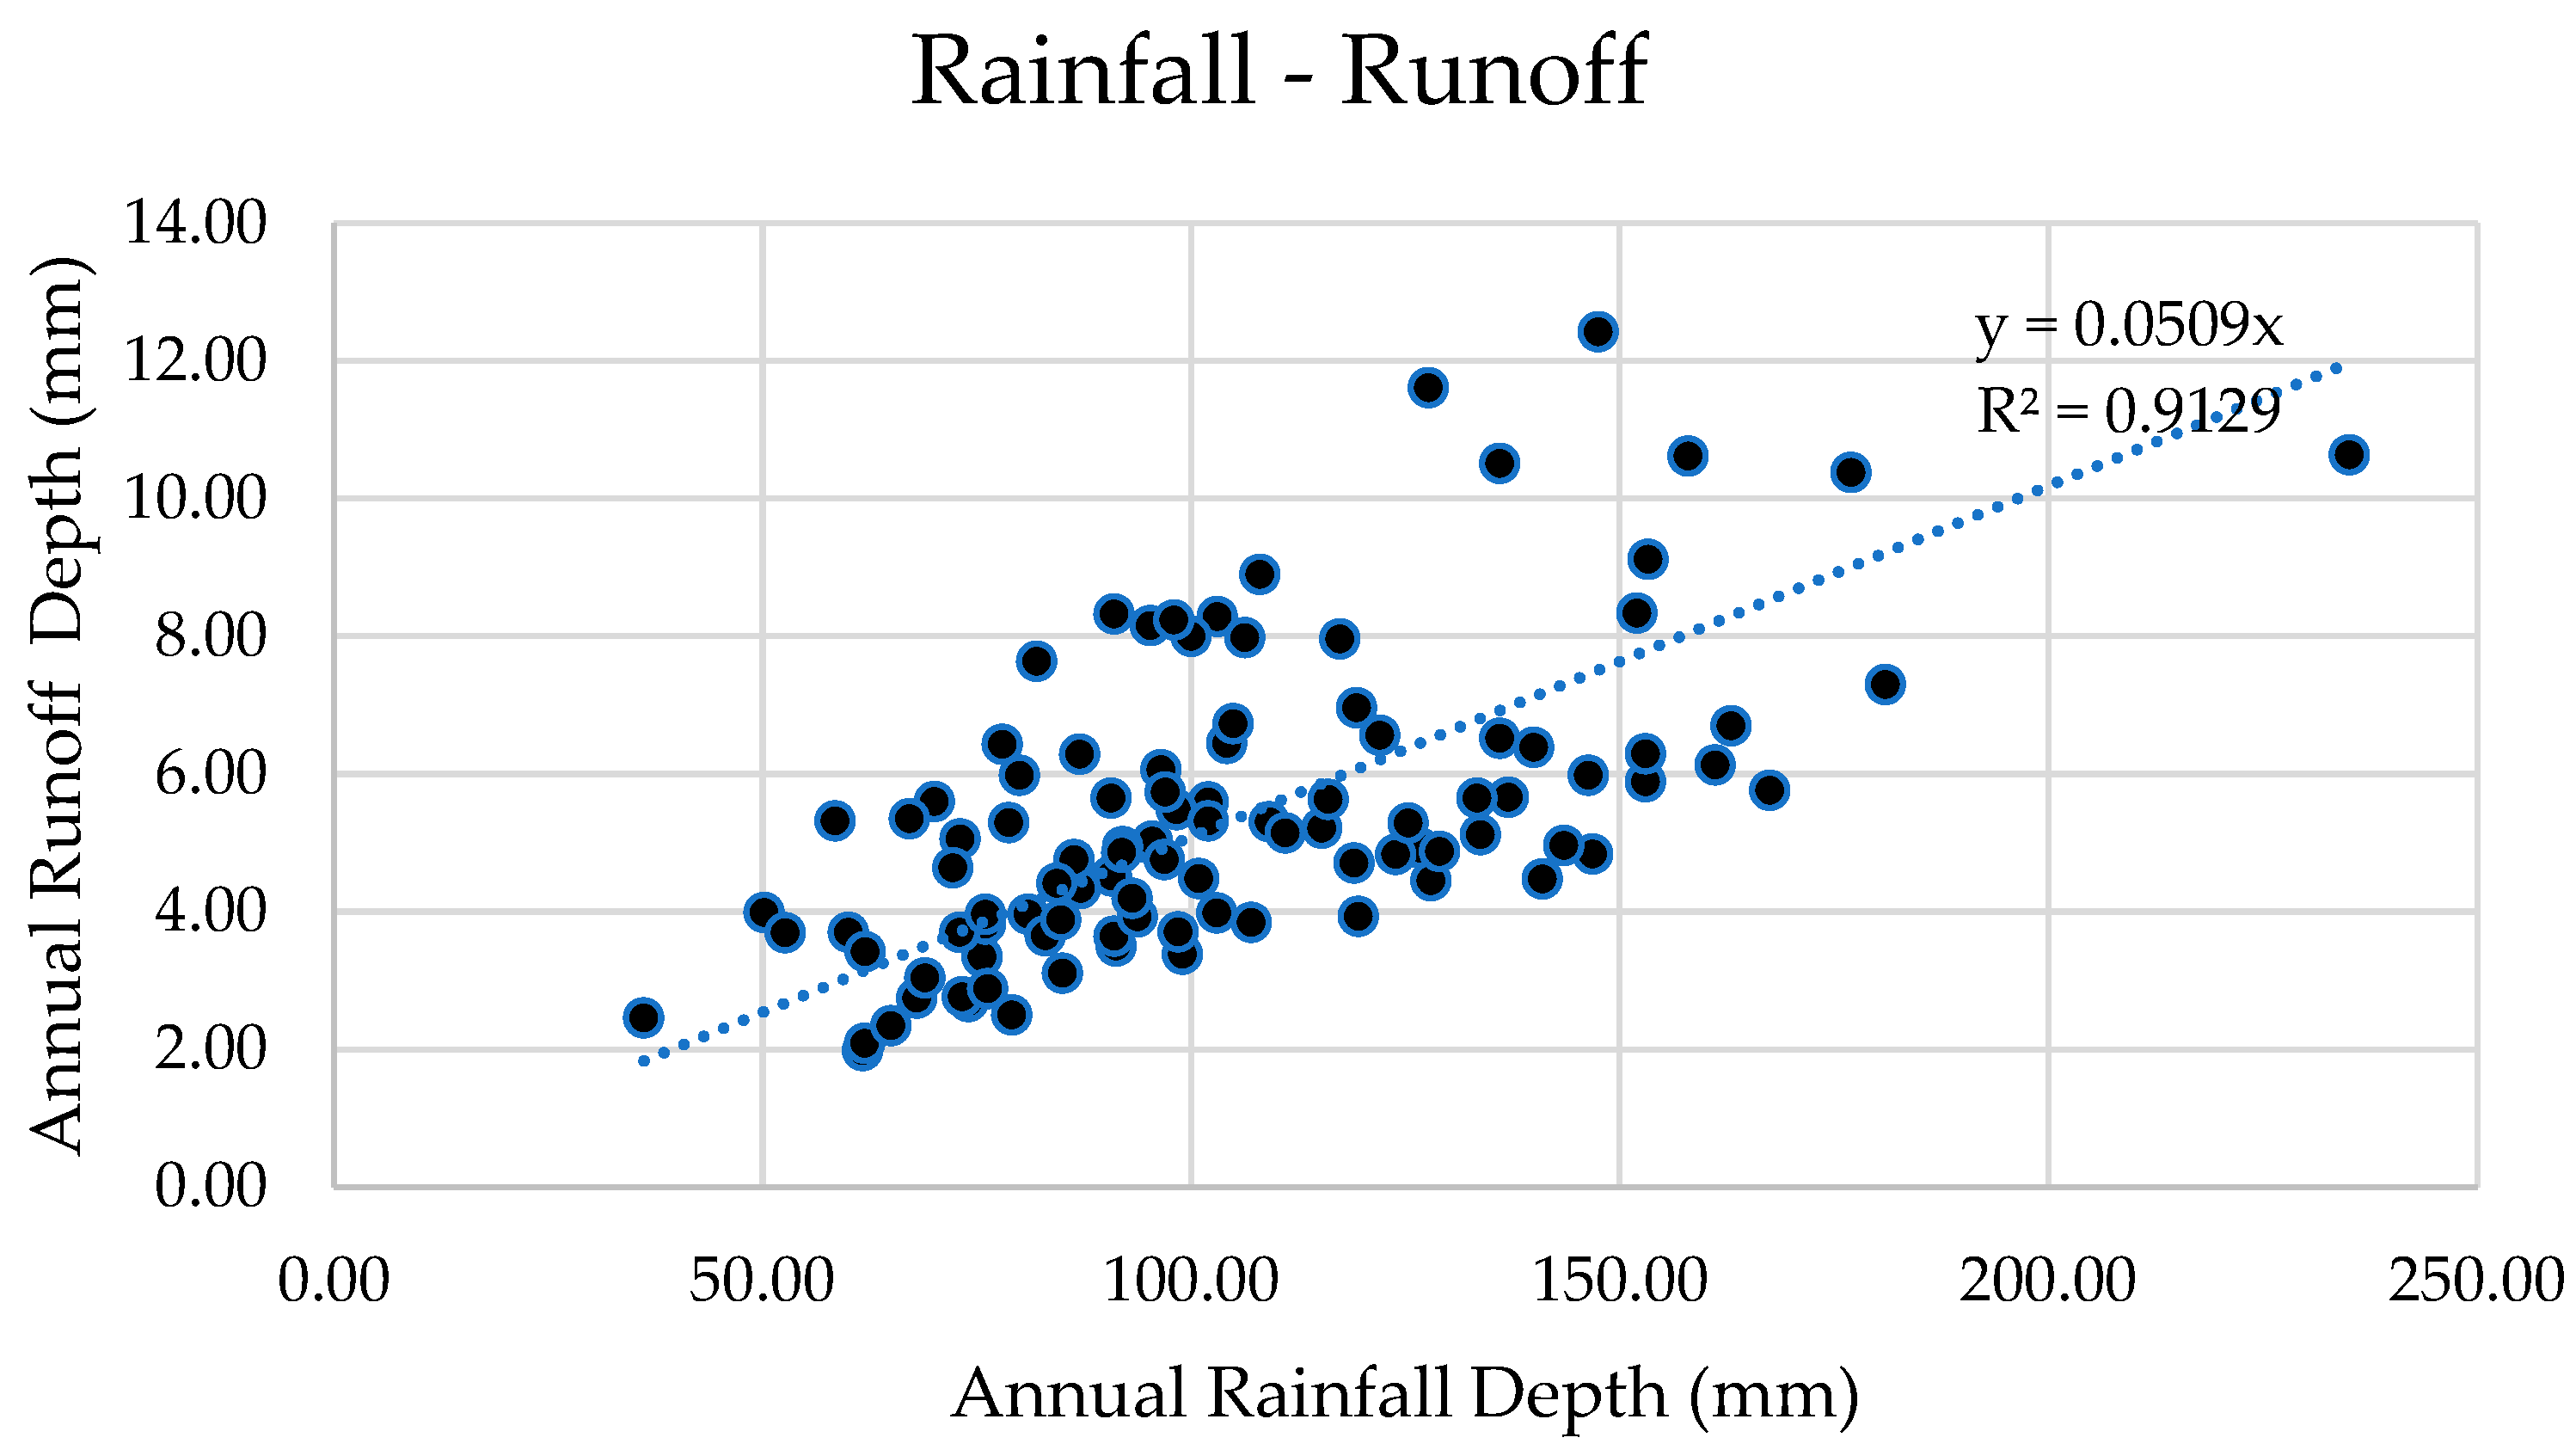
As depicted in
Figure 6, a strong correlation between the amount of rainfall and the depth of runoff across all the calibration dams was observed. The data points plotted on the graph illustrate a clear linear relationship, indicating that as rainfall depth increases, the depth of the generated runoff also increases proportionally. The linear equation depicted in the figure, with a high coefficient of determination (R
2 = 0.9129), demonstrates a robust correlation between these two variables.
The runoff coefficient, derived from the slope of the linear regression line in
Figure 6, is approximately 0.0509. This value indicates that for each millimeter of rainfall, about 5.09% is converted into runoff. The relatively high R
2 value further confirms the accuracy of this linear model, suggesting that the rainfall–runoff dynamics in the Riyadh region are well-represented by this coefficient.
The runoff coefficient is a crucial parameter in hydrological modeling, as it reflects the efficiency with which rainfall is transformed into surface runoff within the region. The value derived from this calibration aligns with the characteristics of the Riyadh region, where factors such as soil types, land cover, and topography significantly influence the rainfall–runoff process. This coefficient will be instrumental in predicting runoff under varying rainfall scenarios, thereby supporting more precise and reliable water resource management strategies.
The high degree of agreement observed in the calibration process underscores the reliability of the linear model in capturing the dynamics between rainfall and runoff. The calibration process, validated by the strong linear correlation observed in
Figure 6, ensures that the hydrological models used for water resource management in the region are both accurate and robust. The linear equation derived from this calibration will serve as a critical tool in predicting runoff based on future rainfall data, thereby aiding in the effective management of water resources in the region.
3.3.2. Rainfall–Runoff Calibration across Dams in the Riyadh Region
The data presented in
Table 2 offers significant insights into the relationship between mean annual rainfall, observed runoff, and estimated runoff across various calibration dams in the Riyadh region. The mean annual rainfall across these dams varies considerably, ranging from 68 mm at Al Dahinah to 146.85 mm at Hotat Bani Tamim, with an overall average rainfall of 103.86 mm, reflecting the semi-arid climate typical of the region.
The mean annual observed runoff, representing the actual runoff recorded at these dams, also shows variability, from 2.5 mm at Al Khunqah to 7.24 mm at Al Thumailah. The overall mean observed runoff is 5.06 mm. A clear trend is observed where dams receiving higher rainfall, such as Al Thumailah and Hotat Bani Tamim, typically exhibit higher observed runoff, indicating a strong correlation between rainfall and runoff.
When analyzing the mean annual estimated runoff derived from hydrological modeling, the average value across all dams is slightly higher at 5.29 mm compared to the observed mean of 5.06 mm. This close alignment between estimated and observed values suggests that the model generally captures the runoff dynamics with a reasonable degree of accuracy. However, discrepancies become apparent upon closer examination. For instance, at Al Khunqah, the model estimated a mean annual runoff of 4.03 mm, which is significantly higher than the observed 2.5 mm, suggesting that the model may have overestimated the runoff in this area. Conversely, at Al Shamah, the estimated runoff of 6.45 mm is relatively close to the observed runoff of 4.99 mm, indicating that while the model slightly overestimates runoff, it performs well in predicting runoff for this basin.
The performance of the hydrological model was further evaluated using mean bias and root mean square error (RMSE) metrics. These metrics provide insights into the accuracy and reliability of the model’s predictions. At Al Khunqah, the model shows a mean bias of 1.53 mm and an RMSE of 2.34 mm, indicating a significant overestimation of runoff. Conversely, Al Majma’ah shows an almost perfect match between observed and estimated runoff, with a mean bias close to zero (0.01 mm) and a negligible RMSE (0.0001 mm), indicating excellent model performance.
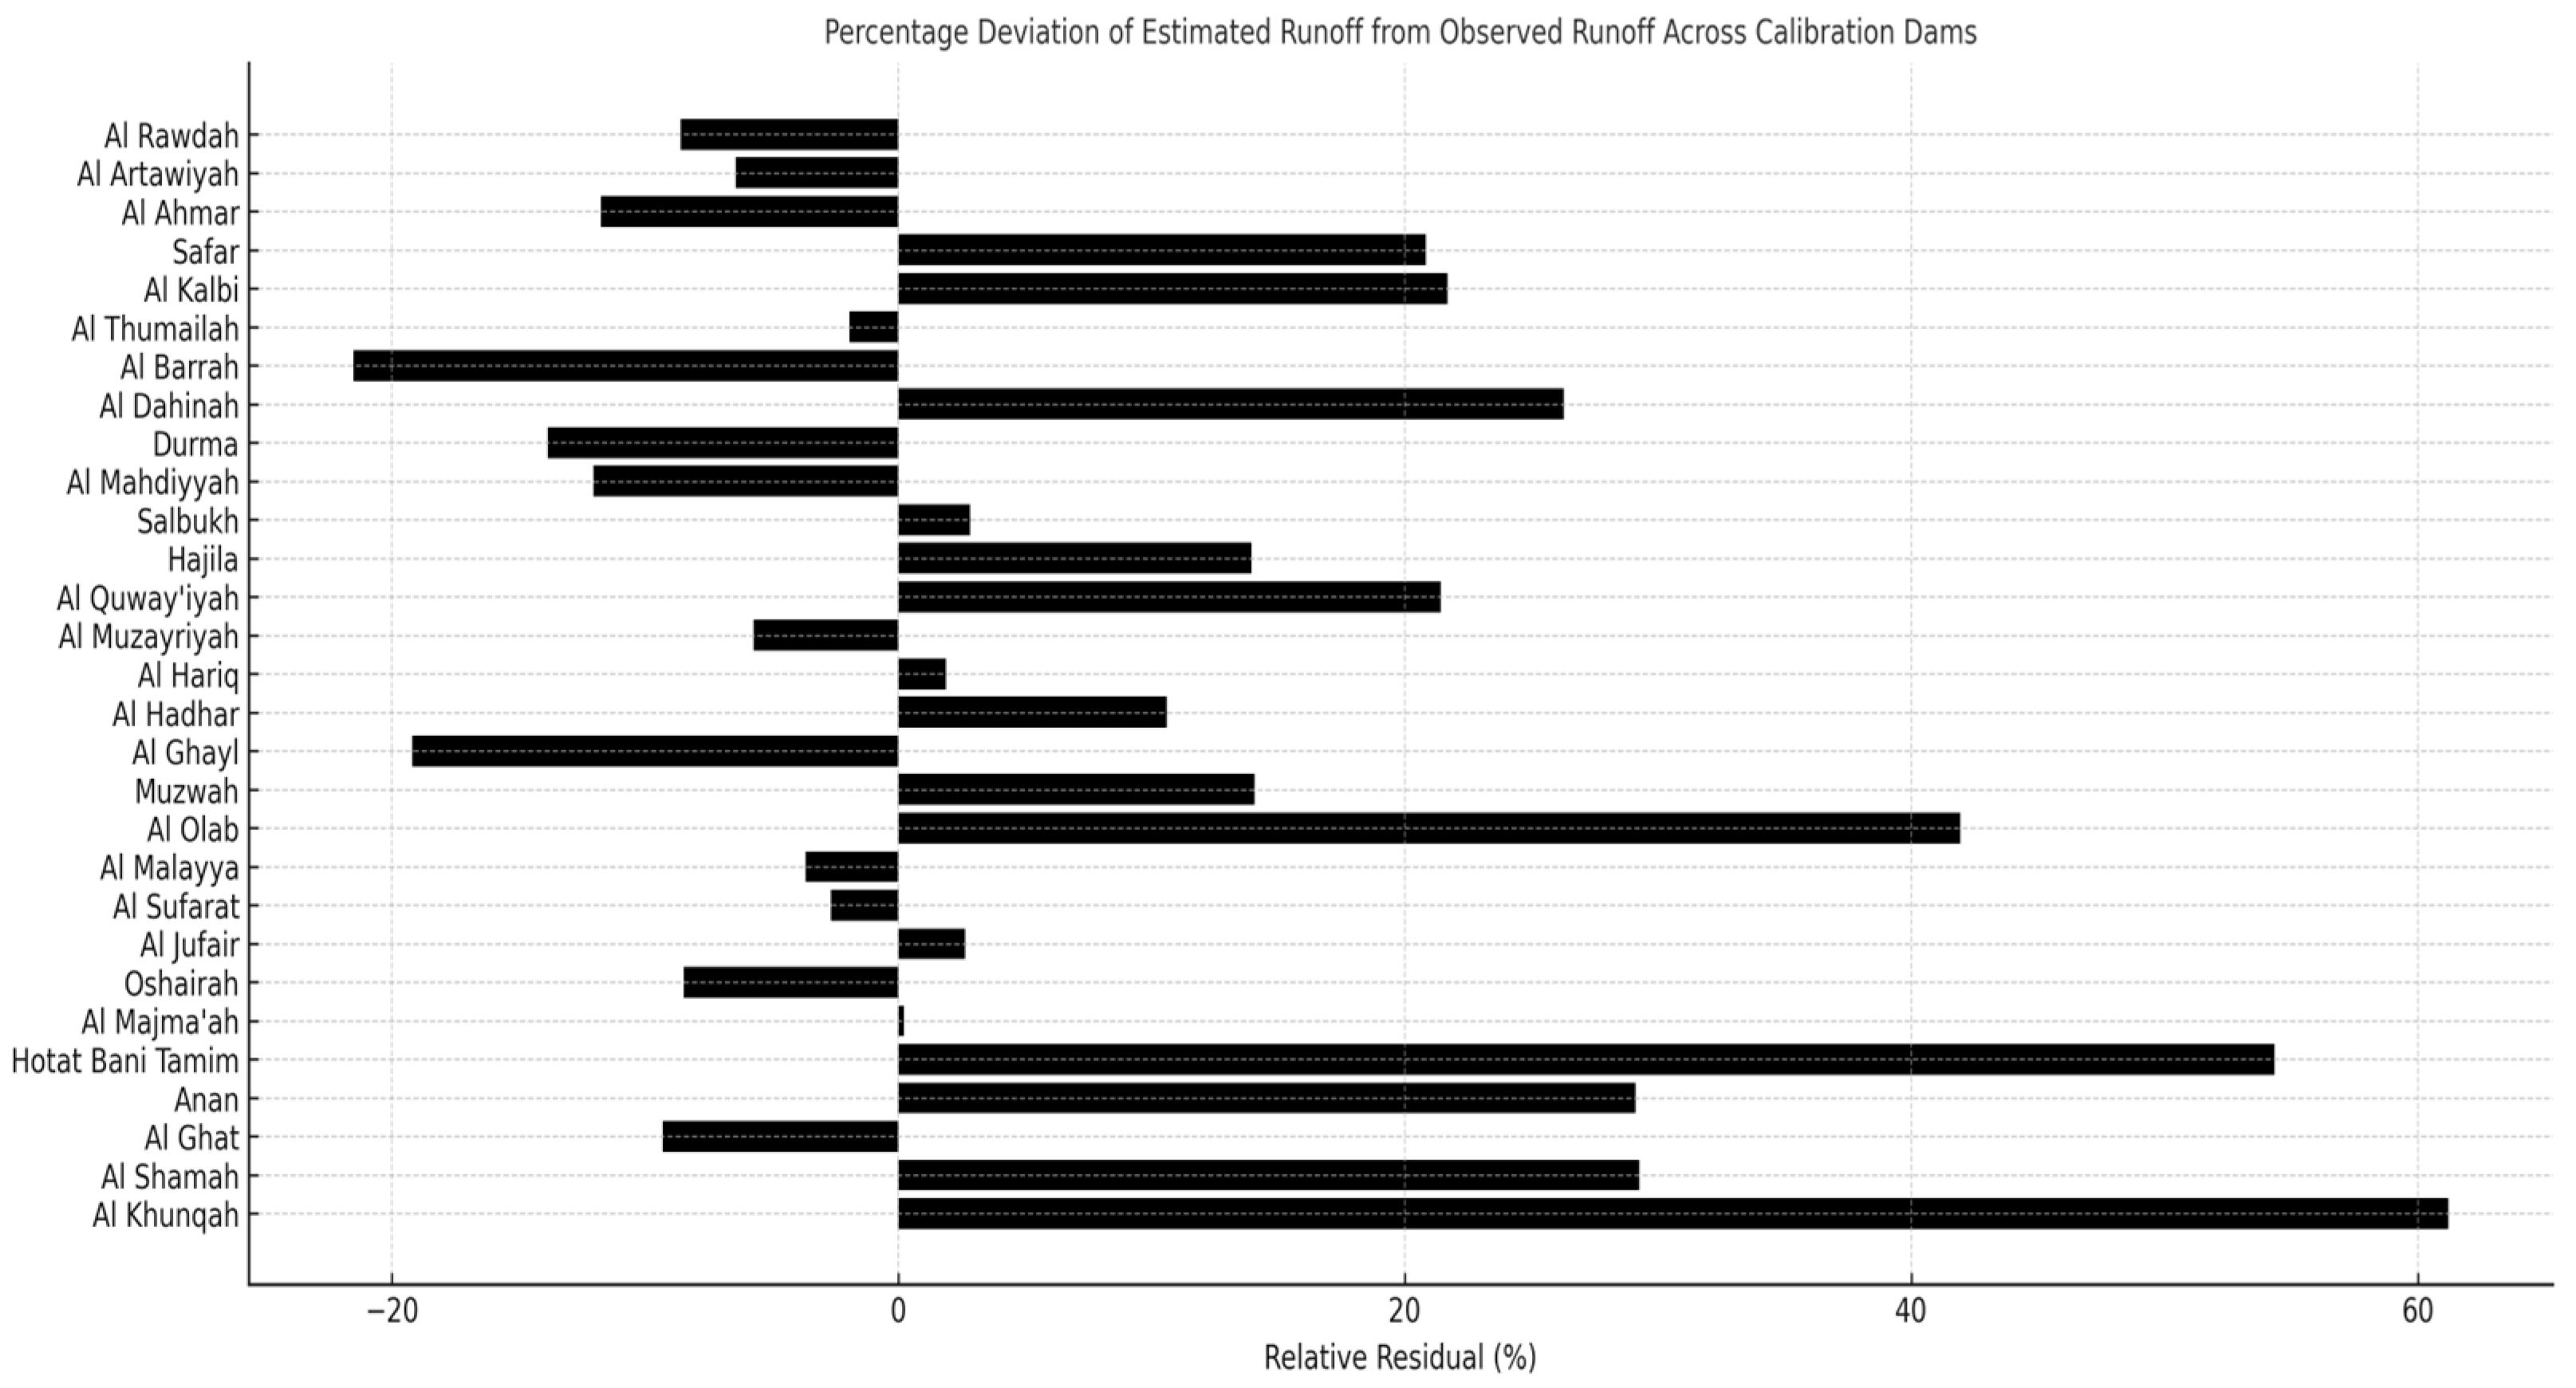
The residual analysis has been incorporated into
Table 2 to assess the differences between the observed and estimated runoff in both absolute terms (mm) and relative terms (percentages). For example, at Al Khunqah, the residual is 1.53 mm, which translates to an overestimation of 61.2% relative to the observed value. Conversely, at Al Ghat, the residual is −0.37 mm, indicating an underestimation of −9.3%. This comprehensive analysis offers a more nuanced view of the model’s performance, highlighting areas where it tends to overestimate or underestimate runoff.
Additionally, a graph illustrating the percentage deviation from observed values has been included to visually capture the model’s performance across the calibration dams, as shown in
Figure 7. This graphical representation helps identify where the model consistently overestimates or underestimates runoff, aiding in the identification of specific areas requiring further calibration.
Overall, the results indicate that while the hydrological model is generally effective in estimating runoff, particularly in regions where rainfall and runoff data are well-aligned, it tends to slightly overestimate runoff in some cases. The overall mean bias across all dams is 0.23 mm, which suggests a slight tendency of the model to overestimate runoff, while the RMSE average of 0.94 mm across all dams indicates that the model’s predictions are reasonably accurate. These findings highlight the need for further calibration, especially in areas where the model consistently over or underestimates runoff. Adjusting the model to better account for local.
3.3.3. Validation of Rainfall–Runoff Model across Validation Dams
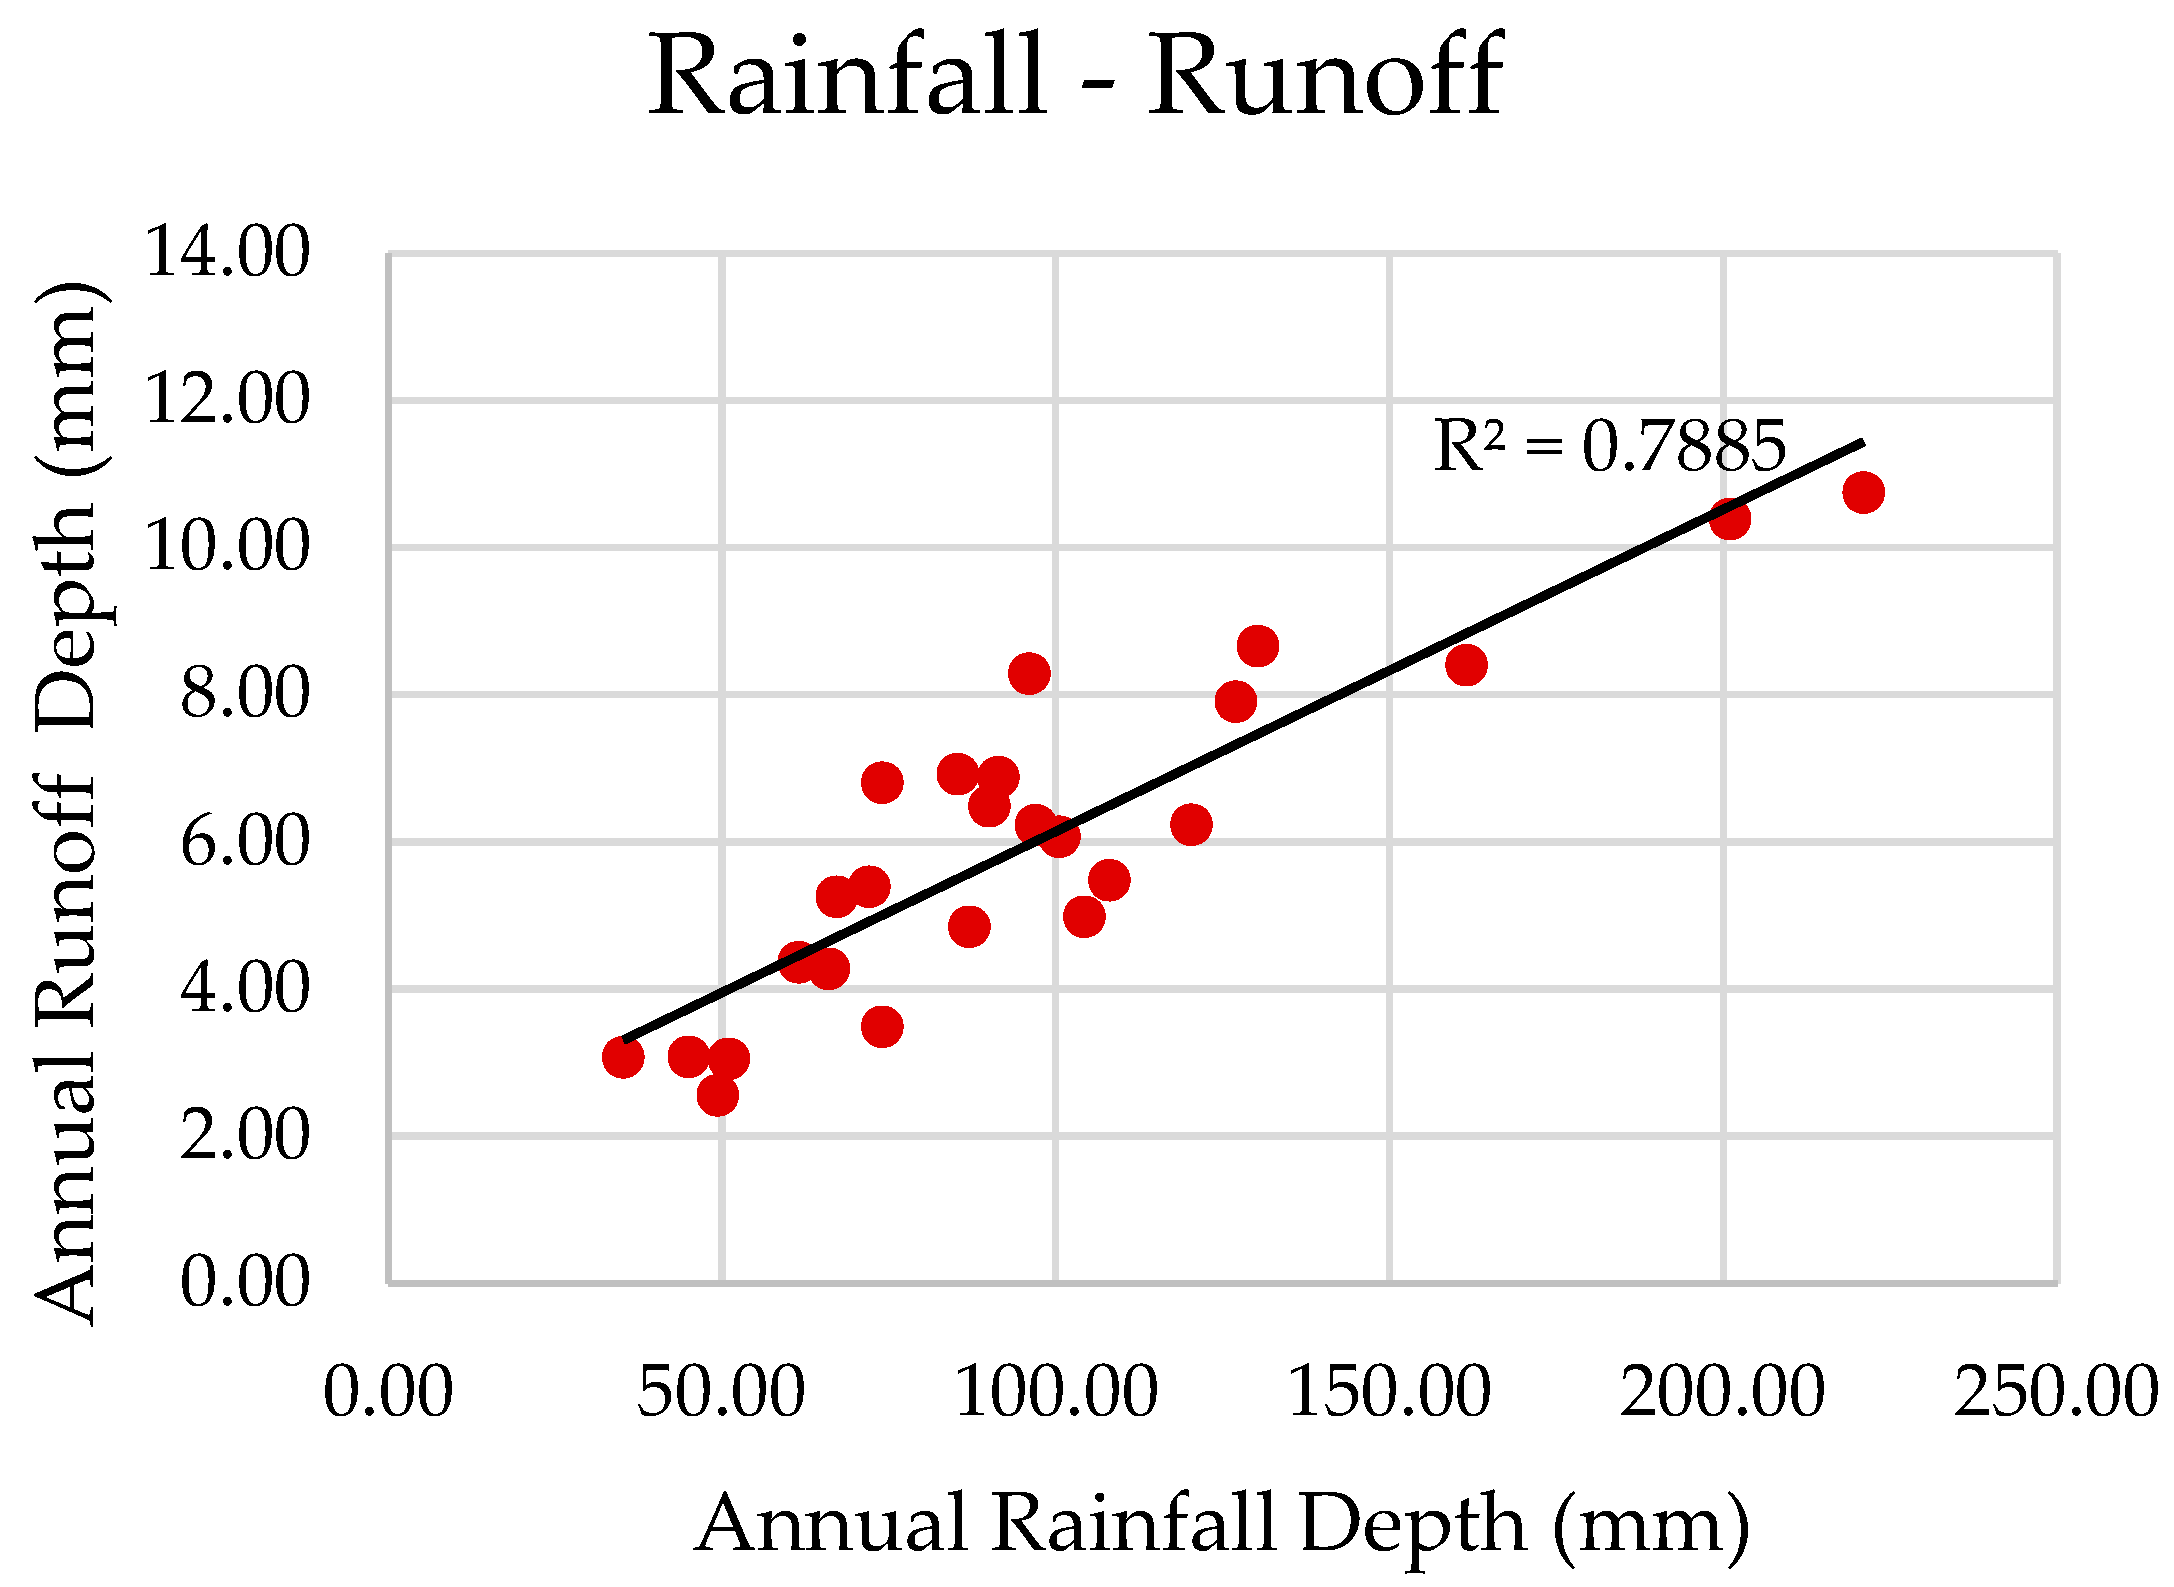
Figure 8 presents the validation results of the rainfall–runoff relationship specifically for the validation dams in the Riyadh region. These results are derived from a set of dams that were not included in the calibration process and, therefore, serve as an independent test of the model’s accuracy. The validation dams were used to assess the robustness of the hydrological model, ensuring that it reliably predicts runoff in areas not directly involved in the calibration of the runoff coefficient.
The scatter plot in
Figure 8 shows the correlation between annual rainfall depth (in mm) and annual runoff depth (in mm), with red data points representing observed values and the black trendline representing the model’s predictions. The coefficient of determination (R
2) of 0.7885 indicates a strong positive correlation, suggesting that the model explains approximately 78.85% of the variability in runoff based on rainfall alone. This high R
2 value confirms that the model performs well even when applied to new, uncalibrated data, demonstrating its generalizability and effectiveness across different hydrological conditions.
These results reinforce the model’s utility in predicting runoff, though some variability in the data points around the trendline suggests that local factors not accounted for in the model, such as soil properties or land use, could influence runoff in ways that slightly differ from the model’s predictions. The validation process thus confirms the model’s accuracy while also highlighting areas for potential refinement to improve predictive performance across diverse environments.
The results presented in
Table 3 provide a comprehensive evaluation of the model’s performance in estimating runoff across the validation dams in the Riyadh region. These dams, which were not included in the calibration process, serve as a critical test of the model’s accuracy and robustness.
The mean annual rainfall across the validation dams varies significantly, ranging from 50.56 mm at Tamrah to 135.56 mm at Lissad. This variation is reflected in the observed runoff, which ranges from 3.63 mm at Tamrah to 7.85 mm at Lissad. The mean observed runoff across all dams is 5.92 mm, while the mean estimated runoff is slightly lower at 4.93 mm. This discrepancy suggests a general tendency of the model to underestimate runoff, as further evidenced by the mean bias and RMSE values.
The mean bias across the dams indicates that the model tends to underestimate runoff in most cases. For example, Muhayriqah shows a significant underestimation with a mean bias of −2.24 mm, while Jallajl also exhibits a substantial underestimation with a mean bias of −1.88 mm. On the other hand, Al Hanabij demonstrates a slight overestimation with a mean bias of 0.33 mm, suggesting that the model predicts runoff slightly higher than observed in this case. The overall mean bias for all dams is −0.99 mm, confirming that the model generally underestimates runoff. To provide a more descriptive measure, the RMSE values have been expressed in percentages. For example, at Muhayriqah, the RMSE corresponds to 15.6% of the observed mean runoff, while at Jallajl, it represents 12.4%, indicating the relative deviation of the model’s predictions from the observed values.
The RMSE values provide further insight into the accuracy of the model’s predictions. Tumair shows the best performance with an RMSE of 0.00 mm, indicating an almost perfect match between the observed and estimated runoff. Conversely, Muhayriqah and Jallajl exhibit higher RMSE values of 5.04 mm and 3.54 mm, respectively, indicating larger discrepancies between observed and estimated runoff. The average RMSE across all validation dams is 1.26 mm, reflecting a moderate level of error in the model’s predictions.
Overall, the results indicate that the model tends to slightly underestimate runoff across the validation dams, as seen in the negative mean bias and the lower mean estimated runoff compared to the observed runoff. The varying RMSE values across the dams highlight the model’s inconsistent performance in different hydrological settings. While the model performs well in some areas, such as Tumair, where the RMSE is minimal, it shows significant discrepancies in others, particularly in Muhayriqah and Jallajl. These findings suggest that while the model is reasonably accurate, there is room for improvement, particularly in regions where it consistently underestimates runoff.
3.3.4. Assessing Surface Water Availability in the Riyadh Region
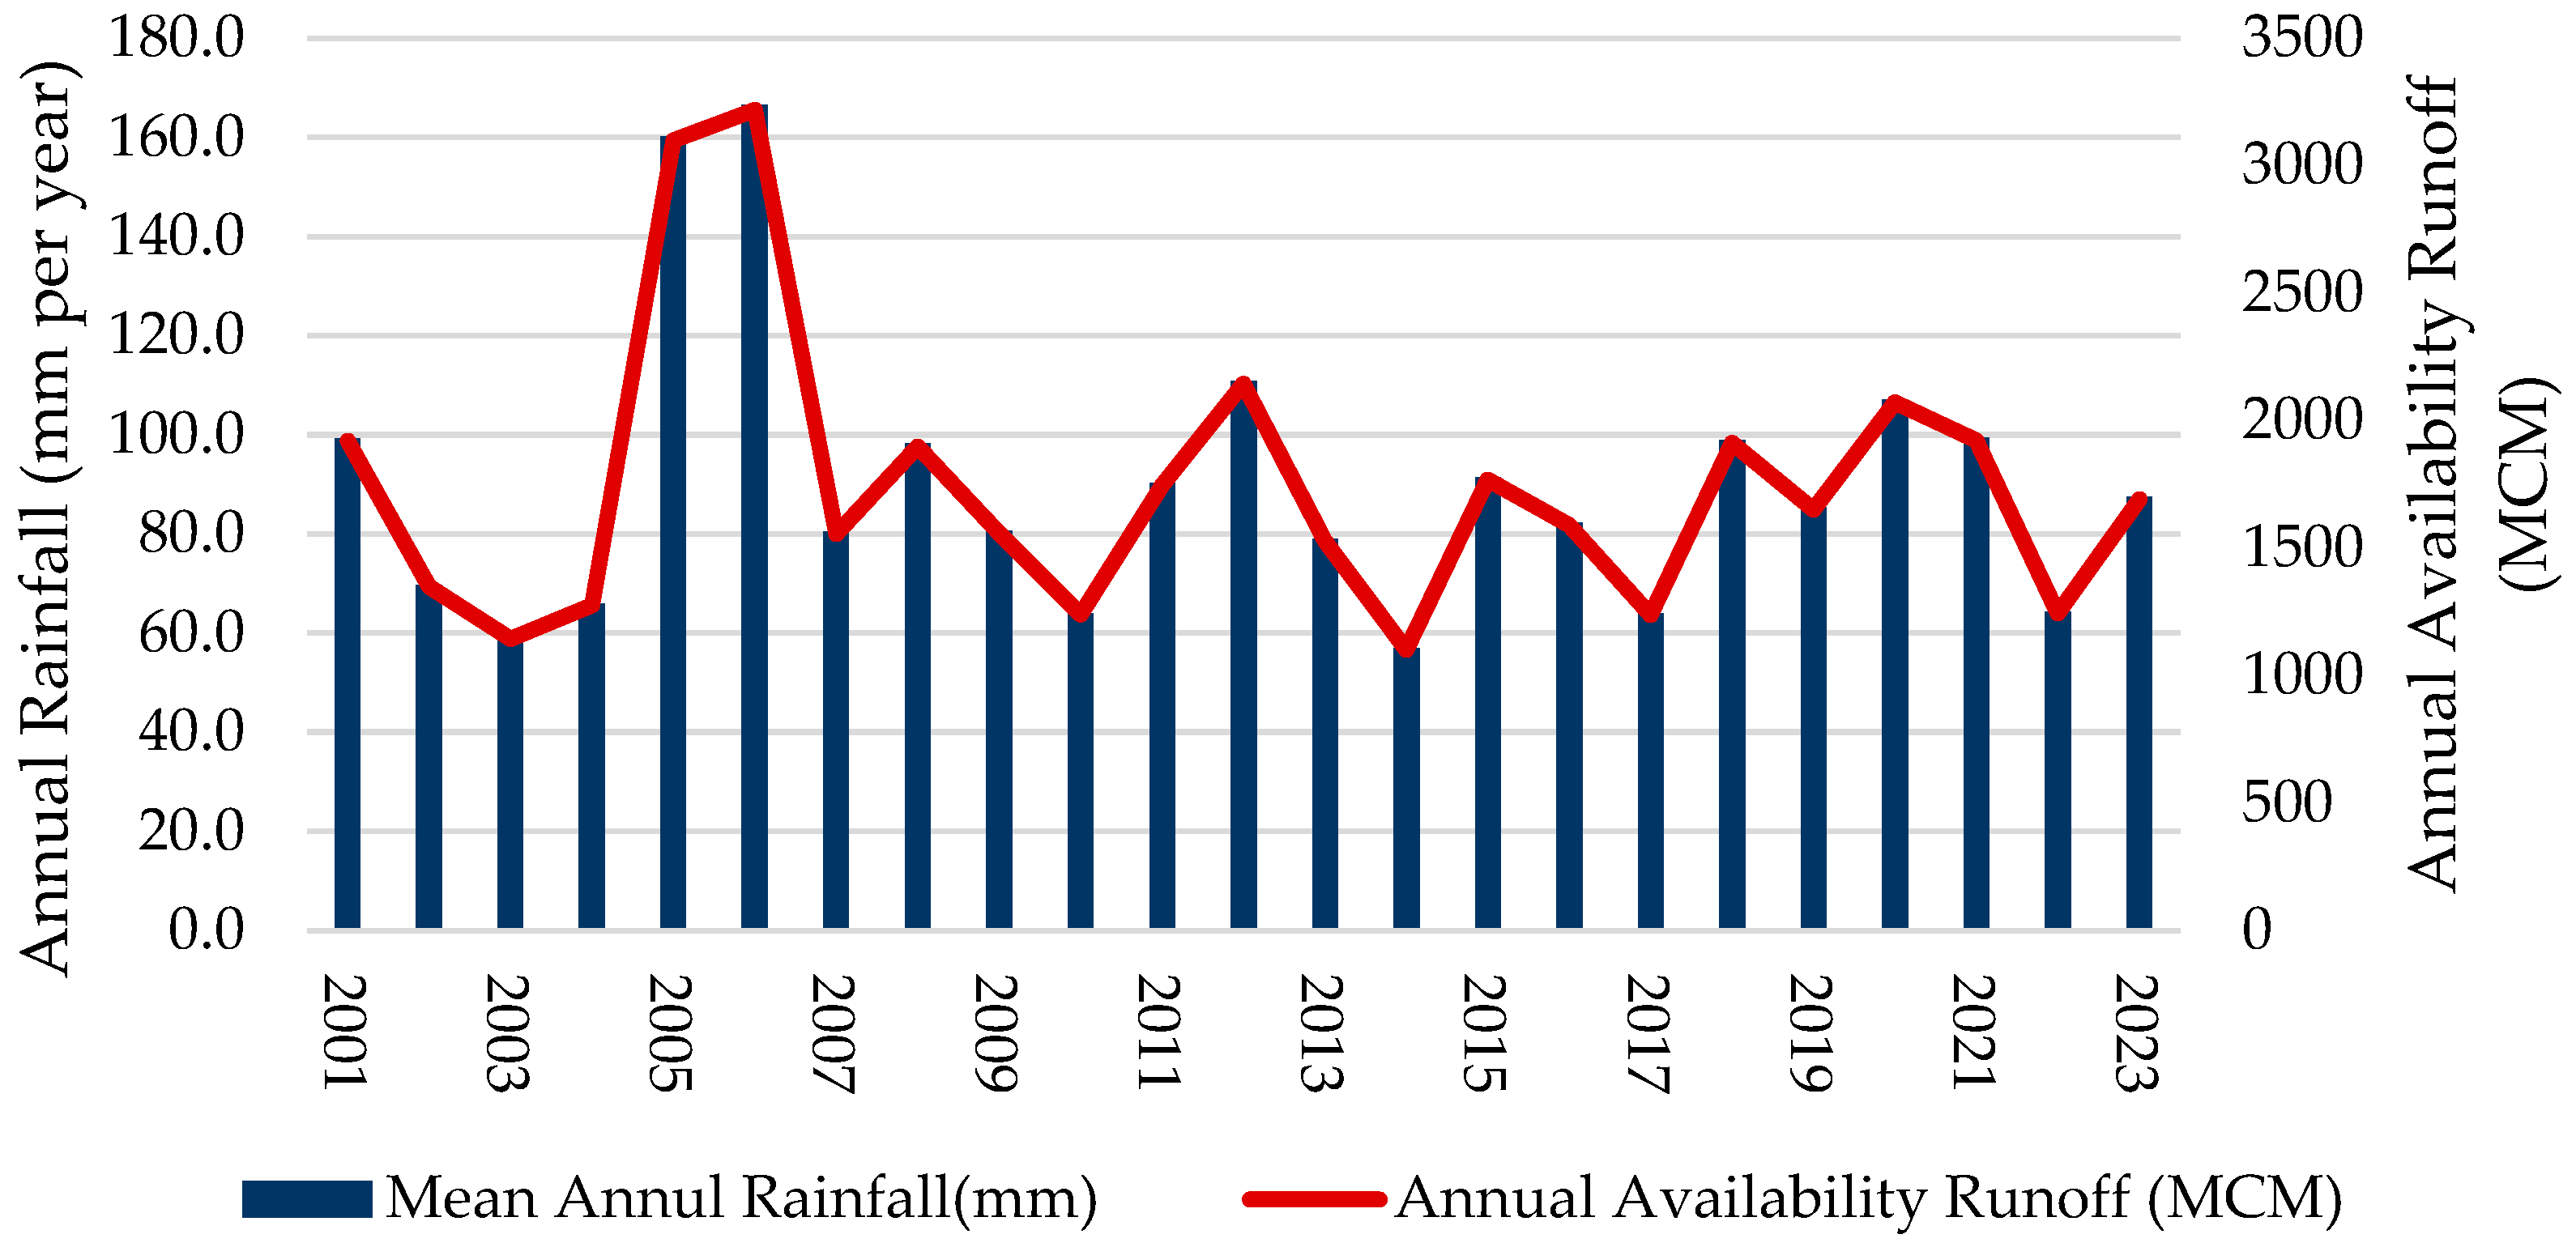
The results of the study, as illustrated in
Figure 9, provide a comprehensive view of the relationship between mean annual rainfall and annual surface water availability (runoff) in the Riyadh region over the 23-year period from 2001 to 2023. This figure highlights the variability in both rainfall and runoff, which are key factors in water resource management in this arid region.
The years 2005 and 2006 are notable for their exceptionally high rainfall, 160.2 mm and 166.5 mm, respectively, which resulted in the highest recorded surface runoff values of 3099.22 mil. m3 and 3220.36 mil. m3. These peaks in both rainfall and runoff underscore the importance of these years in replenishing water resources and highlight the strong correlation between increased rainfall and surface water availability.
Conversely, 2014 stands out as the year with the lowest recorded rainfall at 57.0 mm, corresponding to the lowest surface runoff of 1101.77 mil. m3. This year demonstrates the challenges posed by limited rainfall and the resulting scarcity of surface water resources, which is critical for planning and managing water use during drier periods.
The figure also shows considerable variability in both rainfall and runoff from year to year. However, certain years, such as 2007, 2009, and 2017, exhibit more consistent patterns, with rainfall hovering around 80 mm and runoff around 1500–1600 mil. m3. This consistency in moderate years indicates that even with moderate rainfall, significant amounts of runoff can be generated, which is crucial for maintaining a stable water supply.
Over the 23-year period, the average mean annual rainfall was 89.6 mm, producing an average surface runoff of 1733.1 mil. m3. These averages provide a benchmark for assessing water availability under typical conditions and highlight the region's overall water generation capacity under its prevailing climatic conditions.
The variability and peaks highlighted in
Figure 8 suggest that water management strategies must be adaptable to both high and low availability years. The high runoff years offer opportunities for water storage and conservation, while the low runoff years underscore the need for efficient water use and possibly the implementation of drought management strategies.
4. Discussion
The results of this study provide a comprehensive understanding of surface water availability in the Riyadh region over a 23-year period, focusing on the intricate relationship between annual rainfall and surface runoff. These findings are particularly significant in the context of arid and semi-arid regions, where water resource management is challenged by low and highly variable rainfall. The study’s outcomes not only align with previous research but also offer new insights that can inform future water management strategies both in the Riyadh region and in similar environments globally.
The study’s findings on runoff coefficients are consistent with those reported in previous research on arid and semi-arid regions [
41,
42], where coefficients typically range from 0.02 to 0.20. These coefficients reflect the high infiltration rates, sparse vegetation, and significant evaporation losses that characterize such environments. In the Riyadh region, the observed runoff coefficients trend towards the lower end of this spectrum, indicating that a substantial portion of rainfall is lost to infiltration and evaporation before it can contribute to surface runoff.
These findings align with studies by [
41,
42], which have shown that in arid zones, most rainfall does not result in significant surface runoff. This is further reinforced by the variability observed in the runoff coefficients during different years, with high rainfall years like 2005 and 2006 yielding higher runoff, while years with lower rainfall, such as 2014, produced much less runoff. This pattern highlights the challenges of managing water resources in regions where surface water availability is highly dependent on episodic and often unpredictable rainfall events.
In comparison to similar areas within the Riyadh region, this value shows consistency. Specifically, Wadi Hanifa, which crosses the Riyadh region, had a runoff coefficient estimated at 3.47 based on data collected from 1965 to 1983 [
29].
A key reference for comparison within the Riyadh region is Wadi Hanifa, which crosses the area. A historical study conducted by [
29] estimated the runoff coefficient for Wadi Hanifa at 3.47, using data collected from 1965 to 1983—a period before significant population growth and urbanization in the Riyadh region. This historical data serves as a valuable benchmark, providing a reliable representation of the area's natural hydrological conditions. In contrast, the current study found a slightly higher runoff coefficient of 3.75 for a similar region in a more recent period. The increase in the runoff coefficient may be attributed to changes in land use, urbanization, and possibly improved data collection methods. This comparison underscores the consistency of the current findings with past research while also suggesting that recent developments in the region may have influenced hydrological behavior. The historical coefficient of 3.47 remains particularly important due to its derivation from long-term monitoring at a flood measurement station in Wadi Hanifa, thereby reinforcing the credibility of the current results.
The study’s findings have significant implications for water resource management in the Riyadh region. The average annual rainfall was 89.6 mm, which produced an average surface runoff of 1733.1 mil. m3 over the study period underscores the limited yet crucial contribution of rainfall to the region’s water resources. The high variability in annual rainfall and runoff highlights the need for adaptive water management strategies that can accommodate both wet and dry years.
Despite providing valuable insights, this study has several limitations. The reliance on satellite-derived data and remote sensing techniques introduces uncertainties in accurately capturing surface runoff in arid regions. While remote sensing offers broad spatial coverage, it may not fully account for localized rainfall variability, complex topography, and land-use changes, which are crucial in shaping hydrological responses. Additionally, the absence of extensive ground-based gauging stations in the Riyadh region limits the direct validation of satellite data, potentially affecting the model’s accuracy. The model’s underestimation of runoff in areas with complex hydrological dynamics indicates that integrating more detailed field measurements and region-specific calibration is essential to improve the reliability of runoff estimates. The study also does not fully address the long-term impacts of urbanization and climate change on runoff patterns, which may have influenced the observed trends. These limitations underscore the need for an integrated approach that combines satellite data with detailed field observations to enhance the accuracy of runoff assessments.
The comparison of these findings with existing estimates of surface water availability in Saudi Arabia, which range widely from 2 to 8 billion cubic meters, reveals a critical gap in the detailed understanding of water distribution across the country’s administrative regions [
31,
32,
33,
34]. The broad range of these estimates suggests a lack of precision in existing studies, reinforcing the need for region-specific research. The detailed analysis provided by this study offers a more accurate assessment of water availability in the Riyadh region, which could serve as a model for similar studies in other regions of Saudi Arabia.
Given the low runoff coefficients observed, only a small fraction of rainfall contributes to surface water availability. This highlights the importance of maximizing the capture and efficient use of runoff, particularly in a region where water resources are already under stress. Enhancing water storage infrastructure, improving agricultural water use efficiency, and implementing technologies to reduce water losses due to evaporation and infiltration are all strategies that could help mitigate the challenges posed by the region’s arid climate.
In the broader context, this study emphasizes the critical need for localized calibration in hydrological modeling. The observed discrepancies in the model’s predictions during verification suggest that more detailed and region-specific data are necessary to improve the accuracy of runoff estimates. This finding is particularly relevant for other arid and semi-arid regions within Saudi Arabia, where similar challenges in water resource management exist.
There is a clear need for more detailed studies on water availability across each administrative region of Saudi Arabia, utilizing localized data to refine runoff coefficients and improve the accuracy of water resource assessments. To achieve this, the integration of high-resolution remote sensing data with ground-based observations should be expanded, enhancing the spatial and temporal accuracy of rainfall and runoff measurements. This approach would provide a more nuanced understanding of how local factors influence runoff, leading to more accurate predictions of surface water availability. Additionally, given the increasing variability in weather patterns due to climate change, it is crucial to assess how these changes might impact rainfall and runoff in the Riyadh region and beyond. Scenario analysis using climate models could offer valuable insights into future water resource challenges, informing long-term planning. Furthermore, the development of advanced hydrological modeling methods is essential. This could involve enhanced soil surveys, improved monitoring of rainfall intensity and duration, and the application of sophisticated hydrological modeling techniques that incorporate the latest scientific understanding of arid region hydrology.
5. Conclusions
This study provides a detailed evaluation of surface water availability in the Riyadh region using remote sensing and long-term satellite data. The findings reveal significant spatial and temporal variability in rainfall and runoff, with estimated runoff coefficients reflecting the region’s arid conditions. The hydrological model demonstrated effectiveness in capturing rainfall–runoff trends, though it slightly underestimated runoff in areas with complex hydrological dynamics.
To address this underestimation in regions with complex hydrological characteristics, several adjustments to the model are recommended. First, the integration of additional parameters such as soil moisture, land use, and vegetation cover could provide a more comprehensive representation of the watershed’s hydrological processes. Incorporating finer-resolution digital elevation models (DEMs) would enhance the model’s ability to capture subtle topographical variations that influence runoff patterns. Furthermore, including detailed field measurements and localized calibration efforts can refine the model, ensuring it accounts for the unique hydrological conditions present in these areas. These adjustments are anticipated to enhance the model’s predictive capabilities and support more accurate water resource management strategies.
The outcomes of this study are particularly valuable for improving the understanding of water availability in arid regions, especially where traditional data is limited. By integrating advanced remote sensing data, this research offers a more accurate assessment of surface water resources, providing a model that can be applied to similar regions with arid climates.
In conclusion, this study enhances our understanding of surface water dynamics in arid environments and supports the development of more effective water management strategies in the Riyadh region and beyond. Future research should focus on refining runoff coefficients with more detailed data, incorporating additional hydrological parameters, and exploring the impacts of climate change on water resources to further improve the accuracy of hydrological models in complex environments.
