Article

Response to Pumping of Wells in Carbonate and Karst Aquifers and Effect on the Assessment of Sustainable Well Yield: Some Examples from Southern Italy

Department of Ecological and Biological Sciences, Tuscia University, 01100 Viterbo, Italy
*
Author to whom correspondence should be addressed.
Water 2024, 16(18), 2664; https://doi.org/10.3390/w16182664
Submission received: 15 July 2024 / Revised: 14 September 2024 / Accepted: 16 September 2024 / Published: 19 September 2024

Abstract

:
Carbonate and karst aquifers are of great importance for human water supplies, for supporting aquatic habitats and providing ecosystem services. Optimizing the groundwater withdrawals is therefore essential for obtaining the maximum flow rate for human purposes while minimizing the negative effects on the environment. In particular, when the abstraction of groundwater occurs through wells, the problem of defining the sustainable yield arises. This study analyzes pumping tests conducted in carbonate and karst aquifers in southern Italy to derive indications for defining the sustainable yield of yields. The four examined cases concern the Mesozoic–Cenozoic platform and transition pelagic carbonate rocks characterized by different degree of fracturing and karstification and hosting a carbonate aquifer with variable average groundwater yields. The analysis compared drawdown–time trends and their derivatives for 35 pumping tests with theoretical curves to identify the flow dimension. Parameters useful for examining the well yields were then determined. The results show that the response to the pumping of the investigated aquifers is very variable, both among the different sites and within the same site. Well yields are very different due to aquifer heterogeneity, local hydrostratigraphy and structural setting, and position of the pumping center within the groundwater flow system. To determine the operational pumping rate for a well in this environment, this study emphasizes the importance of analyzing drawdown trends over time to correctly predict the well’s long-term response to pumping. Specifically, when pumping induces a steady-state drawdown response, the focus for defining the sustainable abstraction shifts to the basin or aquifer scale. Conversely, when a transient drawdown response to pumping results, the well’s capacity to capture groundwater becomes the primary factor for well yield and its sustainability.

1. Introduction

Carbonate and karst aquifers are of great importance for human water supply, supporting aquatic habitats and providing ecosystem services [1,2,3,4,5]. Optimizing groundwater withdrawals from these aquifers is therefore essential to obtain the maximum flow rate for human purposes and, at the same time, limit negative effects on the environment. In particular, when groundwater is pumped through wells, the challenge of defining the sustainable yield must be addressed, i.e., pumping groundwater in a manner that can be maintained indefinitely without causing unacceptable environmental, economic, and social consequences [6,7,8,9]. This concept can be applied on several scales, such as on the basin, aquifer, and single well scale. It is a complex issue, but it is clear that the definition of sustainable yield at the well scale must necessarily be based on the response of the aquifer to pumping [10,11,12,13,14,15].
Extensive literature covers the analysis of pumping tests in carbonate aquifers. Groundwater flow in these aquifers, typically heterogeneous and anisotropic, differs from that in granular aquifers because of the nature of voids (matrix, fractures, and conduits) and turbulent flow in large conduits. Consequently, interpretative models of pumping tests require a different approach from the models generally adopted for granular media, such as dual or triple porosity for the presence of matrix, fracture, and conduit voids. Most of these interpretative methods are designed to determine the hydrodynamic parameters of the aquifer, including transmissivity, the hydraulic conductivity and storage coefficient, or the aquifer’s hydraulic behavior, which shades light on the various flow components reaching the pumping well [16,17,18,19,20,21].
Conversely, when it is a matter of defining the sustainable pumping rate for a single well, considering its long-term impact on groundwater, few studies are available. Regarding fractured aquifers, the “reliable yield of a well” [22] and the “sustainable yield of a well” [23] are the main concepts found in the scientific literature. These notions refer to the productivity of the well that allows its negative impact on groundwater resources to be contained by ensuring its long-term operation. The methods are based on the drawdown trend over time in the well and on the well characteristics, and the methods are aimed at determining the operational flow of the well.
Carbonate and karst aquifers pose a particular challenge for the definition of sustainable well yield due to the highly variable water-yielding properties characterizing these aquifers. This variability directly translates to significant differences in well yields across this hydrogeological environment [24,25,26,27,28].
This study aims to utilize the drawdown trend measured in wells during pumping tests as the key information to regulate the pumping regimes in the operational phase. The approach considers the extreme well yield variability of carbonate aquifers. To this end, pumping tests conducted in southern Italy carbonate aquifers with different stratigraphic and structural settings, as well as varying degrees of fracturing and karstification, were considered. By analyzing the measured wells responses within their hydrogeological context and considering well depth, practical approaches for defining the sustainable well yield were developed.

2. Study Sites: Geology and Hydrogeology

The four examined cases, all belonging carbonate environments of the Southern Apennines (Figure 1), are: the Sessano site (hereinafter SE site), Pontelatone site (hereinafter PO site), Angri and Scala sites (hereinafter AN and SC sites, respectively) belonging to the same carbonate ridge, and Sicignano degli Alburni site (hereinafter SA site).
The geological background of each test site has been reviewed by using the recent Italian Geological Map [29], and the main features are summarized in Table 1. Carbonate sequences of the outer slope and/or proximal basin, inner shelf environment, and proximal to distal open platform distinguished the four cases and thus the aquifer formations intercepted by wells. The main formations include limestone, dolomite limestone, and dolomite in beds and banks; in one case, the formation was frequently interbedded with marls and marly clays (SE site). At all sites, the carbonate rocks show extensive fracturing, mainly due to strike slip and extensional structures [29].
The stratigraphy and structure of the carbonate rocks, coupled with the warm and sub-humid climate of the southern Apennines, determine the hydrogeological context of the pumping test sites, as recognized by regional and local studies [30,31,32]. The pumping test sites belong to four hydrogeological structures (Figure 1 and Table 1) that differ in average groundwater yield (hereinafter AGY), ranging from 9 to 30 L/s per km2, as reflected by the hydrological balance of the carbonate structures [30,31,32]. As detailed in Table 1, the test sites often pertain to the extensive and continued basal groundwater circulation of carbonate aquifers within a network of more or less developed fractures and karst conduits, (PO, AN, and SE sites). Sometimes, wells intercept fractured and karstified aquifers that are horizontally and vertically compartmentalized (SE and SC sites). The location of pumping sites within the groundwater flow scheme of carbonate aquifers also differs, with wells often falling close to the main aquifer discharge areas (e.g., PO and SE sites) in contrast to other cases located further inland towards their recharge areas (e.g., SC site).

3. Materials and Methods

Pumping test data for SE, PO, and SA sites were obtained from the existing literature [34,41,42]; data for the AN and SC sites were collected by the drilling companies. Pumping tests were carried out on wells ranging in depth from 40 to 160 m; these wells targeted aquifer formations with thickness ranging between 10 and 120 m. The stratigraphy encountered during well drilling is known for each location. The tests employed two different pumping methods: constant flow rate (implemented at the SE, SA, and SC sites) and variable discharge rate (used at the SE, PO, AN, and SA sites). During the test, the drawdown was monitored in both the pumping well and, in many cases, observation wells as well. Flow rate was tracked throughout tests using calibrated containers. Water level measurements were taken with centimeter level accuracy following the classic timeline. This involved frequent measurements during the initial hours, followed by progressively less frequent measurements as the test continued. For the analyses, pumping tests of longer duration were preferred.
The acquired test data were revised and processed to analyze the drawdown–time trend in the well considering its relationship to the drawdown response observed throughout the aquifer. The aim was to utilize this information to derive indications for defining the sustainable yield.
The drawdown–time trends were analyzed through semi-log plots; the smoothed time series were represented on bi-log plots alongside the first derivative of the drawdown. By comparing the trends of drawdown and its derivative on bi-log plots with theoretical curves, the flow regime through the flow dimension n were identified [43,44,45,46]. This analysis was applied to both constant flow tests and for the first step for variable flow tests. For the latter, where applicable, the Birsoy and Summers [47] method was employed to establish the relationship between specific drawdown (sn/Qn) and “adjusted time” (βtn).
The calculated parameters useful for examining the well yields were:
  • Specific capacity (Qs), i.e., the ratio between discharge rate and drawdown measured in the well. For variable discharge tests, the maximum and minimum values of this parameter were identified when the system reached steady-state conditions; in the cases of quasi steady-state and unsteady-state drawdown conditions, the parameter was determined based on the drawdown observed at the end of pumping test;
  • Transmissivity (T) was determined using the drawdown measured in the pumping well by commercial software (Aquifer test 13.0) [48], which identifies the best fit between the drawdown measurements and the model’s type curves. The results were also verified using classical analytical methods documented in the literature [49]. For variable discharge tests, the parameter was determined using the drawdown data acquired for the first step. Transmissivity was used to assess the well yield rather than characterize the aquifer;
  • Ratio t′/t, where t′ is the recovery time, i.e., the time required to recover at least 90% of the total drawdown induced by pumping, and t is the pumping time;
  • The emptying percentage of the water column in the well (ΔHs) determined at the end of the minimum and maximum flow rate step for variable discharge tests, alternatively calculated at the end of pumping for the constant discharge test.

4. Results

Table 2 summarizes the characteristics of the tested wells, the type of tests, and the parameters derived from them. The results of the tests are presented below, categorized by test sites to account for the previously highlighted differences in the geological and hydrogeological context.

4.1. Sessano (SE) Site

At the SE site, a 40 m deep well crossing fractured calcareous and marly calcareous rocks was tested. A pumping test was carried out at a constant flow rate of 44 L/s for approximately 51 h. The test included monitoring the drawdown in both the well itself and in 14 observation wells located between 25 and 110 m from the pumping well [42].
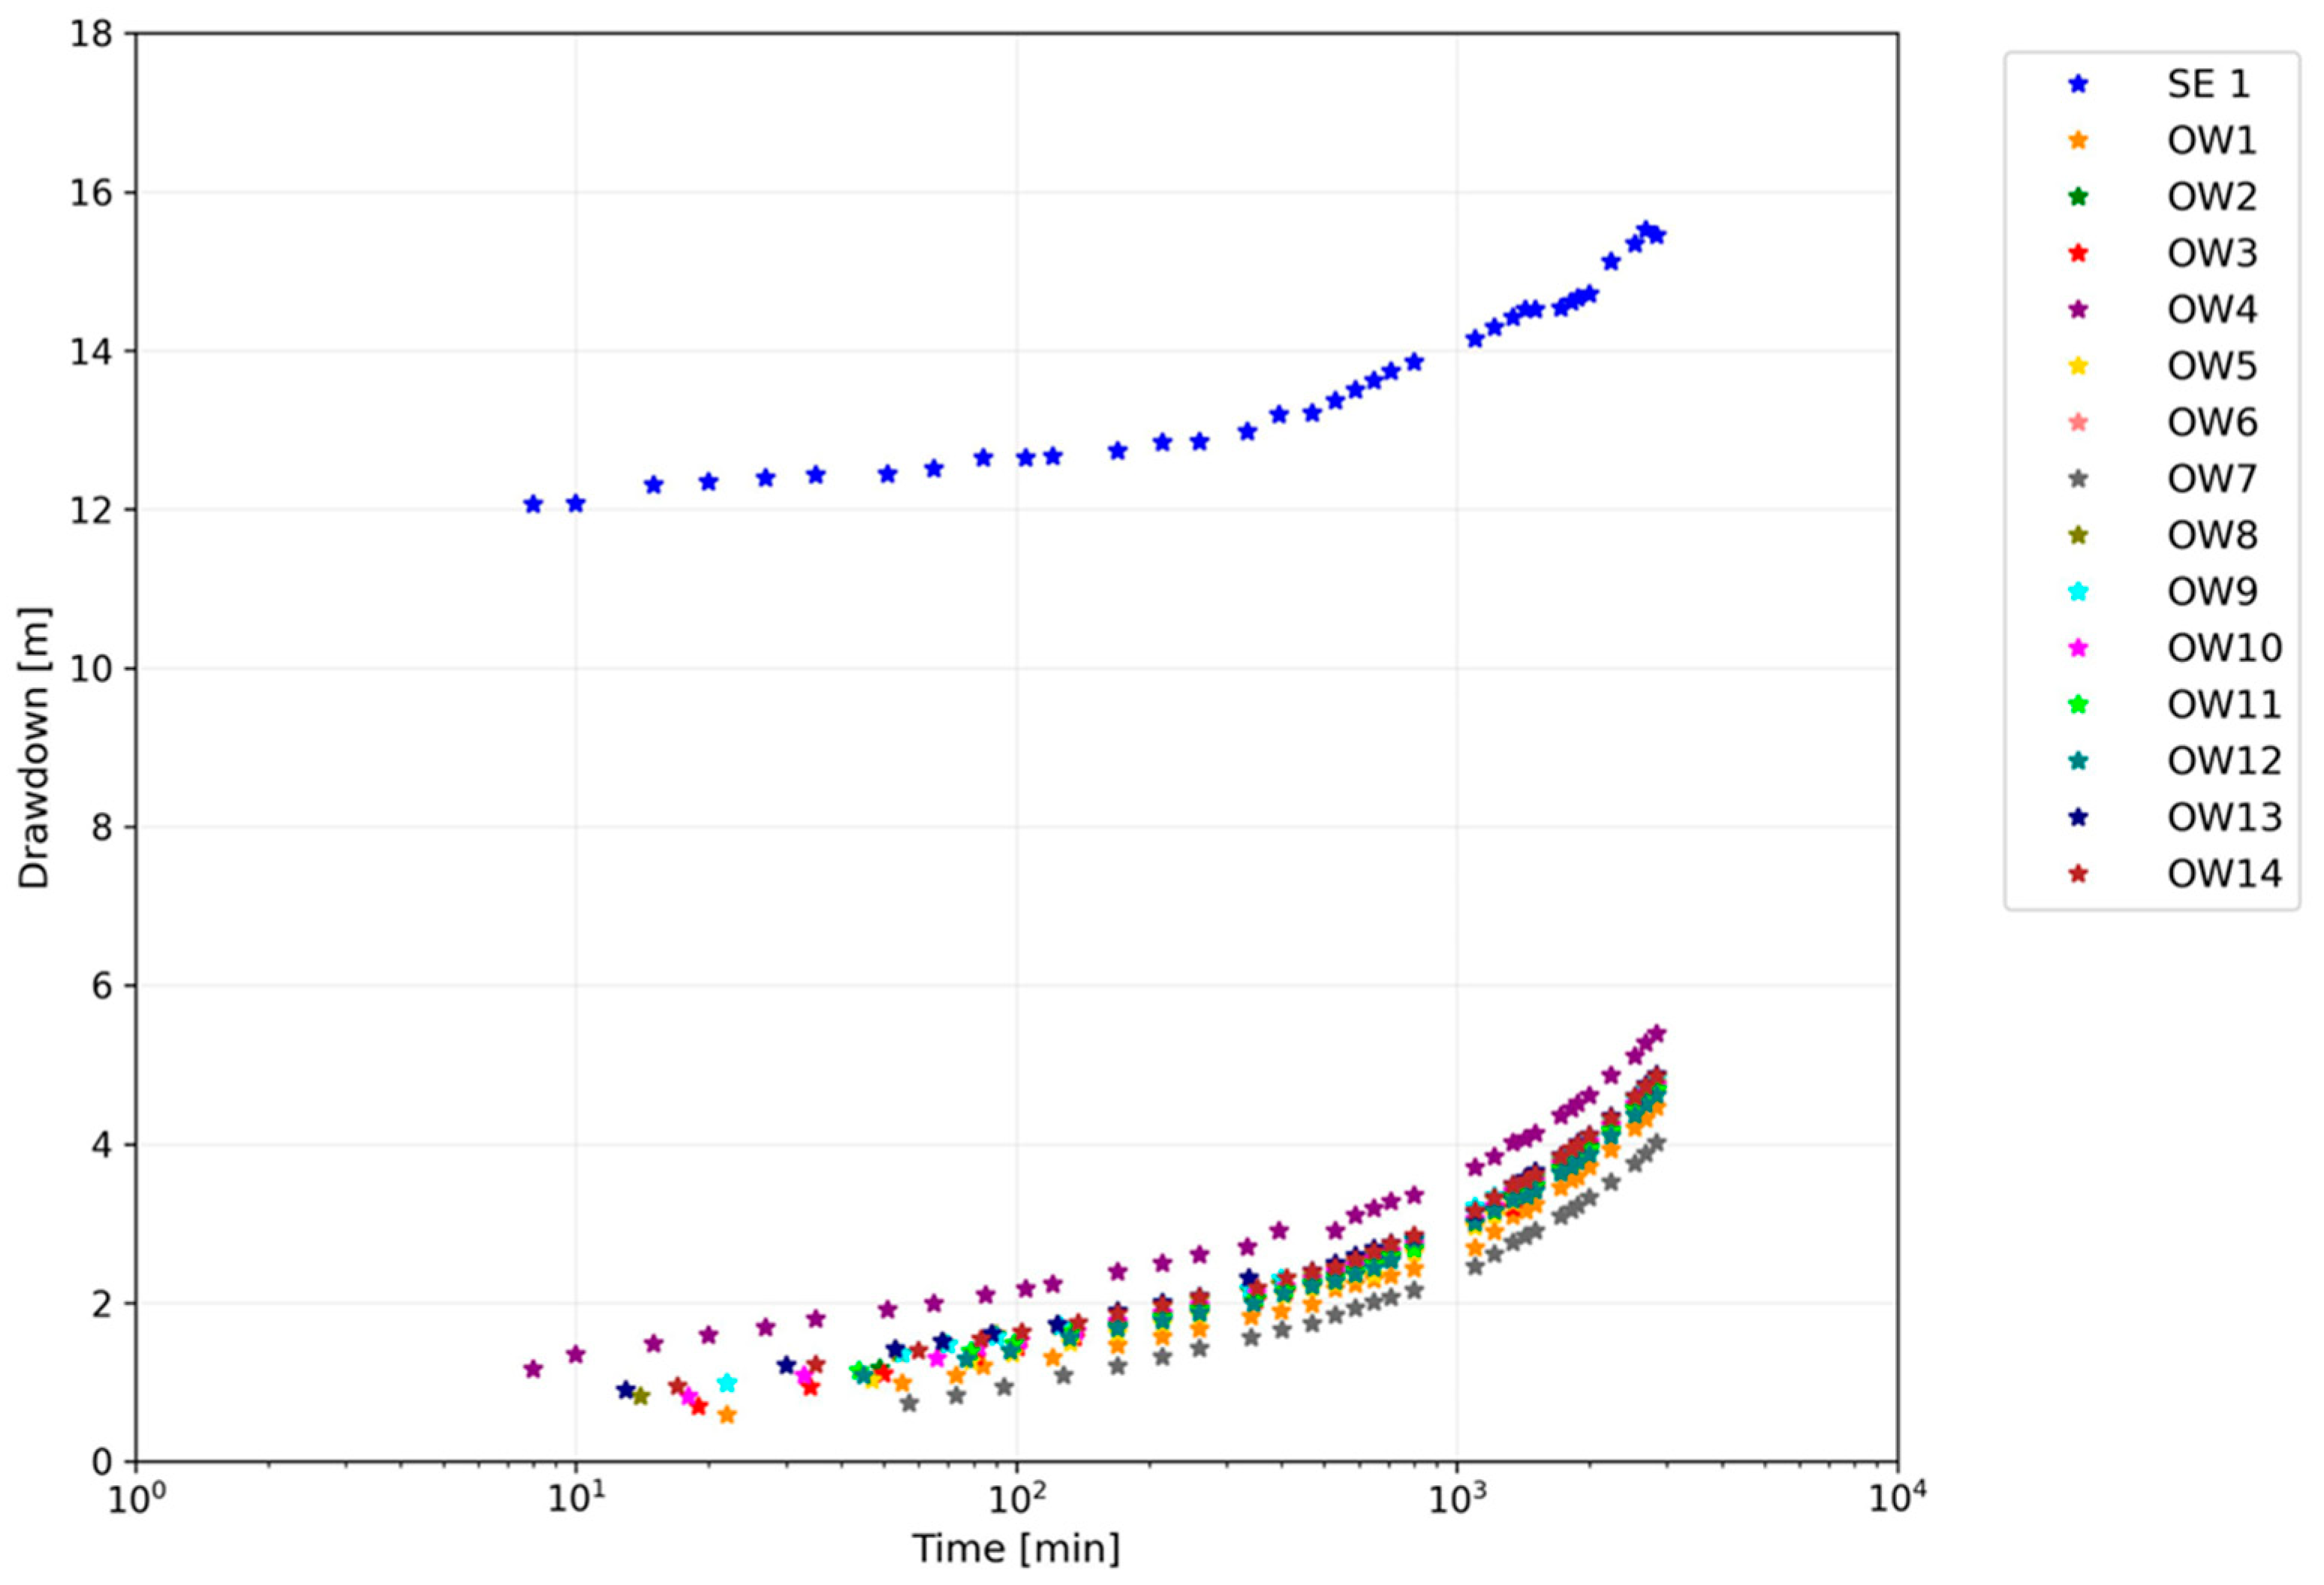
The semi-log plot of drawdown–time shows a similar transient trend for the pumping well and the 14 observation wells. A significant change in the drawdown–time trend is seen after about 400–500 min, when a steepening of the curve slope occurs (Figure 2).
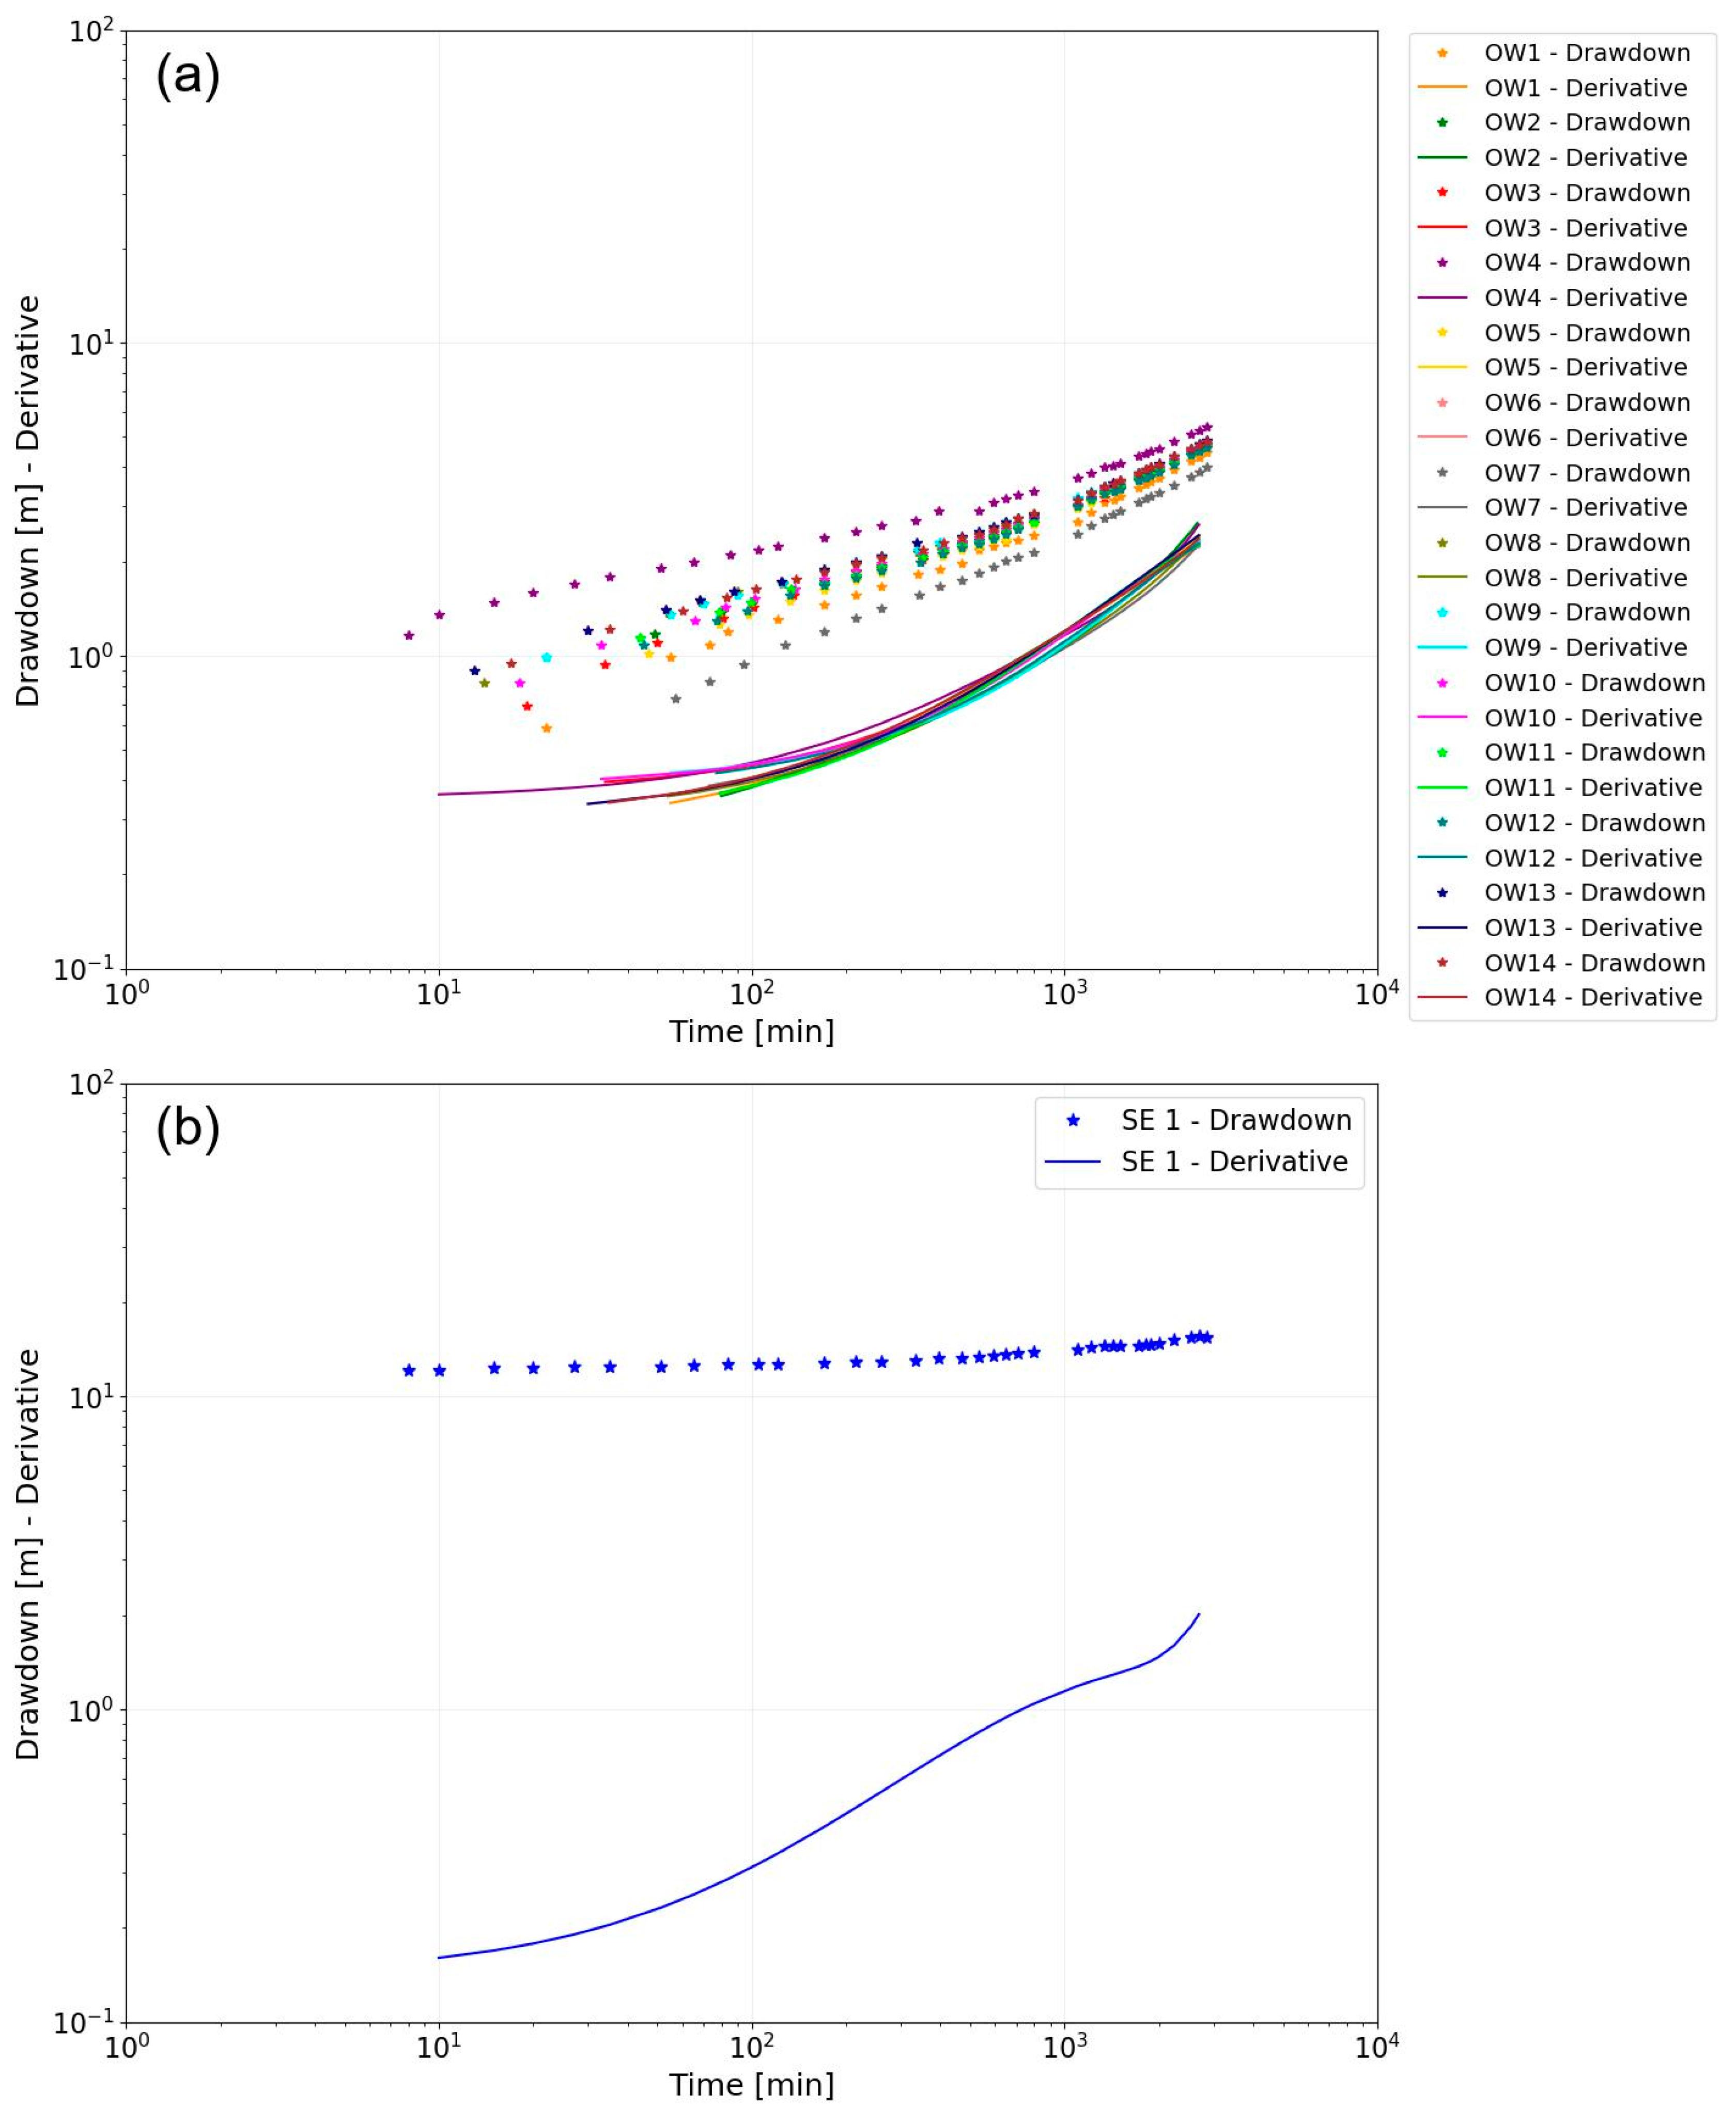
The derivative-drawdown bi-log plot for the observation wells shows a sequential variation in flow dimensions from n = 2 in the early time due to radial flow to n = 1 in the late time because of linear flow (Figure 3a). Excluding the first 50 min, affected by the well bore storage effect, the derivative trend for the pumping well (Figure 3b) shows a sequential variation of flow dimensions, with n ranging between 1 (linear flow) and 0.5. The recovery of drawdown in the well was slow (85% of the induced drawdown was retrieved in 72 h; t′/t in Table 2). The Qs and T parameters calculated for the well are 2.8 × 10⁻³ m2/s and 2.6×10⁻⁴ m2/s, respectively (see the SE1-I test in Table 2). For piezometers, the parameters characterizing the aquifer are consistent with those found by Lotti et al. [42], showing limited variability (transmissivity shows a value around 2 × 10⁻³ m2/s, and specific yield and storativity are in the order of 10−2 and 10−3, respectively).
In addition, a variable discharge test was performed on the same well in the SE site. By means of discharge steps varying from 6 to 29 L/s, a transient drawdown response of the well was observed for each step. Qs decreases from 8.4 to 4.1 × 10⁻³ m2/s, while T was calculated for the first step results of 7.6 × 10⁻⁴ m2/s (see the SE1-II test in Table 2). The late time drawdown–time curves for the well (Figure 4) at the highest tested flow rates (21.4 and 29.3 L/s) shows the same trend as the curve from the constant discharge test (44 L/s).

4.2. Pontelatone (PO) Site

At the PO site, 20 wells were tested. The wells that are 90–133 m deep intercept intensely fractured limestone, sometimes with intercalations of marly layers and karst cavities. Each well was tested at variable flow rate (from 30 to 160 L/s) for a duration of 5 to 22 h (Table 2). The drawdown was measured both in the pumping well and nearby observation wells located between 70 and 110 m [34].
The drawdown–time curves for both the pumping well (Figure 5 shows an example) and nearby observation wells show a general steady-state trend. High Qs values (10−1–10−2 m2/s), as along with high T values (10−1–10−2 m2/s), were obtained (PO wells in Table 2). Water levels in the wells recovered quickly at the end of pumping, as shown by the t′/t values in Table 2. The drawdown observed in the wells, even by the highest pumping rates, represents a minimum percentage with respect to the thickness of the saturated aquifer intercepted by the well (ΔHs in Table 2). There are no specific differences in well yield between wells intercepting Late or Lower Cretaceous carbonate succession, nor for the well intersecting karst cavities (PO18 in Table 2).
The derivative-drawdown bi-log plots for the first discharge step in the different pumping wells show a sequential variation of flow dimensions, with n values changing from n = 2, indicative of a radial flow, to n = 4, indicative of the presence of a constant head boundary (Figure 6).

4.3. Angri (AN) and Scala (SC) Sites

At the AN site, two wells were tested: one 87 m deep and another 113 m deep. The boreholes cross limestones with varying degrees of fracturing, and one well (AN2 well in Table 2) intercepted a karst cavity that was approximately 5 m thick. Pumping tests were conducted at variable flow rate, ranging from 10 to 150 L/s for an extended duration of 175 to 203 h (see Table 2). Drawdown was measured in both the pumping well and, in one case, in a nearby observation well.
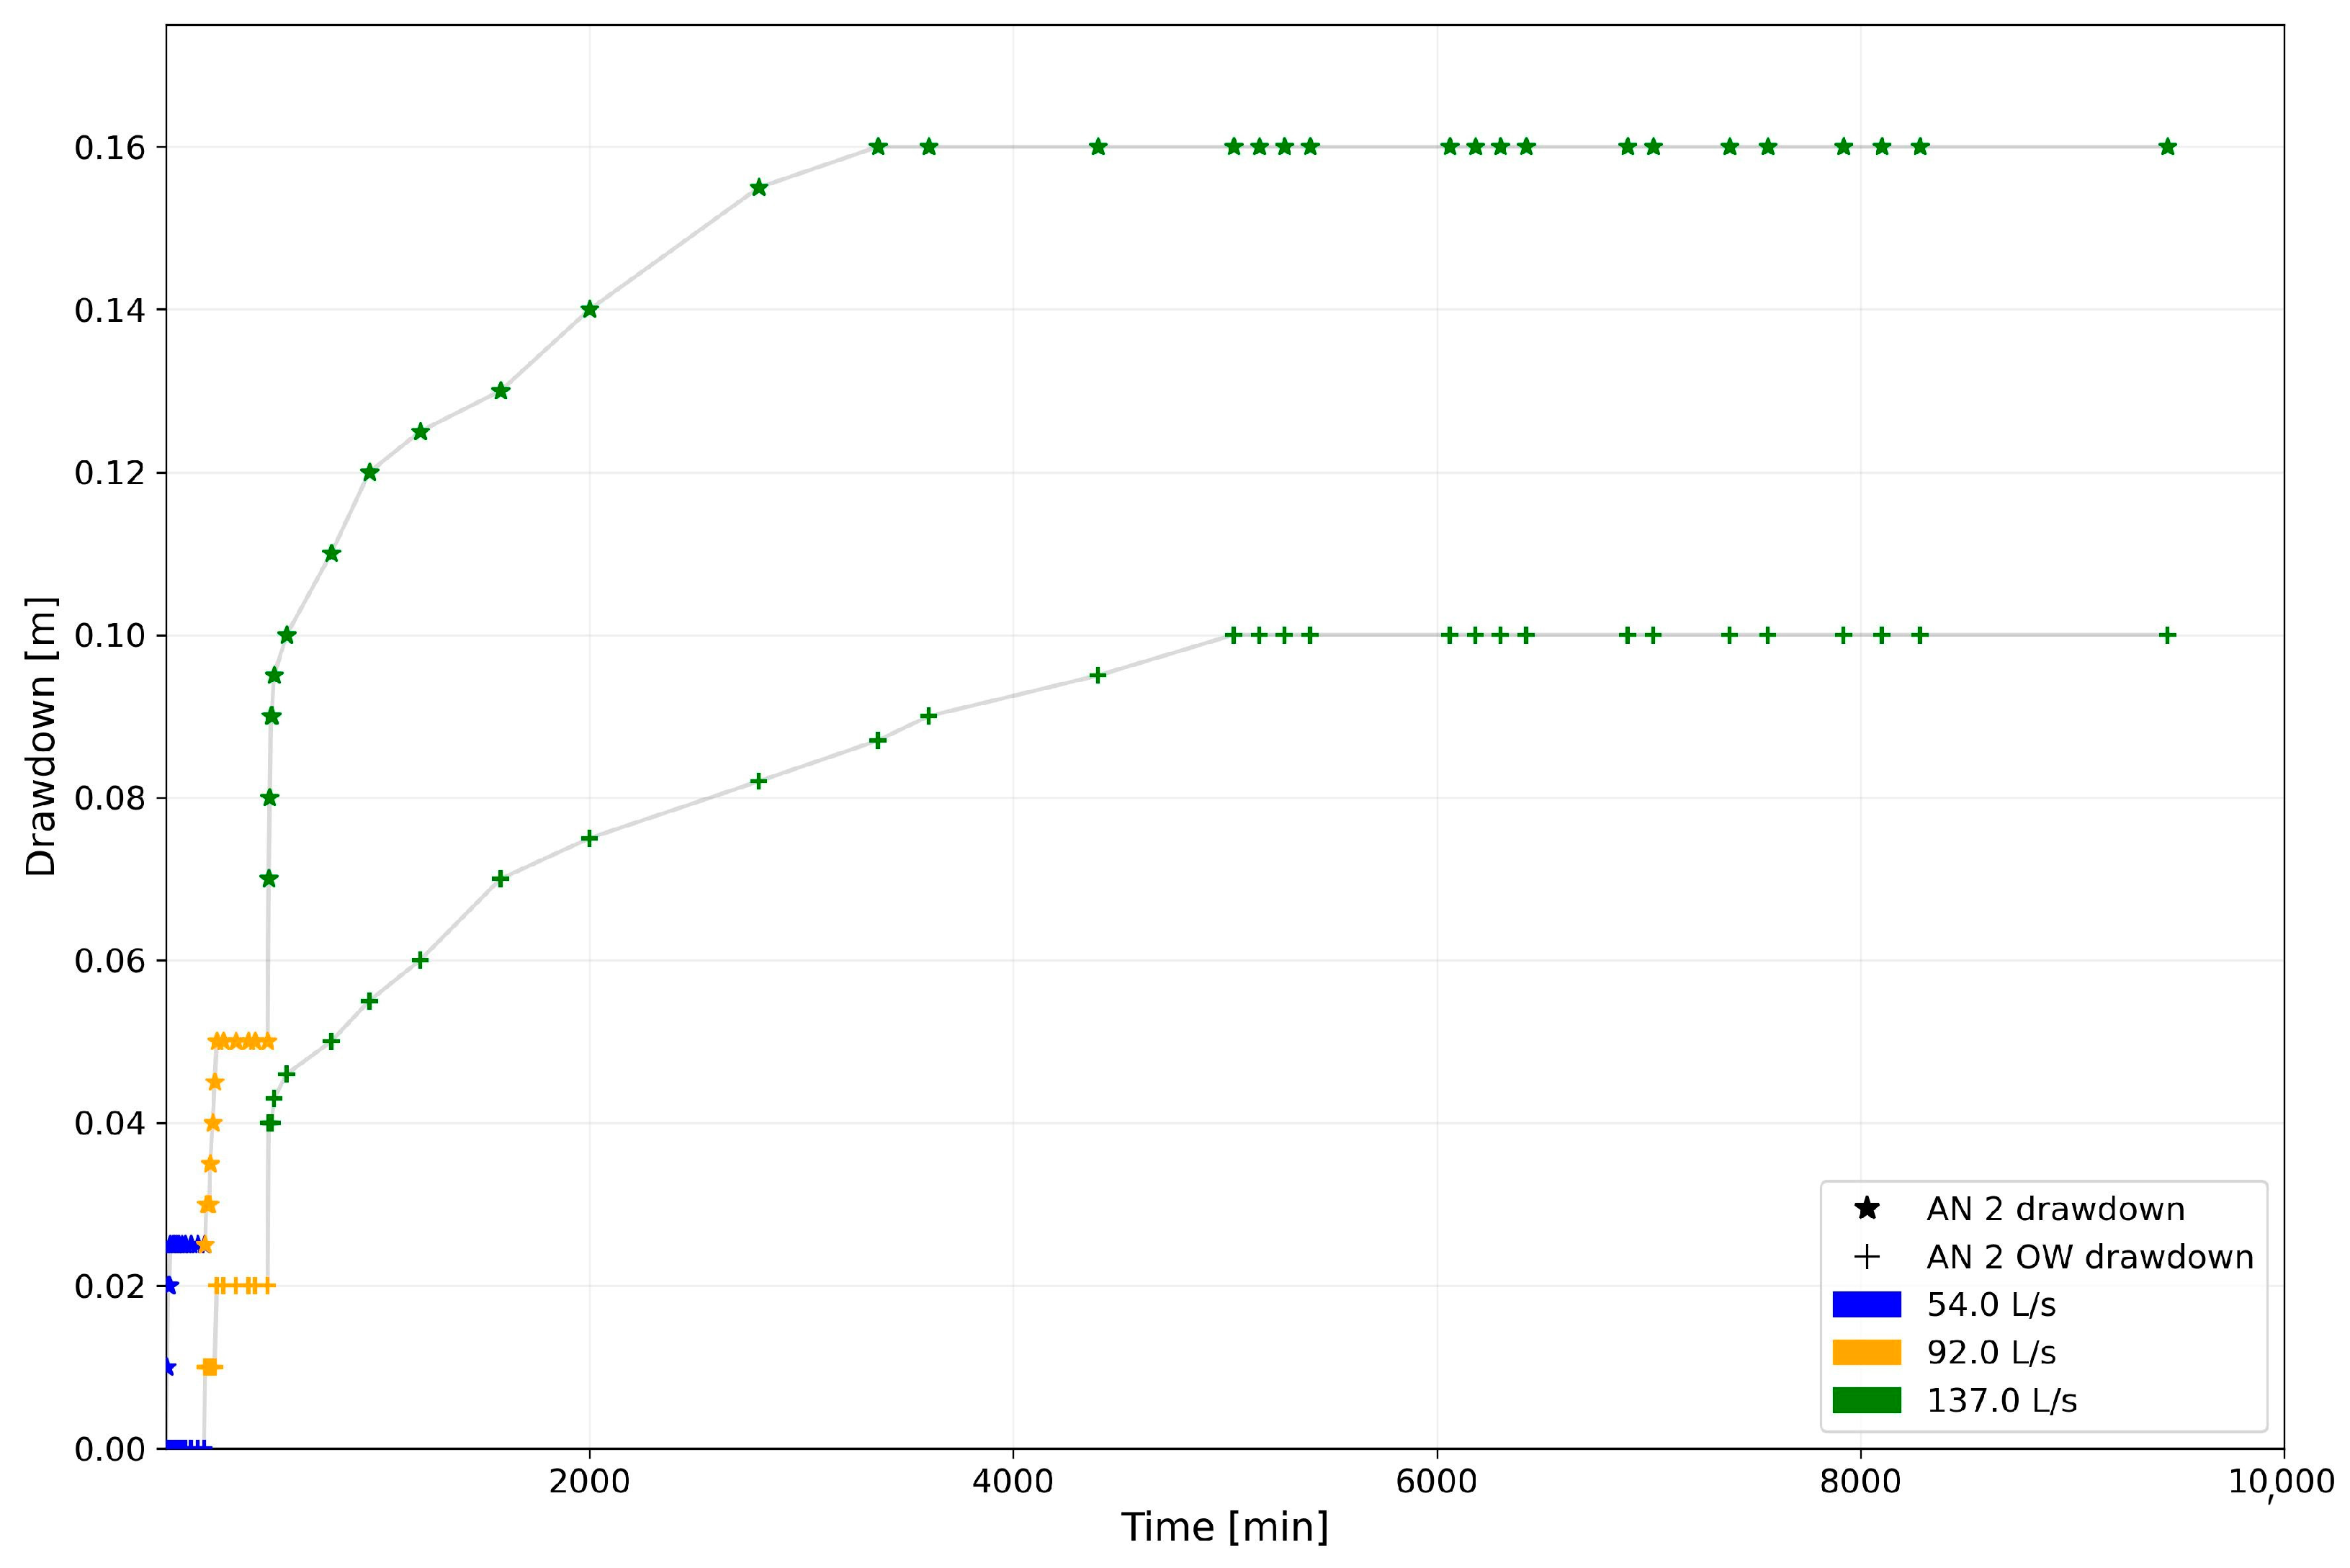
As with the previous site (PO site), a clear steady-state trend of drawdown was observed in both the pumping well and observation well (Figure 7).
High Qs and T values were obtained again, with relatively higher values being observed for the wells crossing the karst cavity (wells AN1 and AN2 in Table 2). Even at the highest pumping rates (137 and 150 L/s), the drawdown did not exceed 6% of the saturated aquifer thickness for the wells (Table 2).
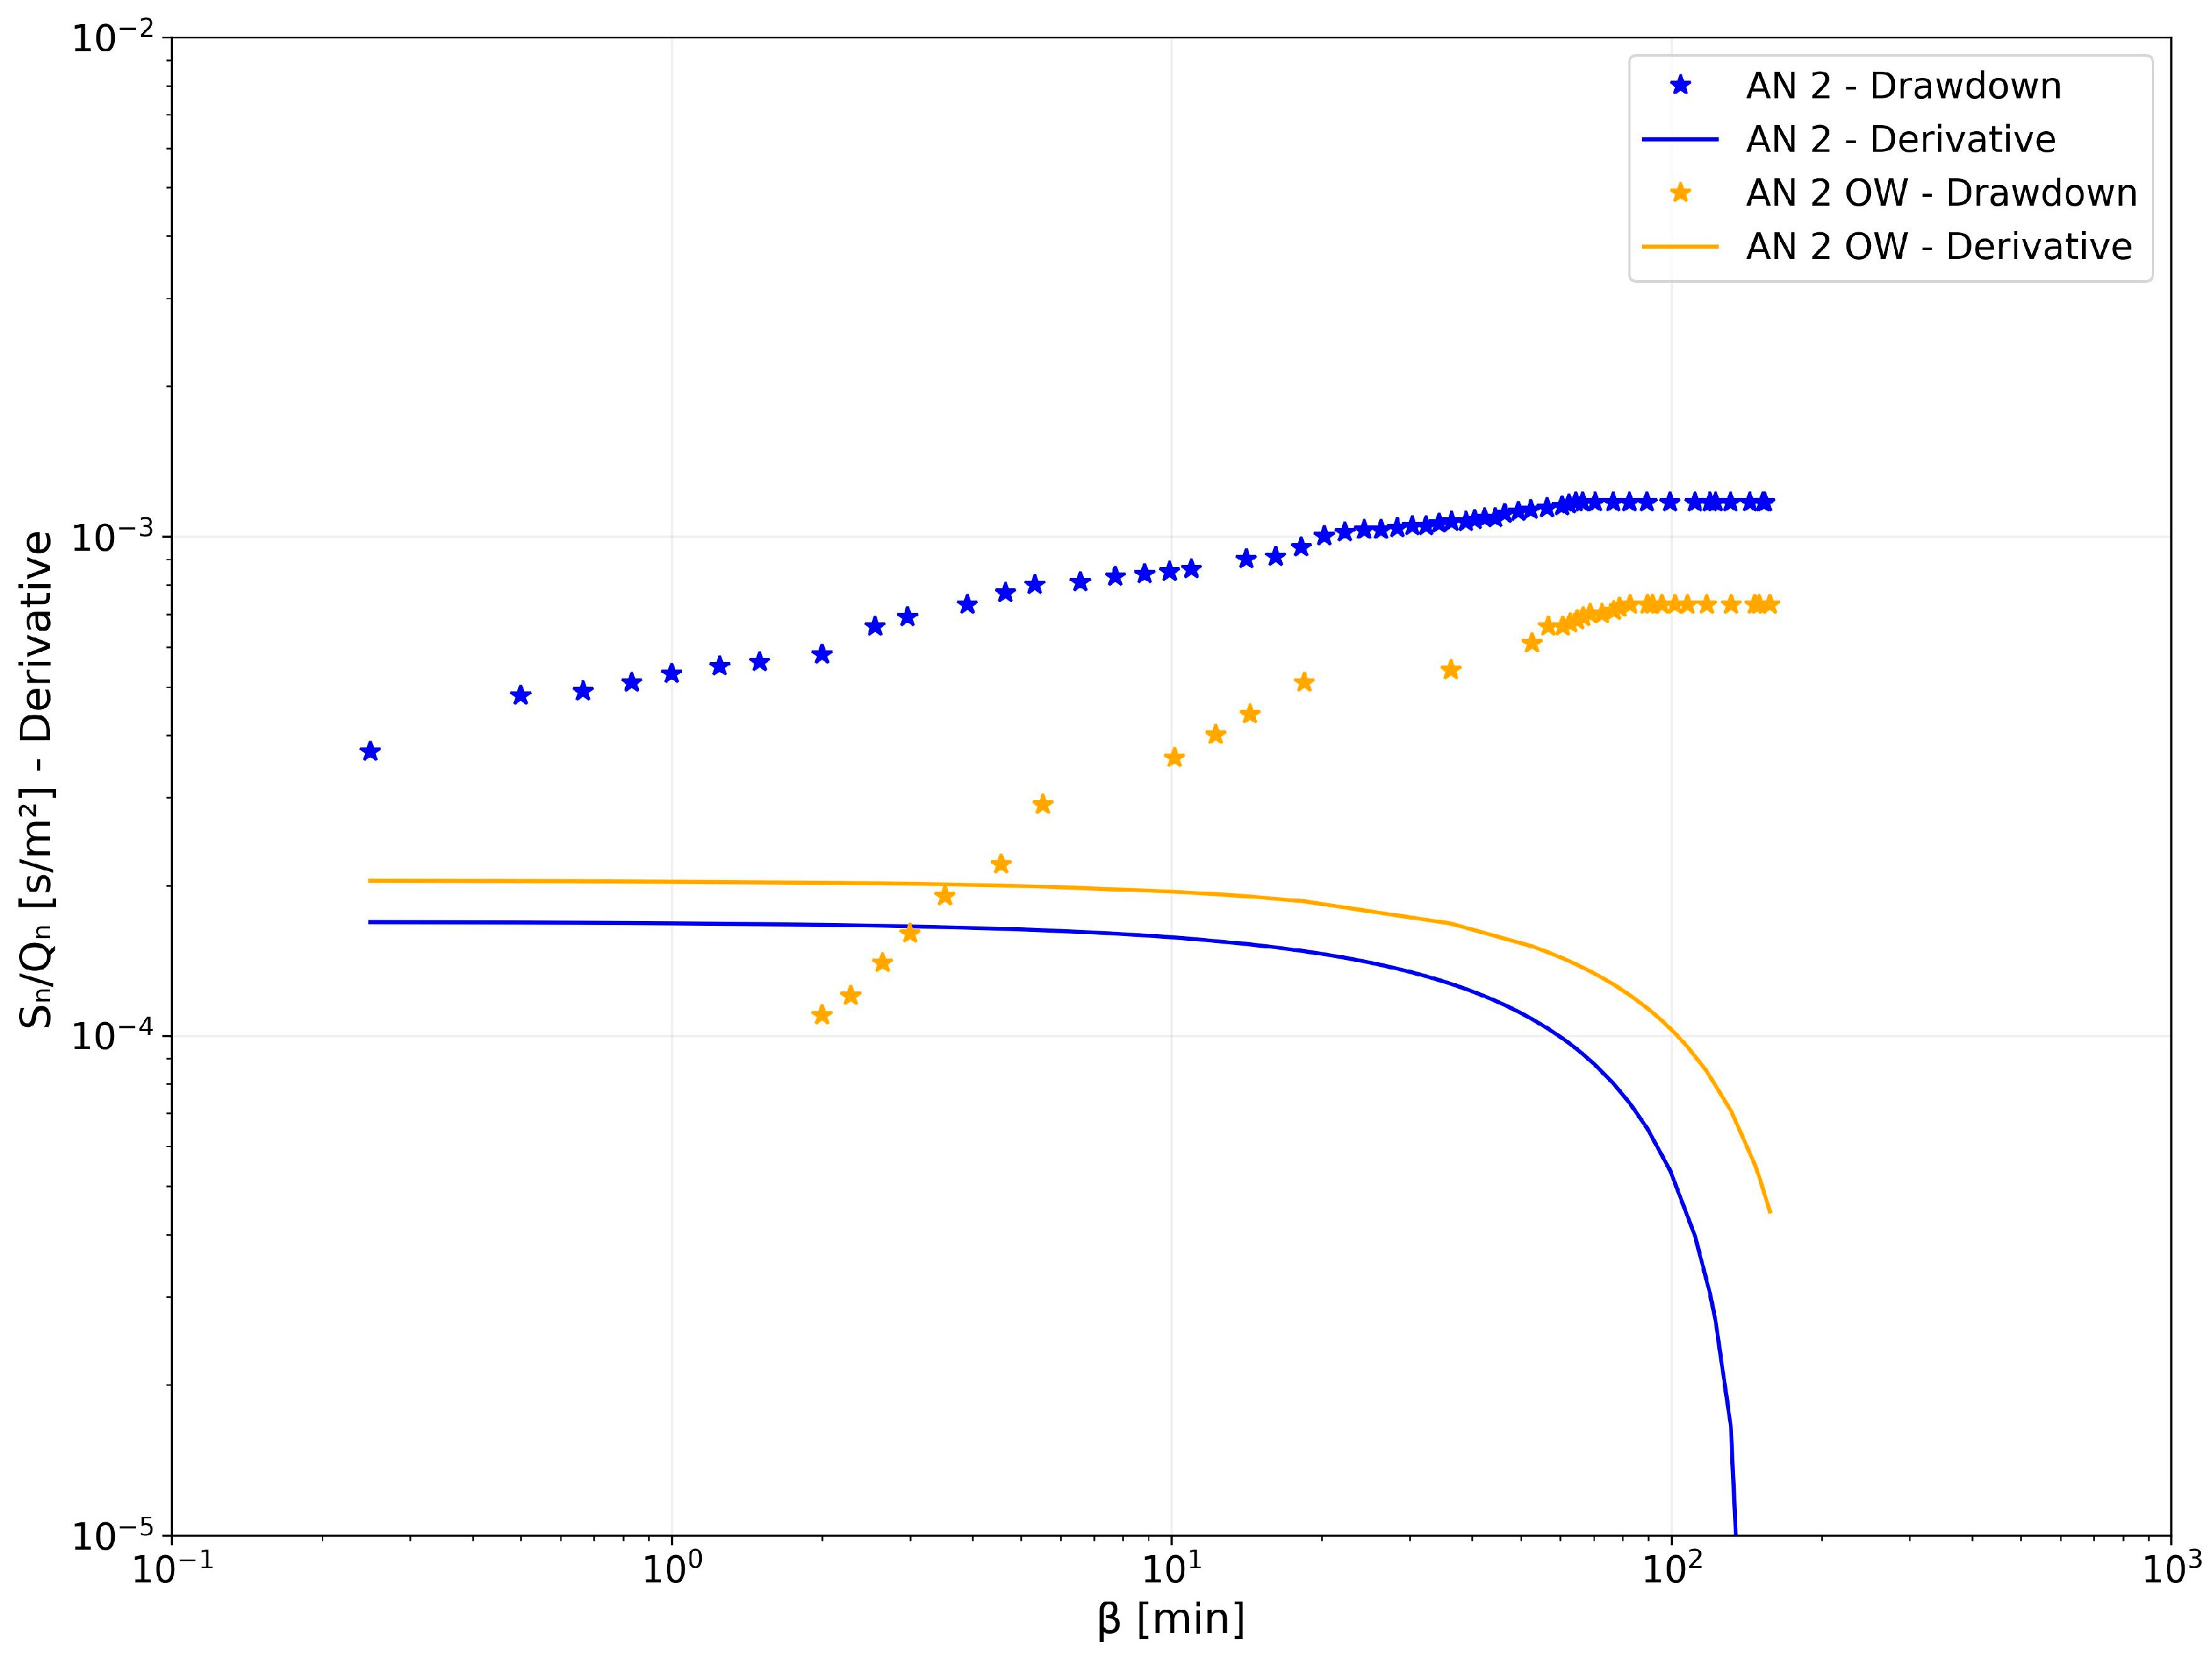
The derivative-drawdown bi-log plot, after adjusting for variable flow using the Birsoy and Summers method [47], shows a sequential variation of flow dimensions from n = 2 to n = 4. This indicates an initial radial flow, later influenced by the effect of a constant boundary, observed in both the pumping and observation wells (Figure 8).
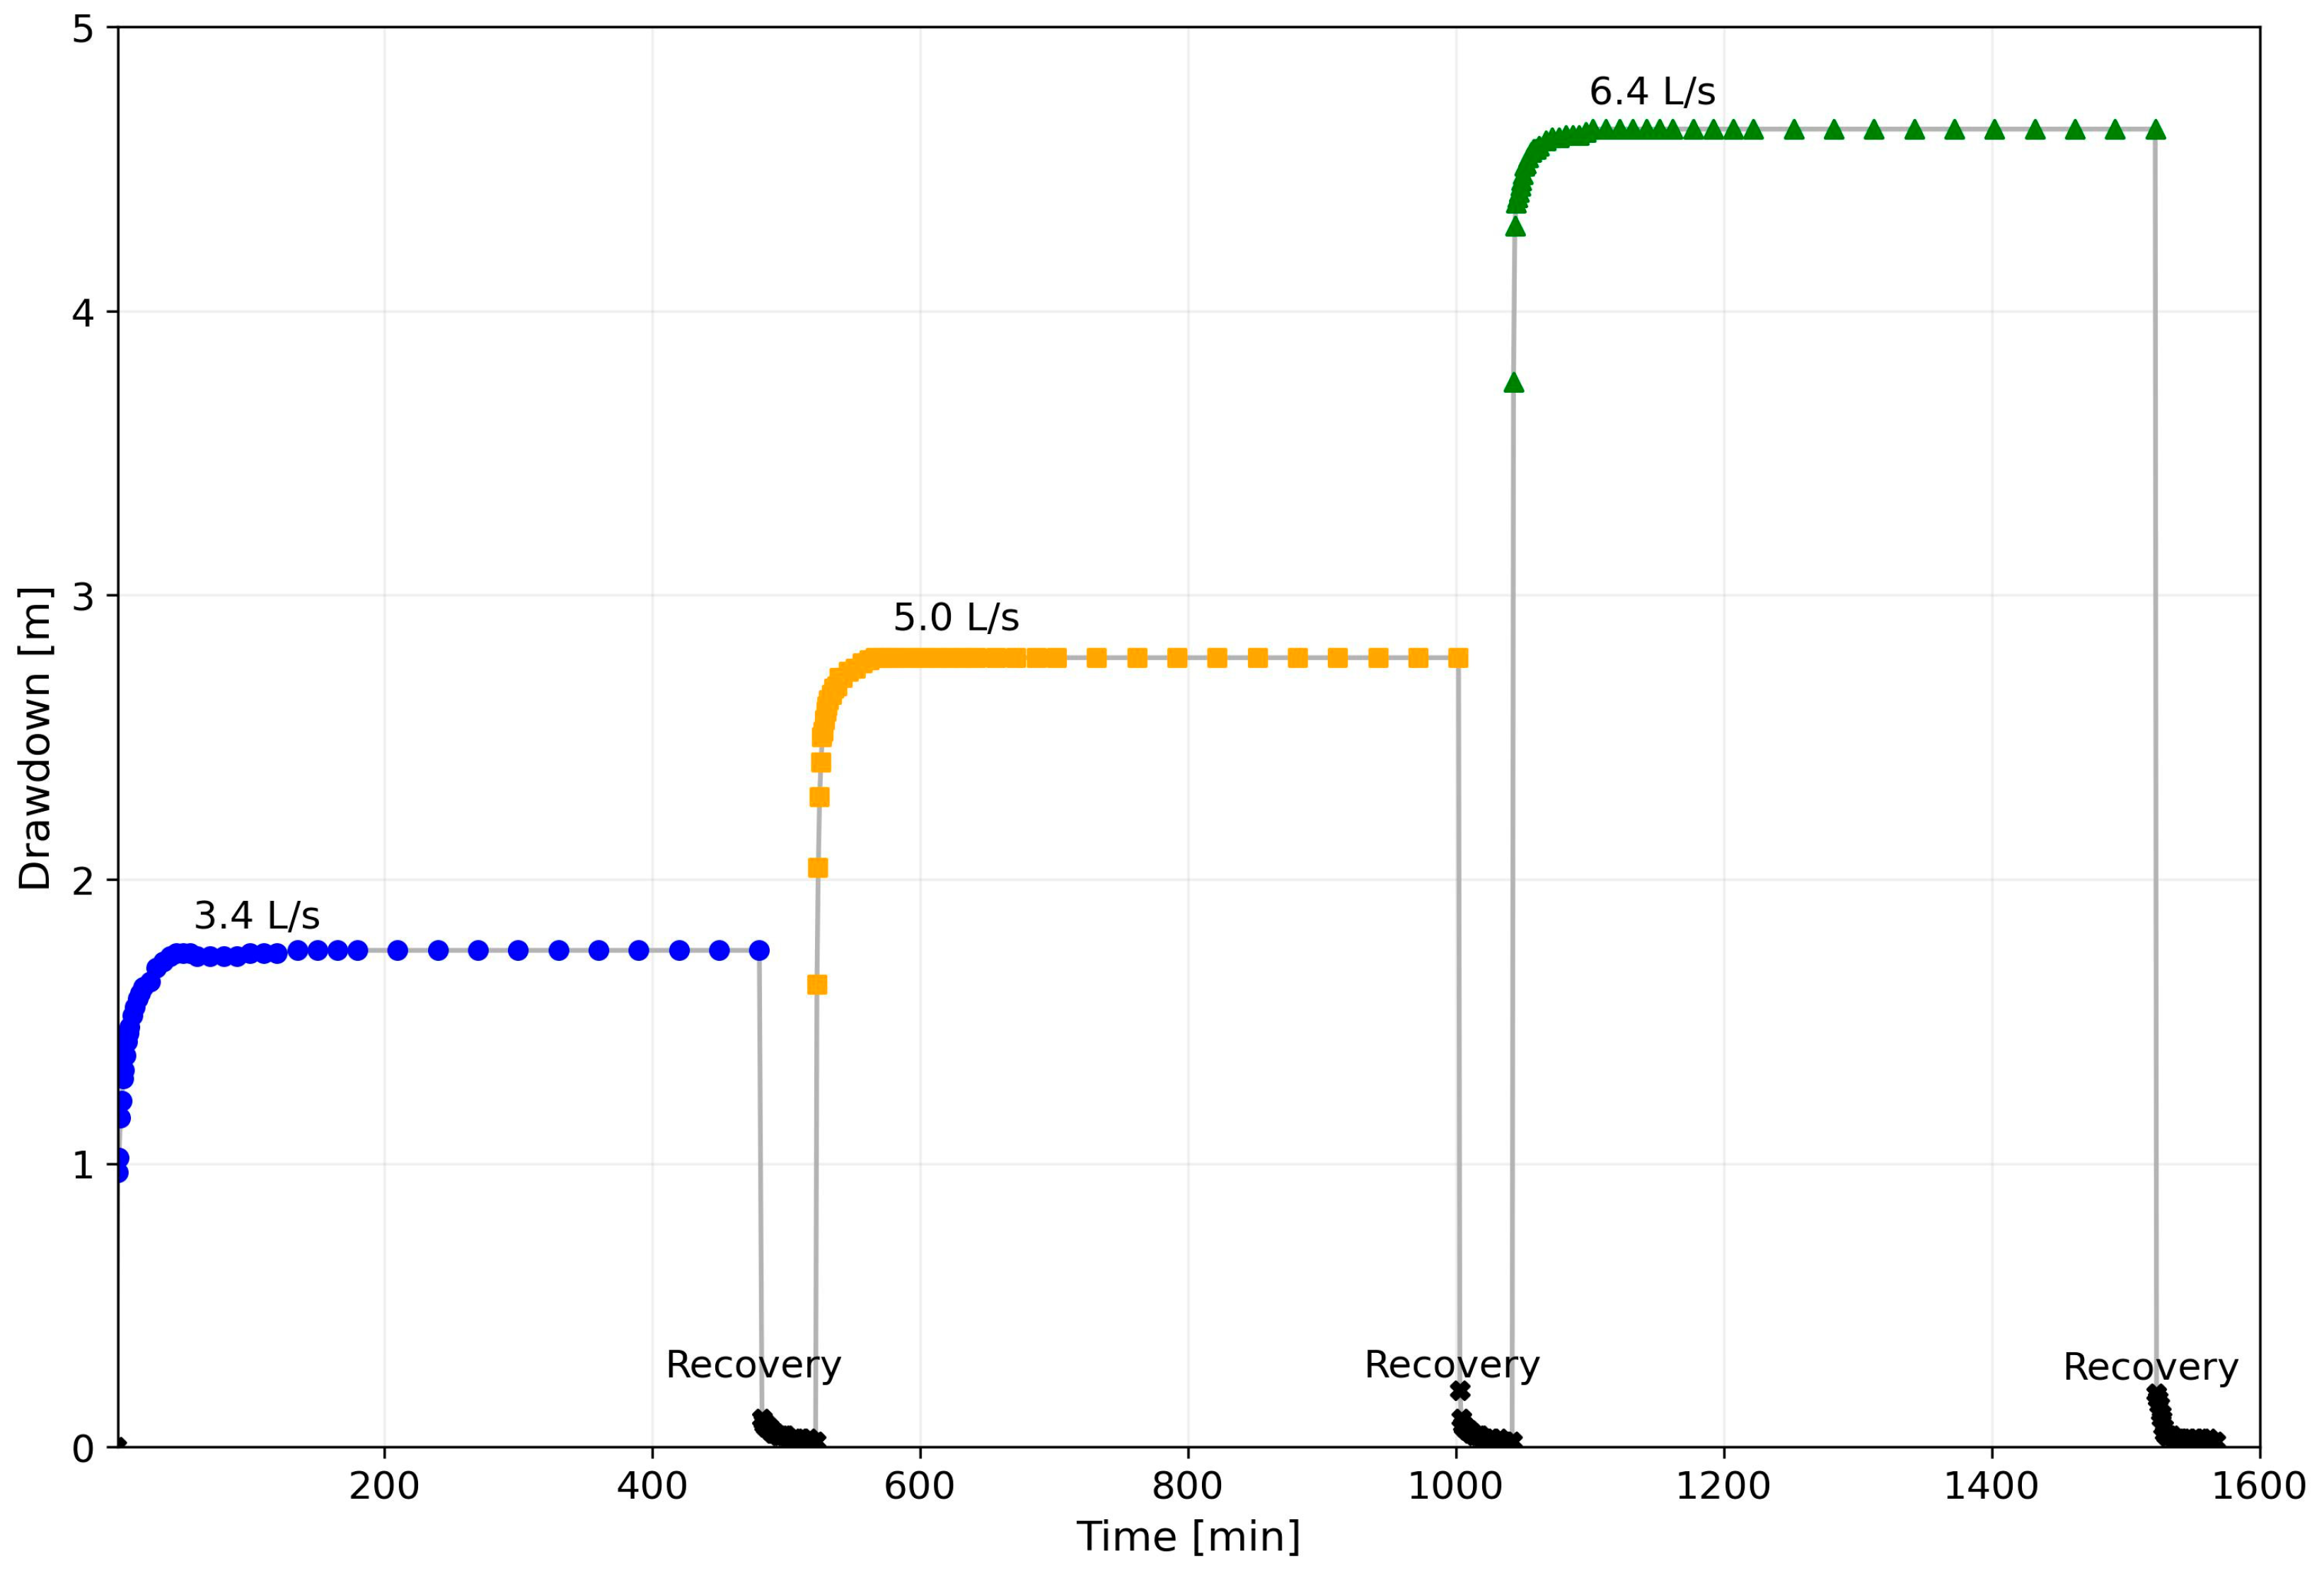
At the SC site, a 100 m deep well was tested. The drilling crosses 35 m fractured limestone and dolomitic limestone, followed by fractured limestone with karst cavities extending to the well bottom. The pumping tests were performed at three constant flow rates (3.4, 5.0, and 6.4 L/s). Each flow step lasted for 8 h, and the flow rate was increased only after complete water level recovery (Figure 9). The well drawdown exhibited a steady-state trend. Recovery was immediate for each flow rate step, reaching 98% in about one hour. Qs values ranged between 1.4 and 1.9 × 10⁻³ m2/s, while T values ranged between 1.7 and 2.4 × 10⁻³ m2/s. By the end of the three flow steps (SC tests in Table 2), the saturated aquifer thickness in the well was estimated to have decreased by 13% to 36%.
The semi-log and bi-log plots of drawdown–time (Figure 10) show a similar trend for the three tested flow rates. The derivative signal clearly exhibits two distinct sections: a stretch with a slope equal to zero lasting for approximately 100 min, followed by a stretch with a negative slope. This indicates radial flow in the early time, followed by the effects of a constant head boundary in the late time.

4.4. Sicignano Degli Alburni (SA) Site

The SA site is in a discharge area of the basal flow of the Mt. Alburni hydrogeological structure, where a notable increase in streamflow was observed (approximately 2 m3/s, nearby the well field area). Nine wells were drilled and tested within a 0.4 km2 area near the gaining river. Results revealed a significant variation in well yields and specific capacity due to the extreme heterogeneity of the carbonate aquifer (see Table 2). The aquifer exhibits zones with limited fractures and other zones with significant fracturing and karstification [41].
Six pumping tests were analyzed, excluding three wells that exhibited rapid water level decline within minutes of pump initiation. The tested wells intercept limestone from low-fractured to fractured and karstified formations, and some wells encountered tectonized and cataclastic rocks (SA wells in Table 2). The wells were tested at variable flow rate (from 31 to 80 L/s) with durations ranging from 6 to 54 h. The drawdown was monitored in the pumping well and in some cases also in observation wells (collected less frequently) [41].
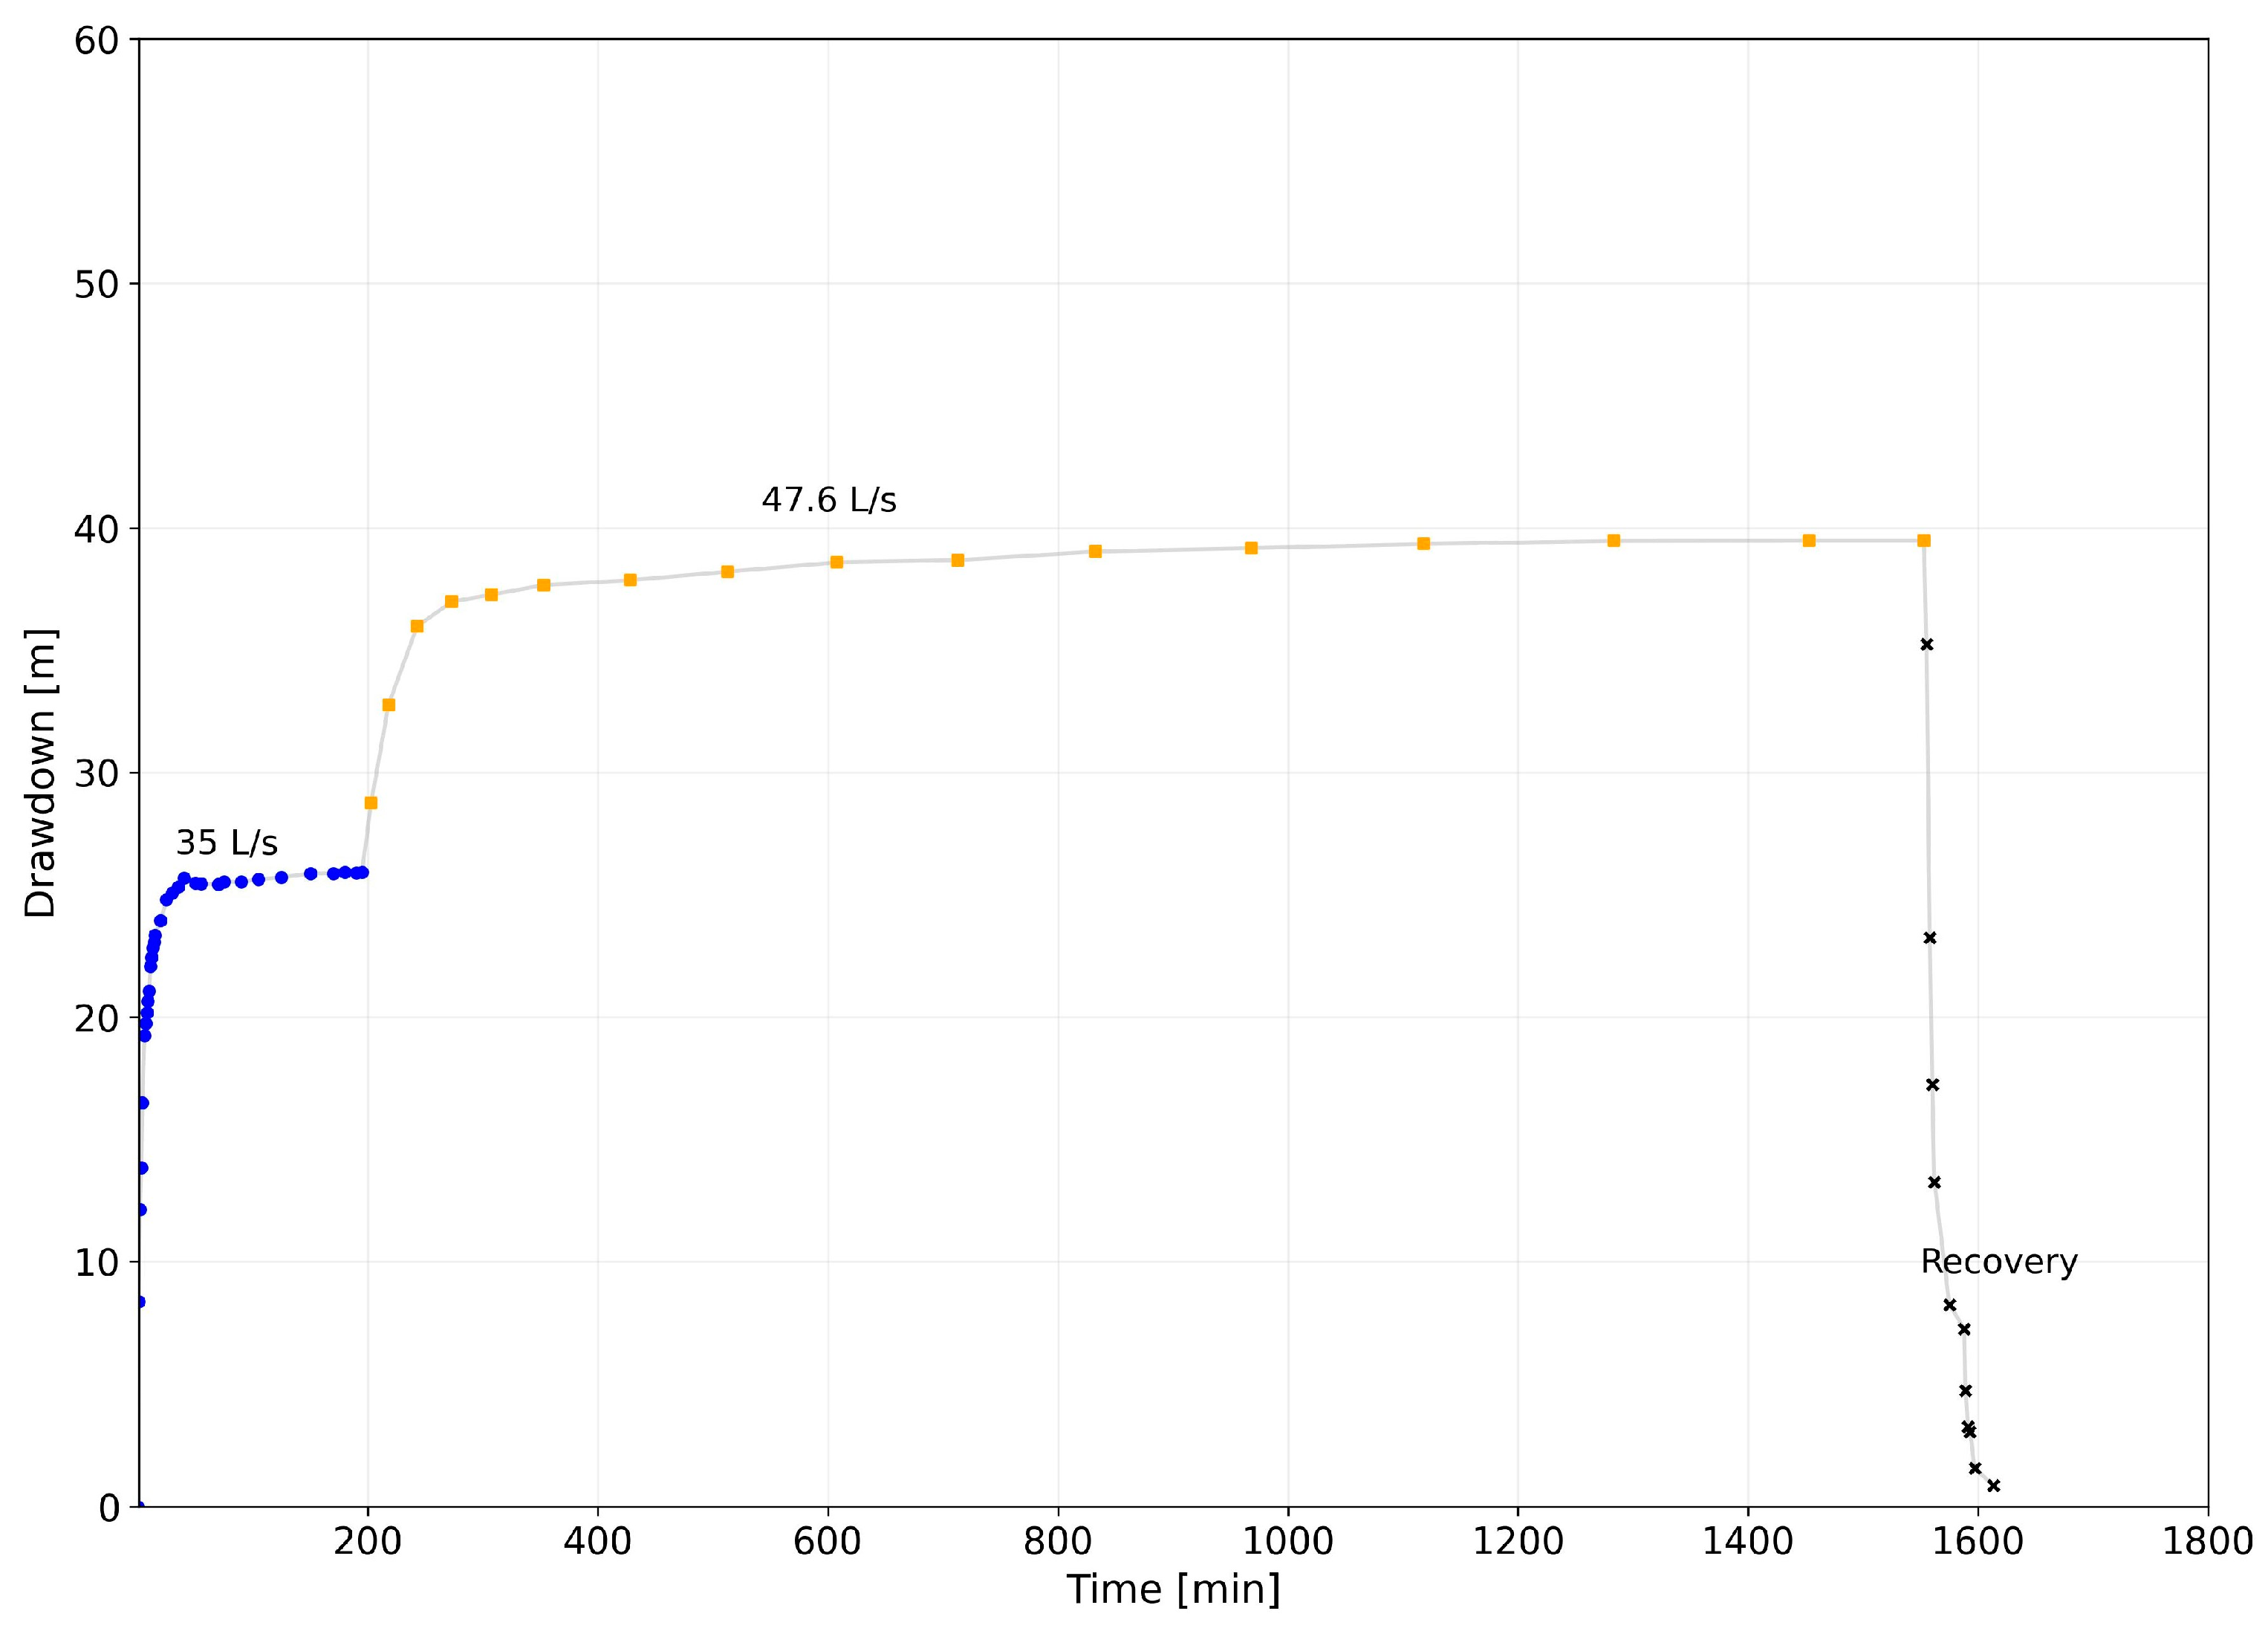
The drawdown–time relationship for the pumping well in all six tests shows a general trend towards a quasi-steady-state, at least at the lowest discharge steps (Figure 11). The wells experienced significant emptying during each pumping step, especially at higher flow rates when the steady-state of drawdown was not achieved (Table 2). Qs varied between 10−3 and 10−2 m2/s, and T values calculated from the first flow step fell within the range of 10−4 to 10−3 m2/s (Table 2).
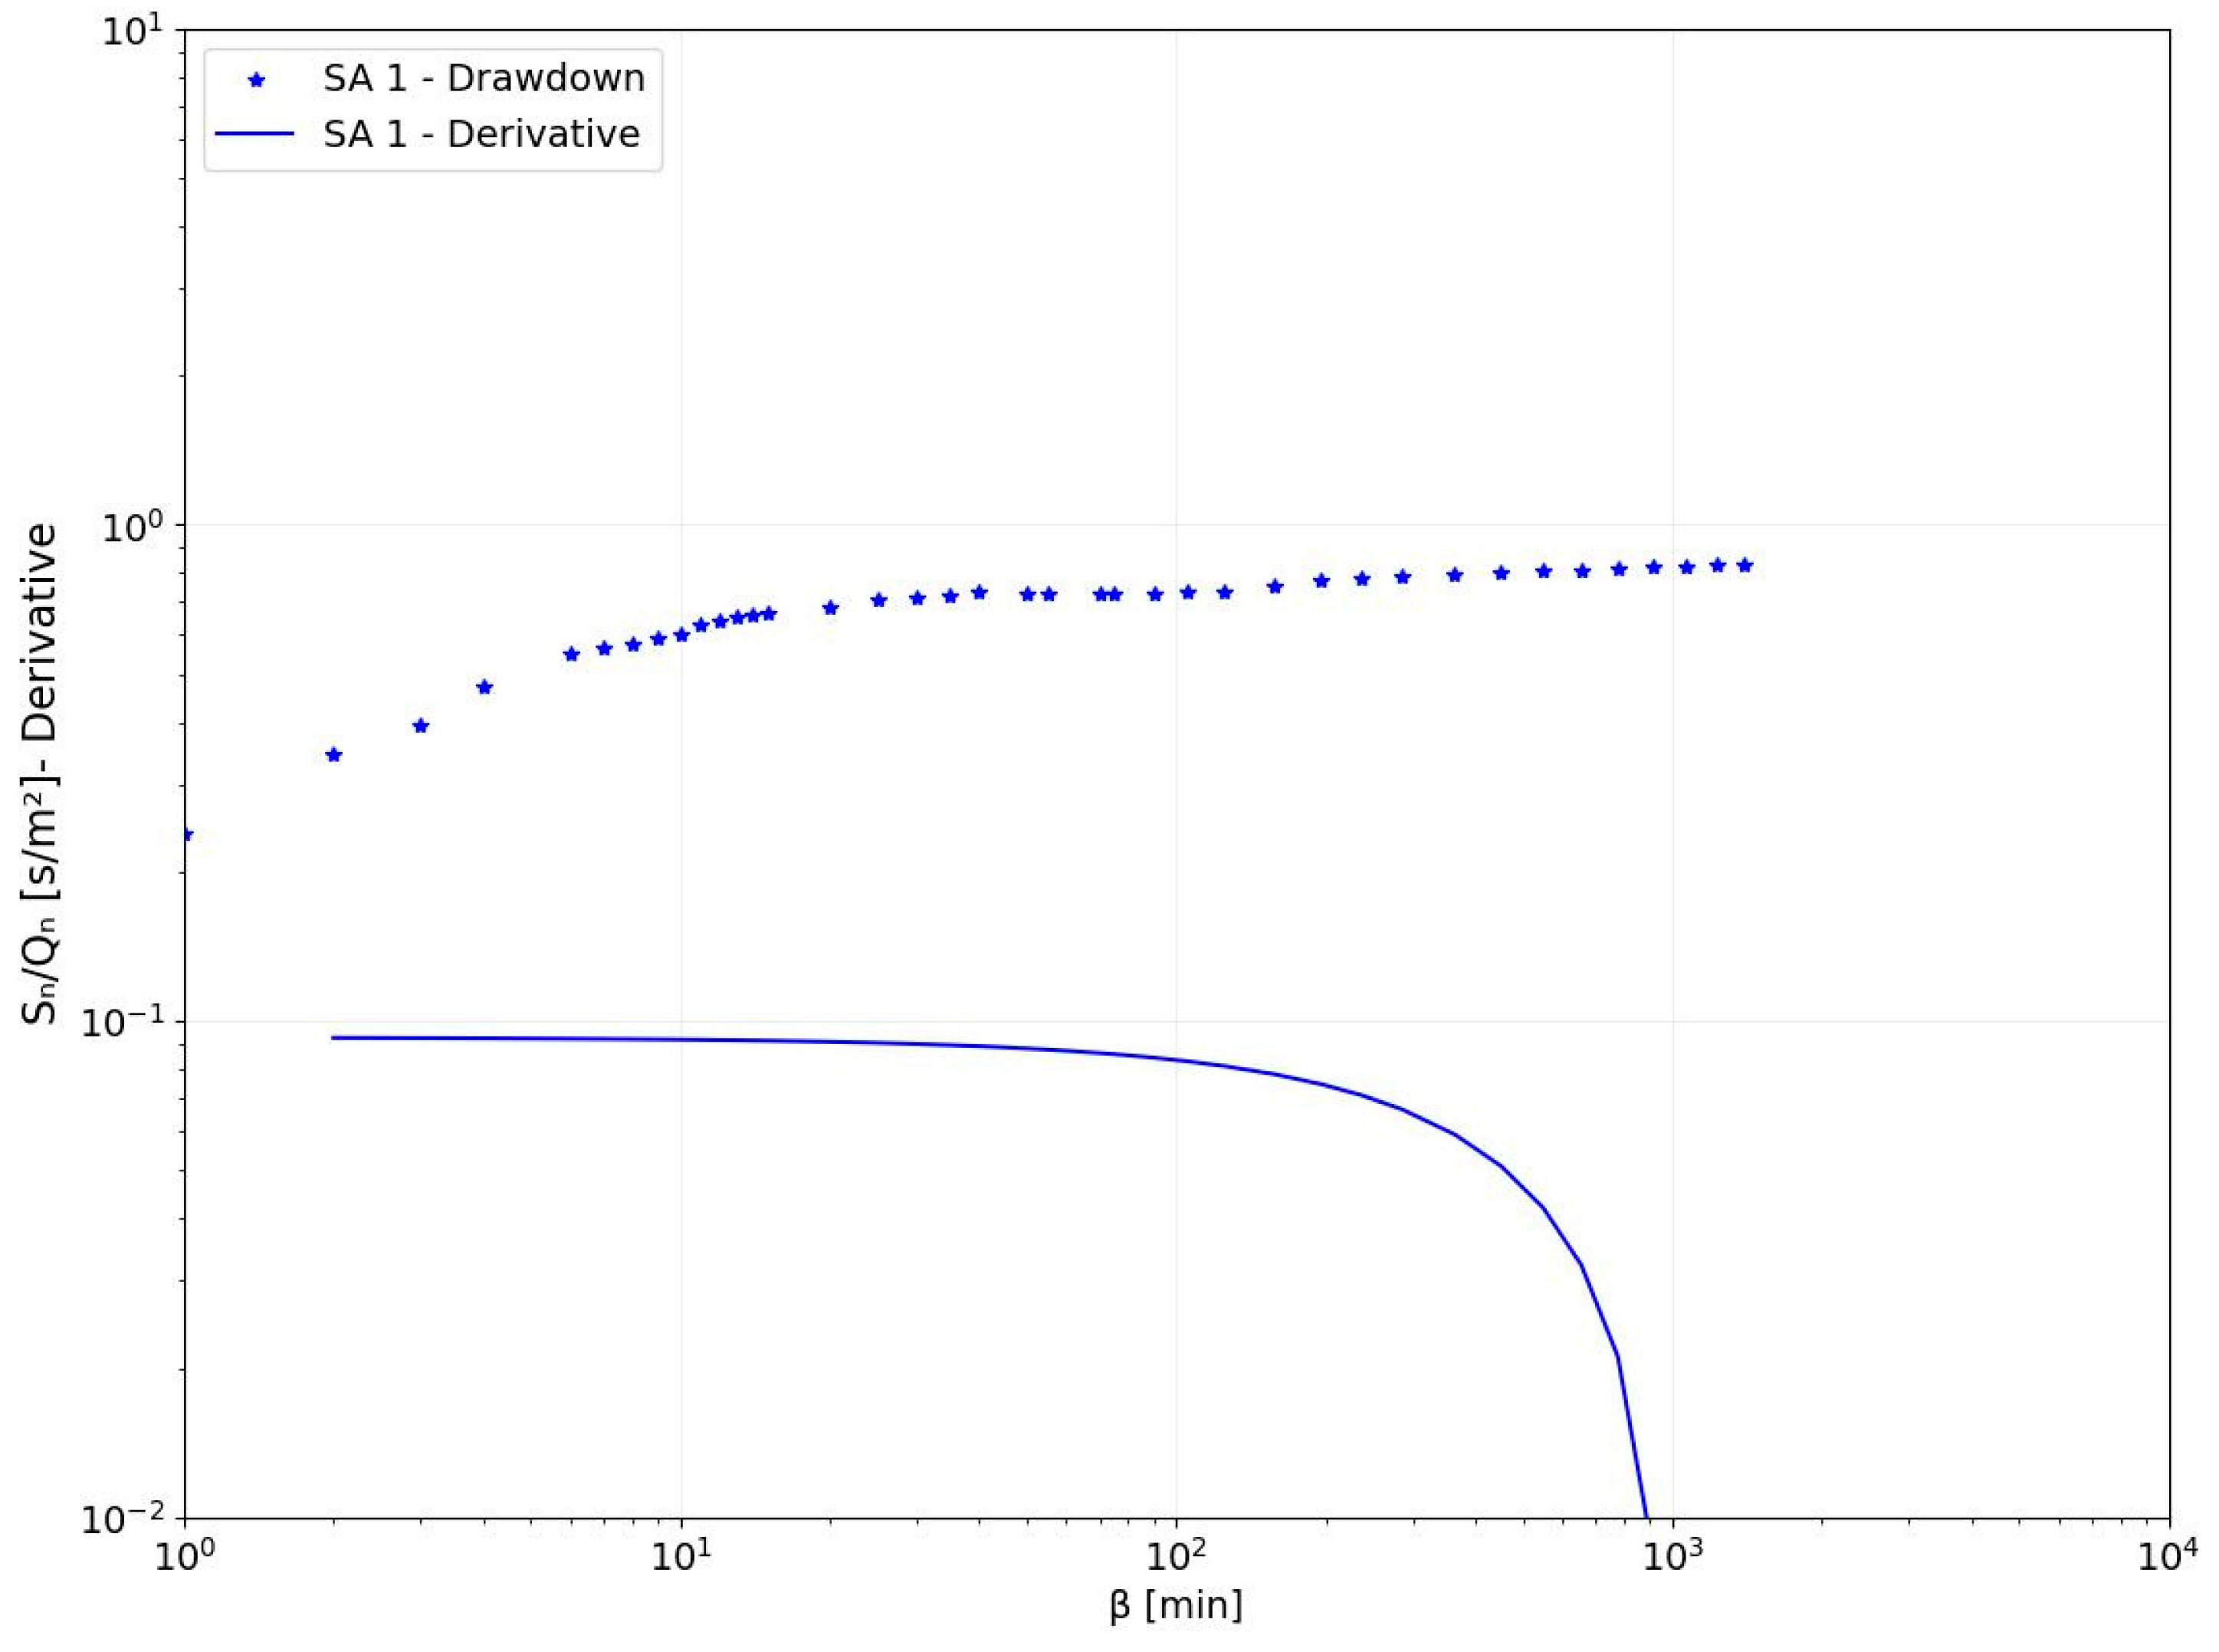
The derivative-drawdown bi-log plot, adjusted for variable flow according to the Birsoy and Summers method [47], reveals a sequential variation of flow dimensions from n = 2 to n = 4, indicative of an initial radial flow later influenced by the effect of a constant boundary (Figure 12).
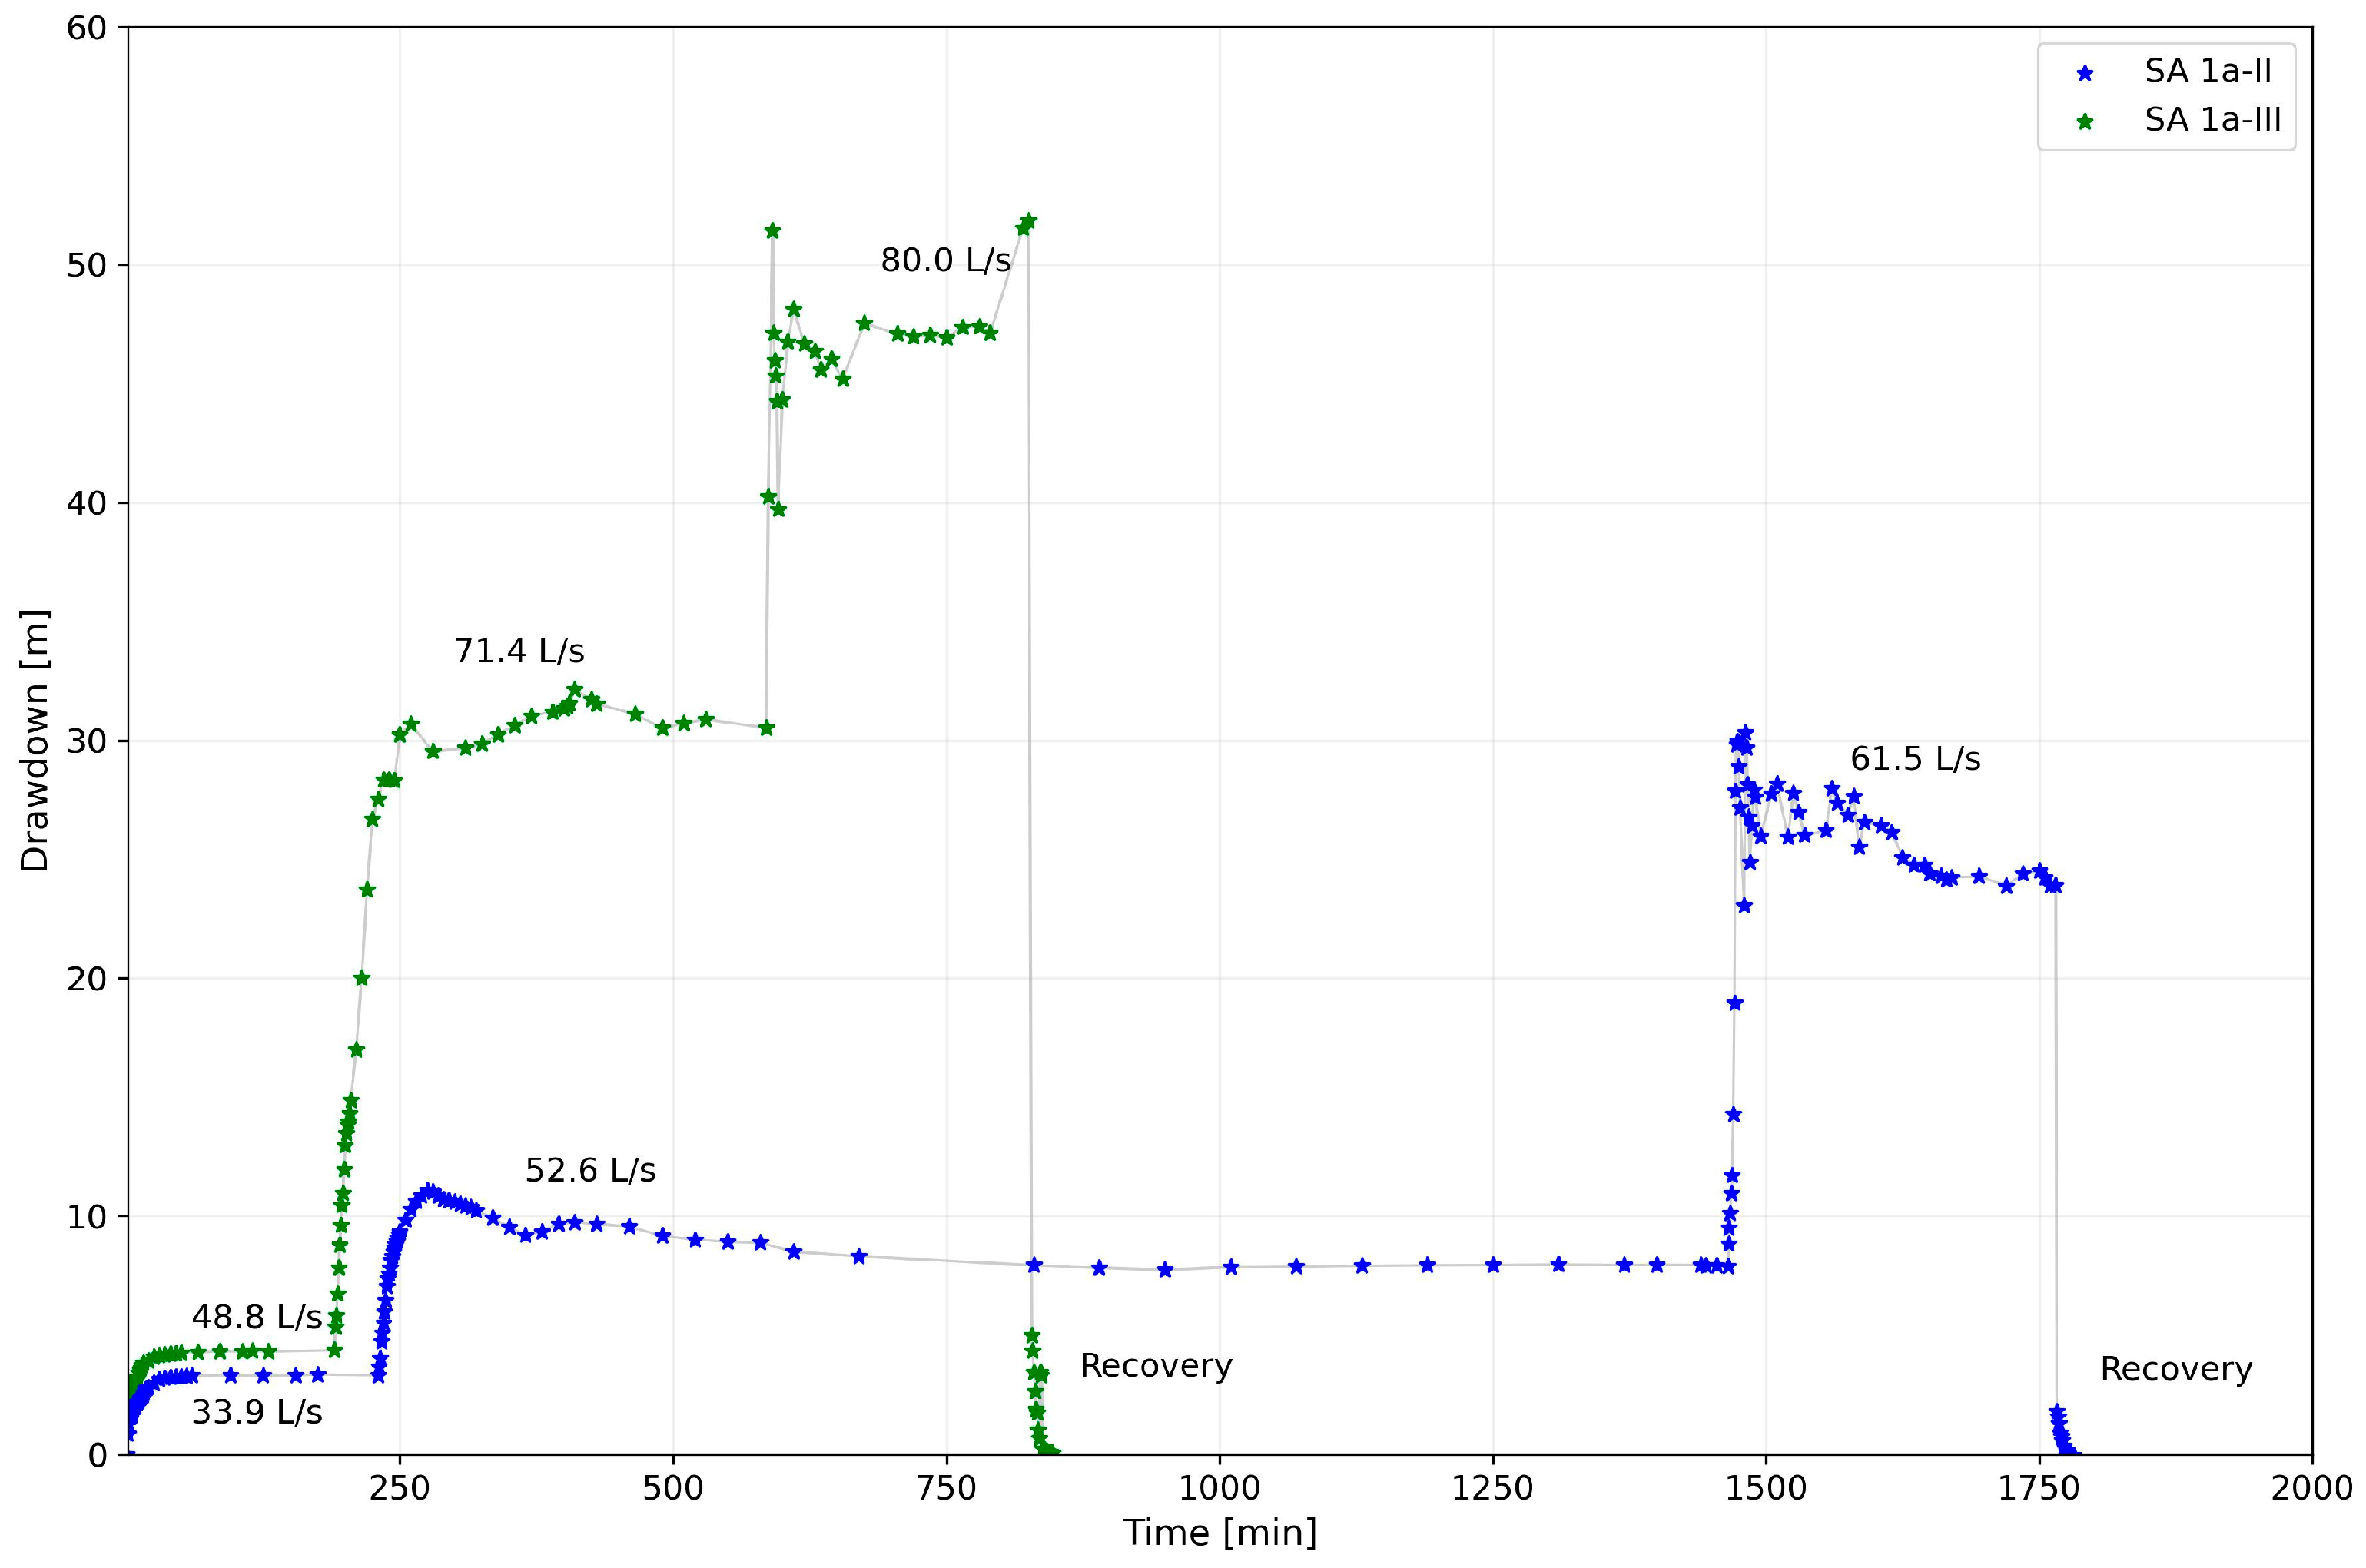
Two pumping tests (SA1a-II and SA1a-III tests in Table 2) were carried out on a well located in a fractured and karstified zone during the deepening of the drilling. Figure 13 shows a general trend to the quasi-steady-state; however, it is noteworthy that the drawdown oscillates during the early time of the higher flow steps, likely due to the “cleaning” of the open fracture and karst conduits. The derivative-drawdown bi-log plots for the first flow step of both tests shows a similar sequential variation observed in other wells (Figure 14). Qs and T are relatively higher compared with other wells and increase with increasing well depth (Table 2).
Following pumping, most wells show rapid water level recovery compared with the withdrawal duration. However, the SA1 well recovered only 80% of the drawdown after 30 min, despite the relatively short pumping period of approximately 6 h (Table 2).

5. Discussion

The results of the pumping tests carried out on a sample of wells in fractured and karstic carbonate aquifers of the southern Apennines are valuable for both examining aquifer behavior under pumping conditions and deriving strategies for sustainable pumping from this type of aquifer.

5.1. Response of Well Drawdown to Pumping

As shown in Figure 15, Qs and T parameters exhibited a wide range across the tested wells as well as for the ratio T/Hs, which does not depend on the thickness of the aquifer.
The well tested in the SE site shows a clear transient response in the drawdown–time trend (Figure 4). This behavior can be explained by the low AGY of the aquifer (9 L/s per km2), constituted by fractured and sometimes karstic calcareous rocks interlayered with less fractured marly and silico-calcareous rocks (Table 1). Although the connectivity of the fractures is evident, as demonstrated by the simultaneous response of drawdown in observation wells, the drawdown–time trend highlights a late time slope increase, leading to significant well emptying and therefore potential operational challenges. Notably, varying the pumping rate did not significantly modify the shape of the drawdown–time curve (Figure 4). The different parameters determined for the SE site well, intended as indexes of well productivity (mainly T and t/t′), are indicative of the lowest well yield of the examined sample (Table 2). Qs has limited meaning in this case due to transient flow behavior. These results are consistent with the presence of a low-transmissivity aquifer that is likely closed.
In the other cases, pumping wells show a steady-state or quasi-steady-state drawdown–time trend, despite significant variations being observed among the investigated aquifers.
The PO and AN sites share similar geological features: limestone with a well-developed network of fractures and some karstic conduits (Table 1). In these sites, the wells intercept the basal groundwater circulation of hydrogeological structures, characterized by high AGY (20–24 L/s per km2). The rapid achievement of steady-state drawdown, along with the highest values of Qs and T and the lowest values of t/t′, are indicative of the highest yield of these wells compared with others examined. Despite high pumping rates, well emptying remains minimal (Table 2). The presence of a well-connected network of fractures and karstic conduits is well highlighted by the consistent response of the drawdown and its derivative in observation wells (e.g., Figure 8).
While the SC and SA sites exhibit similar drawdown trends to PO and AN sites, they show lower values of Qs and T and higher well emptying (Table 2), although the four sites are characterized by similar carbonate formations of the platform environment.
Despite intercepting a fractured and karstic aquifer in limestone and dolomitic limestones in a hydrogeological structure with high AGY (Table 1), the SC wells show a relatively low yield. This behavior can be traced back to the complex local stratigraphic and structural setting. The well probably intercepts higher compartments of the hydrogeological structure rather than the more productive basal groundwater circulation. This evidence is supported by the difference in elevation between the water table in the well and discharge areas of the base flow [37].
At the SA site, although being located within a hydrogeological structure boasting the highest AGY (30 L/s per km2) among the studied sites and with wells intercepting the basal groundwater circulation of the karstic aquifer near a discharge area (Table 1), significant variations in well yields are observed within the same location. Wells intercepting or situated near karst conduits exhibit significantly higher Qs and T (by an order of magnitude) compared with nearby wells that only intercept fractures. Even for the most productive wells, whose higher pumping rates are not comparable with those of PO and AN sites, significant percentages of well emptying are observed (Table 2). This disparity in well yields can be attributed to preferential flow channeling within the aquifer. Groundwater flows in open fractures and karstic conduits, reducing the likelihood of wells intercepting the most productive zones, as documented in literature [41].

5.2. Sustainability of Pumping

The findings from these different examined cases offer valuable insights into defining operational flow rate for wells in highly heterogenous hydrogeological environments, such as fractured and karstic carbonate aquifers.
It is clear that, as in other fractured and heterogeneous aquifers, the duration of a pumping test is crucial for understanding the drawdown response over time [15]. This is pivotal, especially when only data from the pumping well are available. Therefore, to accurately predict long-term drawdown in the pumping well, constant flow rate pumping tests of significant duration are preferable to step-drawdown tests. Moreover, long-term constant flow tests allow for a more detailed examination of the drawdown–derivative trend, as well as a significative analysis of the sequential flow dimension, further aiding the interpretation of pumping test data (e.g., [46]). This approach enables detailed differentiation between aquifers in the studied sites; the diversification was based on drawdown responses to pumping (transient, quasi-steady-state, and steady-state) in relation to the hydrogeological heterogeneity due to the hydrostratigraphy, fracturing (degree and connectivity), diffusion, and connectivity of karst conduits.
In practical terms, the drawdown–time trend observed during a long-term constant flow rate test allows us to predict the drawdown–time relationship for different pumping flow rates. This allows us to determine the sustainable well yield assuming the “maximum permissible drawdown in the well” in relation to the intercepted aquifer thickness, ensuring a contained well emptying (e.g., ΔHs < 30%). This approach aligns with the concept of the “sustainable yield of a well” defined by Van Tonder et al. [23], i.e., the discharge rate that will not cause the water level in the well to drop below a prescribed limit dependent on the nature and thickness of the aquifer and the depth of the well.
The additional parameters, useful for characterizing the productivity of the wells and also giving indications for the assessment of the sustainable well yield, are: (i) the specific capacity determined during the first pumping step (Qs); (ii) the transmissivity derived from drawdown measurements in the pumping well (T); and (iii) the recovery time compared with the pumping duration (t′/t).
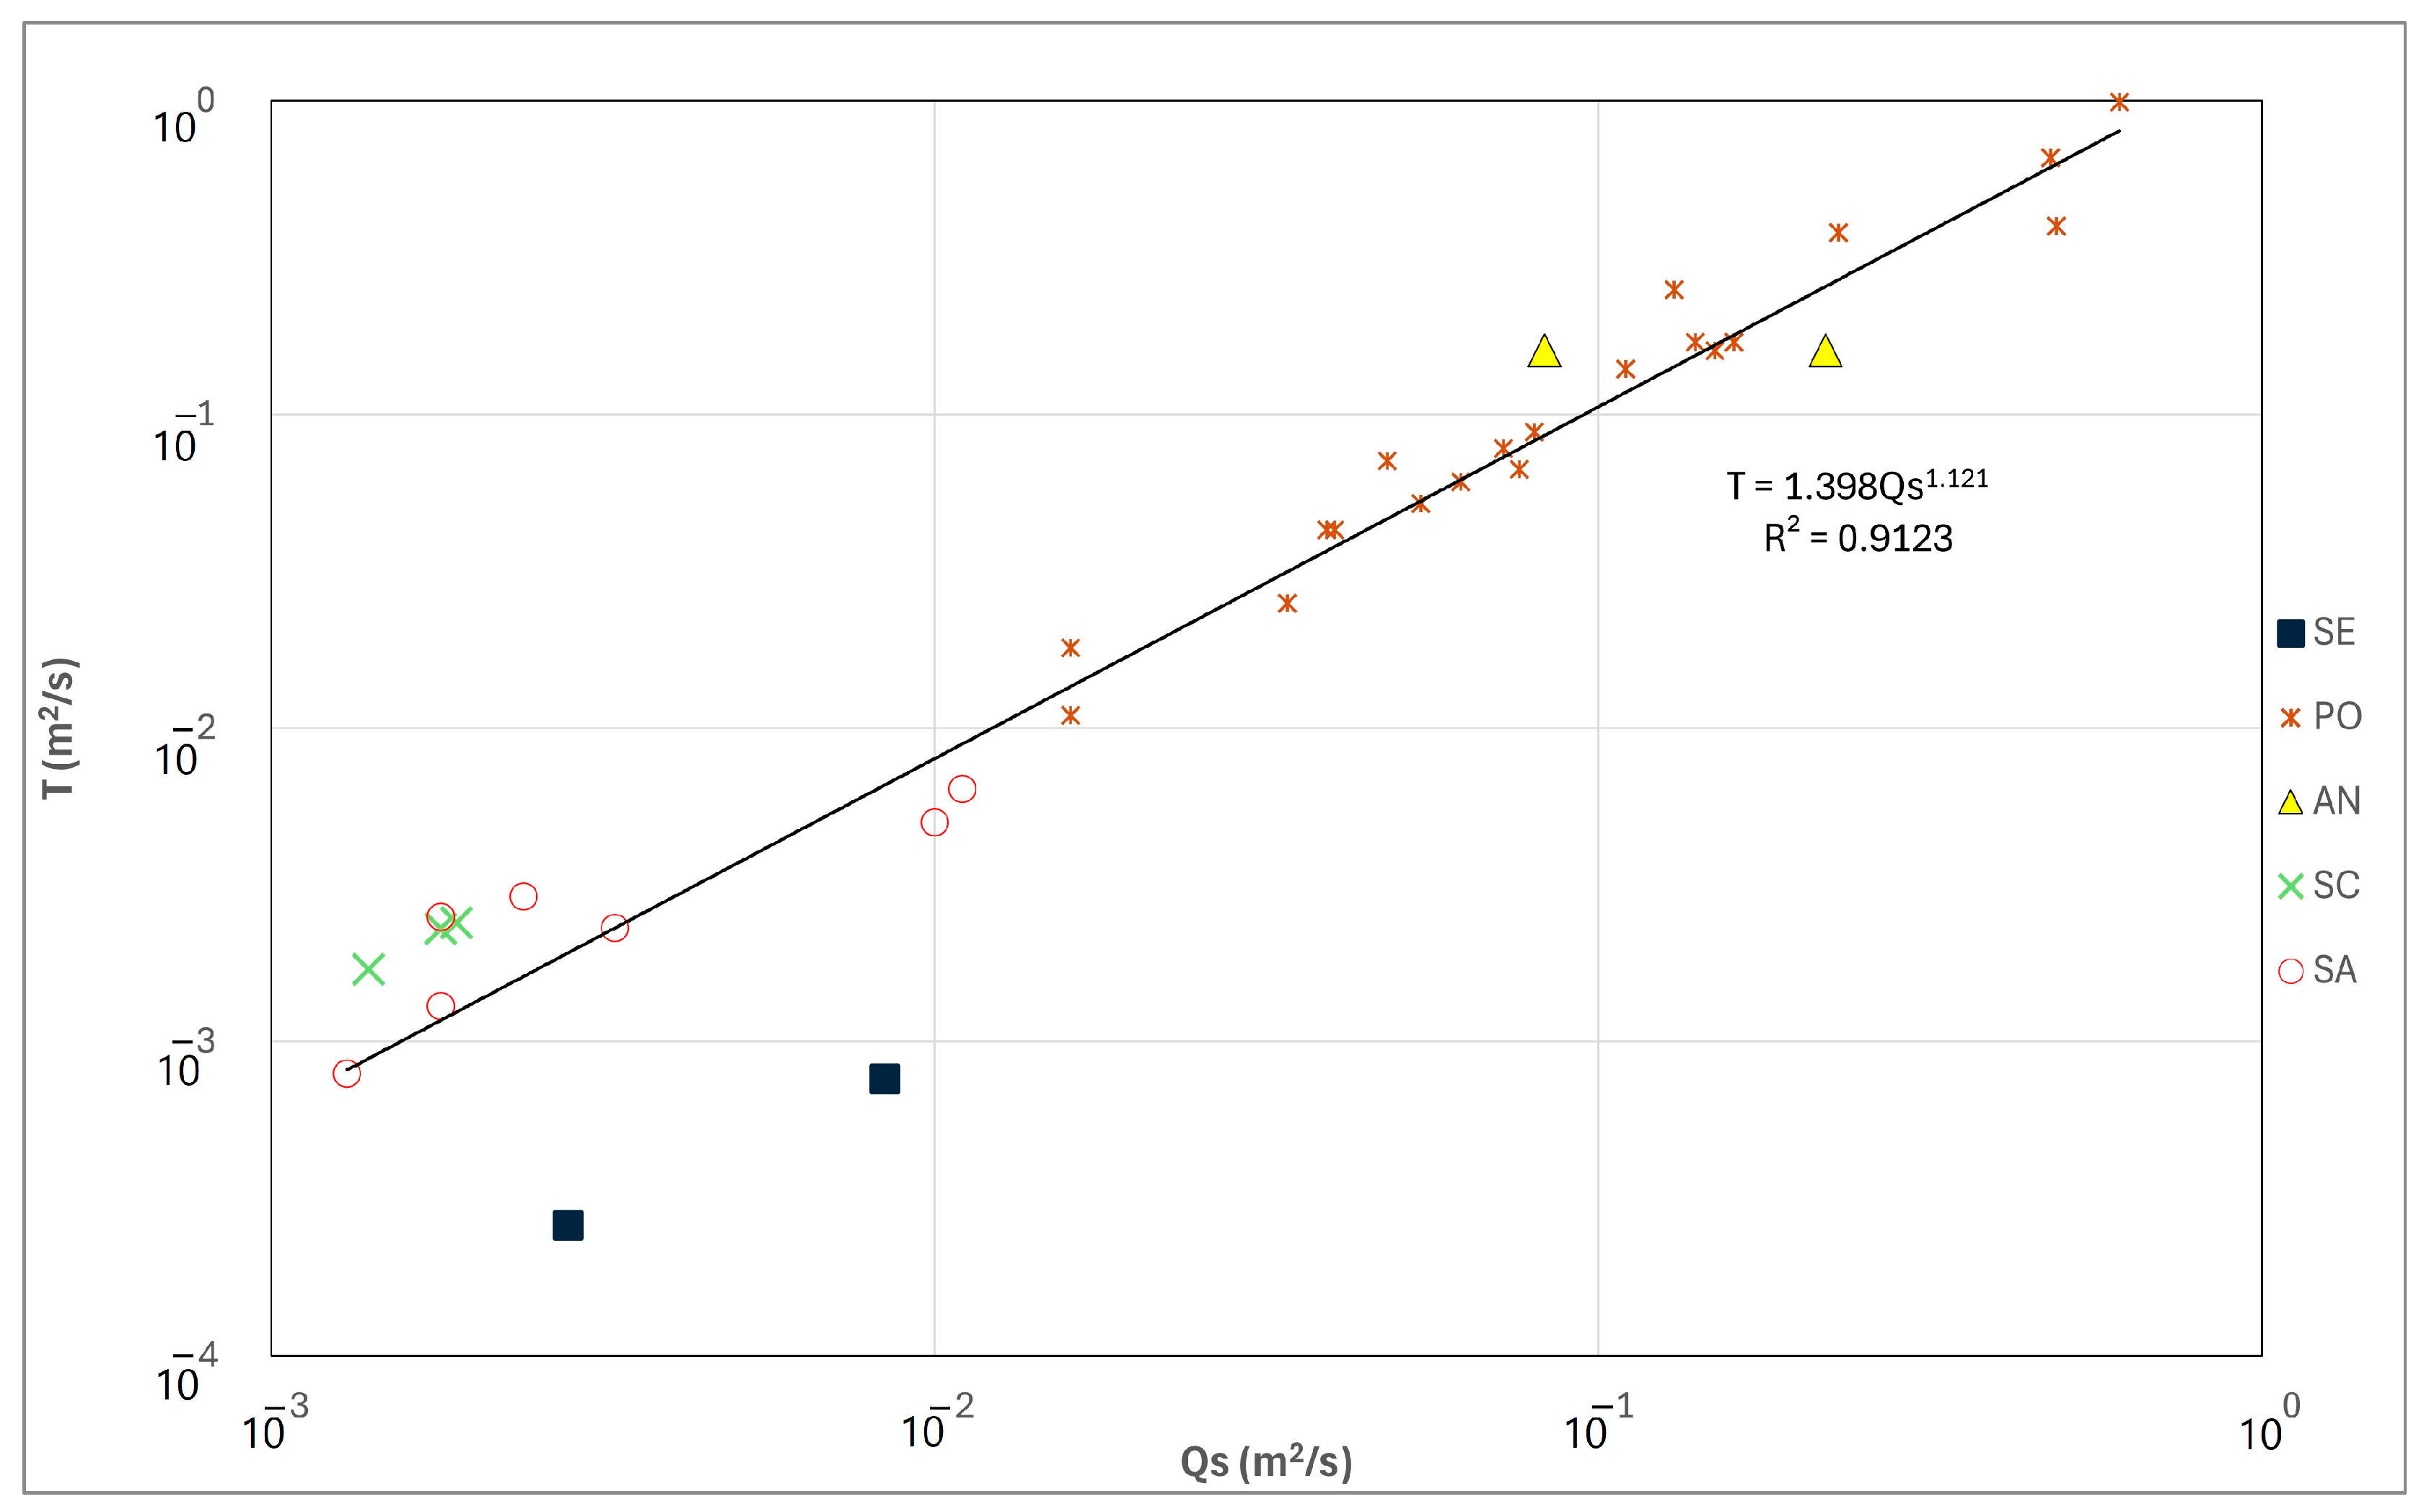
Qs and T are particularly informative when steady-state or quasi-steady-state conditions are reached during pumping. As evident in Figure 16, except for the SE site where an unsteady-state regime appears, the relationship between the two parameters, which is consistent with observations in other carbonate aquifers (e.g., [28,50,51,52]), effectively distinguishes the most productive wells (PO and AN sites).
When the steady-state flow is achieved, defining sustainable well yield becomes straightforward, particularly when a low t′/t value and n-flow dimension tends towards four in the late time. In this scenario, the operational flow rate of the well is primarily related to the percentage of ΔHs to avoid adverse effects like dewatering and the increase in non-linear head losses in the well. Here, the focus shifts from sustainable well yield to sustainable yield at the aquifer or basin scale. In other words, the impact of pumping on the residual groundwater flow of the aquifer or basin become relevant, in accordance with visions on the sustainability of groundwater withdrawals (e.g., [53,54]).
In this scenario, the operational flow rate determined from a constant discharge test, using the drawdown trend over time, as well as the well depth can be assumed as the first operational flow rate that may be updated basing on monitoring. The test duration to determine the sustainable well yield can be optimized by limiting the duration of the test when n tends towards four. Extending the test further beyond the inflection of the derivative would not be cost-effective. Any unexpected changes in drawdown or its derivative can be identified through monitoring during the initial well operation.
Conversely, when the drawdown–time analysis indicates transient flow, sustainable groundwater withdrawal from the aquifer or basin depends essentially on the capacity of the well to “capture” groundwater in a sustainable manner. In this case, for defining the operational flow rate and pumping duration, the analyses of the trend of drawdown–time and its derivative for a sufficient duration becomes crucial. This analysis helps to predict the long-term drawdown behavior in the pumping well. The prediction, combined with the definition of a drawdown limit in the well, is crucial for setting the operational parameters. In these cases, the shape of the drawdown–time curve and the analysis of the sequential of flow dimension become even more important. By starting with the maximum permissible well-emptying percentage, it will be possible to identify the appropriate flow rate and potentially identify the pumping duration. The constant flow test duration for defining the sustainable yield well in this case is essentially determined by the maximum acceptable well emptying (i.e., ΔHs).

6. Conclusions

Pumping tests in carbonate aquifers of southern Italy that differ in stratigraphic and structural settings and degree of fracturing and karstification were analyzed and interpreted considering the average groundwater yield of the different hydrogeological structures and the positioning of pumping center within the groundwater flow scheme. The wide variability of the average groundwater yield of the examined hydrogeological structures (from 9 to 30 L/per km2) is generally consistent with the variation in well yields observed from the pumping test results (e.g., the transmissivity values varied by about four orders of magnitude).
For these aquifers, analyzing the drawdown over time, its derivative, and the sequence of the flow dimension in the pumping well during a test is particularly useful for defining sustainable groundwater withdrawal. Specifically, when pumping induces a steady-state drawdown response, the focus for defining the sustainable abstraction shifts to the basin or aquifer scale. In the latter case, the sustainable yield depends on the impact of the pumping flow rate on residual groundwater outflow from the system (basin or aquifer), necessary for maintaining aquatic habitats and dependent ecosystems. Conversely, a transient drawdown response to pumping represents a challenge of defining sustainable well yield. In this case, the well’s capacity to capture groundwater, influenced by local hydraulic diffusivity, boundary conditions, and positioning of the well within hydrogeological system, becomes the primary factor for well yield and its sustainability.
Unlike low-permeability fractured aquifers (such as hard-rock aquifers), a carbonate aquifer can show significant variation in the local pumping response, even in cases of significant groundwater yield at the basin or aquifer scales. This variability can be attributable to the difference in the degree of fracturing and karst development. Even within the same hydrogeological structure and site, highly tectonized carbonate rocks with well-developed karst conduits can show significant variations in well yield. Differently, carbonate rocks with a developed fracture network, lithological homogeneity, and adolescent or young karst development typically demonstrate more consistent well yields. Lastly, carbonate rocks with marly or silico-calcareous interlayers, even if highly fractured and karstified, can be influenced by local stratigraphic and structural conditions, which can affect drawdown propagation in the aquifer and, consequently, long-term well yield.
In these hydrogeological settings, the key to defining the well operational pumping flow is the observation of drawdown trend over time over a sufficient period. This extended observation is necessary to reasonably predict the long-term drawdown behavior in the pumping well. Therefore, constant rate pumping tests are preferred. Alternatively, if a variable rate test is conducted, the drawdown data should be corrected into a constant-rate drawdown. The extrapolated prediction combined with defining the well drawdown limit (based on the admissible percentage of well emptying) is crucial for planning the initial operation of the well. Subsequently, by monitoring the drawdown acquired for the long term during the initial phase, the pumping mode and flow rate can be further optimized. This not only ensures a sustainable well use but also reduces the need for extensive pumping tests during the initial investigation phase, leading to cost savings.

Author Contributions

Conceptualization, V.P., M.P. and C.S.; methodology, V.P. and C.S.; software, M.P.; validation, V.P. and C.S.; formal analysis, V.P., M.P. and C.S.; data curation, M.P. and C.S.; writing—original draft preparation, V.P., M.P. and C.S.; writing—review and editing V.P. and C.S.; visualization, M.P.; supervision, V.P. and C.S.; project administration, V.P.; funding acquisition, V.P. All authors have read and agreed to the published version of the manuscript.

Funding

This research was funded by the Agritech National Research Center and received funding from the European Union Next-GenerationEU (PIANO NAZIONALE DI RIPRESA E RESILIENZA (PNRR)—MISSIONE 4 COMPONENTE 2, INVESTIMENTO 1.4—D.D. 1032 17/06/2022, CN00000022). This manuscript reflects only the authors’ views and opinions; neither the European Union nor the European Commission can be considered responsible for them.

Data Availability Statement

The data presented in this study are available on request from the corresponding author.

Acknowledgments

This study is dedicated to the memory of the hydrogeologist Pietro B. Celico, who introduced one of the authors to the knowledge of the hydrogeology of Southern Italy. The authors would like to thank the reviewers and the editor for their suggestions, which improved the quality of the manuscript.

Conflicts of Interest

The authors declare no conflicts of interest. The funders had no role in the design of the study; in the collection, analyses, or interpretation of data; in the writing of the manuscript; or in the decision to publish the results.

References

  1. Ford, D.; Williams, P.W. Karst Hydrogeology and Geomorphology, 1st ed.; Wiley: Chichester, UK, 2007; pp. 103–144. [Google Scholar]
  2. Chen, Z.; Auler, A.S.; Bakalowicz, M.; Drew, D.; Griger, F.; Hartmann, J.; Jiang, G.; Moosdorf, N.; Richts, A.; Stevanovic, Z.; et al. The world karst aquifer mapping project: Concept, mapping procedure and map of Europe. Hydrogeol. J. 2017, 25, 771–785. [Google Scholar] [CrossRef]
  3. Stevanovic, Z. Karst waters in potable water supply: A global scale overview. Environ. Earth Sci. 2019, 78, 1–12. [Google Scholar] [CrossRef]
  4. Goldscheider, N. A holistic approach to groundwater protection and ecosystem services in karst terrains. Carbonates Evaporites 2019, 34, 1241–1249. [Google Scholar] [CrossRef]
  5. Siegel, L.; Goldscheider, N.; Petitta, M.; Xanke, J.; Andreo, B.; Bakalowicz, M.; Barberá, J.A.; Bouhlila, R.; Burg, A.; Doummar, J.; et al. Distribution, threats and protection of selected karst groundwater-dependent ecosystems in the Mediterranean region. Hydrogeol. J. 2023, 31, 2231–2249. [Google Scholar] [CrossRef]
  6. Alley, W.M.; Reilly, T.E.; Franke, O.L. Sustainability of ground-water resources. U.S. Geol. Surv. Circ. 1999, 1186, 1–79. [Google Scholar]
  7. Bredehoeft, J.D. The water budget myth revisited: Why hydrogeologists model. Ground Water 2002, 40, 340–345. [Google Scholar] [CrossRef]
  8. Elshall, A.S.; Arik, A.D.; El-Kadi, A.I.; Pierce, S.; Ye, M.; Burnett, K.M.; Wada, C.A.; Bremer, L.L.; Chun, G. Groundwater sustainability: A review of the interactions between science and policy. Environ. Res. Lett. 2020, 15, 093004. [Google Scholar] [CrossRef]
  9. Gleeson, T.; Cuthbert, M.; Ferguson, G.; Perrone, D. Global groundwater sustainability, resources, and systems in the Anthropocene. Annu. Rev. Earth Planet. Sci. 2020, 48, 431–463. [Google Scholar] [CrossRef]
  10. Domenico, P.A. Concepts and Models in Groundwater Hydrology; McGraw-Hill: New York, NY, USA, 1972. [Google Scholar]
  11. Freeze, R.A.; Cherry, J.A. Groundwater, 1st ed.; Prentice-Hall: Englewood Cliffs, NJ, USA, 1979; p. 604. [Google Scholar]
  12. Beeson, S.; Misstear, B.D.R.; van Wonderen, J.J. Assessing the reliable outputs of groundwater sources. Water Environ. J. 1997, 11, 295–304. [Google Scholar] [CrossRef]
  13. Bredehoeft, J.D.; Alley, W.M. Mining groundwater for sustainable yield. Bridge 2014, 44, 33–41. [Google Scholar]
  14. Hammond, P.A. Reliable yields of public water-supply wells in the fractured-rock aquifers of central Maryland, USA. Hydrogeol. J. 2018, 26, 333–349. [Google Scholar] [CrossRef]
  15. Piscopo, V.; Sbarbati, C.; Dinagde, T.D.; Lotti, F. Practical approach for defining the sustainable yield of wells in low-permeability fractured rocks. Sustainability 2023, 15, 10706. [Google Scholar] [CrossRef]
  16. Eagon, H.B.; Johe, D.E. Practical Solutions for Pumping Tests in Carbonate-Rock Aquifers. Groundwater 1972, 10, 6–13. [Google Scholar] [CrossRef]
  17. Quinlan, J.F.; Ewers, R.O. Ground water flow in limestone terranes: Strategy rationale and procedure for reliable, efficient monitoring of ground water quality in karst areas. In Proceedings of the National Symposium and Exposition on Aquifer Restoration and Ground Water Monitoring, 5th, Columbus, Worthington, OH, USA, 17–20 June 1985. [Google Scholar]
  18. Thrailkill, J. Drawdown interval analysis: A method of determining the parameters of shallow conduit flow carbonate aquifers from pumping tests. Water Resour. Res. 1988, 24, 1423–1428. [Google Scholar] [CrossRef]
  19. Jones, W.K. Pump tests of wells at the National Training Center near Shepherdstown, West Virginia. In Karst Modeling, Proceedings of the Symposium, Charlottesville, VA, USA, 24–27 February 1999; Special Publication 5; Karst Waters Institute: Charlottesville, VA, USA, 1999; pp. 259–261. [Google Scholar]
  20. Maréchal, J.C.; Ladouche, B.; Doerfliger, N.; Lachassagne, P. Interpretation of pumping tests in a mixed flow karst system. Water Resour. Res. 2008, 44, W05401. [Google Scholar] [CrossRef]
  21. Giese, M.; Reimann, T.; Bailly-Comte, V.; Maréchal, J.C.; Sauter, M.; Geyer, T. Turbulent and laminar flow in karst conduits under unsteady flow conditions: Interpretation of pumping tests by discrete conduit-continuum modeling. Water Resour. Res. 2018, 54, 1918–1933. [Google Scholar] [CrossRef]
  22. Misstear, B.D.R.; Beeson, S. Using operational data to estimate the reliable yields of water-supply wells. Hydrogeol. J. 2000, 8, 177–187. [Google Scholar] [CrossRef]
  23. Van Tonder, G.J.; Botha, J.F.; Chiang, W.H.; Kunstmann, H.; Xu, Y. Estimation of the sustainable yields of boreholes in fractured rock formation. J. Hydrol. 2001, 241, 70–90. [Google Scholar] [CrossRef]
  24. Parizek, R.R.; Siddiqui, S.H. Determining the sustained yields of wells in carbonate and fractured aquifers. Groundwater 1970, 8, 12–20. [Google Scholar] [CrossRef]
  25. Worthington, S.R.H. A comprehensive strategy for understanding flow in carbonate aquifers. In Karst Modeling, Proceedings of the Symposium, Charlottesville, VA, USA, 24–27 February 1999; Special Publication 5; Karst Waters Institute: Charlottesville, VA, USA, 1999; pp. 30–37. [Google Scholar]
  26. Parizek, R.R. Opportunities to enhance management of karstic aquifers. Environ. Geol. 2007, 51, 731–735. [Google Scholar] [CrossRef]
  27. Verbovšek, T.; Veselič, M. Factors influencing the hydraulic properties of wells in dolomite aquifers of Slovenia. Hydrogeol. J. 2008, 16, 779–795. [Google Scholar] [CrossRef]
  28. Valigi, D.; Cambi, C.; Checcucci, R.; Di Matteo, L. Transmissivity Estimates by Specific Capacity Data of Some Fractured Italian Carbonate Aquifers. Water 2021, 13, 1374. [Google Scholar] [CrossRef]
  29. Istituto Superiore per la Protezione e la Ricerca Ambientale (ISPRA). Carta Geologica d’Italia Alla Scala 1:50.000. Available online: https://www.isprambiente.gov.it/Media/carg/ (accessed on 1 July 2024).
  30. Celico, P. Schema idrogeologico dell’Appennino carbonatico centro-meridionale. Mem. Note Ist. Geol. Appl. 1978, 14, 1–97. [Google Scholar]
  31. Celico, P. Idrogeologia dei massicci carbonatici, delle piane quaternarie e delle aree vulcaniche dell’Italia centro-meridionale (Marche e Lazio meridionale, Abruzzo, Molise e Campania). In Quaderni della Cassa per il Mezzogiorno: 4/2; Fund for the South: Roma, Italy, 1983. [Google Scholar]
  32. Allocca, V.; Celico, F.; Celico, P.; De Vita, P.; Fabbrocino, S.; Mattia, C.; Monacelli, G.; Musilli, I.; Piscopo, V.; Scalise, A.R.; et al. Carta Idrogeologica dell’Italia Meridionale; Istituto Poligrafico e Zecca dello Stato: Roma, Italy, 2006. [Google Scholar]
  33. Celico, P.; Civita, M.; Corniello, A. Idrogeologia del margine nord-orientale della conca campana (massicci dei Tifatini e del M. Maggiore). Mem. Note Ist. Geol. Appl. 1977, 13, 1–14. [Google Scholar]
  34. Piscopo, V. Confronto tra rilievi di superficie della fratturazione e risposta idrodinamica dell’acquifero carbonatico di Monte Maggiore (Campania). Geol. Appl. Idrogeol. 1997, 32, 53–71. [Google Scholar]
  35. Corniello, A.; Ducci, D.; Stellato, L.; Stevenazzi, S.; Massaro, L.; Del Gaudio, E. Combining groundwater budget, hydrochemistry and environmental isotopes to identify the groundwater flow in carbonate aquifers located in Campania Region (Southern Italy). J. Hydrol. Reg. Stud. 2024, 53, 101790. [Google Scholar] [CrossRef]
  36. Celico, P.; Corniello, A. Idrodinamica, potenzialità e possibilità di sfruttamento delle risorse idriche sotterranee dei Monti Lattari (Campania). Mem. Note Ist. Geol. Appl. 1979, 15, 1–28. [Google Scholar]
  37. Piscopo, V.; Fusco, C.; Lamberti, A. Idrogeologia dei Monti Lattari (Campania). Quad. Geol. Appl. 1994, 2, 359–366. [Google Scholar]
  38. Celico, P.; Pelella, L.; Stanzione, D.; Aquino, S. Sull’idrogeologia e l’idrogeochimica dei Monti Alburni (SA). Geol. Romana 1994, 30, 687–698. [Google Scholar]
  39. Santangelo, N.; Santo, A. Endokarst processes in the Alburni massif (Campania, Southern Italy): Evolution of ponors and hydrogeological implications. Z. Für Geomorphol. 1997, 41, 229–247. [Google Scholar] [CrossRef]
  40. Cafaro, S.; Gueguen, E.; Parise, M.; Schiattarella, M. Morphometric analysis of karst features of the Alburni Mts, Southern Apennines, Italy. Geogr. Fis. Dinam. Quat. 2016, 39, 121–128. [Google Scholar]
  41. Bolognini, M.; Celico, P.; Tescione, M.; Aquino, S. La produttività dei pozzi in acquiferi carbonatici molto carsificati: L’esempio dei Monti Alburni (SA). Geol. Romana 1994, 30, 672–685. [Google Scholar]
  42. Lotti, F.; Baiocchi, A.; D’Onofrio, S.; Piscopo, V. Hydrogeological site characterization of marly-silici-calcareous rocks through surveys of discontinuities and pumping tests. Acque Sotter. Ital. J. Groundw. 2012, 1, 27–36. [Google Scholar] [CrossRef]
  43. Ehlig-Economides, C.; Hegeman, P.; Clark, G. Three key elements necessary for successful testing. Oil Gas J. 1994, 92, 30. [Google Scholar]
  44. Bourdet, D. Well Test Analysis, 1st ed.; Elsevier Science: Amsterdam, The Netherlands, 2002; p. 426. [Google Scholar]
  45. Renard, P.; Glenz, D.; Mejias, M. Understanding diagnostic plots for well-test interpretation. Hydrogeol. J. 2009, 17, 589–600. [Google Scholar] [CrossRef]
  46. Ferroud, A.; Rafini, S.; Chesnaux, R. Using flow dimension sequences to interpret non-uniform aquifers with constant-rate pumping-tests: A review. J. Hydrol. X 2019, 2, 100003. [Google Scholar] [CrossRef]
  47. Birsoy, Y.K.; Summers, W.K. Determination of aquifer parameters from step tests and intermittent pumping data. Groundwater 1980, 18, 137–146. [Google Scholar] [CrossRef]
  48. Waterloo Hydrogeologic, Inc. User Manual, Aquifer Test Pro 13.0. Pumping & Slug Test Analysis, Interpretation & Visualization Software; Waterloo Hydrogeologic: Kitchner, ON, Canada, 2023; pp. 1–541. [Google Scholar]
  49. Kruseman, G.P.; de Ridder, N.A. Analysis and Evaluation of Pumping Test Data, 2nd ed.; ILRI Publication; International Institute for Land Reclamation and Improvement: Wageningen, The Netherlands, 1994; pp. 1–372. [Google Scholar]
  50. El-Naqa, A. Estimation of transmissivity from specific capacity data in fractured carbonate rock aquifer, central Jordan. Environ. Geol. 1994, 23, 73–80. [Google Scholar] [CrossRef]
  51. Mace, R.E. Determination of transmissivity from specific capacity tests in a karst aquifer. Groundwater 1997, 35, 738–742. [Google Scholar] [CrossRef]
  52. Fabbri, P. Transmissivity in the geothermal Euganean Basin; a geostatistical analysis. Groundwater 1997, 35, 881–887. [Google Scholar] [CrossRef]
  53. Kalf, F.R.; Wooley, D.R. Applicability and methodology of determining sustainable yield in groundwater systems. Hydrogeol. J. 2005, 13, 295–312. [Google Scholar] [CrossRef]
  54. Zhou, Y. A critical review of groundwater budget myth, safe yield and sustainability. J. Hydrol. 2009, 370, 207–213. [Google Scholar] [CrossRef]
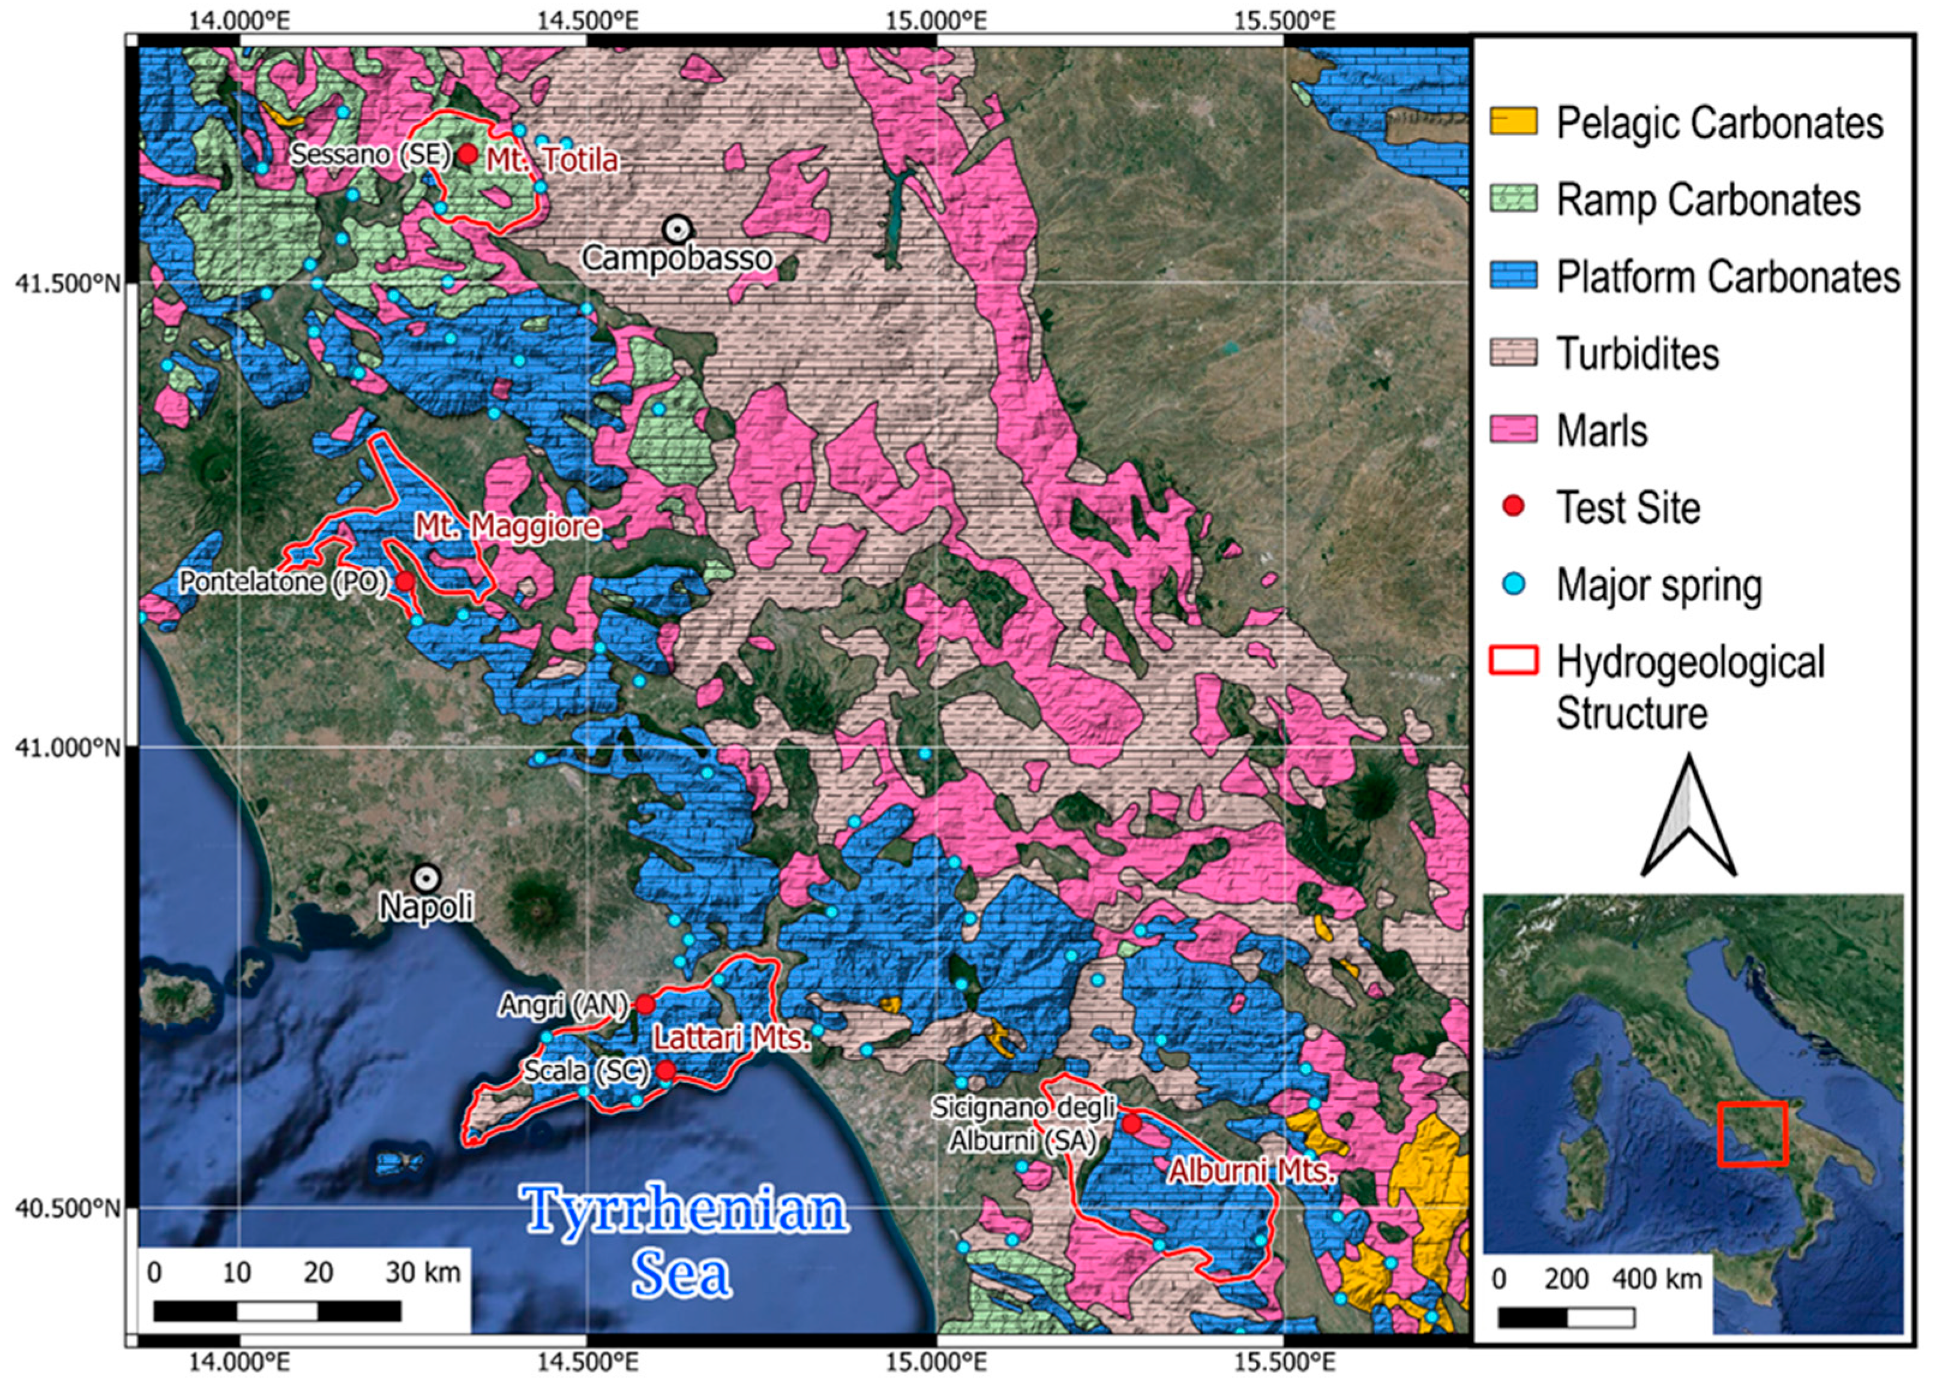
Figure 1. Location map of the study sites.
Water 16 02664 g001
Figure 2. SE test site: semi-log plot of drawdown–time in the pumping well and 14 observation wells during the constant flow rate test (44 L/s).
Water 16 02664 g002
Figure 3. SE test site: bi-log plot of the drawdown and derivative in observation wells (a) and in the pumping well (b) during the constant flow rate test (44 L/s).
Water 16 02664 g003
Figure 4. SE test site: semi-log plot of drawdown–time in the pumping well for different flow rates (21.4, 29.3, and 44 L/s).
Water 16 02664 g004
Figure 5. PO test site: example of the drawdown trend during the variable discharge test (well PO16).
Water 16 02664 g005
Figure 6. PO test site: bi-log plots of the drawdown and derivative in some pumping wells.
Water 16 02664 g006
Figure 7. AN test site: drawdown trend during the variable discharge test in well AN2 and the observation well.
Water 16 02664 g007
Figure 8. AN test site: bi-log plot of the specific drawdown (sn/Qn)–adjusted time (βtn) and derivative in the AN2 pumping well and observation well (AN2 OW).
Water 16 02664 g008
Figure 9. SC test site: drawdown trend during testing in the well.
Water 16 02664 g009
Figure 10. SC test site: bi-log plots of the drawdown and derivative in the well for the three tests.
Water 16 02664 g010
Figure 11. SA test site: example of the drawdown trend during the variable discharge test (well SA6).
Water 16 02664 g011
Figure 12. SA1 test site: bi-log plot of the specific drawdown (sn/Qn)–adjusted time (βtn) and derivative in the SA well.
Water 16 02664 g012
Figure 13. SA test site: the drawdown trend during the variable discharge tests in the SA1a well.
Water 16 02664 g013
Figure 14. SA test site: bi-log plots of the drawdown and derivative of the two tests on the SA1a well (first discharge step).
Water 16 02664 g014
Figure 15. Range of parameters Qs, T, and T/Hs determined by the data from the 35 pumping tests.
Water 16 02664 g015
Figure 16. Relationship between specific capacity (Qs) and transmissivity (T) values obtained from the data measured for the pumping well.
Water 16 02664 g016
Table 1. Geological and hydrogeological context of the pumping test site.
Test SiteGeology of Test Site (from [29])Hydrogeological Context of Test Site
Sessano (SE)The wells intercept calcarenites and calcirudites in alternating thin to medium and thick beds; locally, marls, marly clays, and breccias are intercalated (Mount Calvello formation, Campanian-Maastrichtian). The sedimentary environment is interpreted as an outer slope and/or proximal basin. The carbonate rocks show extensive fracturing due to strike slip and extensional structures, trending NW–SE and N–S.The site belongs to a carbonate aquifer with an AGY of about 9 L/s per km2, bordered largely by poorly permeable terrigenous deposits (Mount Totila hydrostructure). Alternating fractured and sometimes karstified calcareous rocks, alongside less fractured marly and silico-calcareous rocks, lead to compartmentalized groundwater circulation, both vertically and horizontally. Groundwater discharges towards several springs at high elevation and at the base of the relief (with a flow rate not exceeding 0.3 m3/s); in addition, flows from the carbonate aquifer to surrounding alluvial aquifers occur [30,31,32].
Pontelatone (PO)A first group of wells intersects calcirudites in the beds and banks of an open-shelf environment (Senonian–Cenomanian section of the Camposauro Succession). A second group of wells intersects thinly bedded calcarenites and calcilutites, alternating with limestones and dolomitic limestones of an inner shelf environment (Upper Jurassic–Upper Albian section of the Camposauro Succession). The entire carbonate sequence forms a monoclinal structure displaced by high-angle normal faults that bring the two sections of the succession into contact.The site belongs to a large carbonate aquifer with an AGY of about 24 L/s per km2 (Mount Maggiore hydrostructure). High-permeability, fractured, and karstified limestone and dolomite rocks give rise to a basal groundwater circulation that discharges mainly towards a spring group at the base of the relief (with a flow rate of about 3.9 m3/s). The carbonate aquifer also exchanges groundwater with the plains surrounding the relief [30,31,32,33]. The pumping tests examined in this work refer to a well field drilled upstream of a basal spring group [34]. The well field captures about 1.5 m3/s, causing a reduction in the basal springs discharge [35].
Angri (AN) and Scala (SC)The two sites belong to the same tectonic unit. In the AN site, the wells intercept alternating limestones and dolomitic limestones with interbedded dolostones of a platform environment (Limestones with radiolitidae formation, Upper Aptian–Santonian). Carbonate rocks constitute a monoclinal structure tilted by normal and strike-slip faults trending NW–SE, NE–SW, and N–S. In the SC site, the well intersects limestone and dolomitic limestones with crystalline dolostone and marls, referring to open carbonate shelf passing to lagoonal environment (Oolotic and oncolytic limestones formation, Toarcian–Callovian). Here, the carbonate ridge is impacted by both transcurrent and normal faults, creating horst and graben structures.The sites pertain to a carbonate aquifer with an AGY of approximately 20 L/s per km2 (Lattari Mountains hydrostructure), consisting of fractured and karstified limestones, dolomitic limestones, and dolostones. The basal groundwater circulation is compartmentalized into multiple monoclinal sub-structures displaced by faults; also, vertical compartmentalization within the aquifer exists due to the stratigraphy and structural setting of the carbonate ridge. Groundwater of the hydrostructure discharges into a basal spring group and sub-marine springs (total about 1.9 m3/s), feeds streams intersecting the relief, and sustains high-altitude springs. Groundwater flows (approximately 1 m3/s) also occur towards the surrounding plain aquifers [30,31,32,36,37].
Sicignano degli Alburni (SA)The wells intersect massive limestones interbedded with micritic and marly limestones, ascribable to the outer open platform (Bio-lithoclastic limestones with rudists formation, Upper Cenomanian–Paleocene?). Carbonate rocks are extremely fractured and are influenced by high-angle normal faults, mainly trending NW–SE, NE–SW, and N–S.The site is located on the edge of a large karst aquifer with an AGY of approximately 30 L/s per km2 (Alburni Mountains hydrostructure). The tectonic setting creates a series of interconnected groundwater reservoirs that, when combined with an extensive network of karst conduits, fosters a highly complex groundwater circulation system. Groundwater primarily discharges into the springs located at the base of the massif (approximately 3.6 m3/s) and increases the streamflow by approximately 4.0 m3/s. Groundwater exchanges also occur with the surrounding plains aquifers [30,31,32,38,39,40].
Table 2. Data and results of pumping tests.
SiteTestD
(m)
AqDwl
(m)
Hs
(m)
TTQ
(L/s)
t
(h)
ΔHs
(%)
Qs
(m2/s)
T
(m2/s)
t′/t
(−)
SE1-I40FML1030Con4451.3512.8 × 10−32.6 × 10−41.4
1-II40FML1030Step6.4–29.3522.5–248.4–4.1 × 10−37.6 × 10−4>1.0
PO1115FL5164Step52–835.52–53.4–2.4 × 10−22.5 × 10−20.36
2117FL5067Step30–805.10.3–0.71.6–1.5 × 10−11.7 × 10−10.29
3115FL5362Step30–10019.90.2–0.46.1–4.3 × 10−19.9 × 10−10.22
4115FL4867Step50–12022.20.2–0.44.8–4.2 × 10−16.6 × 10−10.09
5133FL4390Step63–1508.52–74.0–2.4 × 10−24.3 × 10−20.23
6127FL4186Step47–11193–171.6–0.7 × 10−21.1 × 10−20.33
7121FL-M4477Step63–15091–48.2–4.9 × 10−26.1 × 10−20.24
8118FL4458Step54–1429.52–104.8–2.5 × 10−27.1 × 10−20.30
9105FL4362Step48–111122–133.9–1.4 × 10−24.3 × 10−20.15
10110FL4268Step59–16090.2–0.64.9–3.8 × 10−14.0 × 10−10.09
1190FCL4338Step45–156101–91.1–0.4 × 10−11.4 × 10−10.21
12133FL4569Step63–16090.6–21.5–1.0 × 10−11.6 × 10−10.15
13110FL4862Step41–15390.3–22.3–1.2 × 10−13.8 × 10−10.09
14133FL4984Step37–1259.30.5–38.0–4.7 × 10−28.8 × 10−20.21
15124FL4762Step37–11710.70.8–37.6–6.2 × 10−26.7 × 10−2n.a.
16115FL4735Step50–110209–241.6–1.3 × 10−21.8 × 10−20.17
17122FL4652Step50–13090.7–41.3–0.6 × 10−12.5 × 10−10.20
18115FKL4744Step53–156100.8–61.4–0.6 × 10−11.7 × 10−10.50
19122FL-M4947Step41–11292–85.4–3.0 × 10−25.2 × 10−20.18
20122FCL (br)5066Step46–112101–57.2–2.9 × 10−27.8 × 10−20.20
AN1113FL5955Step10–1502030.2–5.98.3–4.3 × 10−21.6 × 10−1n.a.
287FKL6423Step54–137175.50.1–0.72.2–0.9 × 10−11.6 × 10−1n.a.
SC1-I100FKLD8013Con3.48131.9 × 10−32.4 × 10−30.09
1-II100FKLD8013Con5.08211.8 × 10−32.3 × 10−30.08
1-III100FKLD8013Con6.48361.4 × 10−31.7 × 10−30.09
SA1113FL (ct)477Step35–47.66.134–521.3–1.2 × 10−37.9 × 10−4>0.08
2162FL4107Step34–4624.218–471.8–0.9 × 10−32.5 × 10−30.12
SA3150FL5104Step33–7454.113–472.4–1.5 × 10−32.9 × 10−30.03
6117FL11101Step35–7447.910–403.3–1.8 × 10−32.3 × 10−3n.a.
13155FL19121Step31–6446.114–511.8–1.0 × 10−31.3 × 10−30.02
1a-II59FKL (ct)653Step33.9–61.529.36–451.0–0.3 × 10−25.0 × 10−30.01
1a-III85FKL (ct)679Step48.8–8013.76–661.1–0.1 × 10−26.4 × 10−30.03
Notes: Site: test site (SE: Sessano, PO: Pontelatone, AN: Angri, SC: Scala, SA: Sicignano degli Alburni); D: depth; Aq: aquifer formation (FL: fractured limestone; FCL: fractured and tectonized limestone; FLM: fractured limestone and marly layers; FKL: fractured and karst limestone; FKLD: fractured and karst limestone and fractured dolomitic limestone; FML: fractured marly limestone; br: calcareous breccias; ct: cataclastic rock); Dwl: water level depth; Hs: saturated thickness intercepted by the well; TT: type of test (Step: variable discharge test; Con: constant discharge test); Q: min and max discharge or constant discharge tested; t: pumping time; ΔHs: percentage emptying of the water column in the well at the end of the test; Qs: specific capacity (min and max values for step-drawdown test); T: transmissivity (first discharge step for the step-drawdown test); t′/t: ratio of recovery time (drawdown recovery of at least 90%) to pumping time; n.a.: data not available.
Disclaimer/Publisher’s Note: The statements, opinions and data contained in all publications are solely those of the individual author(s) and contributor(s) and not of MDPI and/or the editor(s). MDPI and/or the editor(s) disclaim responsibility for any injury to people or property resulting from any ideas, methods, instructions or products referred to in the content.