Article

Short-Term Warming Induces Cyanobacterial Blooms and Antibiotic Resistance in Freshwater Lake, as Revealed by Metagenomics Analysis

1
Department of Civil and Environmental Engineering, University of Auckland, Auckland 1142, New Zealand
2
Water Research Centre, University of Auckland, Auckland 1142, New Zealand
*
Author to whom correspondence should be addressed.
Water 2024, 16(18), 2655; https://doi.org/10.3390/w16182655
Submission received: 26 July 2024 / Revised: 23 August 2024 / Accepted: 13 September 2024 / Published: 18 September 2024
(This article belongs to the Section Water and Climate Change)

Abstract

:
Climate change threatens freshwater ecosystems, potentially intensifying cyanobacterial blooms and antibiotic resistance. We investigated these risks in Cosseys Reservoir, New Zealand, using short-term warming simulations (22 °C, 24 °C, and 27 °C) with additional oxidative stress treatments. A metagenomic analysis revealed significant community shifts under warming. The cyanobacterial abundance increased from 6.11% to 20.53% at 24 °C, with Microcystaceae and Nostocaceae proliferating considerably. The microcystin synthesis gene (mcy) cluster showed a strong association with cyanobacterial abundance. Cyanobacteria exhibited enhanced nutrient acquisition (pstS gene) and an upregulated nitrogen metabolism under warming. Concurrently, antibiotic resistance genes (ARGs) increased, particularly multidrug resistance genes (50.82% of total ARGs). A co-association network analysis identified the key antibiotic-resistant bacteria (e.g., Streptococcus pneumoniae and Acinetobacter baylyi) and ARGs (e.g., acrB, MexK, rpoB2, and bacA) central to resistance dissemination under warming conditions. Oxidative stress exacerbated both cyanobacterial growth and ARGs’ proliferation, especially efflux pump genes (e.g., acrB, adeJ, ceoB, emrB, MexK, and muxB). This study demonstrated that even modest warming (2–5 °C) could promote both toxic cyanobacteria and antibiotic resistance. These findings underscore the synergistic effects of temperature and oxidative stress posed by climate change on water quality and public health, emphasizing the need for targeted management strategies in freshwater ecosystems. Future research should focus on long-term impacts and potential mitigation measures.

Graphical Abstract

1. Introduction

Climate change poses an unprecedented threat to life on Earth, with far-reaching consequences for ecosystems, biodiversity, and human well-being [1,2]. Climate warming has resulted in raising the average global temperature and more frequent high-temperature extremes. According to the sixth assessment report of the Intergovernmental Panel on Climate Change (IPCC), published in 2021, greenhouse gas emissions from anthropogenic activities have already warmed the climate by nearly 1.1 °C since 1850–1900 [3]. The global average temperature is expected to reach or exceed a 1.5 °C increase within the next few decades [4]. These changes will affect all regions of the Earth, including freshwater ecosystems, which provide vital services for aquatic life and human activities such as drinking water, food, and recreation [5]. Rising water temperatures are expected to cause a decrease in water quality, promoting eutrophication and the growth of algae, further exacerbating the problem of water scarcity [6]. Moreover, warming conditions facilitate the formation of toxins, the proliferation of antibacterial resistance genes (ARGs) [7,8] and waterborne pathogens, and an increase in the intensity and duration of algal and cyanobacterial blooms [9]. Furthermore, both toxic cyanobacterial blooms and ARGs in freshwater are critical concerns for human health and well-being [10].
Cyanobacteria, among the oldest known photosynthetic organisms, first appeared on our planet roughly 3.5 billion years ago [11,12]. The abundant growth of toxin-forming cyanobacteria in freshwater lakes, estuarine, and coastal ecosystems due to the enrichment of certain inorganic and/or organic nutrients (nitrogen and phosphorus) has created serious concern worldwide [13,14,15,16,17,18]. Studies have shown that nutrient over-enrichment in freshwater environments across three major European climate zones (Mediterranean, continental, and Atlantic) favours the growth of toxin-producing cyanobacteria [19]. Moreover, rising CO2 levels may result in a marked intensification of phytoplankton blooms in eutrophic and hypertrophic waters [20]. Cyanobacteria play a key role in ecosystems as primary producers and generate various secondary metabolites, including harmful substances known as cyanotoxins [15]. Some common cyanotoxins and cyanobacterial producers include microcystins (e.g., Anabaena, Arthrospira, Limnothrix, Microcystis, Nostoc, Oscillatoria (Planktothrix), and Synechocystis), nodularins (Nodularia) and saxitoxins (e.g., Anabaena, Aphanizomenon, Planktothrix, Raphidiopsis, and Scytonema) [21]. Cyanotoxins can poison aquatic organisms, wildlife, pets, and humans through the direct consumption of toxic cyanobacteria or ingestion of contaminated water [22]. However, cyanotoxins may serve as a chemical defence, helping cyanobacteria to outcompete other microorganisms and deter predators [23,24,25]. Recent studies have shown that metagenomics-based approaches hold great promise in identifying potential cyanotoxin-producing genera, such as Microcystis, Planktothrix, Synechococcus, Cyanobium, Dolichospermum, Nodularia, Cylindrospermum, and Oscillatoria, among others, in large rivers of the United States [26]. Moreover, cyanobacteria have developed a defence mechanism against both temperature stress and oxidative stress, including reactive oxygen species (ROSs), which might enable them to thrive in warming conditions [27,28]. As the emergence of a cyanobacterial bloom is the consequence of several coherent effects, including climate warming, nutrients, CO2 levels, and the ability to mitigate oxidative stress, the impact of rising temperatures alone on these processes is poorly understood. In addition to cyanobacterial blooms, previous reports have indicated that climate warming could increase the threat of ARGs to environmental and human health [29]. A metagenomics analysis of controlled-temperature experiments revealed that an increased temperature could remarkably reduce ARGs’ diversity but increase ARGs’ abundance, specifically for multidrug, tetracycline, and peptide resistance genes [30]. Moreover, ARGs (tetM, mecA, bacA, vatE, and tetW) significantly increased with an elevated water temperature, along with opportunistic pathogens like Delftia, Legionella, and Pseudomonas, implying that antibiotic resistance is a growing concern in a warming climate [30]. As temperature stress has been linked to ROS stress [31,32,33], the emergence of ARGs under warming temperatures could also be associated with ROS stress [34,35]. We propose that elevated temperatures due to climate warming induce oxidative stress in aquatic microbial communities, leading to the proliferation of stress-tolerant, toxin-producing cyanobacteria and an increased prevalence of ARGs. This occurs through both direct temperature stress on the microbiome and indirect effects via increased ROS. Cyanobacteria, being tolerant to both temperature and ROS stress, thrive under these conditions, while ROS stress simultaneously promotes the spread of ARGs. Thus, climate warming acts as a dual threat, fostering both cyanobacterial blooms and antibiotic resistance in aquatic ecosystems.
In this study, we investigate impact of short-term temperature stress on microbes and the subsequent proliferation of stress-tolerant, toxin-producing cyanobacteria and ARGs in Cosseys Reservoir, a crucial drinking water source in Auckland, New Zealand. By subjecting the lake’s microbial community to different temperature-warming scenarios, simulating base (22 °C), normal (24 °C), and future (27 °C) water temperatures, we aim to uncover the basis of the temperature-induced proliferation of cyanobacteria and ARGs in freshwater lakes. Additionally, we perform explicit ROS addition to the temperature experiments to assess if oxidative stress can impact the microbial community in a manner similar to increased temperature stress. Using metagenomics analysis, our findings shed light on the potential impact of simulated short-term warming on freshwater ecosystems, particularly their susceptibility to cyanobacterial blooms and antibiotic resistance in the foreseeable future.

2. Materials and Methods

2.1. Batch Reactor Experiments with Different Temperatures and ROS Levels

To investigate the proliferation of cyanobacterial blooms and ARGs under short-term temperature-warming scenarios, batch reactor experiments were conducted using water samples from Cosseys Reservoir, Auckland, New Zealand. Three separate bioreactors with an effective volume of 1 L were used, each set to a different temperature condition. The baseline condition was maintained at 22 °C throughout, serving as a control for temperature effects. The normal condition started at 22 °C and was then raised to 24 °C, representing a shift from the median temperature to the upper quartile + 1 °C, simulating a typical high-temperature day. The future condition also began at 22 °C, but was raised to 27 °C, representing the maximum recorded temperature + 3 °C, to simulate an extreme high-temperature scenario reflective of potential future conditions. This experimental design allowed for the observation of microbial community responses, particularly those of cyanobacteria and ARGs, to both current temperature fluctuations and projected warming scenarios. All experiments were conducted over 48 h, with the systems being maintained for the first 24 h to allow for the acclimatization of the microbial communities to the ambient temperature (22 °C), then raised to their respective experimental temperatures for the remaining 24 h. The bioreactors were operated under ambient laboratory lighting conditions, following a natural day–night cycle. No additional aeration was provided. Continuous gentle mixing was maintained using magnetic stirrers set to 50 rpm throughout the experiment. To assess the impact of ROS, an exogenous addition of 75 µmol H2O2 was performed for two conditions: BaseH2O2 (baseline condition with added H2O2) and NormalH2O2 (normal condition with added H2O2). The purpose of these ROS-added controls was to compare whether ROS stress could mimic the effects of temperature stress on microbial systems.

2.2. Chemical Analysis

Nitrite (NO2-N) and nitrate (NO3-N) concentrations were determined by ion chromatography (Thermo Fisher Ion Chromaatetography ICS2100/Dionex AS-DV, Sunnyvale, CA, USA). The total organic carbon (TOC) was measured by a TOC analyser (Shimadzu TOC-L CSH, Shimadzu Corporation, Suzhou, China). The three-dimensional excitation–emission matrix (3D-EEM) analysis method was used for the determination of fluorescent organic substances in the samples by an Aqualog A-TEEM Spectrometer (Horiba Instruments Inc., Piscataway, NJ, USA). Excitation wavelengths were set from 240 to 600 nm at interval of 3 nm; emission wavelengths were set from 212.70 to 622.21 nm at interval of 3.28 nm. The fluorescence from 3D-EEM was modelled using PARAFAC by staRdom v1.1.25 [36]. The properties of the fluorescent components were identified using the OpenFluor database [37].

2.3. DNA Extraction and Metagenomics Analysis

Samples of 100 mL were collected from reactors under different experimental conditions for DNA extraction. The extraction followed the protocol provided by the Qiagen® DNeasy PowerWater Kit (Qiagen, Hilden, Germany), and the resultant DNA was preserved at -20°C for further analysis. The DNA samples were then sent off to the Auckland Genomics Centre (Auckland, New Zealand) to conduct a metagenomic analysis. Because of the low concentration of the DNA samples, a SpeedVac (Thermo Fisher Scientific, Waltham, MA, USA) was used to concentrate the gDNA. A low-input (<100 ng) protocol was then used to prepare libraries from 10 to 20 ng of the total DNA. These libraries were made with the NEBNext® Ultra™ II DNA Library Prep Kit for Illumina® (E7645S) (New England Biolabs, Ipswich, MA, USA) with unique dual indexes (cat no. E7600). Amplification of the adapter-ligated DNA was performed via 9 cycles of PCR. Post library QC, normalization was carried out, followed by a final pool check using a bioanalyzer (Agilent Technologies, Palo Alto, CA, USA). The shotgun whole-genome sequencing was carried out on a HiSeqX platform (Illumina, San Diego, CA, USA) using 2 × 150 bp paired-end sequencing. The raw metagenome samples from these experiments can be accessed in the European Nucleotide Archive under the BioProject accession number PRJEB79256.

2.4. Bioinformatics Analysis

We performed preprocessing steps to eliminate low-quality sequences using Trimmomatic v0.39 [38] with specific quality thresholds as follows: LEADING:3, TRAILING:3, SLIDINGWINDOW:10:15, and MINLEN:50 with the following settings: TruSeq3-PE-2.fa:2:30:10:2:keepBothReads [39]. For metagenomic taxonomic and functional profiling, we employed the SqueezeMeta v1.5.2 pipeline [40]. The read statistics per sample are provided in Table S1. Co-assembly was performed using Megahit v1.2.9 [41], and short contigs (<200 bps) were filtered out using prinseq v0.20.4 [42]. Within the SqueezeMeta pipeline, the Barrnap v0.9 [43] tool was used for predicting RNAs, while Prodigal v2.6.3 [44] was utilized for predicting ORFs. Taxonomic ranks were assigned against the NCBI GenBank nr database [45] with identify thresholds of 85, 60, 55, 50, 46, 42, and 40% for the species, genus, family, order, class, phylum, and superkingdom ranks, respectively [46]. Kyoto Encyclopaedia of Genes and Genomes [47] was used for functional assignments with Diamond v2.0.14 [48] with a maximum e-value threshold of 1 × 10⁻³ and a sequence identify threshold of 50%. Moreover, the Comprehensive Antibiotic Resistance Database [49] release 3.2.4 was used for annotating the ARGs and identifying the ARBs in the metagenomics data. The ARGs were annotated based on a sequence identify of 70% and e-value threshold of 1 × 10⁻³. ARGs conferring resistance to more than one antibiotic were classified as ‘multidrug resistant’ (MDR). Furthermore, classified species were cross-referenced with the known pathogens in the CARD database to identify the ARBs in the metagenome. Bowtie2 v2.3.4.1 [50] was used for read mapping against the contigs. Both functional genes and ARGs were normalized to transcripts per million (TPM). The metagenomics data were analysed using the SQMtools R package v1.6.3 [51].

2.5. Statistical Analysis and Visualization

The co-association networks between the cyanobacteria and other taxa and (ARGs and ARBs) were constructed using the Sparse Correlations for Compositional data (SparCC) [52] correlation method (Rho > 0.6 and p < 0.05) in the NetCoMi v1.1.0 R package [53]. The co-association networks were visualized with Gephi [54] version 1.10.1 using the Frucherman Reingold algorithm. Heatmaps were plotted to visualize changes in the abundances of cyanobacterial families and ARBs, utilizing a z-score with TBtools v2.007 [55]. A fold change analysis of pathways was performed using the Pathview v1.44.0 R package [56]. A correlation analysis between ARGs and ROS stress response genes was conducted using OmicStudio v1.41.0 [57]. Graphics were generated using the ggplot2 v3.5.1 [58] package in R [59] version 4.2.1.

3. Results and Discussion

3.1. Nutrient Dynamics and DOM Analysis under Different Temperature and Oxidative Stress Conditions

To investigate the impacts of rising temperatures and oxidative stress on freshwater microbial communities, we subjected the microbiome of Cosseys Reservoir to three temperature scenarios: base (22 °C), normal (24 °C), and future (27 °C). Additionally, we explicitly introduced ROS (H2O2) to the base and normal treatments to evaluate the combined effects of temperature and oxidative stress. While nutrient levels remained relatively low throughout the experiment, we observed temperature-dependent changes in organic matter composition and processing. Nitrate and nitrite levels were consistently low across all conditions (Figure S1). The initial nitrate concentration was 0.4468 mg/L, with slight variations observed under different treatments. Notably, the addition of H2O2 in the BaseH2O2 and NormalH2O2 conditions caused more pronounced fluctuations in the nitrate levels, suggesting that oxidative stress may influence nitrogen cycling even at low concentrations. The nitrite levels remained below the detection limit throughout the experiment. The total organic carbon (TOC) levels showed more distinct temperature-dependent trends (Figure S2). In the baseline condition, the TOC decreased from 70 mg/L to 45 mg/L over 24 h. The addition of H2O2 (BaseH2O2) accelerated the organic carbon utilization. The normal and future temperature conditions exhibited similar gradual TOC decreases, suggesting that higher temperatures enhance microbial organic matter degradation, even in low-nutrient environments.
The 3D excitation–emission matrix (3D-EM) fluorescence spectroscopy analysis revealed temperature-induced shifts in the composition of fluorescent DOM (Figure S3). As temperatures increased, we observed a trend towards more humic-like substances, particularly under oxidative stress conditions. The Parallel Factor Analysis (PARAFAC) model identified five components as follows: C1 (humic-like terrestrial), C2 (humic-like microbial-derived), C3 (humic-like), C4 (protein-like or tryptophan-like microbial-produced), and C5 (uncharacterized) (Table S2). Higher proportions of humic-like substances were observed in oxidative stress conditions, indicating an enhanced transformation of DOM towards more recalcitrant forms under elevated temperatures and ROS exposure.
These findings demonstrate that, even in low-nutrient conditions, temperature plays a crucial role in shaping the organic matter dynamics in freshwater ecosystems. The observed changes in the TOC levels and DOM composition suggest that rising temperatures accelerate the microbial processing of organic matter. Furthermore, the synergistic effects of temperature and oxidative stress on DOM transformation highlight the complex interplay between environmental factors and microbial activity.

3.2. Temperature Warming and Oxidative Stress Restructure Microbial Communities and Promote Cyanobacterial Proliferation

The initial microbial community (T0) was diverse, dominated by Proteobacteria (35.45%), Actinobacteria (10.28%), and Bacteroidetes (8.46%) (Figure 1a). Under baseline conditions (22 °C), Proteobacteria increased significantly to 63.05%, while Actinobacteria and Bacteroidetes remained relatively stable. The addition of ROS at 22 °C (BaseH2O2) caused a marked decrease in Proteobacteria (36.42%) similar to T0, and increases in Actinobacteria (18.46%) and Bacteroidetes (12.48%), suggesting that oxidative stress altered community structure. At the normal temperature (24 °C), Proteobacteria decreased (30.88%), while Actinobacteria (14.81%) and Bacteroidetes (11.94%) showed slight increases compared to the base temperature. However, the addition of ROS at 24 °C (NormalH2O2) increased Proteobacteria (57.49%), indicating a strong response to the combined temperature and ROS stressors. Under the future temperature scenario (27 °C), Proteobacteria (40.91%), Actinobacteria (17.07%), and Bacteroidetes (12.65%) were substantially present, highlighting significant community restructuring. These shifts in the microbial community structure align with the observed changes in organic matter processing, particularly the accelerated degradation of TOC and transformation of DOM under higher temperatures and oxidative stress conditions. Additionally, the initial cyanobacterial abundance was 6.11% (T0). At 22 °C, it decreased slightly to 1.89%, but the addition of ROS (BaseH2O2) increased it to 13.39%, demonstrating the potential for oxidative stress to promote cyanobacterial growth. At 24 °C, the cyanobacterial abundance surged to 20.53%, indicating their sensitivity to temperature increases. The addition of ROS at 24 °C (NormalH2O2) decreased this cyanobacterial abundance to 7.86%, suggesting a complex combined effect of temperature and oxidative stress. Under the future temperature scenario (27 °C), the cyanobacterial abundance reached 10.66%, significantly higher than that at baseline but lower than in the normal condition. Notably, Bacteroidetes, Actinobacteria, and Proteobacteria have been previously reported to be associated with cyanobacterial blooms in freshwater ponds [60]. These findings suggest that rising temperatures alone can reshape freshwater microbial communities, promoting cyanobacterial proliferation during warmer climates. Previous short-term heat stress (29 °C to 35 °C) experiments also revealed shift in coral-associated marine microbial communities [61]. Moreover, these findings align with previous studies identifying temperature as a key factor in cyanobacterial growth [62,63]. Notably, the cyanobacterial abundances observed in the BaseH2O2 condition were similar to those in the normal condition, and the NormalH2O2 treatment was similar to the future temperature condition, implying that ROS stress could mimic the effects of temperature stress on cyanobacterial proliferation. These findings demonstrate that short-term temperature stress, exacerbated by oxidative stress, can significantly restructure freshwater microbial communities and promote the proliferation of cyanobacteria, increasing the risk of cyanobacterial blooms.
Furthermore, we constructed a co-association network between cyanobacteria and other phyla to understand the complex communication dynamics within the Cosseys Reservoir microbial community influencing cyanobacterial blooms under increasing temperature conditions (Figure 1b, Table S3). The network analysis revealed intricate competitive and cooperative interactions involving cyanobacteria with 24 other taxa, out of which 19 belonged to the poorly characterized Candidate phylum. Cyanobacteria exhibited direct negative associations with nine taxa, including Calditrichaeota, Candidatus Dormibacteraeota, Candidatus Daviesbacteria, Candidatus Blackburnbacteria, Candidatus Kaiserbacteria, Candidatus Microgenomates, Candidatus Aminicenantes, Candidatus Omnitrophica, Candidatus Hydrogenedentes, Firmicutes, Candidatus Ozemobacteria, Candidatus Doudnabacteria, Candidatus Gracilibacteria, and Candidatus Sumerlaeota, suggesting potential competition for resources. Notably, Calditrichaeota, with the most negative association (Rho = −0.851), is a chemoorganoheterotrophic phylum found in marine sediment [64]. Interestingly, genomic islands of Caldithrix abyssi, belonging to the novel bacterial phylum Calditrichaeota, showed compositional and sequence similarities to genomic islands in cyanobacteria such as Cyanothece, Anabaena, Nostoc, and Spirosoma [65]. Moreover, Firmicutes (Rho = −0.687) are involved in the decomposition and fermentation of organic matter in sediments, and a reduction in their abundance has been observed during cyanobacterial blooms [60]. These lowly abundant phyla have highly competitive relationships, likely influencing cyanobacterial population dynamics through resource competition. In contrast, cyanobacteria showed positive associations with ten taxa, including seven Candiate phyla (Candidatus Berkelbacteria, Candidatus Falkowbacteria, Candidatus Levybacteria, Candidatus Margulisbacteria, Candidatus Marinimicrobia, Candidatus Nealsonbacteria, and Candidatus Yanofskybacteria), Nitrospirae, Streptomyces sp., and Fusobacteria, indicating potential cooperative interactions. This positive correlation suggests mutualistic relationships, such as nutrient exchange or metabolic support, underscoring the coexistence and mutualistic interactions within the community. These findings highlight the multifaceted nature of microbial interactions and their pivotal role in shaping cyanobacterial bloom dynamics in response to environmental changes like climate warming. While cyanobacteria face significant biotic pressure from competitive taxa, cooperative interactions with taxa like Fusobacteria, Nitrospirae, and a few Candidate phyla may enhance their resilience and adaptability. Understanding these complex relationships is crucial for predicting microbial community responses to future environmental changes and developing strategies for managing and mitigating the impacts of harmful cyanobacterial blooms on ecosystem health.

3.3. Proliferation of Toxin-Producing Cyanobacterial Families and Functional Adaptations under Warming

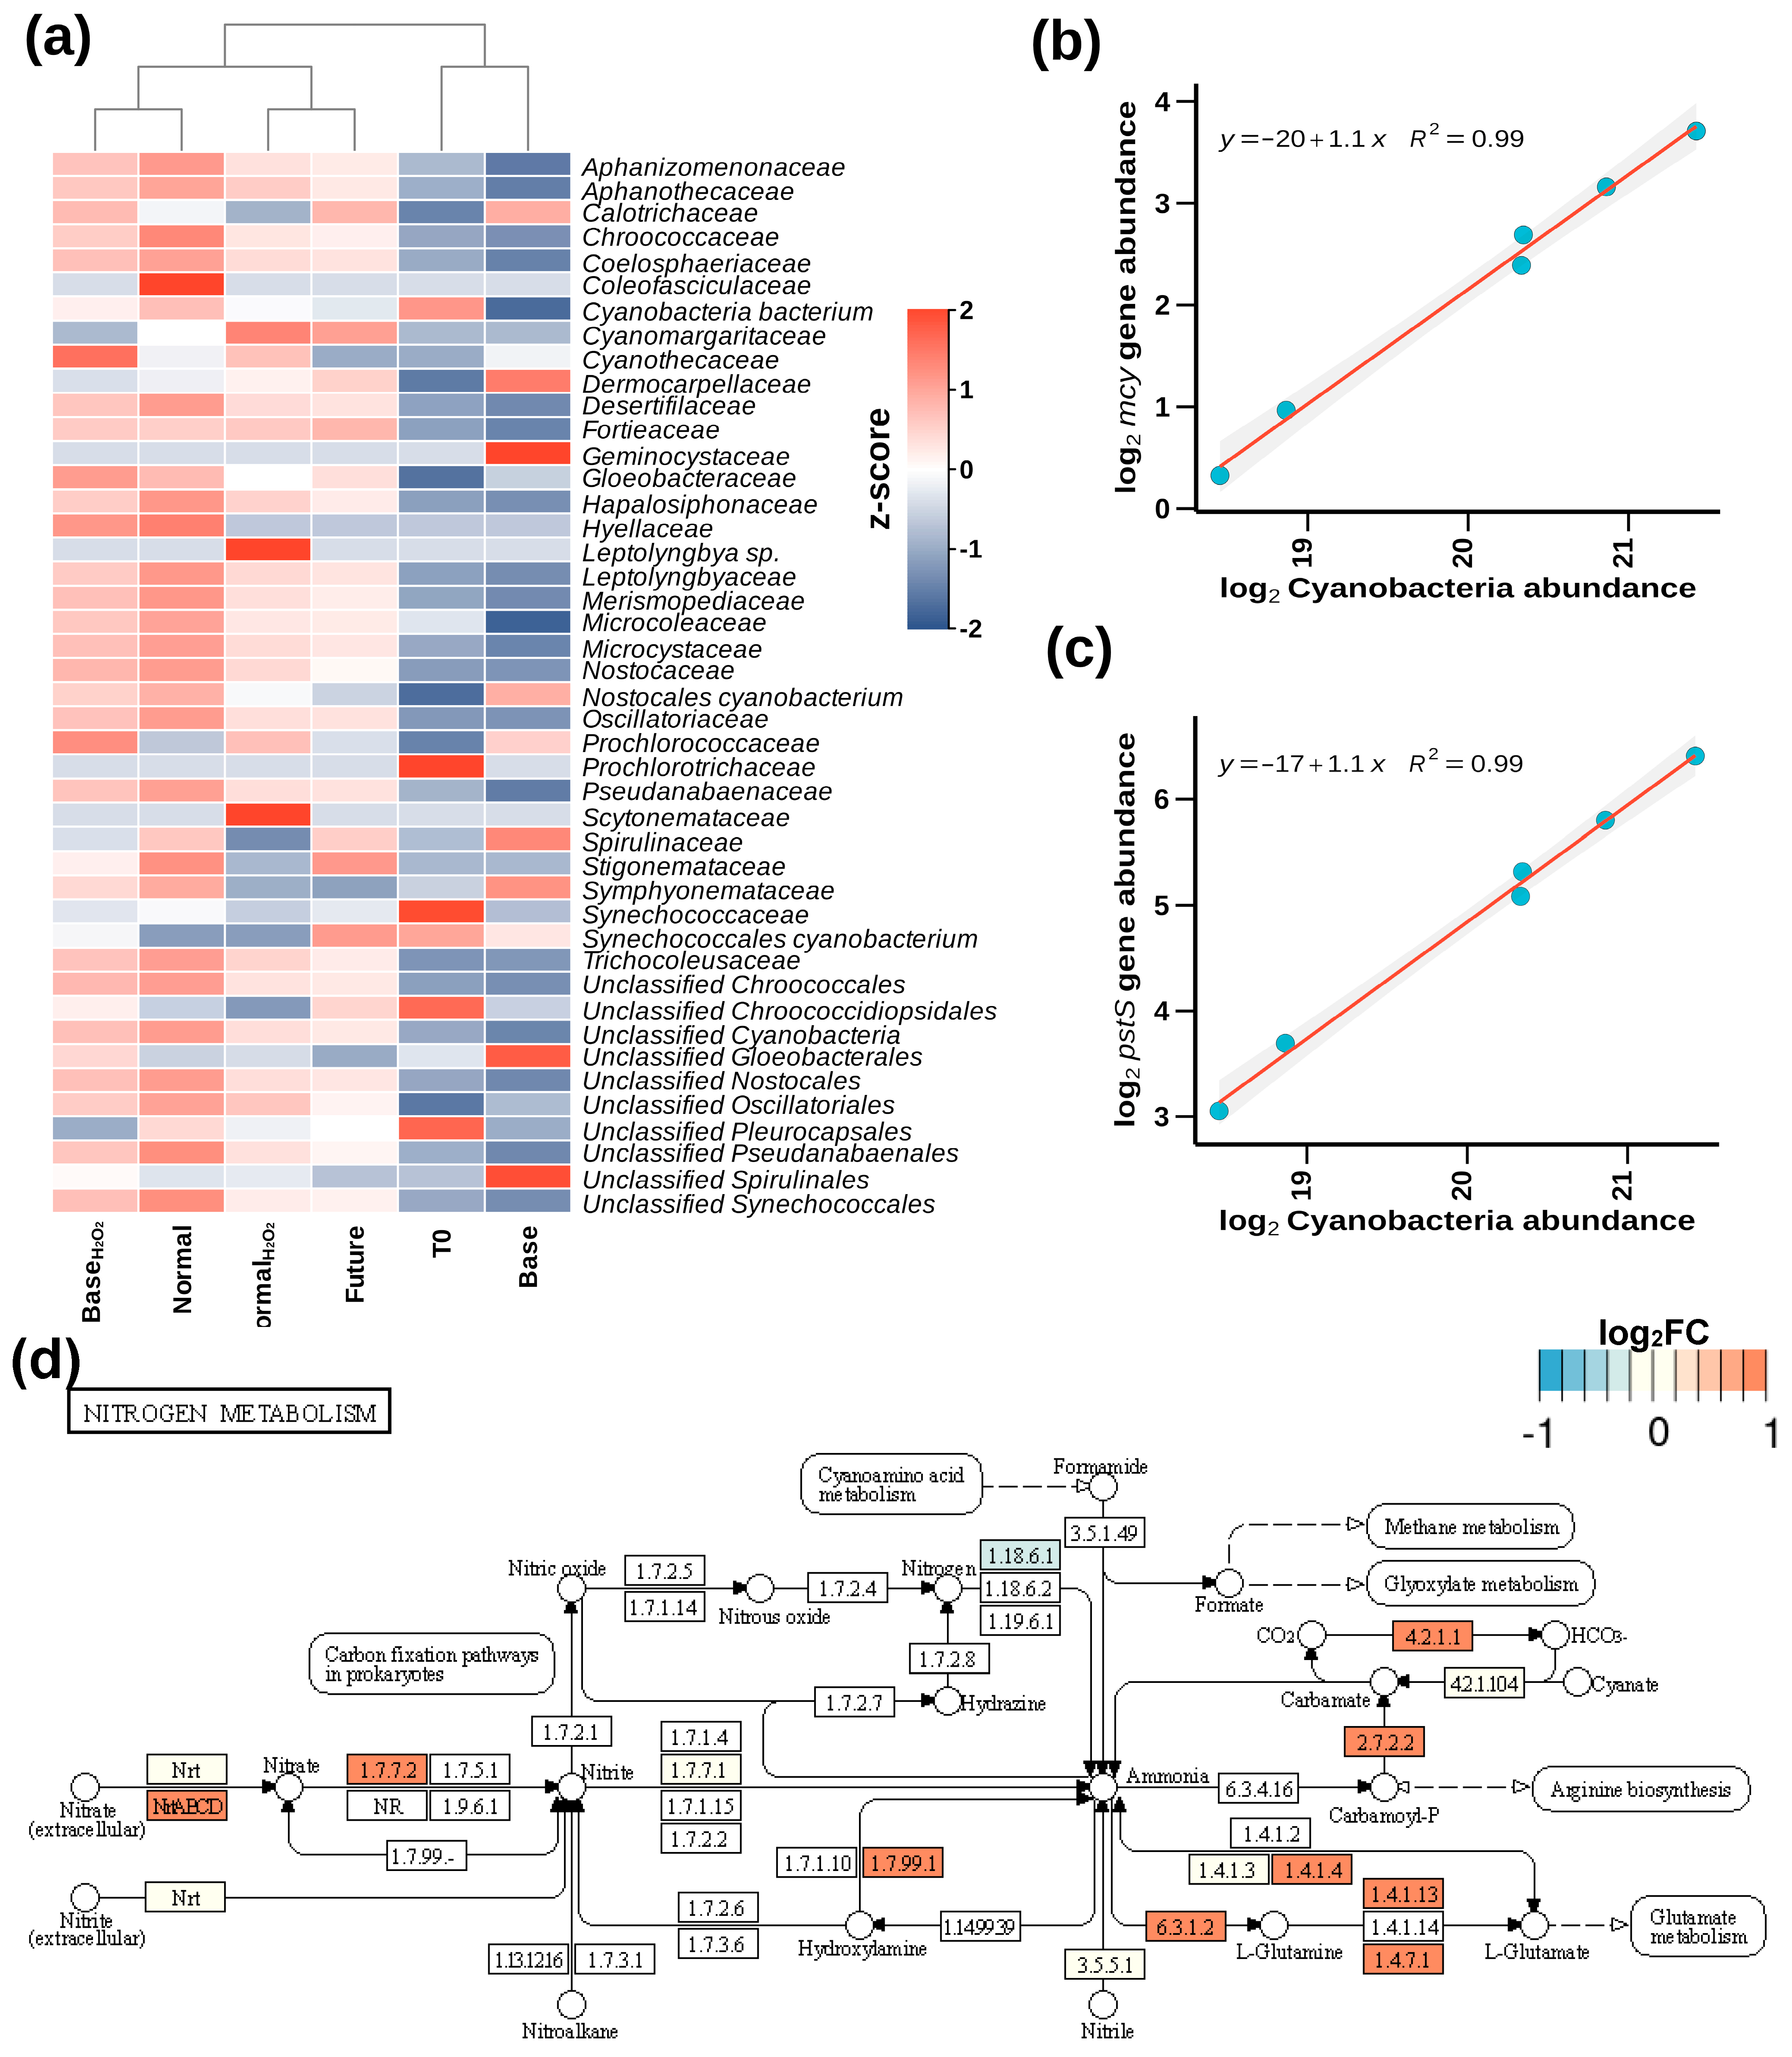
We further analysed the abundance of various cyanobacteria families to compare their relative changes across different treatment conditions (T0, base, BaseH2O2, normal, NormalH2O2, and future). Most cyanobacteria families had a higher relative abundance in the elevated-temperature treatments (normal and future), indicating a marked increase in their relative abundance compared to the baseline and initial conditions (Figure 2a). Notably, many of these abundant families have been reported to be cyanotoxin producers [66]. For instance, Microcystaceae, a well-known cyanotoxin (microcystin) producer, exhibited a notable increase in abundance from T0 to the normal and future temperatures, highlighting its proliferation under warming conditions. We also observed other cyanotoxin producer families, including Nostocaceae (g_Nostoc and g_Anabaena), Aphanizomenonaceae (g_Aphanizomenon, g_Dolichospermum), Leptolyngbyaceae (g_Leptolyngbya), Merismopediaceae (g_Synechocystis), Microcoleaceae (g_Symploca, g_Planktothrix), and others. Notably, microcystins are prevalent in New Zealand’s lakes and reservoirs, with Microcystis being the primary producer of these toxins in planktonic samples [67]. Previous reports have also identified that climate change will increase the severity, distribution, and longevity of cyanobacterial blooms in lakes, including the four most common pelagic bloom-forming genera in New Zealand, Aphanizomenon, Cylindrospermopsis, Dolichospermum, and Microcystis [68].
Moreover, column clustering in the heatmap revealed that the treatments with elevated temperatures (normal and future) and those with oxidative stress (BaseH2O2 and NormalH2O2) clustered closely together. This indicates a similar response in the cyanobacterial community composition under these conditions, suggesting that both temperature increases and oxidative stress promote the proliferation of certain cyanobacteria families. Cyanobacteria, as oxygenic photosynthetic organisms, inevitably produce ROS during electron transport and have developed rapid antioxidant defences for survival [28]. A regression analysis showed a strong association between the SOD gene and cyanobacterial abundance (R2 = 0.6415), while perR exhibited a weaker correlation (R2 = 0.3736) (Figure S4). Both genes encode key oxidative defence enzymes in cyanobacteria [28,69,70]. Our findings reinforce previous claims of the climate-warming-induced proliferation of potentially toxigenic cyanobacteria [62,63,71] and show the impact of temperature alone in promoting cyanobacterial blooms.
Furthermore, the linear regression analysis showed a strong positive association (R2 = 0.99) between the abundance of the mcy gene cluster (within cyanobacterial contigs), responsible for microcystin production, and the total cyanobacterial abundance (Figure 2b). This indicates that cyanobacterial abundance was closely associated with an increased mcy gene abundance, indicating a higher potential for toxin production under warming conditions. The mcy gene has been previously used as an indicator for the early detection of microcystin production [72,73]. Moreover, the cyanobacterial metabolism has been associated with a high nutrient uptake, specifically of nitrogen and phosphate. We observed that the pstS gene (within cyanobacterial contigs), related to phosphate uptake, showed a positive association (R2 = 0.99) with the total cyanobacterial abundance (Figure 2c). As cyanobacterial populations grew, the abundance of genes involved in phosphate acquisition also increased, suggesting an enhanced potential to optimize nutrient uptake in competitive environments. Additionally, the potential for nitrogen metabolism in the future condition increased compared to the base condition (Figure 2d). Moreover, the active nitrate transport system in cyanobacteria is encoded by the four genes nrtA, nrtB, nrtC, and nrtD, as demonstrated in Synechococcus sp. PCC7942 [74] and Anabaena sp. strain PCC7120 [75]. The higher abundance of key genes involved in nitrogen fixation, assimilation, and metabolism under the future temperature scenario indicates that cyanobacteria did not only proliferate, but also actively altered their metabolic capacity to thrive in warmer environments. For example, within cyanobacterial contigs genes involved in the uptake of extracellular nitrate (nrtABCD), the transformation of nitrate into nitrite (narB) and subsequent assimilation into organic forms show a higher metabolic potential, underscoring the adaptive responses of cyanobacteria to increased temperatures.
The upregulation of nitrogen metabolism genes, particularly those involved in nitrate uptake and assimilation, was especially notable given the consistently low nitrate and nitrite levels observed across all experimental conditions. This suggests that cyanobacteria adapted to efficiently utilize the limited nitrogen resources in warming environments. Moreover, cyanobacterial photosynthesis and carbon-fixation-related genes were also present in higher abundances in the future temperature condition compared to the base temperature condition (Figures S5 and S6). These results clearly demonstrate that rising temperatures and oxidative stress significantly promote the proliferation of cyanotoxin-producing cyanobacteria. The strong association between cyanobacterial abundance and the presence of the mcy and pstS genes indicates an increased potential for toxin production and efficient nutrient uptake. Furthermore, the increased potential of the nitrogen metabolism and photosynthesis pathways in warmer conditions underscores the possible adaptive mechanisms enabling cyanobacteria to dominate in changing environmental conditions.

3.4. Temperature- and ROS-Induced Proliferation of Antibacterial Resistance

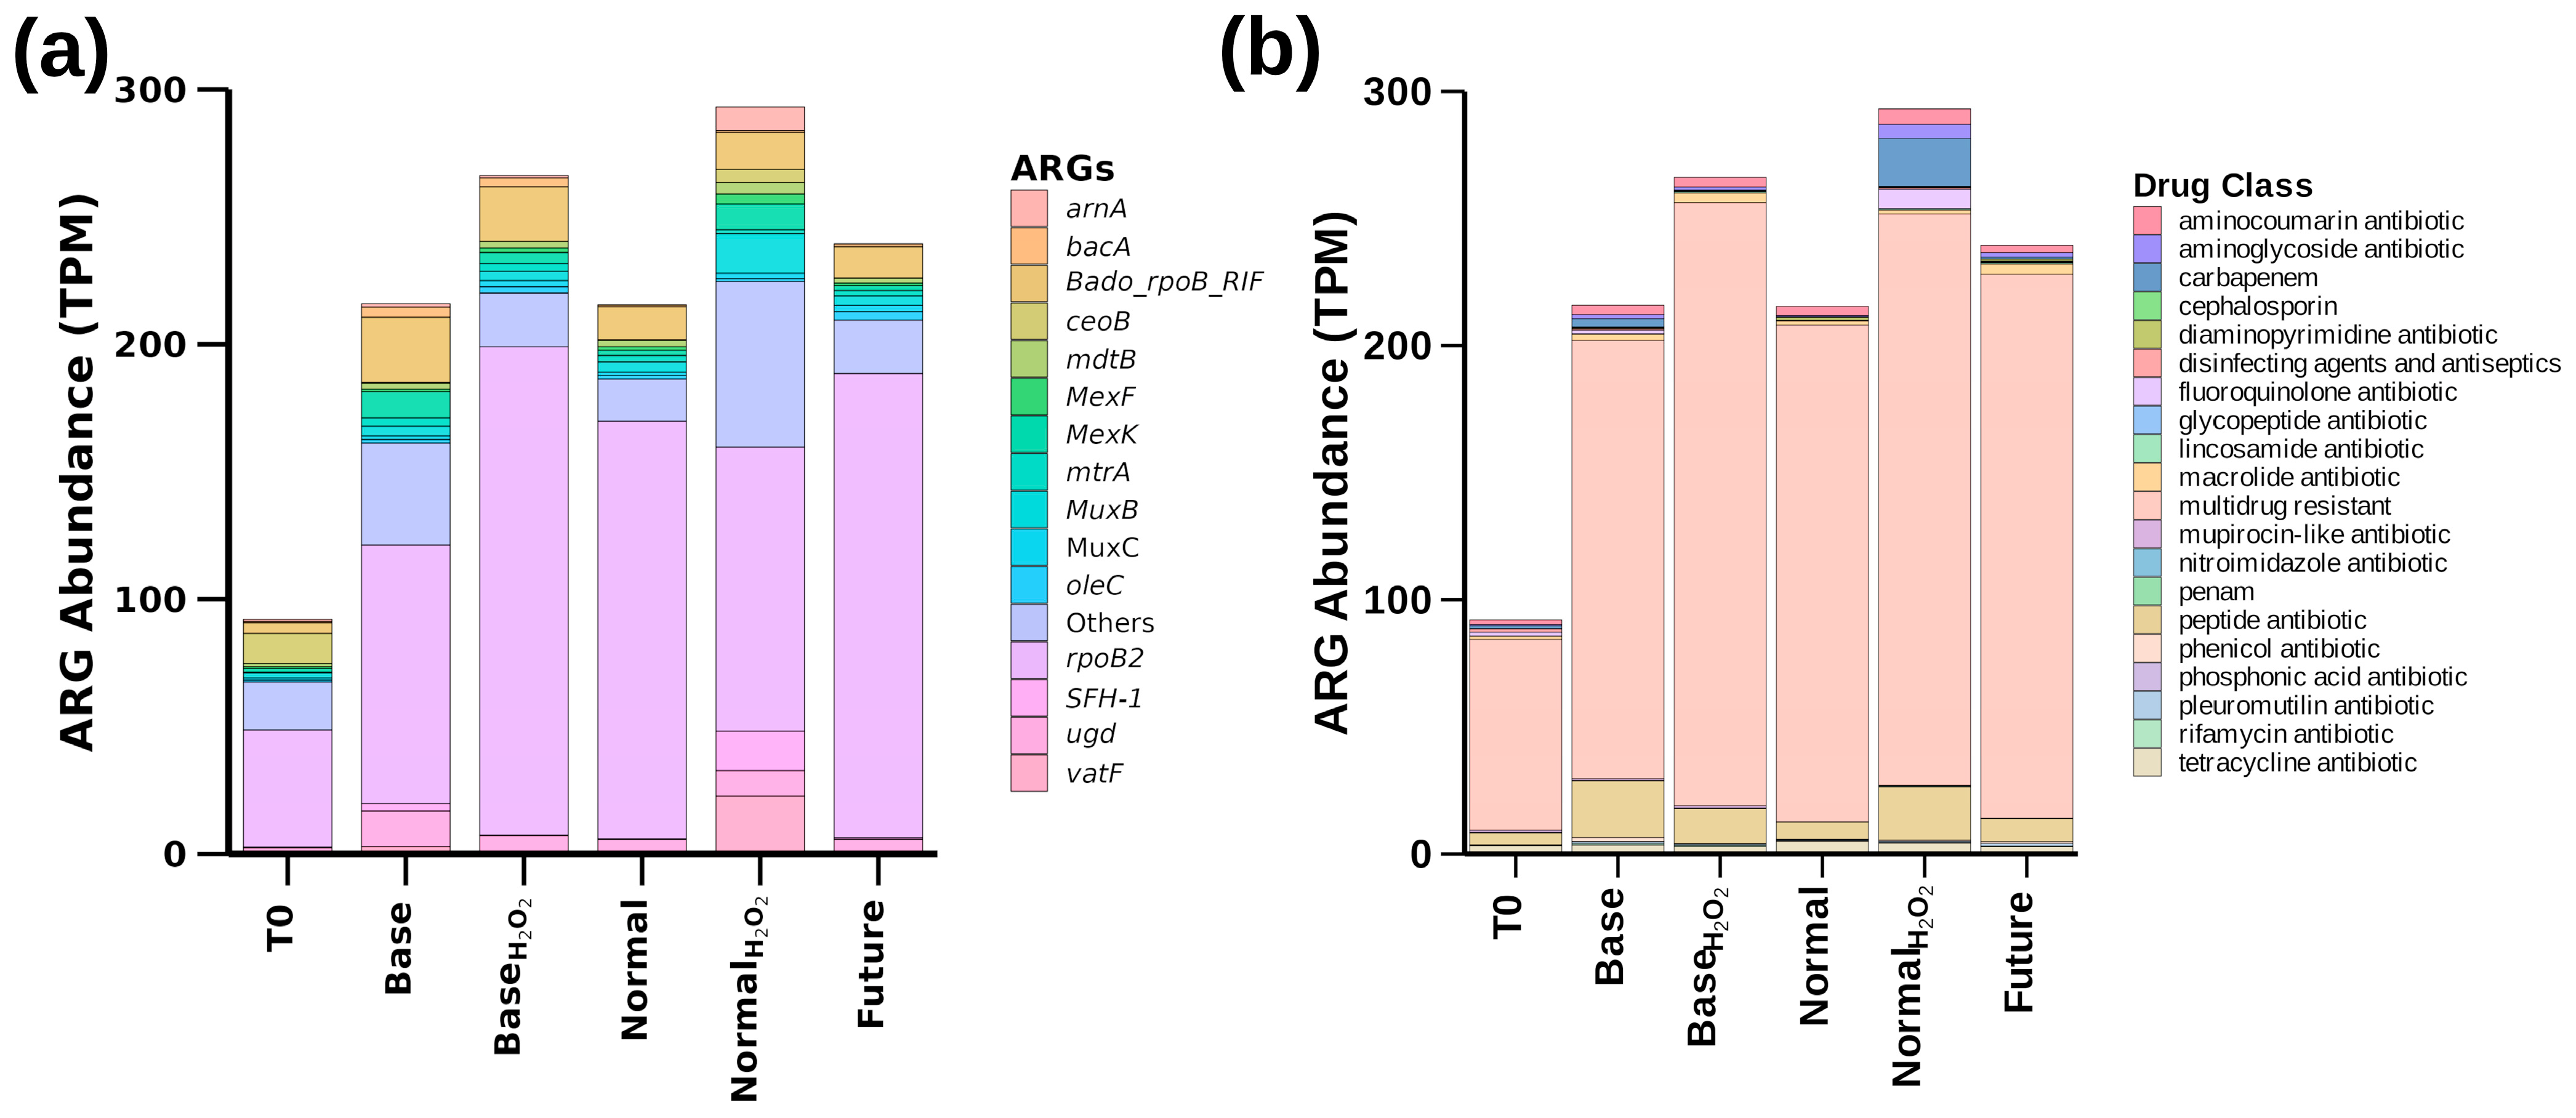
In addition to the effects on cyanobacterial proliferation, we further assessed the relative abundances of various ARGs under different treatment conditions to understand the impacts of increased temperature and oxidative stress. In total, 122 ARGs were detected in the metagenomic assembly, which were further classified into 45 families, 20 drug classes, and 8 different mechanisms of resistance based on the CARD database [49]. The most common ARG families were resistance–nodulation–cell division (RND) antibiotic efflux pumps (32.79%), major facilitator superfamily (MFS) antibiotic efflux pumps (8.20%), miscellaneous ABC-F subfamily ATP-binding cassette (ABC) antibiotic efflux pumps (5.74%), and tetracycline-resistant ribosomal protection proteins (5.74%). In terms of mechanisms of resistance, antibiotic efflux (46.72%), antibiotic inactivation (22.13%), antibiotic target protection (17.21%), antibiotic target alteration (7.38%), and antibiotic target replacement (3.28%) were the most prevalent. The analysis of ARG profiles across different conditions revealed dynamic changes in these resistance mechanisms. The initial T0 condition showed a low relative abundance of ARGs, representing a baseline level of antibiotic resistance in the Cosseys Reservoir microbial community. With an increasing temperature, the total ARGs’ abundance increased substantially in the base, normal, and future conditions compared to T0. Notably, the highest ARGs’ abundance was observed under oxidative stress conditions (BaseH2O2 and NormalH2O2), suggesting a strong link between oxidative stress and the proliferation of ARGs (Figure 3a). Several ARGs showed a consistent presence across all experimental conditions, indicating their fundamental role in baseline resistance mechanisms. For example, the rifamycin-resistant beta-subunit of RNA polymerase (rpoB2 and Bado_rpoB_RIF) was observed along with the peptide antibiotic-resistant ugd gene and multidrug-resistant RND efflux pumps (MexK and MuxB), highlighting the mechanisms in baseline resistance. Moreover, the baseline resistance in T0 predominantly involved antibiotic target alteration/protection/inactivation and efflux systems, with genes like rpoB2, ceoB, Bado_rpoB_RIF, tet(36), ugd, MuxB, TEM-116, and MexK. In the base condition, a shift occurred towards additional resistance through cell wall synthesis (bacA) and efflux pumps (mtrA), with genes such as vatF and SFH-1 becoming more abundant. The presence of oxidative stress in both the BaseH2O2 and NormalH2O2 conditions further intensified these efflux and stress response mechanisms, as evidenced by the increased presence of oleC, MuxC, arnA, and emrB. The normal condition highlighted tetracycline resistance (tet(36) and tetB(P)) and efflux pumps (MuxB, mdtB, and rsmA), while the future condition underscored a combination of efflux (oleC and MuxC) and adaptive regulatory mechanisms. Moreover, nine ARGs showed an increasing trend with a rising temperature, out of which, six were antibiotic efflux pumps (AcrF, lmrC, mdsB, oleC, poxtA, and RanA) and three involved antibiotic targets (otr(A)S.liv, rpoB2, and vgaC). These findings demonstrate that antibiotic resistance is highly adaptable, with specific ARGs being abundant in response to temperature and ROS stress, suggesting that future warming scenarios could sustain high levels of antibiotic resistance in aquatic microbial communities, in agreement with previous reports [30].
Furthermore, an analysis of the antibiotic resistance patterns across different drug classes revealed several key trends (Figure 3b). The key resistance drug classes identified in the total metagenome assembly included MDR (50.82%), tetracycline antibiotic (8.20%), peptide antibiotic (6.56%), aminoglycoside antibiotic (4.10%), carbapenem (4.10%), and macrolide antibiotic (3.28%). Notably, the relative abundance of MDR genes was consistently high across all conditions, suggesting pervasive and exacerbated MDR resistance under environmental stressors. Additionally, resistance to aminocoumarin, aminoglycoside, and carbapenem antibiotics showed considerable increases under the combined effects of higher temperatures and oxidative stress, indicating the potential for these stressors to enhance resistance to these drug classes. Peptide antibiotic resistance also increased under environmental stress conditions, highlighting the impact of environmental changes on resistance to this drug class. However, tetracycline resistance exhibited a variable response, with a higher abundance under normal conditions and a slight decrease under future conditions. In agreement with these findings, multidrug, tetracycline, and peptide resistance genes have exhibited significant increases under warming temperatures [30].
Rising temperatures significantly increased ARGs’ abundance, consistent with previous warming experiments [7,30]. However, our results indicated that ROS alone could influence ARGs’ enrichment, leading to a further analysis of the correlations between ROS stress response genes and ARGs under increasing temperatures (Figure S7). We examined the correlations between ARGs and ROS stressor genes (oxyR: hydrogen peroxide-inducible genes activator, soxR: redox-sensitive transcriptional activator, SOD: superoxide dismutase, katG: catalase-peroxidase, and perR: peroxide stress response regulator) during the temperature treatments, identifying 25 unique ARGs correlated with different ROS stressors. The strongest associations were with oxyR (7 ARGs), soxR (18 ARGs), and SODCu-Zn (17 ARGs). Prevalent ARGs across conditions (rpoB2, Bado_rpoB_RIF, MexK, and ugd) showed strong correlations with oxyR. Notably, several ARGs were shared across multiple ROS stressors, suggesting an overlap between the oxidative stress response and antibiotic resistance. The most shared ARGs were ceoB and tet (W), correlated with five and four ROS stressors, respectively. Other frequently shared ARGs included rpoB2, MexK, ugd, and acrB. This overlap indicated interconnected bacterial responses to oxidative stress and antibiotic pressure. The consistent presence of efflux pump genes (e.g., MexK and acrB) across multiple ROS stressors suggested a dual role in expelling both antibiotics and oxidative agents. Notably, 15 of these ARGs exhibited antibiotic resistance through efflux pumps, indicating a strong association between ROS stress and this resistance mechanism. ROS stress has been previously linked with ARGs [76], specifically efflux pumps [34,77,78].
Moreover, the abundance of ARBs exhibited distinct patterns across the experimental conditions, with some ARBs proliferating under the simulated future climate scenarios while others experienced a decline (Figure S8). The total relative abundance of ARBs decreased significantly under the experimental conditions compared to the initial reservoir sample (T0). However, certain ARBs like Caulobacter vibrioides, Chryseobacterium indologenes, and Citrobacter braakii increased considerably in the simulated future conditions. Elizabethkingia meningoseptica and Stenotrophomonas maltophilia also showed marked increases, indicating potential resilience. Pseudomonas fluorescens and Caulobacter vibrioides consistently increased in future conditions, despite showing negative responses in other treatments. Burkholderia pseudomallei and Pantoea agglomerans demonstrated significant increases, underscoring their adaptive potential. The responses to ROS treatment varied, with Legionella pneumophila responding positively and Aeromonas hydrophila negatively, highlighting the differential resistance mechanisms among ARBs.
We further employed a co-association network approach to analyse the relationships between ARBs and ARGs under increasing temperatures [79]. Using the SparCC correlation method (Rho > 0.6 and p < 0.05), we generated a cumulative network and identified key ARBs and ARGs based on their degree centrality measures (Figure 4 and Table S4).
Streptococcus pneumoniae, Acinetobacter baylyi, and Aeromonas veronii emerged as the most central ARBs, connected to a large number of ARGs (43, 41, and 40, respectively), underscoring their significant role as reservoirs of antibiotic resistance. Other notable ARBs with a high degree centrality included Aeromonas jandaei, Acinetobacter baumannii, Acinetobacter venetianus, Acinetobacter johnsonii, Acinetobacter haemolyticus, Vibrio cholerae, and Klebsiella pneumoniae, associated with numerous ARGs. Additionally, the ARGs acrB, MexK, rosB, rpoB2, bacA, adeB, abeM, ugd, poxtA, Bado_rpoB_RIF, adeI, MuxB, adeC, adeJ, adeR, and adeA were identified as being highly central in the network, linked to multiple ARBs, indicating their widespread presence and potential for horizontal gene transfer during warming temperatures [80]. The high connectivity of certain ARBs and ARGs suggests their crucial roles in maintaining the network and the potential for the rapid dissemination of resistance genes. The identification of these central nodes provides valuable targets for intervention strategies, as disrupting them may mitigate the spread of antibiotic resistance. These findings underscore the importance of understanding the network dynamics of ARBs and ARGs in the context of temperature stress. As temperatures increase, the interaction network between ARBs and ARGs may become more pronounced, potentially accelerating the spread of resistance across different bacterial populations.

3.5. Study Limitations and Future Research Directions

While our study provides valuable insights into the short-term impacts of warming on freshwater microbial communities, we acknowledge several areas for future research. The short-term nature of our study and focus on a single reservoir limit its generalizability, suggesting the need for long-term investigations across multiple freshwater bodies. Our single-experiment approach, though informative, could be strengthened by additional biological replicates in future studies. The metagenomic methods we employed, similar to those used for identifying cyanotoxin-producing genera in major U.S. rivers [26], effectively screened for potential producers and their functional capacity. However, we recognize that gene potential does not necessarily indicate expression or adaptation. Future studies incorporating metatranscriptomics, metaproteomics, and metabolomics could validate our predicted functional changes. To complement our metagenomic findings, techniques like qPCR, ELISA, or Western blotting could offer more direct gene or protein quantification. Additionally, for toxin determination, chemical analysis methods such as HPLC or LC-MS could provide quantitative measurements of actual toxin levels. Despite these limitations, our study provides a crucial foundation for understanding the microbial responses to warming in freshwater ecosystems, underscoring the need for proactive measures to mitigate climate change’s effects on aquatic environments.

4. Conclusions

This study provides critical insights into the dual threats of toxic cyanobacterial blooms and antibiotic resistance proliferation in freshwater ecosystems under short-term climate warming scenarios. Our innovative approach, combining temperature manipulation with oxidative stress induction, revealed that even modest temperature increases (2–5 °C) can alter microbial community structures over short time scales, leading to harmful cyanobacterial species, particularly Microcystaceae, along with an enhanced cyanobacterial metabolic potential under warming conditions. Concurrently, we observed a concerning rise in ARGs’ abundance, strongly correlated with oxidative stress response genes. Importantly, these microbial community shifts and metabolic changes occurred despite consistently low nutrient levels, highlighting the primacy of temperature and oxidative stress in driving ecosystem responses. The observed alterations in organic matter processing and DOM composition further underscore the complex interplay between warming, microbial activity, and nutrient cycling in freshwater systems. Notably, our study shows that reactive oxygen species can mimic and exacerbate temperature effects on freshwater microbial communities, providing a potential mechanistic link between temperature stress and microbial community changes. This research advances our understanding of how climate warming may reshape freshwater microbial communities, with far-reaching implications for ecosystem health, water quality, and public health, providing a foundation for future long-term studies across diverse freshwater ecosystems.

Supplementary Materials

The following supporting information can be downloaded at: https://www.mdpi.com/article/10.3390/w16182655/s1. Table S1. Details on the read statistics from the metagenomics assembly. Table S2. The properties of 4 components identified based on OpenFluor database. Table S3. Co-association between cyanobacteria and other taxa (Rho > 0.6 and p < 0.05). Table S4. List of abbreviations used for ARGs node labels. Figure S1. Nitrate levels over time under Base, BaseH2O2, Normal, NormalH2O2, and Future conditions. Figure S2. Total organic carbon levels over time under Base, BaseH2O2, Normal, NormalH2O2, and Future conditions. Figure S3. Dissolved Organic Matter (DOM) analysis under different conditions. (a) Amount of fluorescent components in DOM at different conditions: T0 (initial), Base, BaseH2O2, Normal, NormalH2O2, and Future. Components 1 to 5 are represented by different colors in the stacked bar chart. (b) Excitation-Emission Matrix (EEM) plots for the five DOM components identified by the PARAFAC model. Each plot shows the excitation (x-axis) and emission (y-axis) spectra for Components 1 to 5, with color indicating fluorescence intensity. Figure S4. Linear regression of (a) perR (peroxide stress response regulator) and (b) sodN (nickel superoxide dismutase) gene abundance against total cyanobacterial abundance, showing a positive association, indicating a ROS stress response in cyanobacterial populations. Figure S5. Photosynthesis pathway highlighting the log2FC change (TPM) of multiple upregulated genes in the Future condition (27 °C) compared to the Base condition (22 °C). Figure S6. Carbon fixation in photosynthetic organisms highlighting the log2FC change (TPM) of multiple upregulated genes in the Future condition (27 °C) compared to the Base condition (22 °C). Figure S7. A network analysis depicting the correlations between selected ARGs and ROS stress response genes during the increasing temperature treatment. oxyR: hydrogen peroxide-inducible genes activator, soxR: redox-sensitive transcriptional activator, SOD: superoxide dismutase, katG: catalase-peroxidase, perR: peroxide stress response regulator, sodN: nickel superoxide dismutase. Figure S8. Heatmap showing the z-scores of relative abundances of different antibiotic-resistant bacteria (ARBs) across various conditions. Species identified in the metagenomics analysis were searched against the list of known pathogens in CARD database to identify the ARBs.

Author Contributions

Conceptualization, B.M., E.J. and N.S.; formal analysis, B.M. and E.J.; funding acquisition, N.S.; investigation, B.M., E.J., W.Z., X.Z., B.L. and G.M.T.; methodology, B.M. and E.J.; project administration, N.S.; supervision, N.S.; visualization, B.M. and E.J.; writing—original draft, B.M.; writing—review and editing, E.J., W.Z., X.Z., B.L., G.M.T. and N.S. All authors have read and agreed to the published version of the manuscript.

Funding

The study was funded by a Marsden Award from the Royal Society of New Zealand (Contract Number: MFP-UOA2018) and a FRDF grant 9485/3729416 from the Faculty of Engineering, The University of Auckland to NS.

Data Availability Statement

Data are contained within the article.

Acknowledgments

The authors acknowledge the use of New Zealand eScience Infrastructure (NeSI) high performance computing facilities, consulting support and/or training services as part of this research. New Zealand’s national facilities are provided by NeSI and funded jointly by NeSI’s collaborator institutions and through the Ministry of Business, Innovation & Employment’s Research Infrastructure programme. URL https://www.nesi.org.nz. The authors also acknowledge the Centre for eResearch at the University of Auckland for their help in facilitating this research. http://www.eresearch.auckland.ac.nz.

Conflicts of Interest

The authors declare no conflicts of interest.

References

  1. Sun, Q.; Miao, C.; Hanel, M.; Borthwick, A.G.; Duan, Q.; Ji, D.; Li, H. Global heat stress on health, wildfires, and agricultural crops under different levels of climate warming. Environ. Int. 2019, 128, 125–136. [Google Scholar] [CrossRef] [PubMed]
  2. Cole, R.; Hajat, S.; Murage, P.; Heaviside, C.; Macintyre, H.; Davies, M.; Wilkinson, P. The contribution of demographic changes to future heat-related health burdens under climate change scenarios. Environ. Int. 2023, 173, 107836. [Google Scholar] [CrossRef] [PubMed]
  3. IPOC Change. Climate Change 2021—The Physical Science Basis. Chem. Int. 2021, 43, 22–23. [Google Scholar] [CrossRef]
  4. WMO. WMO Global Annual to Decadal Climate Update: Target Years: 2023 and 2023–2027; WMO: Geneva, Switzerland, 2023. [Google Scholar]
  5. Albert, J.S.; Destouni, G.; Duke-Sylvester, S.M.; Magurran, A.E.; Oberdorff, T.; Reis, R.E.; Winemiller, K.O.; Ripple, W.J. Scientists’ warning to humanity on the freshwater biodiversity crisis. Ambio 2020, 50, 85–94. [Google Scholar] [CrossRef]
  6. Muruganandam, M.; Rajamanickam, S.; Sivarethinamohan, S.; Reddy, M.K.; Velusamy, P.; Gomathi, R.; Ravindiran, G.; Gurugubelli, T.R.; Muniasamy, S.K. Impact of Climate Change and Anthropogenic Activities on Aquatic Ecosystem—A Review. Environ. Res. 2023, 238, 117233. [Google Scholar]
  7. Li, Z.; Sun, A.; Liu, X.; Chen, Q.-L.; Bi, L.; Ren, P.-X.; Shen, J.-P.; Jin, S.; He, J.-Z.; Hu, H.-W.; et al. Climate warming increases the proportions of specific antibiotic resistance genes in natural soil ecosystems. J. Hazard. Mater. 2022, 430, 128442. [Google Scholar] [CrossRef]
  8. Yang, J.; Yu, Q.; Su, W.; Wang, S.; Wang, X.; Han, Q.; Li, H. Metagenomics reveals that temperature predicts a small proportion of antibiotic resistomes and mobile genetic elements in polluted water. Environ. Pollut. 2023, 317, 120793. [Google Scholar] [CrossRef]
  9. O’Neil, J.M.; Davis, T.W.; Burford, M.A.; Gobler, C.J. The rise of harmful cyanobacteria blooms: The potential roles of eutrophication and climate change. Harmful Algae 2012, 14, 313–334. [Google Scholar] [CrossRef]
  10. Guo, Y.; Liu, M.; Liu, L.; Liu, X.; Chen, H.; Yang, J. The antibiotic resistome of free-living and particle-attached bacteria under a reservoir cyanobacterial bloom. Environ. Int. 2018, 117, 107–115. [Google Scholar] [CrossRef]
  11. Tomitani, A.; Knoll, A.H.; Cavanaugh, C.M.; Ohno, T. The evolutionary diversification of cyanobacteria: Molecular–phylogenetic and paleontological perspectives. Proc. Natl. Acad. Sci. USA 2006, 103, 5442–5447. [Google Scholar] [CrossRef]
  12. Bullerjahn, G.S.; Post, A.F. Physiology and molecular biology of aquatic cyanobacteria. Front. Microbiol. 2014, 5, 359. [Google Scholar] [CrossRef] [PubMed]
  13. Conley, D.J.; Paerl, H.W.; Howarth, R.W.; Boesch, D.F.; Seitzinger, S.P.; Havens, K.E.; Lancelot, C.; Likens, G.E. Ecology—Controlling Eutrophication: Nitrogen and Phosphorus. Science 2009, 323, 1014–1015. [Google Scholar] [CrossRef] [PubMed]
  14. Fernández-González, C.; Tarran, G.A.; Schuback, N.; Woodward, E.M.S.; Arístegui, J.; Marañón, E. Phytoplankton responses to changing temperature and nutrient availability are consistent across the tropical and subtropical Atlantic. Commun. Biol. 2022, 5, 1035. [Google Scholar] [CrossRef] [PubMed]
  15. Merel, S.; Walker, D.; Chicana, R.; Snyder, S.; Baurès, E.; Thomas, O. State of knowledge and concerns on cyanobacterial blooms and cyanotoxins. Environ. Int. 2013, 59, 303–327. [Google Scholar] [CrossRef] [PubMed]
  16. Hernandez, B.Y.; Zhu, X.; Sotto, P.; Paulino, Y. Oral exposure to environmental cyanobacteria toxins: Implications for cancer risk. Environ. Int. 2021, 148, 106381. [Google Scholar] [CrossRef] [PubMed]
  17. Zhao, Y.; Yan, Y.; Xie, L.; Wang, L.; He, Y.; Wan, X.; Xue, Q. Long-term environmental exposure to microcystins increases the risk of nonalcoholic fatty liver disease in humans: A combined fisher-based investigation and murine model study. Environ. Int. 2020, 138, 105648. [Google Scholar] [CrossRef]
  18. Wood, R. Acute animal and human poisonings from cyanotoxin exposure—A review of the literature. Environ. Int. 2016, 91, 276–282. [Google Scholar] [CrossRef]
  19. Filatova, D.; Picardo, M.; Núñez, O.; Farré, M. Analysis, Levels and Seasonal Variation of Cyanotoxins in Freshwater Eco-systems. Trends Environ. Anal. Chem. 2020, 26, e00091. [Google Scholar] [CrossRef]
  20. Verspagen, J.M.H.; Van de Waal, D.B.; Finke, J.F.; Visser, P.M.; Van Donk, E.; Huisman, J. Rising CO2 Levels Will Intensify Phytoplankton Blooms in Eutrophic and Hypertrophic Lakes. PLoS ONE 2014, 9, e104325. [Google Scholar] [CrossRef]
  21. Rastogi, R.P.; Madamwar, D.; Incharoensakdi, A. Bloom Dynamics of Cyanobacteria and Their Toxins: Environmental Health Impacts and Mitigation Strategies. Front. Microbiol. 2015, 6, 1254. [Google Scholar] [CrossRef]
  22. Rastogi, R.P.; Sinha, R.P.; Incharoensakdi, A. The cyanotoxin-microcystins: Current overview. Rev. Environ. Sci. Bio/Technol. 2014, 13, 215–249. [Google Scholar] [CrossRef]
  23. Jang, M.-H.; Ha, K.; Takamura, N. Reciprocal allelopathic responses between toxic cyanobacteria (Microcystis aeruginosa) and duckweed (Lemna japonica). Toxicon 2007, 49, 727–733. [Google Scholar] [CrossRef] [PubMed]
  24. Berry, J.P.; Gantar, M.; Perez, M.H.; Berry, G.; Noriega, F.G. Cyanobacterial Toxins as Allelochemicals with Potential Appli-cations as Algaecides, Herbicides and Insecticides. Mar. Drugs 2008, 6, 117–146. [Google Scholar] [CrossRef] [PubMed]
  25. Amado, L.; Monserrat, J. Oxidative stress generation by microcystins in aquatic animals: Why and how. Environ. Int. 2010, 36, 226–235. [Google Scholar] [CrossRef] [PubMed]
  26. Linz, D.M.; Sienkiewicz, N.; Struewing, I.; Stelzer, E.A.; Graham, J.L.; Lu, J. Metagenomic mapping of cyanobacteria and potential cyanotoxin producing taxa in large rivers of the United States. Sci. Rep. 2023, 13, 2806. [Google Scholar] [CrossRef]
  27. Yadav, P.; Singh, R.P.; Rana, S.; Joshi, D.; Kumar, D.; Bhardwaj, N.; Gupta, R.K.; Kumar, A. Mechanisms of Stress Tolerance in Cyanobacteria under Extreme Conditions. Stresses 2022, 2, 531–549. [Google Scholar] [CrossRef]
  28. Latifi, A.; Ruiz, M.; Zhang, C.-C. Oxidative stress in cyanobacteria. FEMS Microbiol. Rev. 2009, 33, 258–278. [Google Scholar] [CrossRef]
  29. Qamar, M.U. Aatika Impact of Climate Change on Antimicrobial Resistance Dynamics: An Emerging One Health Challenge. Future Microbiol. 2023, 18, 535–539. [Google Scholar] [CrossRef]
  30. Yu, Q.; Han, Q.; Shi, S.; Sun, X.; Wang, X.; Wang, S.; Yang, J.; Su, W.; Nan, Z.; Li, H. Metagenomics reveals the response of antibiotic resistance genes to elevated temperature in the Yellow River. Sci. Total Environ. 2023, 859, 160324. [Google Scholar] [CrossRef]
  31. Hassan, A.H.A.; Hozzein, W.N.; Mousa, A.S.M.; Rabie, W.; Alkhalifah, D.H.M.; Selim, S.; AbdElgawad, H. Heat stress as an innovative approach to enhance the antioxidant production in Pseudooceanicola and Bacillus isolates. Sci. Rep. 2020, 10, 15076. [Google Scholar] [CrossRef]
  32. Fang, M.; Lei, Z.; Ruilin, M.; Jing, W.; Leqiang, D. High temperature stress induced oxidative stress, gut inflammation and disordered metabolome and microbiome in tsinling lenok trout. Ecotoxicol. Environ. Saf. 2023, 266, 115607. [Google Scholar] [CrossRef] [PubMed]
  33. Tignat-Perrier, R.; van de Water, J.A.J.M.; Guillemain, D.; Aurelle, D.; Allemand, D.; Ferrier-Pagès, C. The Effect of Thermal Stress on the Physiology and Bacterial Communities of Two Key Mediterranean Gorgonians. Appl. Environ. Microbiol. 2022, 88, e0234021. [Google Scholar] [CrossRef] [PubMed]
  34. Qi, W.; Jonker, M.J.; Teichmann, L.; Wortel, M.; ter Kuile, B.H. The influence of oxygen and oxidative stress on de novo acquisition of antibiotic resistance in E. coli and Lactobacillus lactis. BMC Microbiol. 2023, 23, 279. [Google Scholar] [CrossRef] [PubMed]
  35. Lu, J.; Jin, M.; Nguyen, S.H.; Mao, L.; Li, J.; Coin, L.J.; Yuan, Z.; Guo, J. Non-antibiotic antimicrobial triclosan induces multiple antibiotic resistance through genetic mutation. Environ. Int. 2018, 118, 257–265. [Google Scholar] [CrossRef] [PubMed]
  36. Pucher, M.; Wünsch, U.; Weigelhofer, G.; Murphy, K.; Hein, T.; Graeber, D. staRdom: Versatile Software for Analyzing Spectroscopic Data of Dissolved Organic Matter in R. Water 2019, 11, 2366. [Google Scholar] [CrossRef]
  37. Murphy, K.R.; Stedmon, C.A.; Wenig, P.; Bro, R. OpenFluor—An online spectral library of auto-fluorescence by organic compounds in the environment. Anal. Methods 2013, 6, 658–661. [Google Scholar] [CrossRef]
  38. Bolger, A.M.; Lohse, M.; Usadel, B. Trimmomatic: A flexible trimmer for Illumina sequence data. Bioinformatics 2014, 30, 2114–2120. [Google Scholar] [CrossRef]
  39. Raes, E.J.; Karsh, K.; Sow, S.L.S.; Ostrowski, M.; Brown, M.V.; van de Kamp, J.; Franco-Santos, R.M.; Bodrossy, L.; Waite, A.M. Metabolic pathways inferred from a bacterial marker gene illuminate ecological changes across South Pacific frontal boundaries. Nat. Commun. 2021, 12, 2213. [Google Scholar] [CrossRef]
  40. Tamames, J.; Puente-Sánchez, F. SqueezeMeta, A Highly Portable, Fully Automatic Metagenomic Analysis Pipeline. Front. Microbiol. 2019, 9, 3349. [Google Scholar] [CrossRef]
  41. Li, D.; Liu, C.-M.; Luo, R.; Sadakane, K.; Lam, T.-W. MEGAHIT: An ultra-fast single-node solution for large and complex metagenomics assembly via succinct de Bruijn graph. Bioinformatics 2015, 31, 1674–1676. [Google Scholar] [CrossRef]
  42. Schmieder, R.; Edwards, R. Quality control and preprocessing of metagenomic datasets. Bioinformatics 2011, 27, 863–864. [Google Scholar] [CrossRef] [PubMed]
  43. Seemann, T. Prokka: Rapid Prokaryotic Genome Annotation. Bioinformatics 2014, 30, 2068–2069. [Google Scholar] [CrossRef] [PubMed]
  44. Hyatt, D.; Chen, G.-L.; Locascio, P.F.; Land, M.L.; Larimer, F.W.; Hauser, L.J. Prodigal: Prokaryotic gene recognition and translation initiation site identification. BMC Bioinform. 2010, 11, 119. [Google Scholar] [CrossRef] [PubMed]
  45. Clark, K.; Karsch-Mizrachi, I.; Lipman, D.J.; Ostell, J.; Sayers, E.W. GenBank. Nucleic Acids Res. 2016, 44, D67–D72. [Google Scholar] [CrossRef]
  46. Luo, C.; Rodriguez-R, L.M.; Konstantinidis, K.T. MyTaxa: An advanced taxonomic classifier for genomic and metagenomic sequences. Nucleic Acids Res. 2014, 42, e73. [Google Scholar] [CrossRef]
  47. Kanehisa, M.; Goto, S. KEGG: Kyoto Encyclopedia of Genes and Genomes. Nucleic Acids Res. 2000, 28, 27–30. [Google Scholar] [CrossRef]
  48. Buchfink, B.; Xie, C.; Huson, D.H. Fast and sensitive protein alignment using DIAMOND. Nat. Methods 2015, 12, 59–60. [Google Scholar] [CrossRef]
  49. Alcock, B.P.; Raphenya, A.R.; Lau, T.T.Y.; Tsang, K.K.; Bouchard, M.; Edalatmand, A.; Huynh, W.; Nguyen, A.-L.V.; Cheng, A.A.; Liu, S.; et al. CARD 2020: Antibiotic resistome surveillance with the comprehensive antibiotic resistance database. Nucleic Acids Res. 2020, 48, D517–D525. [Google Scholar] [CrossRef]
  50. Langmead, B.; Salzberg, S.L. Fast gapped-read alignment with Bowtie 2. Nat. Methods 2012, 9, 357–359. [Google Scholar] [CrossRef]
  51. Puente-Sánchez, F.; García-García, N.; Tamames, J. SQMtools: Automated processing and visual analysis of’ omics data with R and anvi’o. BMC Bioinform. 2020, 21, 358. [Google Scholar] [CrossRef]
  52. Friedman, J.; Alm, E.J. Inferring Correlation Networks from Genomic Survey Data. PLoS Comput. Biol. 2012, 8, e1002687. [Google Scholar] [CrossRef] [PubMed]
  53. Peschel, S.; Müller, C.L.; von Mutius, E.; Boulesteix, A.-L.; Depner, M. NetCoMi: Network construction and comparison for microbiome data in R. Briefings Bioinform. 2020, 22, bbaa290. [Google Scholar] [CrossRef] [PubMed]
  54. Bastian, M.; Heymann, S.; Jacomy, M. Gephi: An Open Source Software for Exploring and Manipulating Networks. In Proceedings of the 3rd International AAAI Conference on Weblogs and Social Media, San Jose, CA, USA, 17–20 May 2009. [Google Scholar]
  55. Chen, C.J.; Chen, H.; Zhang, Y.; Thomas, H.R.; Frank, M.H.; He, Y.H.; Xia, R. TBtools: An Integrative Toolkit Developed for Interactive Analyses of Big Biological Data. Mol. Plant 2020, 13, 1194–1202. [Google Scholar] [CrossRef] [PubMed]
  56. Luo, W.; Brouwer, C. Pathview: An R/Bioconductor package for pathway-based data integration and visualization. Bioinformatics 2013, 29, 1830–1831. [Google Scholar] [CrossRef] [PubMed]
  57. Lyu, F.; Han, F.; Ge, C.; Mao, W.; Chen, L.; Hu, H.; Chen, G.; Lang, Q.; Fang, C. OmicStudio: A composable bioinformatics cloud platform with real-time feedback that can generate high-quality graphs for publication. iMeta 2023, 2, e85. [Google Scholar] [CrossRef] [PubMed]
  58. Wickham, H. ggplot2. Wiley Interdiscip. Rev. Comput. Stat. 2011, 3, 180–185. [Google Scholar] [CrossRef]
  59. R Core Team. R Core Team 2021 R: A Language and Environment for Statistical Computing; R Foundation for Statistical Computing: Vienna, Austria, 2022; Available online: https://www.R-Project.Org/ (accessed on 1 January 2024).
  60. Xia, Y.; Yu, E.; Li, Z.; Yu, D.; Wang, G.; Xie, J.; Gong, W.; Zhang, K. Bacterial Community Composition Associated with Freshwater Cyanobacterial Blooms of Intensive Culture Ponds. Nat. Environ. Pollut. Technol. 2017, 16, 1059–1066. [Google Scholar]
  61. Ziegler, M.; Seneca, F.O.; Yum, L.K.; Palumbi, S.R.; Voolstra, C.R. Bacterial community dynamics are linked to patterns of coral heat tolerance. Nat. Commun. 2017, 8, 14213. [Google Scholar] [CrossRef]
  62. Chapra, S.C.; Boehlert, B.; Fant, C.; Bierman, V.J., Jr.; Henderson, J.; Mills, D.; Mas, D.M.L.; Rennels, L.; Jantarasami, L.; Martinich, J.; et al. Climate Change Impacts on Harmful Algal Blooms in U.S. Freshwaters: A Screening-Level Assessment. Environ. Sci. Technol. 2017, 51, 8933–8943. [Google Scholar] [CrossRef]
  63. Paerl, H.W.; Paul, V.J. Climate change: Links to global expansion of harmful cyanobacteria. Water Res. 2012, 46, 1349–1363. [Google Scholar] [CrossRef]
  64. Marshall, I.P.G.; Starnawski, P.; Cupit, C.; Cáceres, E.F.; Ettema, T.J.G.; Schramm, A.; Kjeldsen, K.U. The novel bacterial phylum Calditrichaeota is diverse, widespread and abundant in marine sediments and has the capacity to degrade detrital proteins. Environ. Microbiol. Rep. 2017, 9, 397–403. [Google Scholar] [CrossRef] [PubMed]
  65. Kublanov, I.V.; Sigalova, O.M.; Gavrilov, S.N.; Lebedinsky, A.V.; Rinke, C.; Kovaleva, O.; Chernyh, N.A.; Ivanova, N.; Daum, C.; Reddy, T.; et al. Genomic Analysis of Caldithrix abyssi, the Thermophilic Anaerobic Bacterium of the Novel Bacterial Phylum Calditrichaeota. Front. Microbiol. 2017, 8, 195. [Google Scholar] [CrossRef] [PubMed]
  66. Jones, M.R.; Pinto, E.; Torres, M.A.; Dörr, F.; Mazur-Marzec, H.; Szubert, K.; Tartaglione, L.; Dell’Aversano, C.; Miles, C.O.; Beach, D.G.; et al. CyanoMetDB, a comprehensive public database of secondary metabolites from cyanobacteria. Water Res. 2021, 196, 117017. [Google Scholar] [CrossRef] [PubMed]
  67. Puddick, J.; Thomson-Laing, G.; Wood, S.A. Microcystins in New Zealand: A review of occurrence, congener diversity and cell quotas. N. Z. J. Bot. 2018, 57, 93–111. [Google Scholar] [CrossRef]
  68. Wood, S.A.; Maier, M.Y.; Puddick, J.; Pochon, X.; Zaiko, A.; Dietrich, D.R.; Hamilton, D.P. Trophic state and geographic gradients influence planktonic cyanobacterial diversity and distribution in New Zealand lakes. FEMS Microbiol. Ecol. 2016, 93, fiw234. [Google Scholar] [CrossRef]
  69. Liu, D.; Song, H.; Li, Y.; Huang, R.; Liu, H.; Tang, K.; Jiao, N.; Liu, J. The Transcriptional Repressor PerR Senses Sulfane Sulfur by Cysteine Persulfidation at the Structural Zn2+ Site in Synechococcus sp. PCC7002. Antioxidants 2023, 12, 423. [Google Scholar] [CrossRef]
  70. Wang, J.; Zhu, J.; Liu, S.; Liu, B.; Gao, Y.; Wu, Z. Generation of reactive oxygen species in cyanobacteria and green algae induced by allelochemicals of submerged macrophytes. Chemosphere 2011, 85, 977–982. [Google Scholar] [CrossRef]
  71. Erratt, K.J.; Creed, I.F.; Lobb, D.A.; Smol, J.P.; Trick, C.G. Climate change amplifies the risk of potentially toxigenic cyanobacteria. Glob. Chang. Biol. 2023, 29, 5240–5249. [Google Scholar] [CrossRef]
  72. Padovan, A.; Kennedy, K.; Gibb, K. A microcystin synthesis mcyE/ndaF gene assay enables early detection of microcystin production in a tropical wastewater pond. Harmful Algae 2023, 127, 102476. [Google Scholar] [CrossRef]
  73. Duan, X.; Zhang, C.; Struewing, I.; Li, X.; Allen, J.; Lu, J. Cyanotoxin-encoding genes as powerful predictors of cyanotoxin production during harmful cyanobacterial blooms in an inland freshwater lake: Evaluating a novel early-warning system. Sci. Total Environ. 2022, 830, 154568. [Google Scholar] [CrossRef]
  74. Omata, T. Structure, Function and Regulation of the Nitrate Transport System of the Cyanobacterium Synechococcus sp. PCC7942. Plant Cell Physiol. 1995, 36, 207–213. [Google Scholar] [CrossRef] [PubMed]
  75. Frías, J.E.; Flores, E.; Herrero, A. Nitrate assimilation gene cluster from the heterocyst-forming cyanobacterium Anabaena sp. strain PCC 7120. J. Bacteriol. 1997, 179, 477–486. [Google Scholar] [CrossRef] [PubMed]
  76. Ma, X.; Zhang, X.; Xia, J.; Sun, H.; Zhang, X.; Ye, L. Phenolic compounds promote the horizontal transfer of antibiotic resistance genes in activated sludge. Sci. Total Environ. 2021, 800, 149549. [Google Scholar] [CrossRef] [PubMed]
  77. Li, H.; Zhou, X.; Huang, Y.; Liao, B.; Cheng, L.; Ren, B. Reactive Oxygen Species in Pathogen Clearance: The Killing Mecha-nisms, the Adaption Response, and the Side Effects. Front. Microbiol. 2021, 11, 622534. [Google Scholar] [CrossRef] [PubMed]
  78. Jin, M.; Lu, J.; Chen, Z.; Nguyen, S.H.; Mao, L.; Li, J.; Yuan, Z.; Guo, J. Antidepressant fluoxetine induces multiple antibiotics resistance in Escherichia coli via ROS-mediated mutagenesis. Environ. Int. 2018, 120, 421–430. [Google Scholar] [CrossRef]
  79. Lira, F.; Vaz-Moreira, I.; Tamames, J.; Manaia, C.M.; Martínez, J.L. Metagenomic analysis of an urban resistome before and after wastewater treatment. Sci. Rep. 2020, 10, 8174. [Google Scholar] [CrossRef]
  80. MacFadden, D.R.; McGough, S.F.; Fisman, D.; Santillana, M.; Brownstein, J.S. Antibiotic resistance increases with local temperature. Nat. Clim. Chang. 2018, 8, 510–514. [Google Scholar] [CrossRef]
Figure 1. Changes in microbial community composition and cyanobacteria interactions under varying temperature and oxidative stress conditions. (a) Relative abundance of major microbial phyla in Cosseys Reservoir under different conditions: initial time point (T0), baseline temperature (22 °C), BaseH2O2 (22 °C + H2O2), normal temperature (24 °C), NormalH2O2 (24 °C + ROS), and projected future temperature (27 °C). (b) Microbial co-association network highlighting interactions (green: positive, red: negative) between cyanobacteria and other microbial taxa.
Water 16 02655 g001
Figure 2. Cyanotoxin producers and functional potential of the cyanobacteria under different treatment conditions. (a) Heatmap showing the z-scores of relative abundances of different cyanobacteria families across various conditions. (b) Linear regression of total mcy gene abundance (TPM) against total cyanobacterial abundance, showing a strong positive association (R2 = 0.99), indicating increased toxin production potential with rising cyanobacterial populations. (c) Linear regression of pstS gene abundance against total cyanobacterial abundance, also showing a positive association (R2 = 0.99), suggesting enhanced nutrient acquisition capabilities with increasing cyanobacterial populations. (d) Nitrogen metabolism pathway highlighting the log2FC change (TPM) of different upregulated genes in the future condition (27 °C) compared to the base condition (22 °C).
Water 16 02655 g002
Figure 3. Stacked bar chart showing the relative abundances of different (a) ARGs and (b) drug classes under various treatment conditions, highlighting the enhanced antibiotic resistance potential in response to temperature and ROS.
Water 16 02655 g003
Figure 4. Co-association network of ARBs and ARGs. The network illustrates the interactions between ARBs (blue nodes) and ARGs (orange nodes) under temperature-warming conditions. Node size represents the degree centrality, indicating the number of connections a node has within the network. Larger nodes have higher centrality, signifying their critical role in the network. Edges represent co-association relationships between ARBs and ARGs.
Water 16 02655 g004
Disclaimer/Publisher’s Note: The statements, opinions and data contained in all publications are solely those of the individual author(s) and contributor(s) and not of MDPI and/or the editor(s). MDPI and/or the editor(s) disclaim responsibility for any injury to people or property resulting from any ideas, methods, instructions or products referred to in the content.