Abstract
This paper presents the application of the Comparison of Flow Pattern Distribution (CFPD) method for detecting water leakage and understanding consumption behaviors at both microscale and macroscale. Implemented at Lille University’s Scientific Campus, this research utilizes Automated Meter Reading (AMR) to collect real-time water supply and consumption data. The research successfully identified several significant leak events by analyzing this data with the CFPD method on weekly and daily scales. The analysis of the data resulted in identifying the seasonal and operational consumption patterns across different periods of the year. The findings highlight the effectiveness of the CFPD method in achieving water conservation and operational efficiency, consequently contributing to the UN Sustainable Development Goal (SDG) 6 concerning clean water and sanitation.
1. Introduction
Water is an essential resource, fundamental to life, economic activities, and environmental sustainability. The efficient management of water resources, particularly in addressing water leaks, is crucial for achieving the United Nations’ Sustainable Development Goals (SDGs), especially Goal 6, which aims to ensure the availability and sustainable management of water and sanitation for all. Water leaks contribute to significant water losses, financial costs, and environmental degradation. Water security can be enhanced, and ecosystems can be protected by addressing leaks, thereby supporting the broader objectives of sustainable development [1]. Effective water management practices also support other SDGs, such as Goal 11 (Sustainable Cities and Communities) by ensuring resilient infrastructure and Goal 13 (Climate Action) by reducing the carbon footprint associated with water loss [2]. Integrating water management practices, including leak detection and repair, supports economic, social, and environmental objectives, fostering sustainability and resilience in various sectors such as food and energy [3].
In recent years, the integration of advanced technologies in water management, such as smart water metering systems, has improved the monitoring and management of water distribution networks [4,5,6,7,8,9,10,11]. These systems employ advanced sensors and metering technologies to measure water usage more accurately and frequently than traditional methods [12,13]. By integrating Internet of Things (IoT) technologies, smart water meters can transmit data in real-time, allowing for immediate analysis and response, thereby enabling water utilities to detect anomalies such as leaks and bursts promptly, significantly reducing water loss, promoting conservation [14,15,16], and decreasing the carbon footprint associated with water supply [17]. For instance, a case study involving the Gaula water distribution network in Portugal demonstrated that implementing smart water grids and digital twin models resulted in a potential reduction of water losses by approximately 80% [18]. Smart water metering systems enhance customer engagement by providing detailed, real-time water usage data through user-friendly interfaces and mobile apps. This transparency helps build trust with utilities, boosts customer satisfaction, and promotes proactive water management by allowing users to set targets and receive alerts about leaks or excessive use [19,20,21,22,23]. A study conducted by Britton et al. focused on evaluating the impact of communication strategies on encouraging households to repair detected water leaks. A total of 22,000 residential water meters were upgraded to smart meters with data loggers that recorded hourly consumption. Households identified with leaks were exposed to various communication interventions, ranging from basic information to detailed explanations of water loss, with some also offering financial incentives for repairs. The results demonstrated the effectiveness of these strategies, leading to an 89% reduction in post-meter leakage among households that received tailored information and incentives [24].
The real-time data collected from smart water meters also provide valuable insights into consumption patterns, empowering utilities to make well-informed decisions regarding water management policies and infrastructure management [25]. For instance, a study conducted by Cominola et al. applied data mining techniques to smart meter data from 327 households in Southeast Queensland and Melbourne, Australia, uncovering distinct water use behaviors such as showering, clothes washing, and irrigation. These insights revealed significant variations in time-of-use and intensity-of-use among households, providing utilities with detailed consumption patterns that can be used to design customized demand management strategies and enhance water conservation efforts [26].
A data-driven approach supports the optimization of water supply, enhances resource sustainability, and enables billing systems that reflect actual consumer usage, encouraging water-saving behaviors of consumers [27]. Additionally, advanced data-driven methods can analyze water consumption more effectively and detect leaks [28,29,30]. Machine learning and statistical analysis enable the analysis of extensive datasets to identify standard usage patterns and highlight deviations that may indicate leaks or unauthorized usage [31,32]. For example, K-means clustering and learning vector quantization (LVQ) have emerged as powerful tools for detecting leaks within water distribution networks. These methods have achieved classification accuracies as high as 93.98%, making them highly effective for real-time leak detection. However, their performance can be impacted by data imbalances and the quality of the available data [33]. Computational algorithms using principal component analysis effectively monitor daily operations and detect leaks in district-metered areas, enhancing real-time data analysis and management decisions [34]. Hybrid models combining machine learning with hydraulic modeling improve leak prediction reliability and accuracy and have been validated in real-world tests. However, the computational complexity of these methods and the need for careful parameter tuning can limit their scalability and ease of implementation [35,36].
Innovations in low-cost and easier-to-implement monitoring solutions, particularly for urban environments, address unique operational challenges and provide actionable insights for efficient water management. One such innovation is the CFPD method, a data-driven approach to analyze flow patterns within water distribution systems to detect leaks and other anomalies [37]. CFPD distinguishes between consistent changes, like seasonal demand, and inconsistent ones, like leaks. This method has been effectively applied in residential districts metered areas (DMAs), demonstrating its utility in real applications by enabling more precise leak detection and efficient water management [38,39].
Unlike previous studies that focused on residential blocks, this paper extends the application of the CFPD method for the optimal management of the complex and degraded water supply system of the Scientific City campus of Lille University. The campus environment includes diverse water usage patterns due to varied activities such as academic, residential, recreational, and administrative functions. Water consumption changes are evaluated at two scales: district metered areas (DMAs) and individual building meters. The evaluation provides a comprehensive understanding of water usage and leakage detection at the macro (campus-wide)- and micro (individual building)-levels, considering a block analysis based on weekly and daily scales. By focusing on a complex and dynamic environment, this research aims to explore the adaptability and effectiveness of CFPD in diverse settings, thereby contributing to the broader application of data-driven methods in water leak management and supporting sustainable development goals.
2. Materials and Methods
2.1. CFPD Method
The Comparison of Flow Pattern Distribution (CFPD) is a data analysis technique that examines flow datasets to detect and explain variations in water usage [39,40]. This method involves four key steps [11]:
- Standardize Dataset Lengths: Ensure the compared datasets have equal length vectors covering the same period.
- Order the Data: Sort each dataset in ascending order from the smallest to the largest values.
- Plot the Data: Plot the two periods being compared, placing the reference dataset on the horizontal x-axis.
- Determine Linear Fit: Calculate a linear best fit with a slope (a) and intercept (b).
The linear fit follows the equation y = ax + b. The slope (a) and intercept (b) help identify deviations from the baseline, where a = 1 and b = 0. When comparing two similar datasets, the CFPD yields a straight line. Deviations can indicate different types of changes:
- Inconsistent Change: An inconsistent change occurs when the curves are similar in shape but separated by a constant offset, indicating a continuous amount of leakage. The intercept (b) represents this offset. Such changes can result from new leaks, unusual water usage, leak repairs, or operational activities like network cleaning.
- Consistent Change: A consistent change occurs when one curve is a scaled version of the other, corresponding to the slope (a). This type of change can be due to variations in population, seasonal changes, holidays, etc.
The CFPD method produces two antisymmetric matrices, one for the slope (a) and another for the intercept (b). A MATLAB R2024a code has been developed to compute the matrixes used in the CFPD method. These matrices use a blue-to-white-to-red color map to indicate deviations from 1 and 0, respectively. The script is developed to consider a block analysis based on comparing the flow pattern by weeks. It is refined to identify the changes on a daily scale. White represents the baseline condition, where the flow pattern remains consistent, meaning the slope a = 1 and the intercept b = 0. This indicates no significant change in demand or leakage, suggesting that the water usage follows the expected, established patterns. Blue is used to indicate negative or minor deviations from the baseline. When the intercept (b) is negative, the flow data suggests a consistent decrease or reduction in water usage, possibly due to reduced demand or leak repairs. The lighter shades of blue represent smaller deviations, while darker shades signify larger negative deviations, reflecting a more pronounced decline or consistent drop in flow. Red highlights significant positive deviations from the baseline. This occurs when the intercept (b) is positive, indicating a consistent increase in flow, which could be due to increased demand, a new leak, or another anomaly not following the established pattern.
2.2. Data Collection
Data were collected from a smart water metering of the water supply network of the Scientific Campus of Lille University, located in northern France. The network comprises 15 km of over 60-year-old grey cast iron pipes and serves a community of approximately 25,000 users in the North of France. The network supplies water for hundreds of buildings for teaching, research, administration, services, students’ residences, restaurants, and entertainment activities. The smart water monitoring system includes 93 smart water meters, with Automated Meter Reading (AMR) technology to measure water consumption hourly in 80 buildings and 13 supply points and transmit the recorded data at daily intervals [41]. The water network is divided into district metered areas (DMAs), where the CFPD analysis is applied to data from the bulk meters and water meters installed at the supply points of the buildings. The bulk meters monitor water flow at the entry and exit points of each DMA, while the building meters provide detailed flow data within the DMA. When the CFPD analysis triggers a leakage alarm, a targeted acoustic survey is conducted in the suspected DMA to pinpoint the leak’s exact location. At the microscale, within buildings, leaks are typically associated with sanitation accessories, and the responsible person in the building is alerted to identify and repair the leak.
2.3. Data Analysis
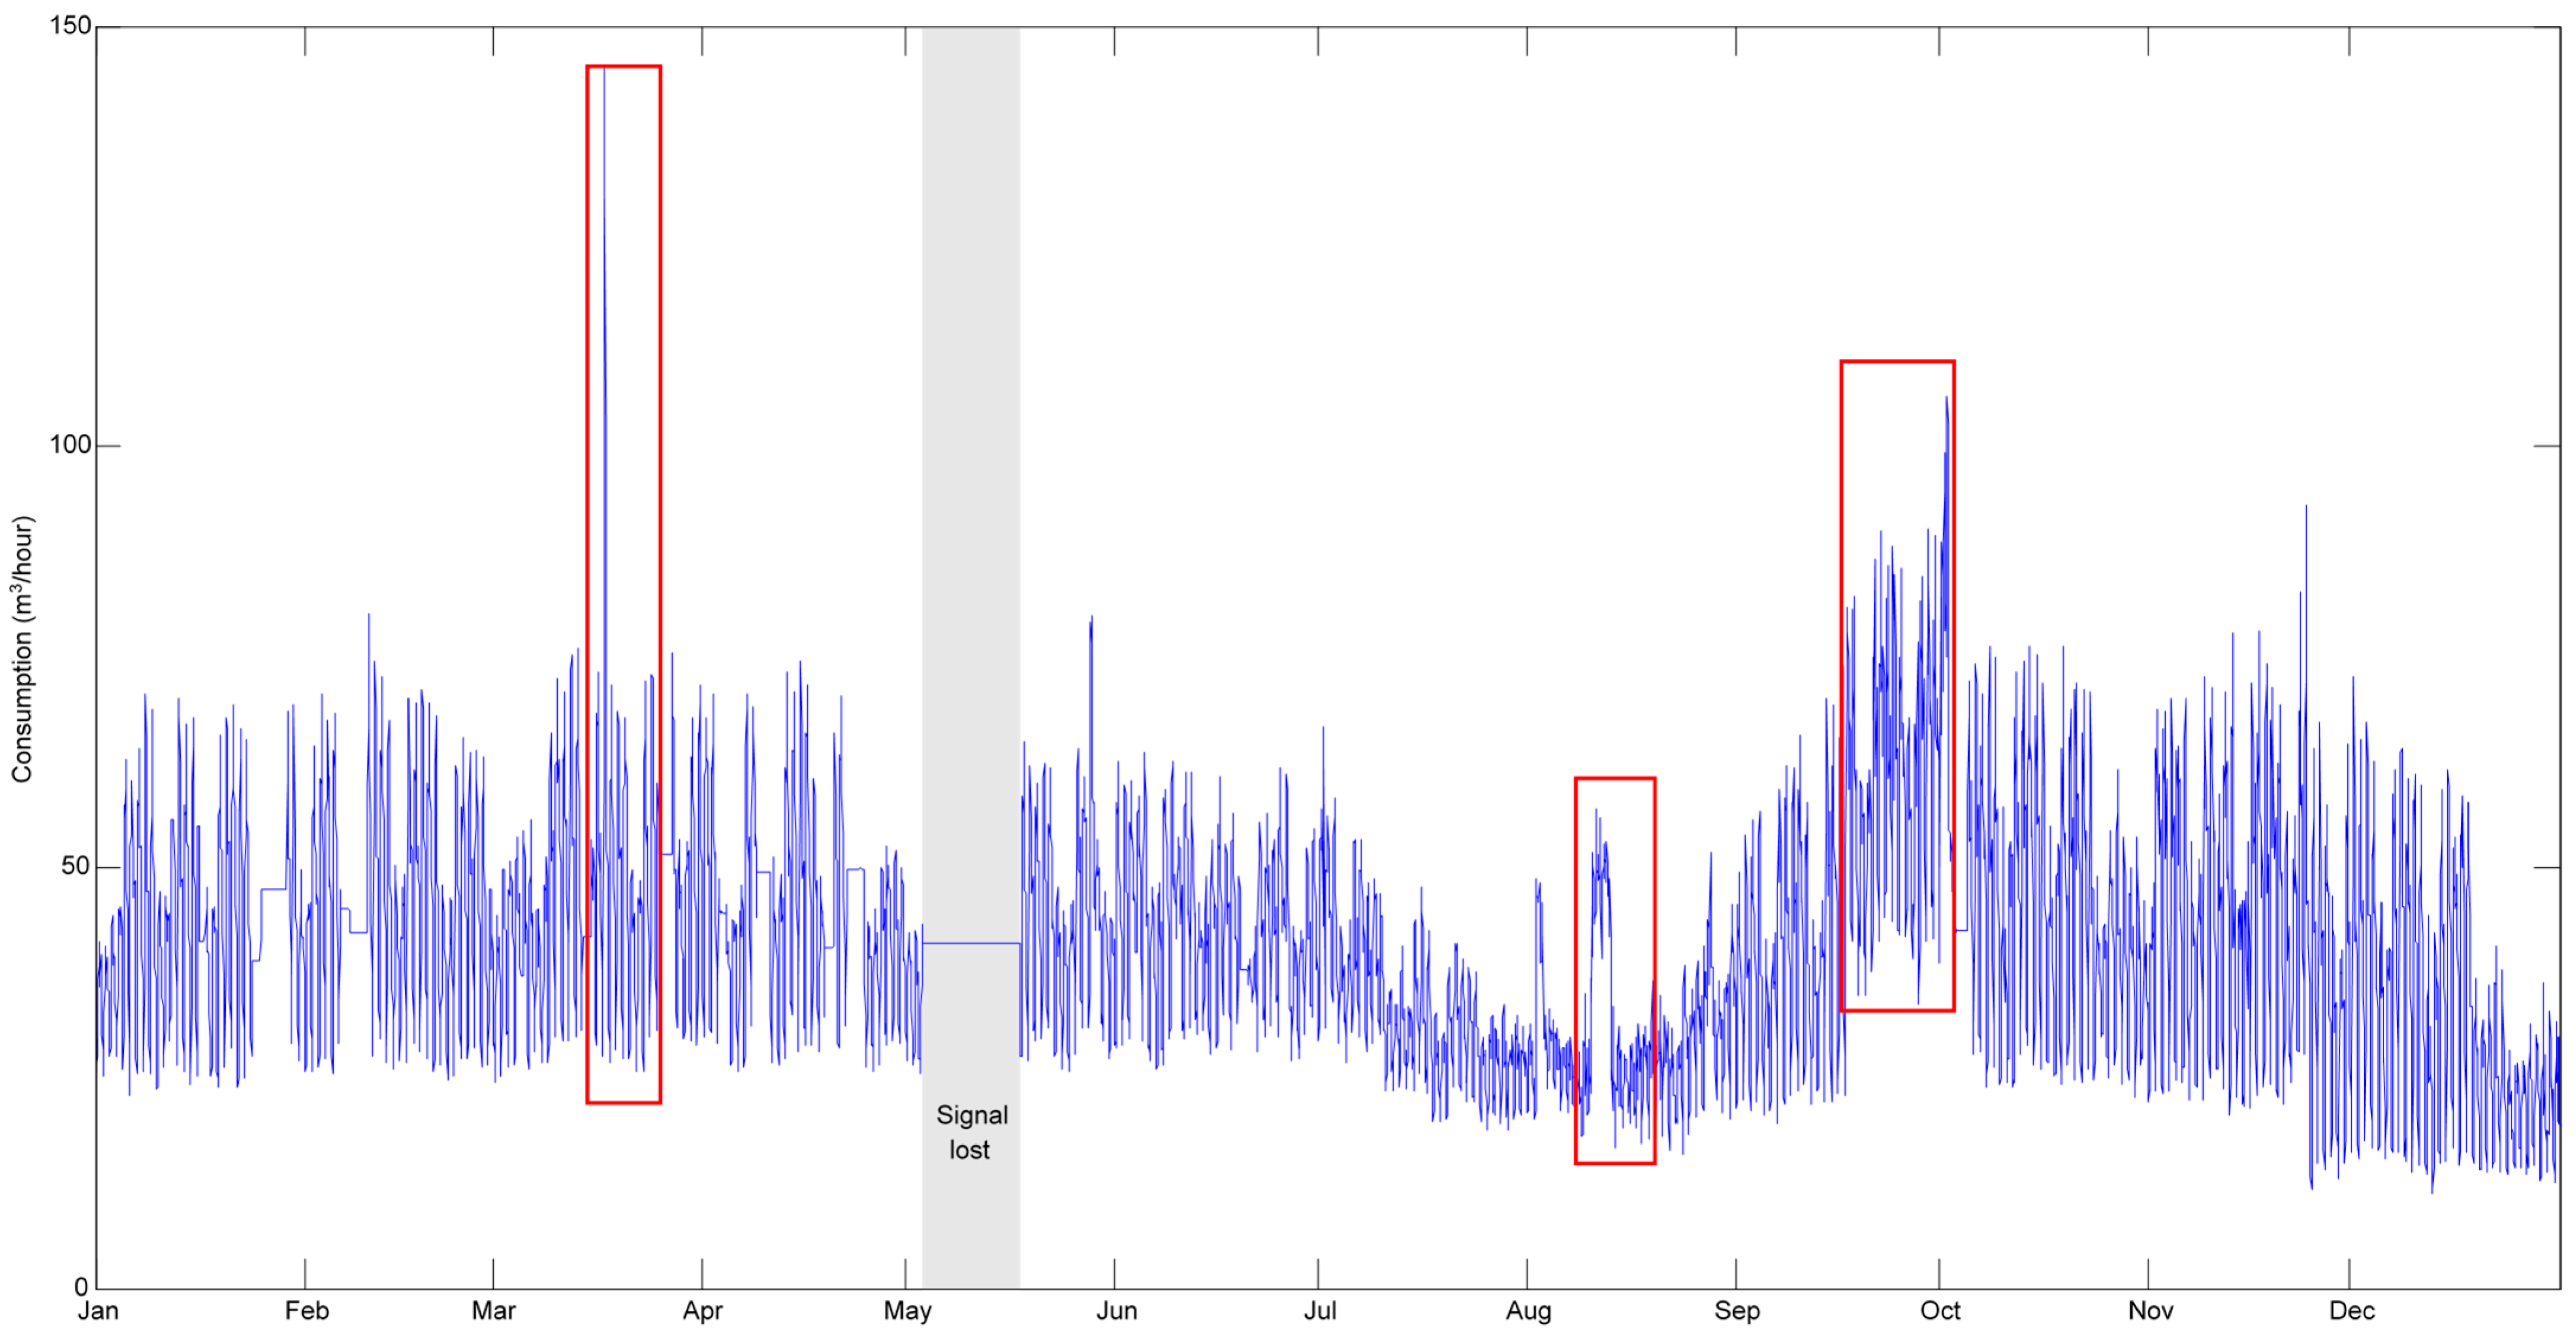
The analysis of water consumption data from the smart water meters offers valuable insights into the usage patterns and trends over time. The average hourly water consumption on campus is approximately 41.49 m3/h, with a moderate variability indicated by a standard deviation of 13.30 m3/h. This suggests that while the overall consumption is stable, there are periods of increased or decreased usage, possibly linked to specific campus activities or leaks. Figure 1 illustrates the hourly water consumption profile for 13 bulk meters for a year. It shows two distinct consumption profiles: one for business days and another for weekends and holidays. This distinction becomes less clear during low consumption periods, particularly during summer holidays. Each week shows five daily peaks corresponding to consumption from Monday to Friday, indicating higher consumption during the week than the weekend. The maximum recorded consumption is 145 m3/h. The profile never dropped below 11.67 m3/h, recorded at 5 am on 25 November. Based on Figure 1, three periods of abnormal values have been identified, indicating potential leaks, which will be analyzed using the CFPD method:
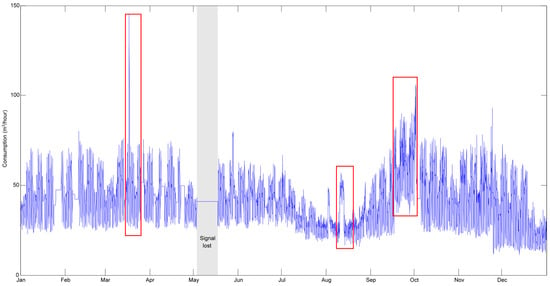
Figure 1.
Hourly water consumption profile for 13 bulk meters for a whole year (red boxes refer to potential leaks).
- Potential Leak I: Week 12 (16 March–22 March), with a peak consumption of 145 m3/h at 1 pm on 17 March.
- Potential Leak II: Week 33 (10 August–16 August), where increased consumption is observed.
- Potential Leak III: Weeks 38–40 (14 September–4 October), where another period of increased consumption is detected.
The hourly water consumption profile highlights the distinct patterns during university holiday periods:
- Winter holidays (week 10): The highest consumption is 55.68 m3/h on 6 March at 1 p.m., while the lowest is 25.06 m3/h on 2 March at 5 a.m.
- Spring holidays (weeks 18 and 19): The lowest consumption recorded is 25.44 m3/h on 3 May at 6 a.m.
- Summer holidays (weeks 30 to 35): A potential leak is indicated on 10 August at 3 p.m., with consumption dropping to 15.79 m3/h on 24 August at 3 a.m.
- Christmas holidays (weeks 52 and 53): The maximum consumption reaches 40.65 m3/h on 22 December at 2 p.m., and the minimum is 12.61 m3/h on 31 December at 5 a.m.
The CFPD method was tested to analyze its efficiency in detecting leaks from the flow pattern of the total supply zone at a macroscale and micro (individual building)-level, considering a block analysis based on weekly and daily scales. Following the descriptive analysis, three potential leaks have been identified in the flow pattern of the bulk meters. These events with different anomalies were used to analyze the performance of the CFPD method. The data were first preprocessed, which involved checking for any signal loss and ensuring that no water meters registered null values by excluding affected periods to maintain accuracy. The dataset was divided into two parts. The first includes the water consumption from week 1 to week 17, while the second covers week 23 through the end of the year. Data related to weeks 18 to 22 were excluded due to a telemetry problem and a signal loss.
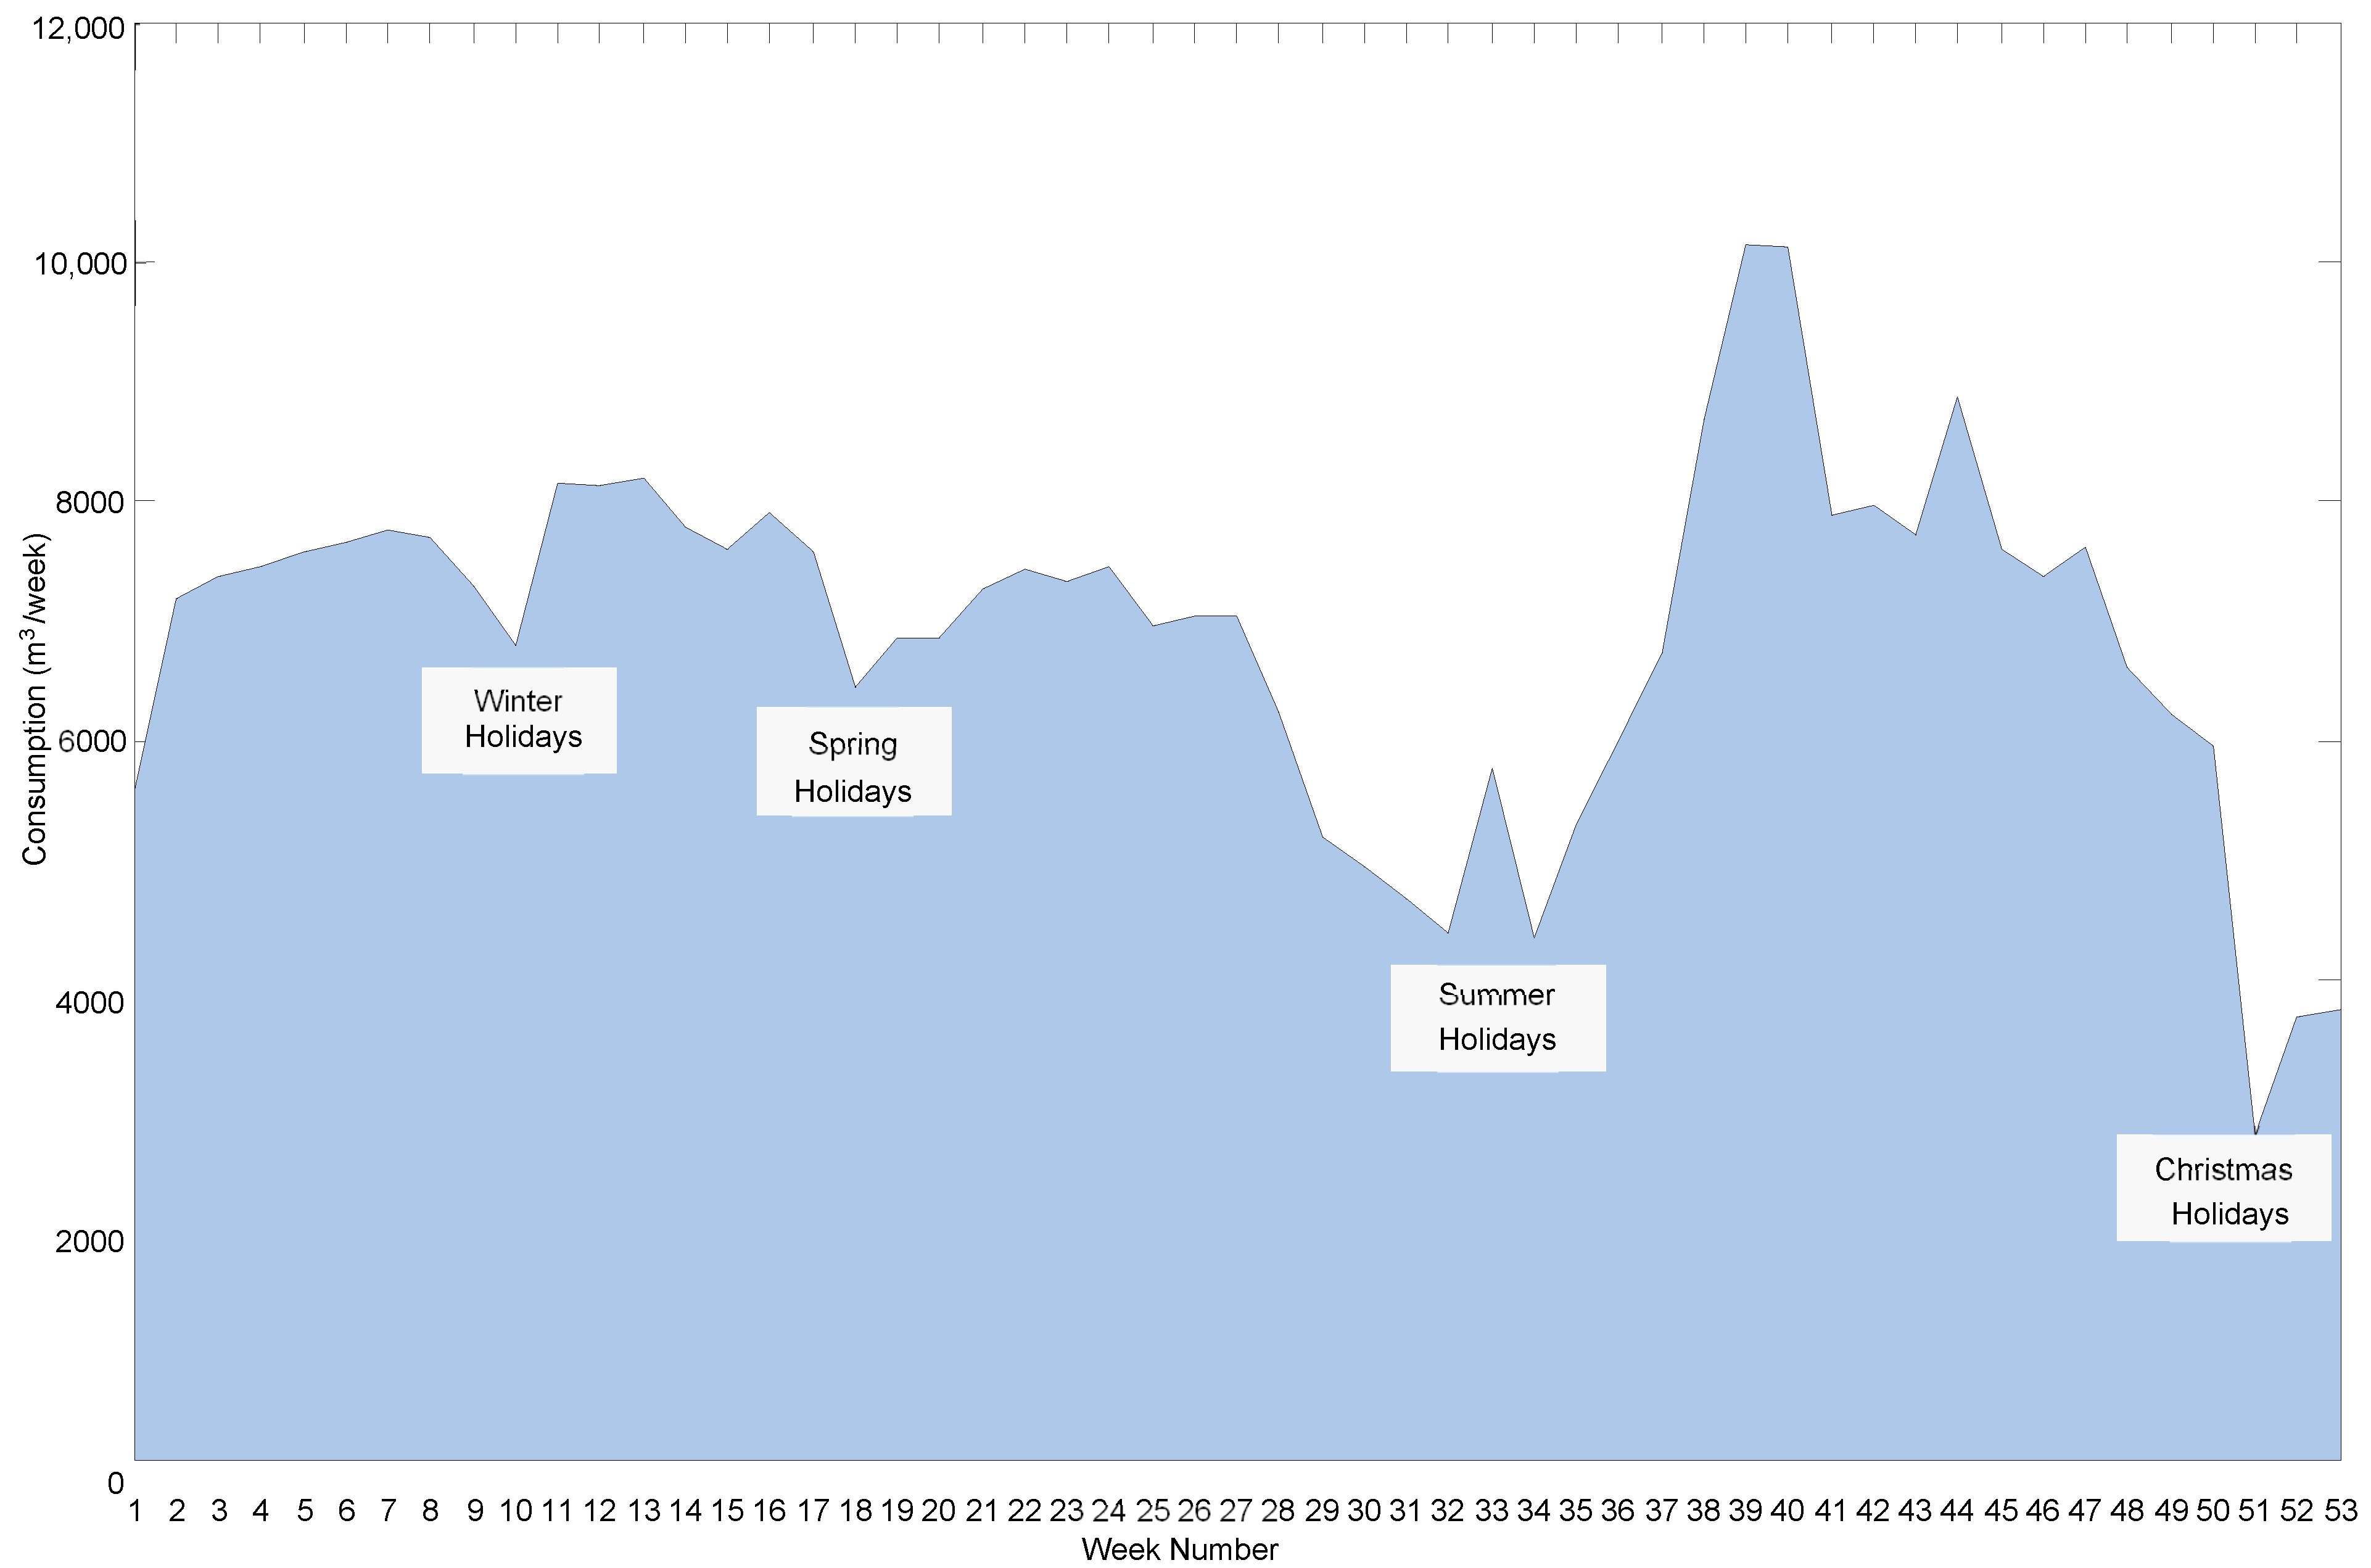
In order to identify usage patterns and quantify the impact of seasonal variations, a weekly analysis of water consumption was conducted. Figure 2 shows the weekly water consumption profile across the campus, highlighting distinct trends throughout the year. A low consumption period, with usage below 6000 m3 per week, is observed during the summer holidays from mid-July to the end of August (weeks 29 to 36), primarily due to reduced campus activity and fewer occupants. Similarly, the winter holidays (weeks 9 to 10) and spring holidays (weeks 17 to 18) also present reduced consumption, staying below 7000 m3 per week, as a result of decreased usage when the majority of students and staff are absent. Periods of more intensive consumption are noted from March to April (weeks 11 to 17), where the average consumption is 7900 m3 per week, with a peak of 8190 m3 per week. Another period of elevated usage occurs from May to June (weeks 21 to 27), with an average of 7220 m3 per week and a maximum of 7450 m3 per week. The highest levels of water consumption are observed from September to November (weeks 38 to 47), where the average is 8400 m3 per week, reaching a peak of 10,140 m3 per week. This significant increase is primarily attributed to the connection of newly constructed residential buildings, combined with the increased activities and higher occupancy levels as students return after the summer break, leading to a substantial rise in overall water usage. An unusual increase in consumption during one of the summer weeks (week 33) suggests a possible leak, which will be investigated further. Additionally, there is a significant decrease in water usage during the New Year holidays (week 1) compared to the Christmas holidays (weeks 51 to 53), with consumption dropping from approximately 5850 m3/week to 3925 m3/week, representing a decrease of around 33%. This reduction can be attributed to the repairs of detected leaks.
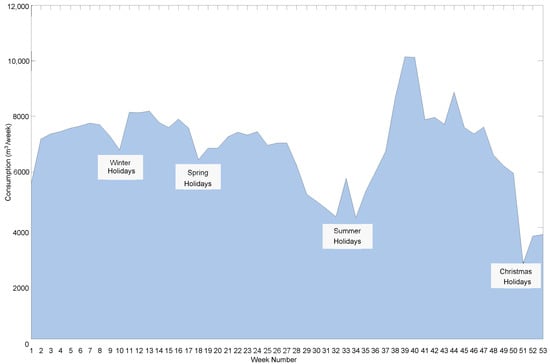
Figure 2.
Weekly water consumption profile for 13 bulk meters for a whole year.
3. Results
3.1. Application of the CFPD at the Macroscale
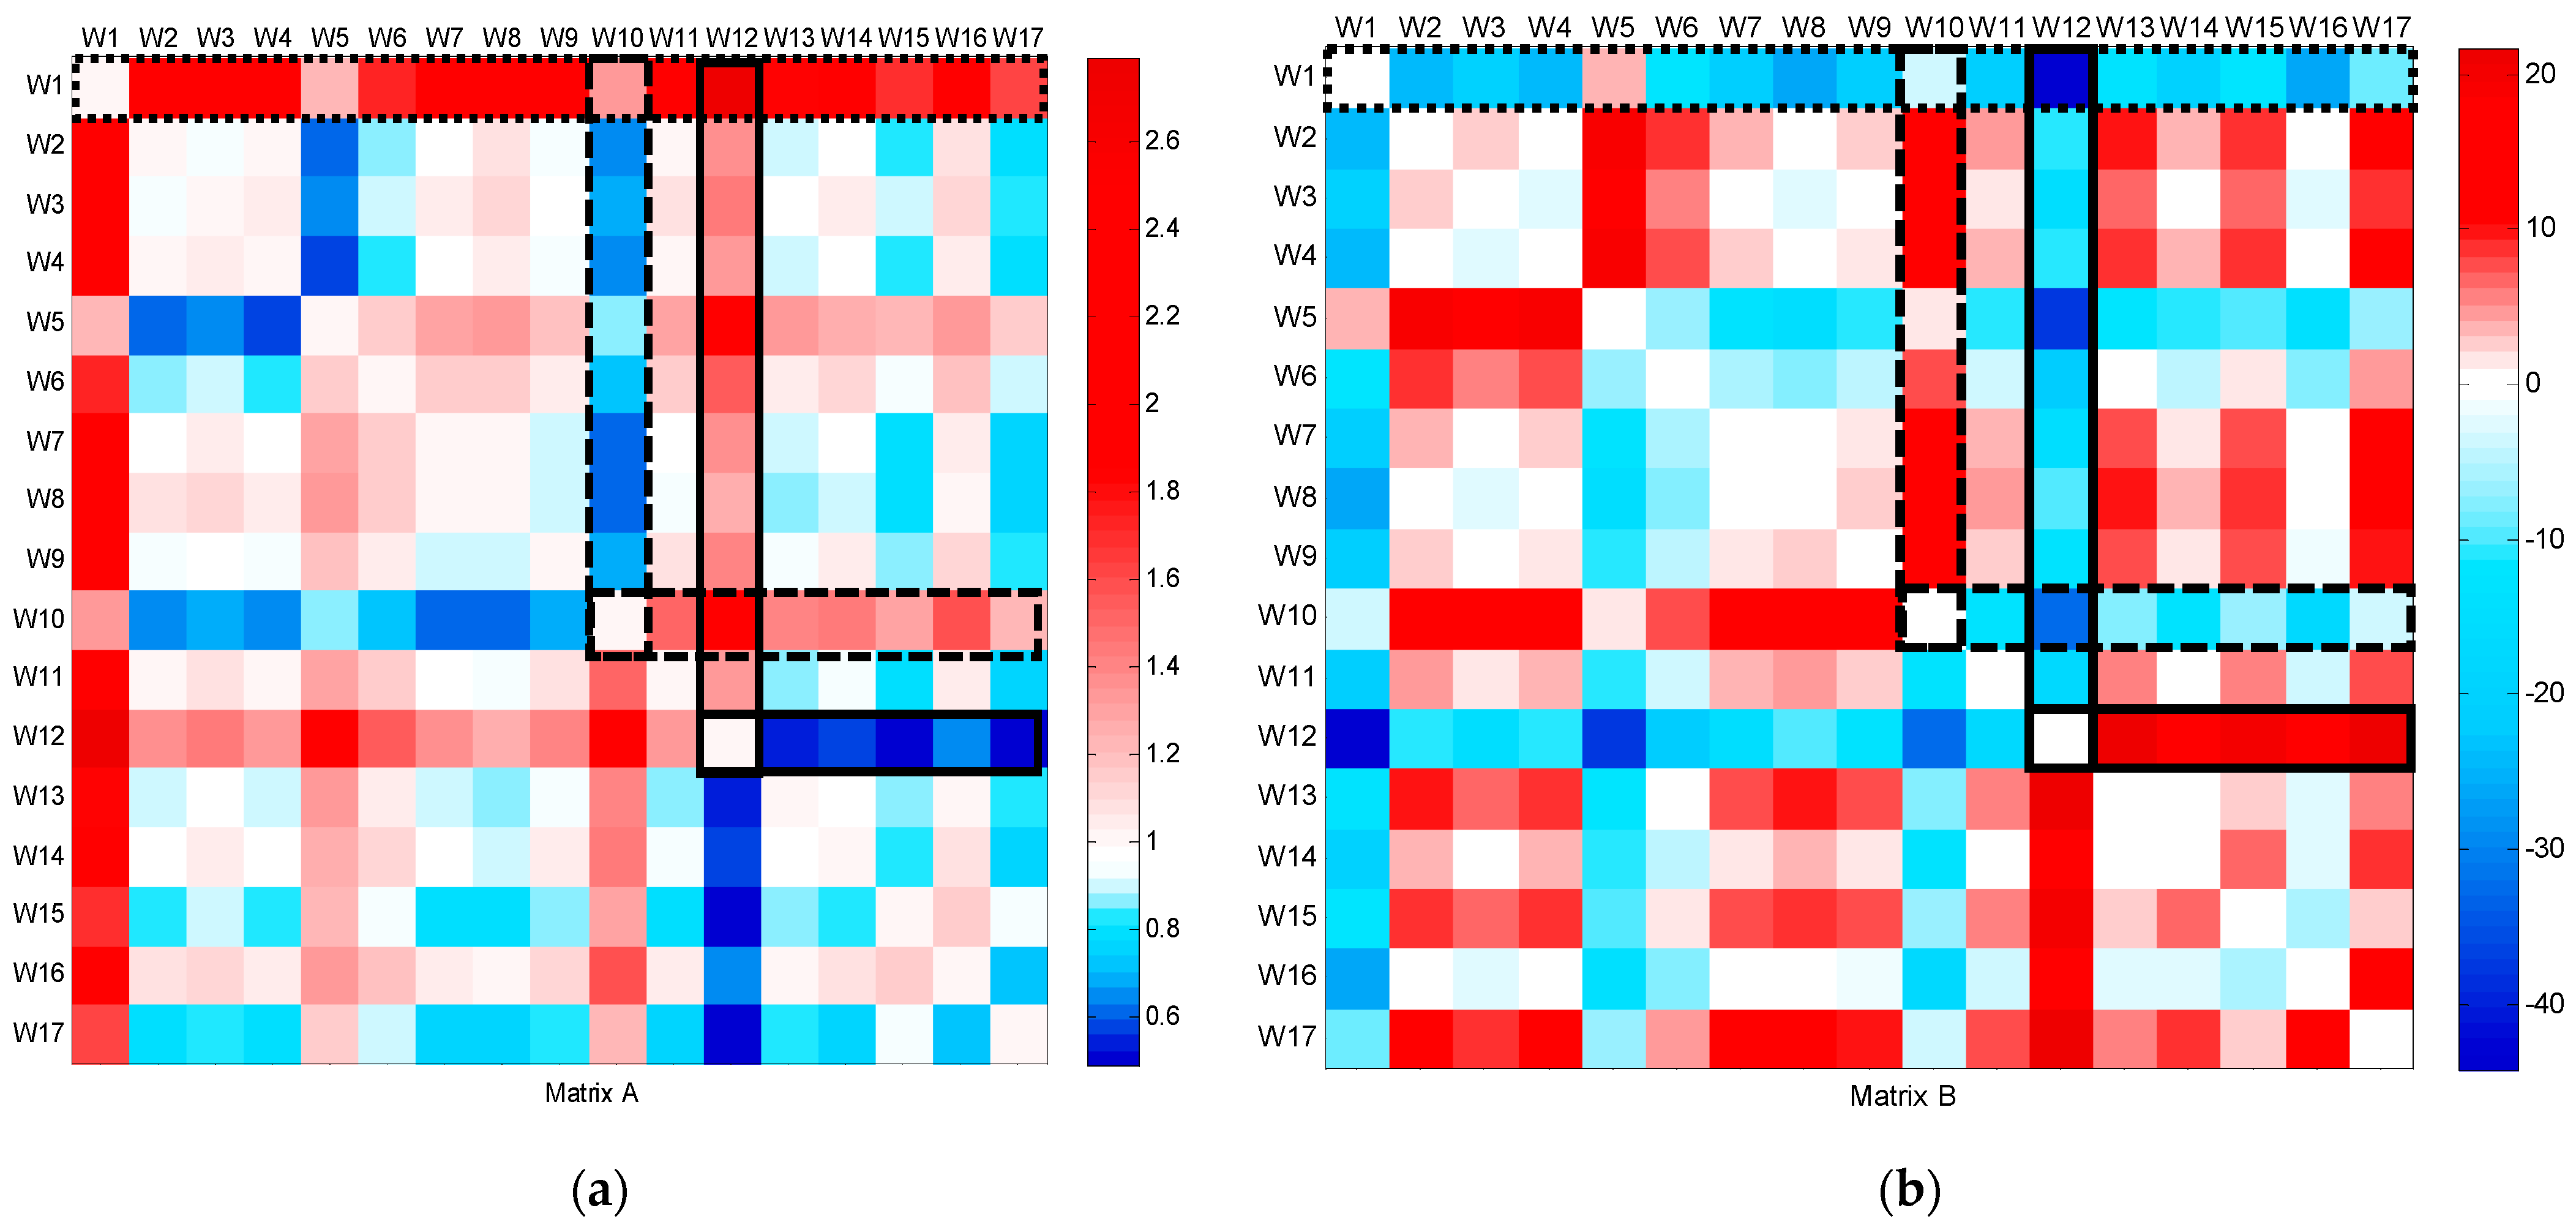
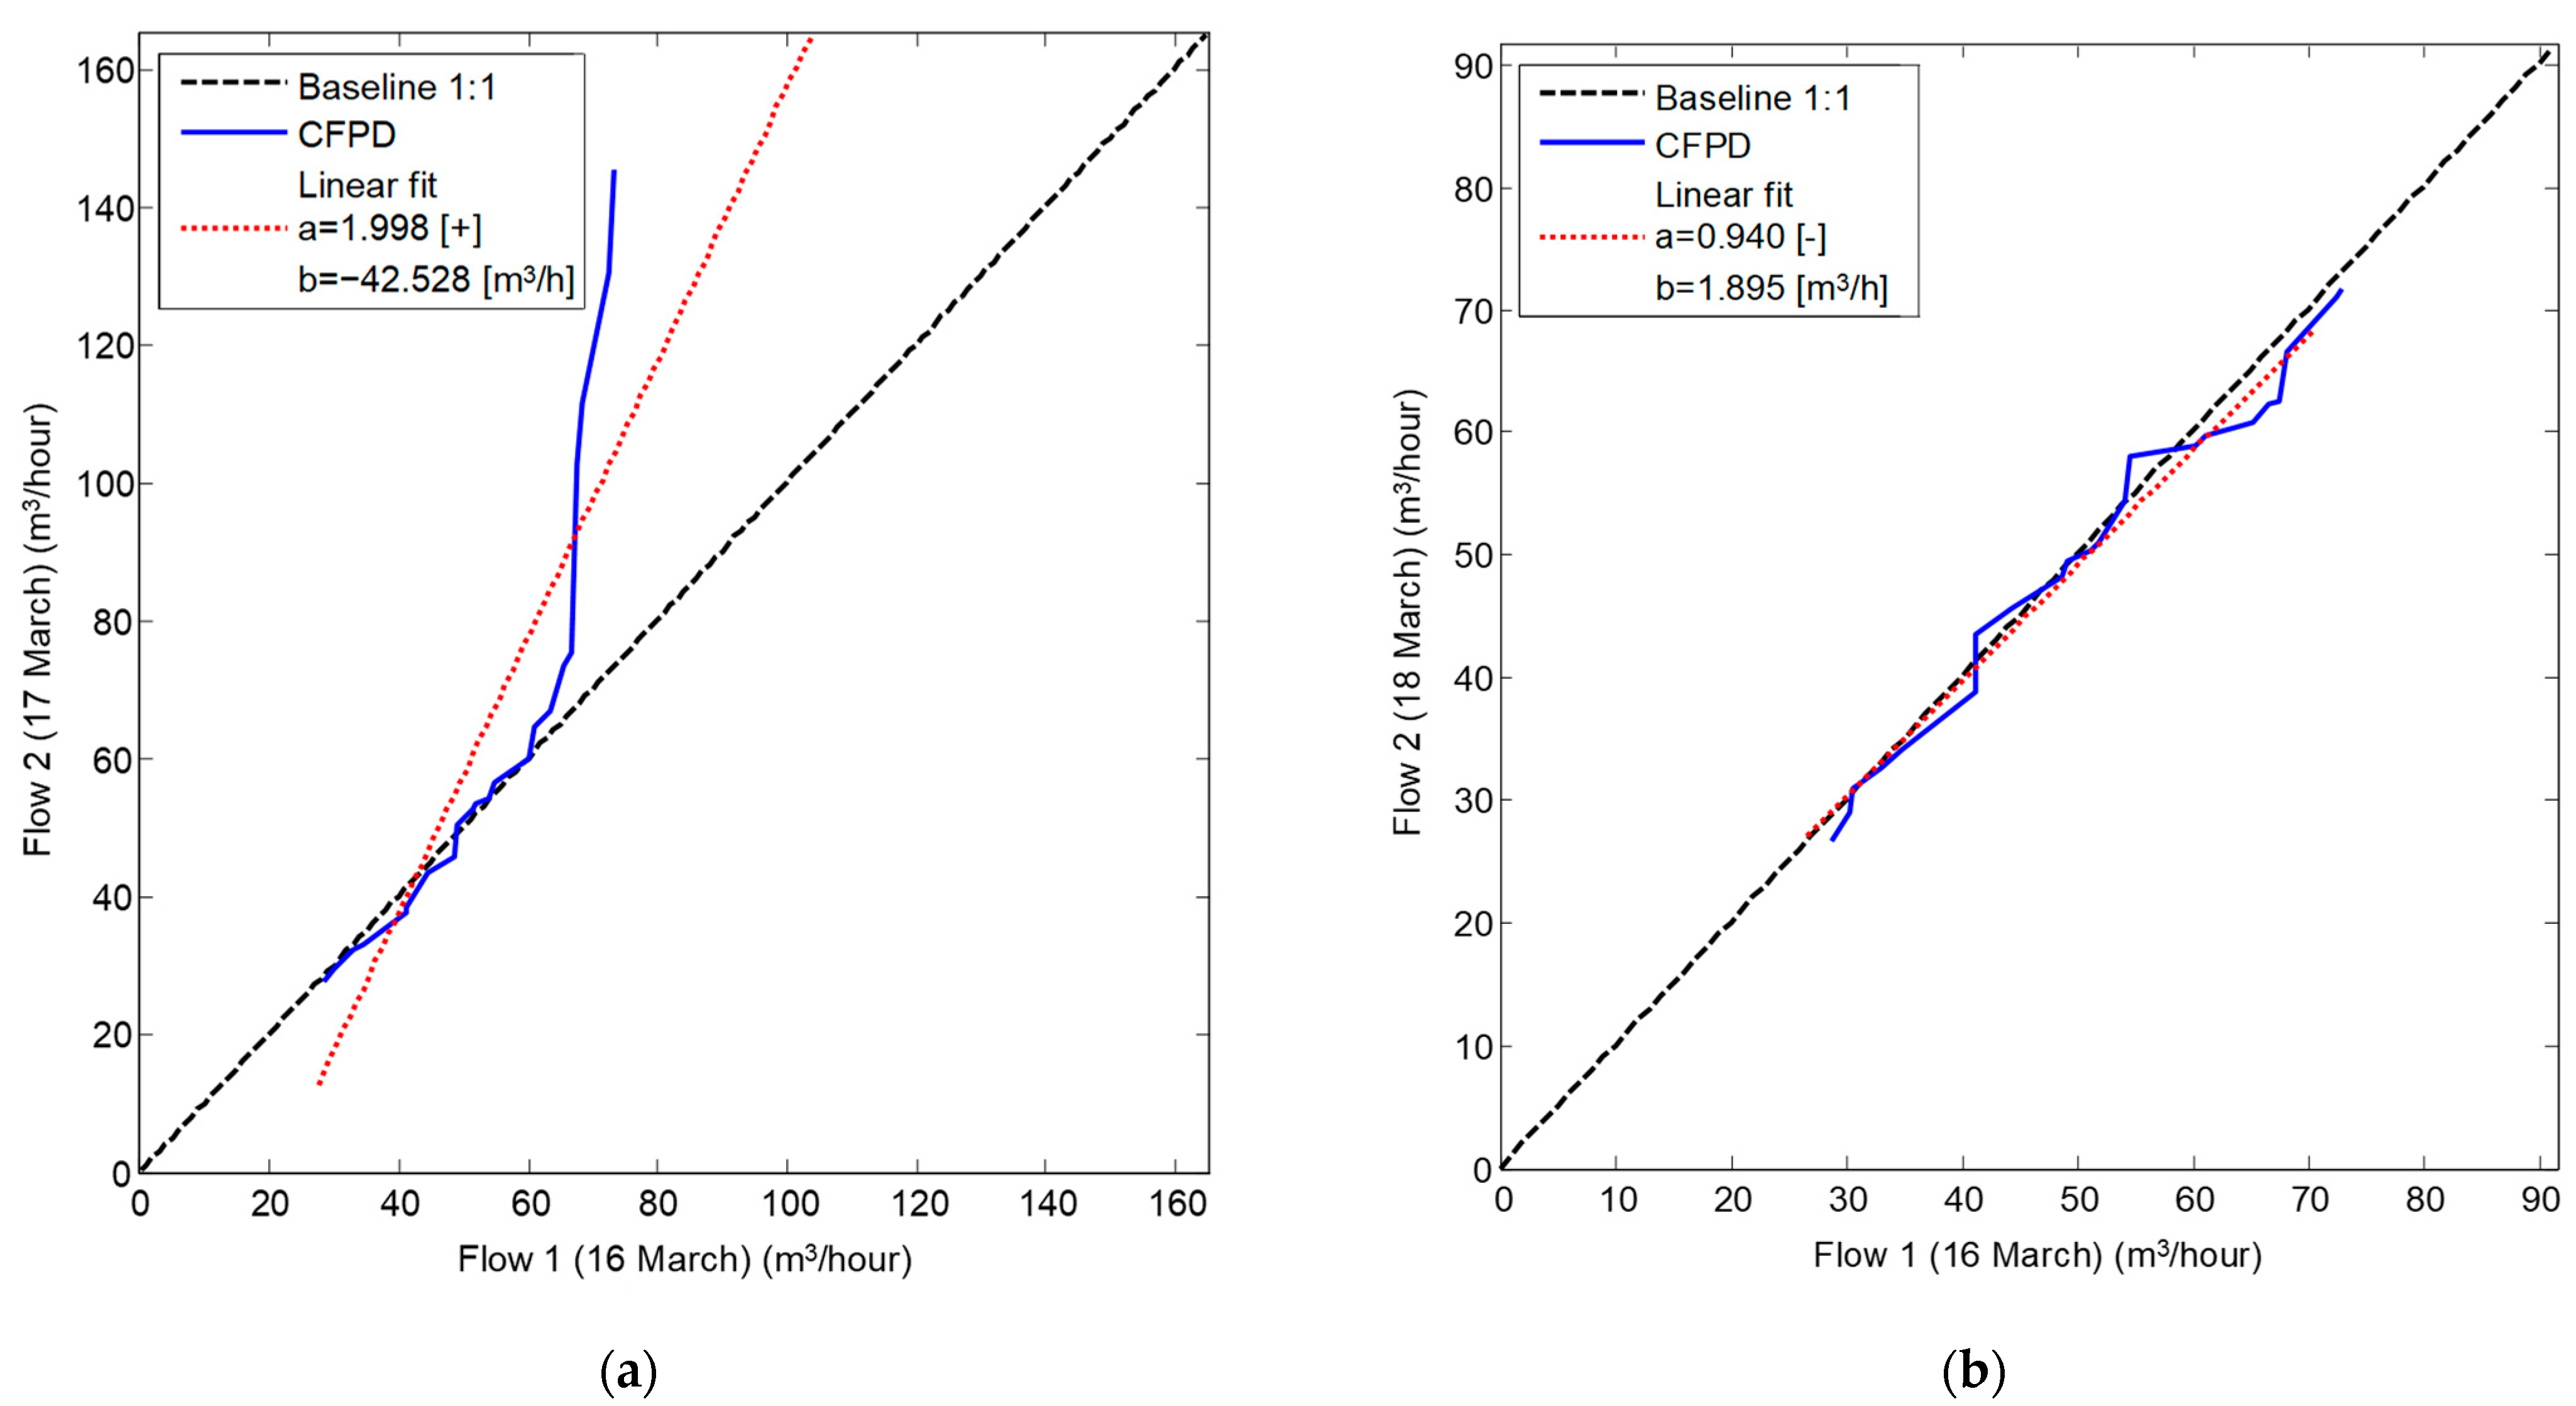
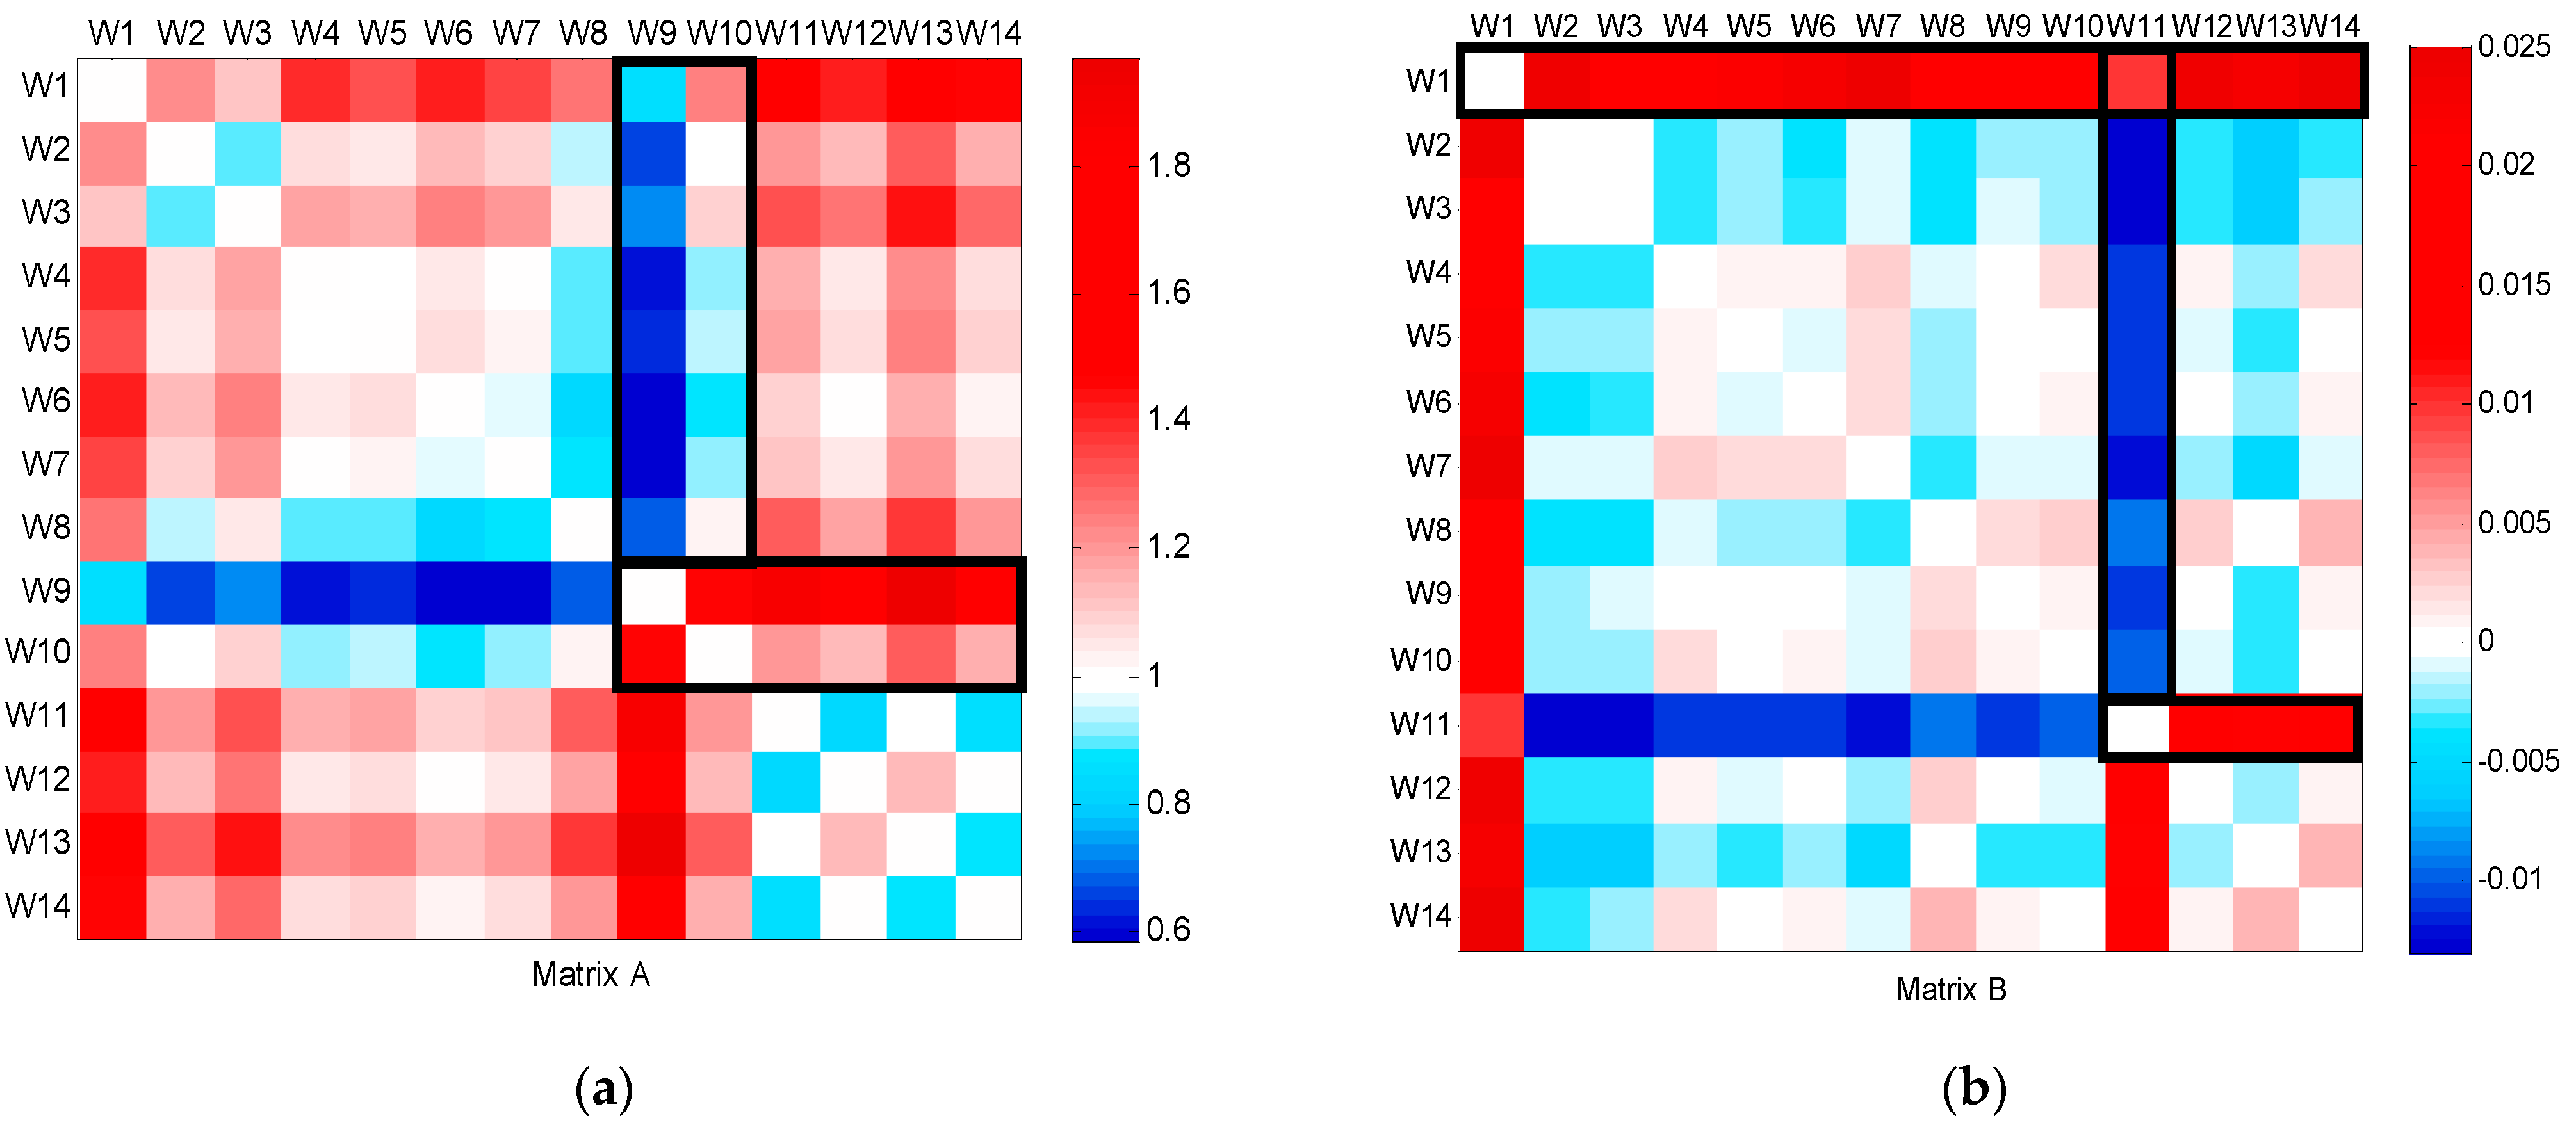
The CFPD method was applied to analyze the flow patterns of data collected from bulk water meters installed at the campus’s supply points from week 1 to the end of week 17, as shown in Figure 3. The slope (a) of the CFPD method indicated that water consumption during the working weeks was scaled by a factor ranging from 1.3 to 2.8. A consistent decrease in week 5 was attributed to a telemetry problem, while the reduction in slope during week 10 corresponded to the winter holidays, with consumption dropping to approximately half of the volume in ordinary weeks (a = 0.5). An anomaly was detected in week 12, where simultaneous deviations in the slope (a > 1) and intercept (b < 0) matrices were observed, indicating a burst during high consumption hours on March 17. This was confirmed by comparing the flow patterns between 16 March–17 March and 16 March–18 March, as shown in Figure 4, which showed a deviation from the baseline during the burst. After the leak was repaired, the CFPD plot returned to the baseline.
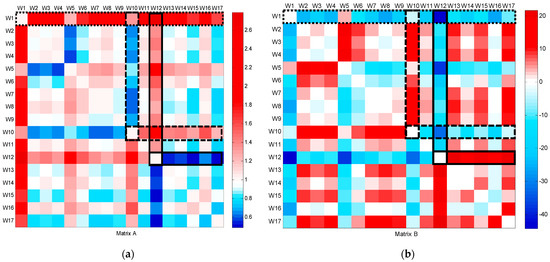
Figure 3.
CFPD block analysis on a weekly basis of the total water supply dataset from week 1 to week 17: (a) slope matrix (A); (b) intercept matrix (B).
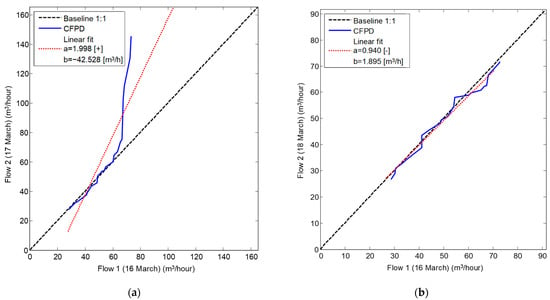
Figure 4.
CPFD plot combining flow patterns on a daily basis: (a) 16 March–17 March; (b) 16 March–18 March.
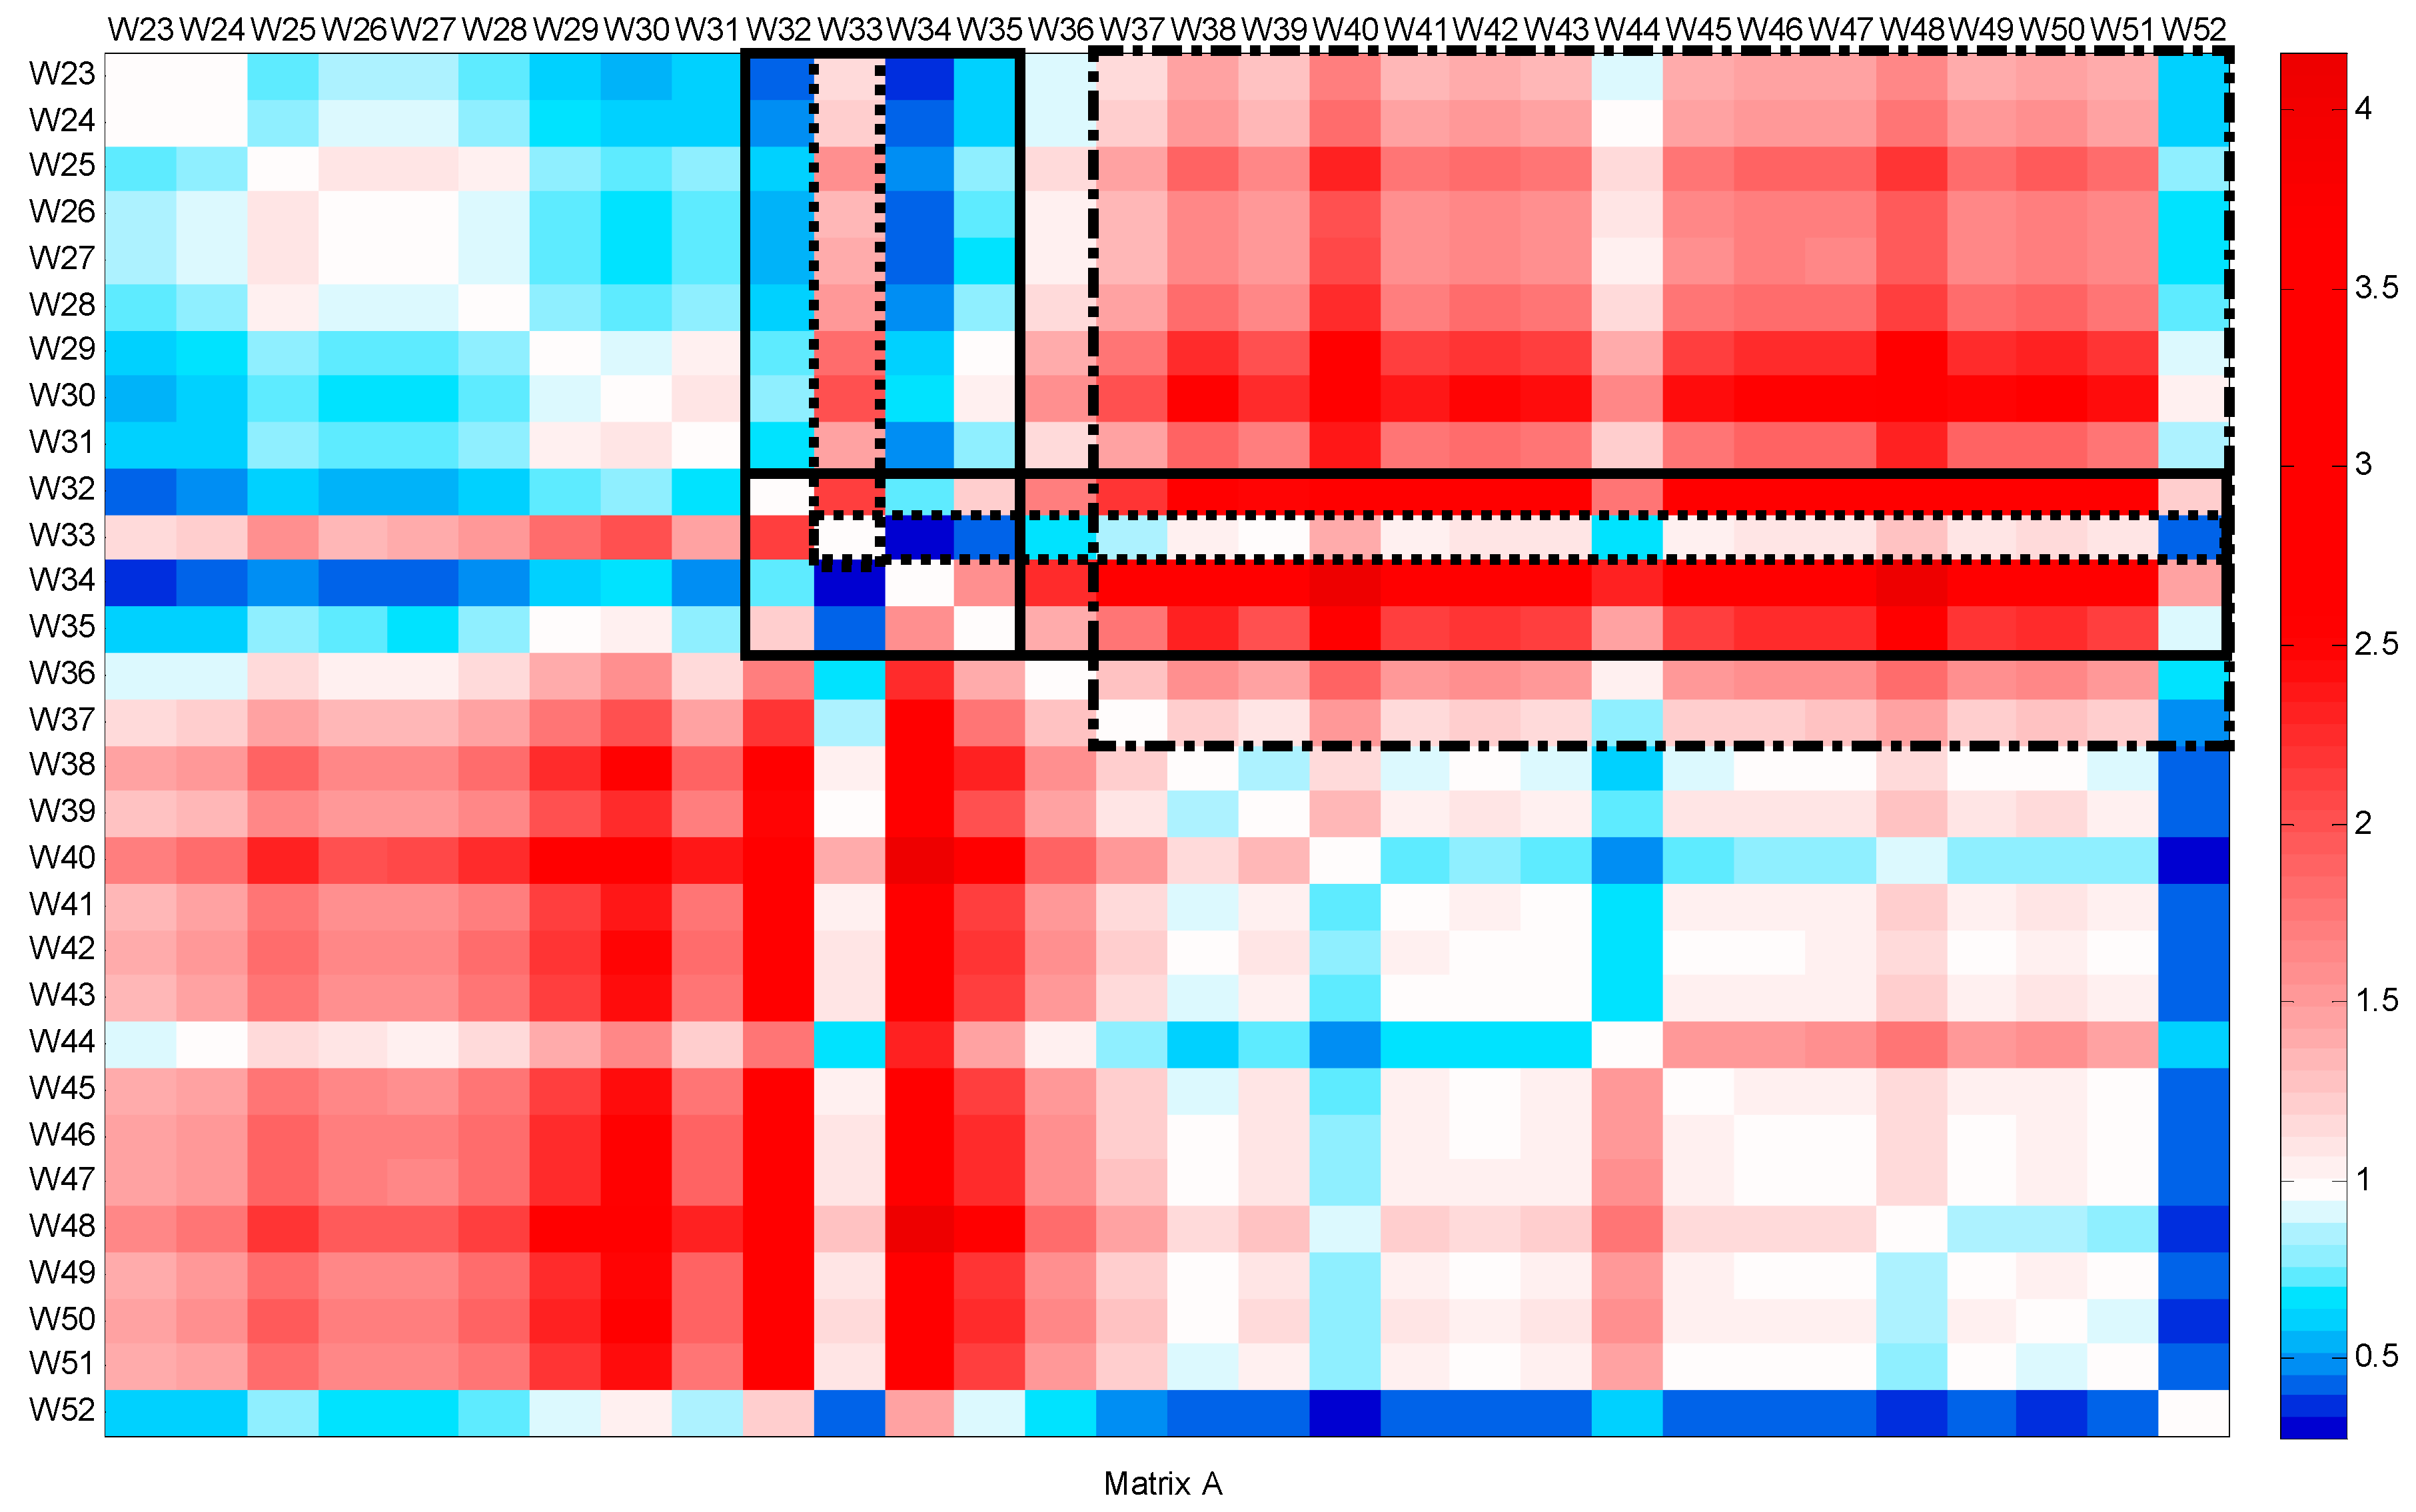
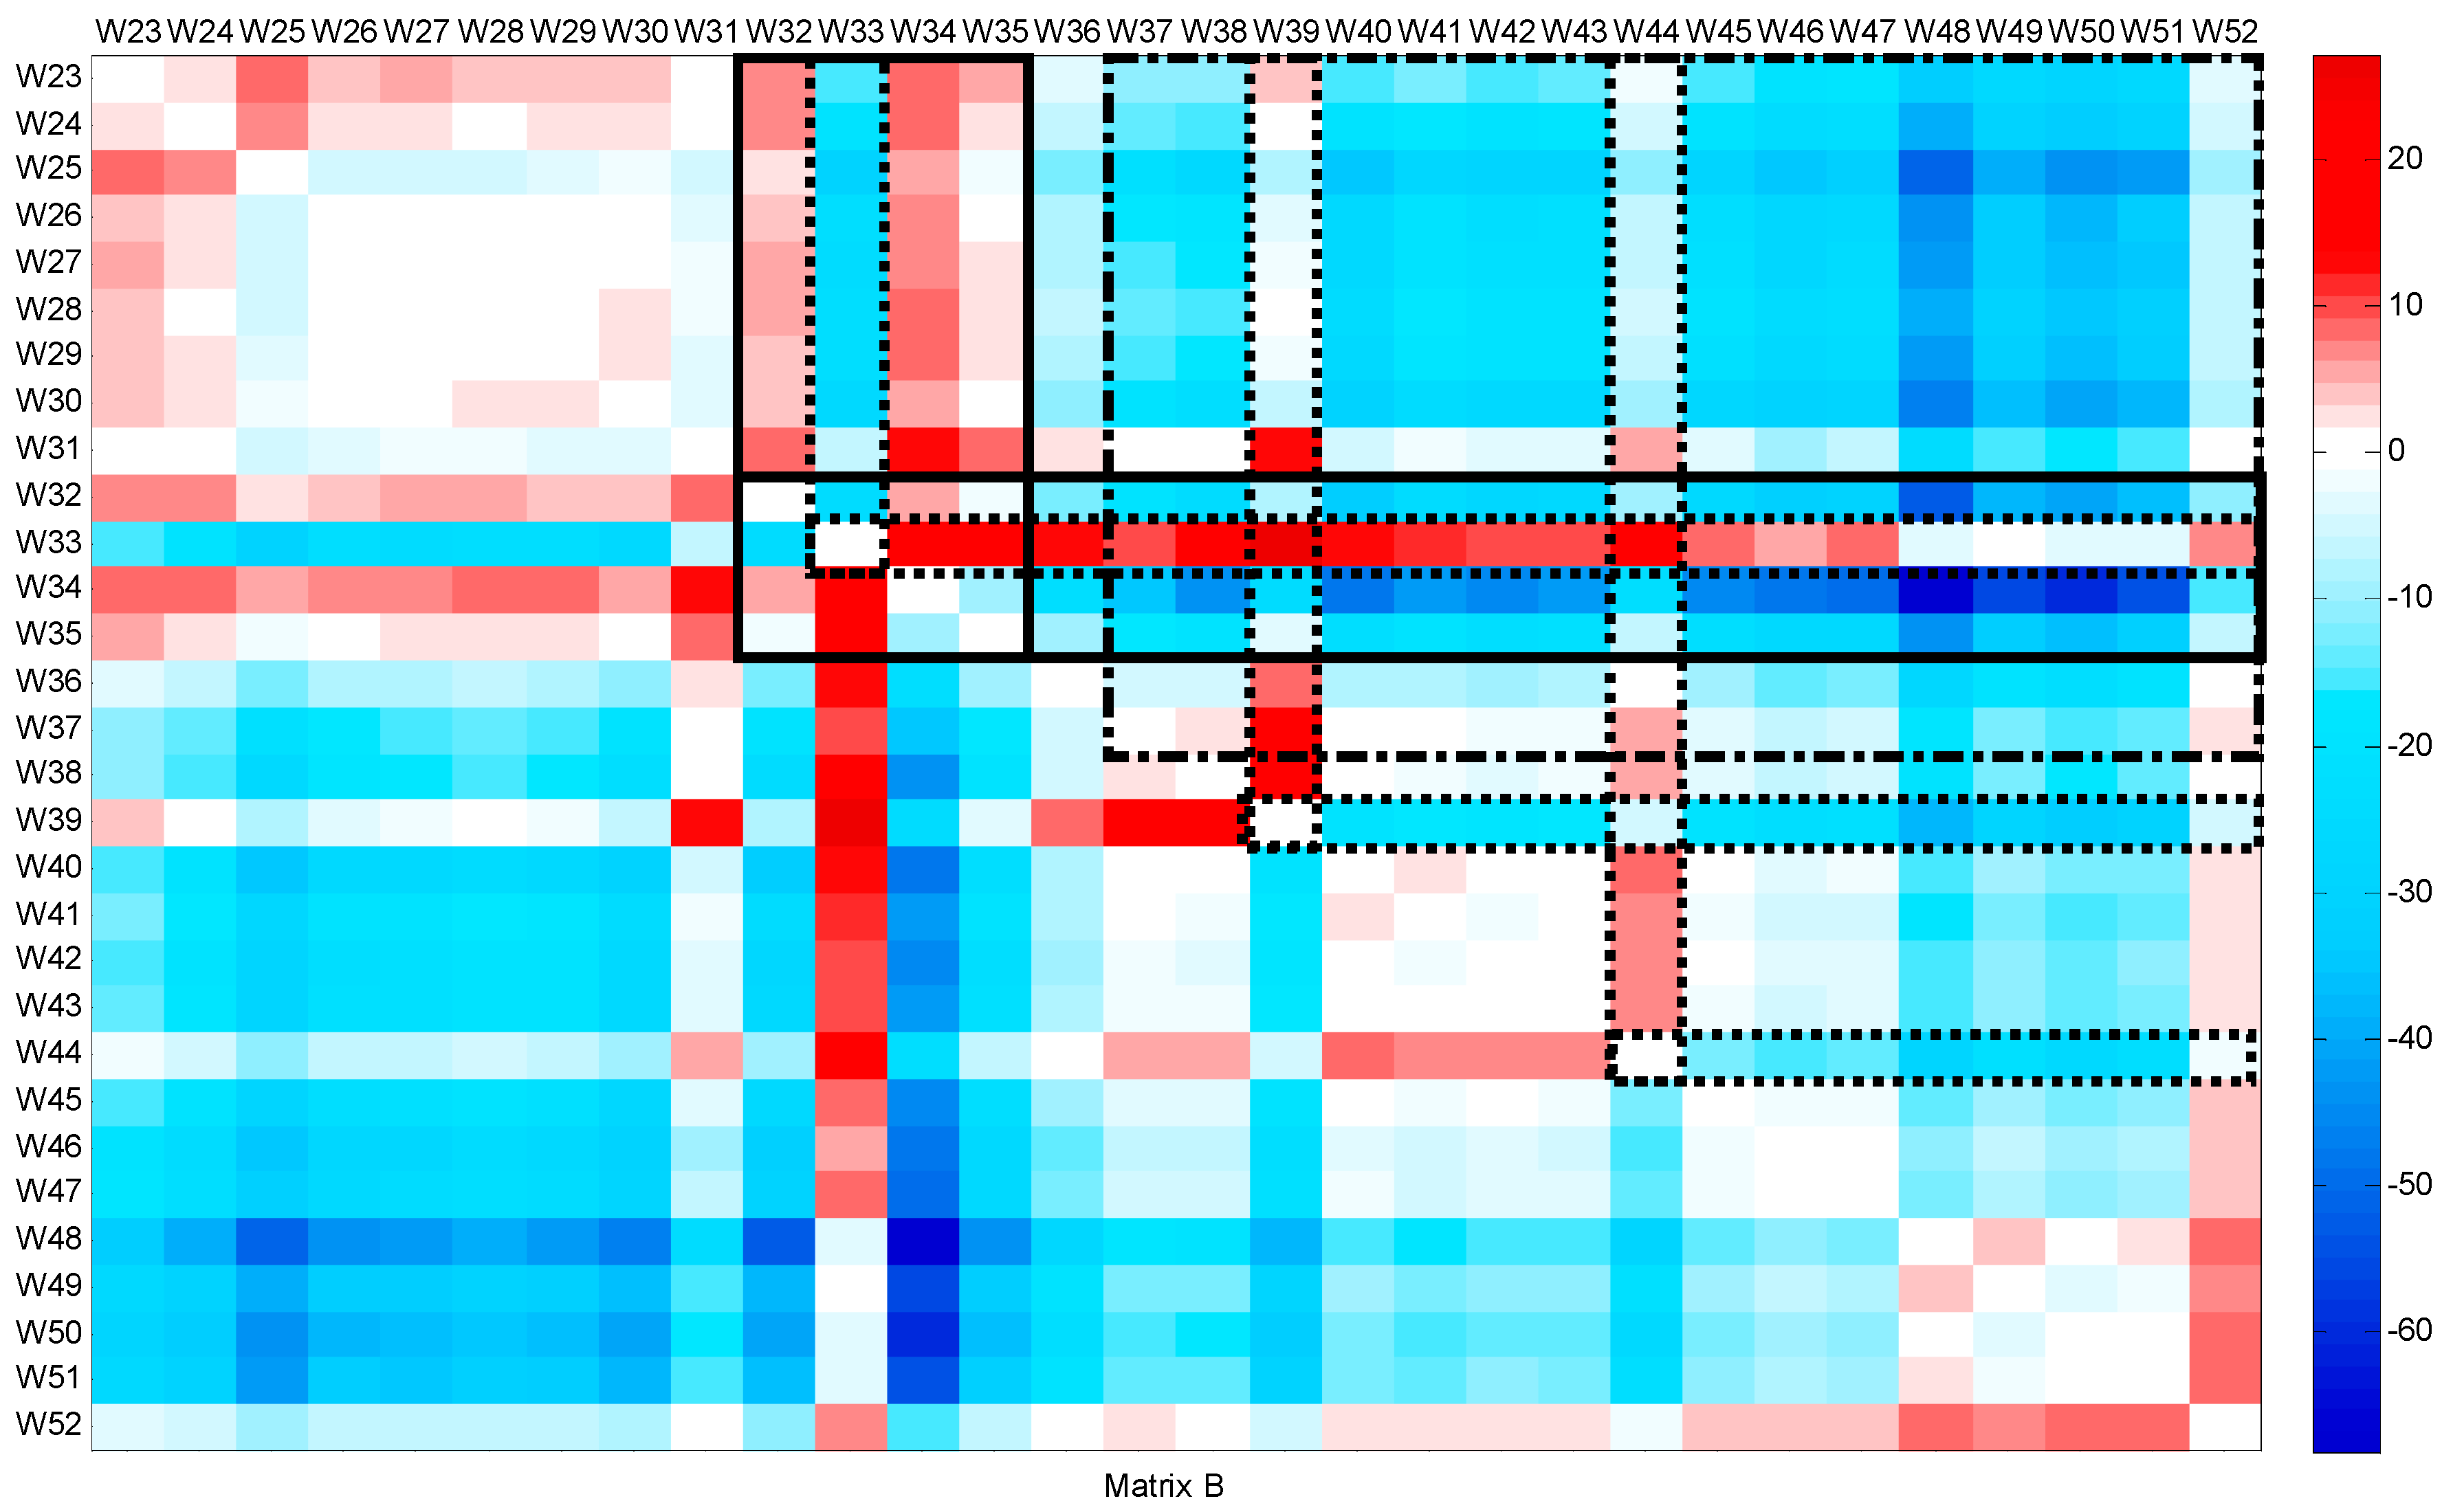
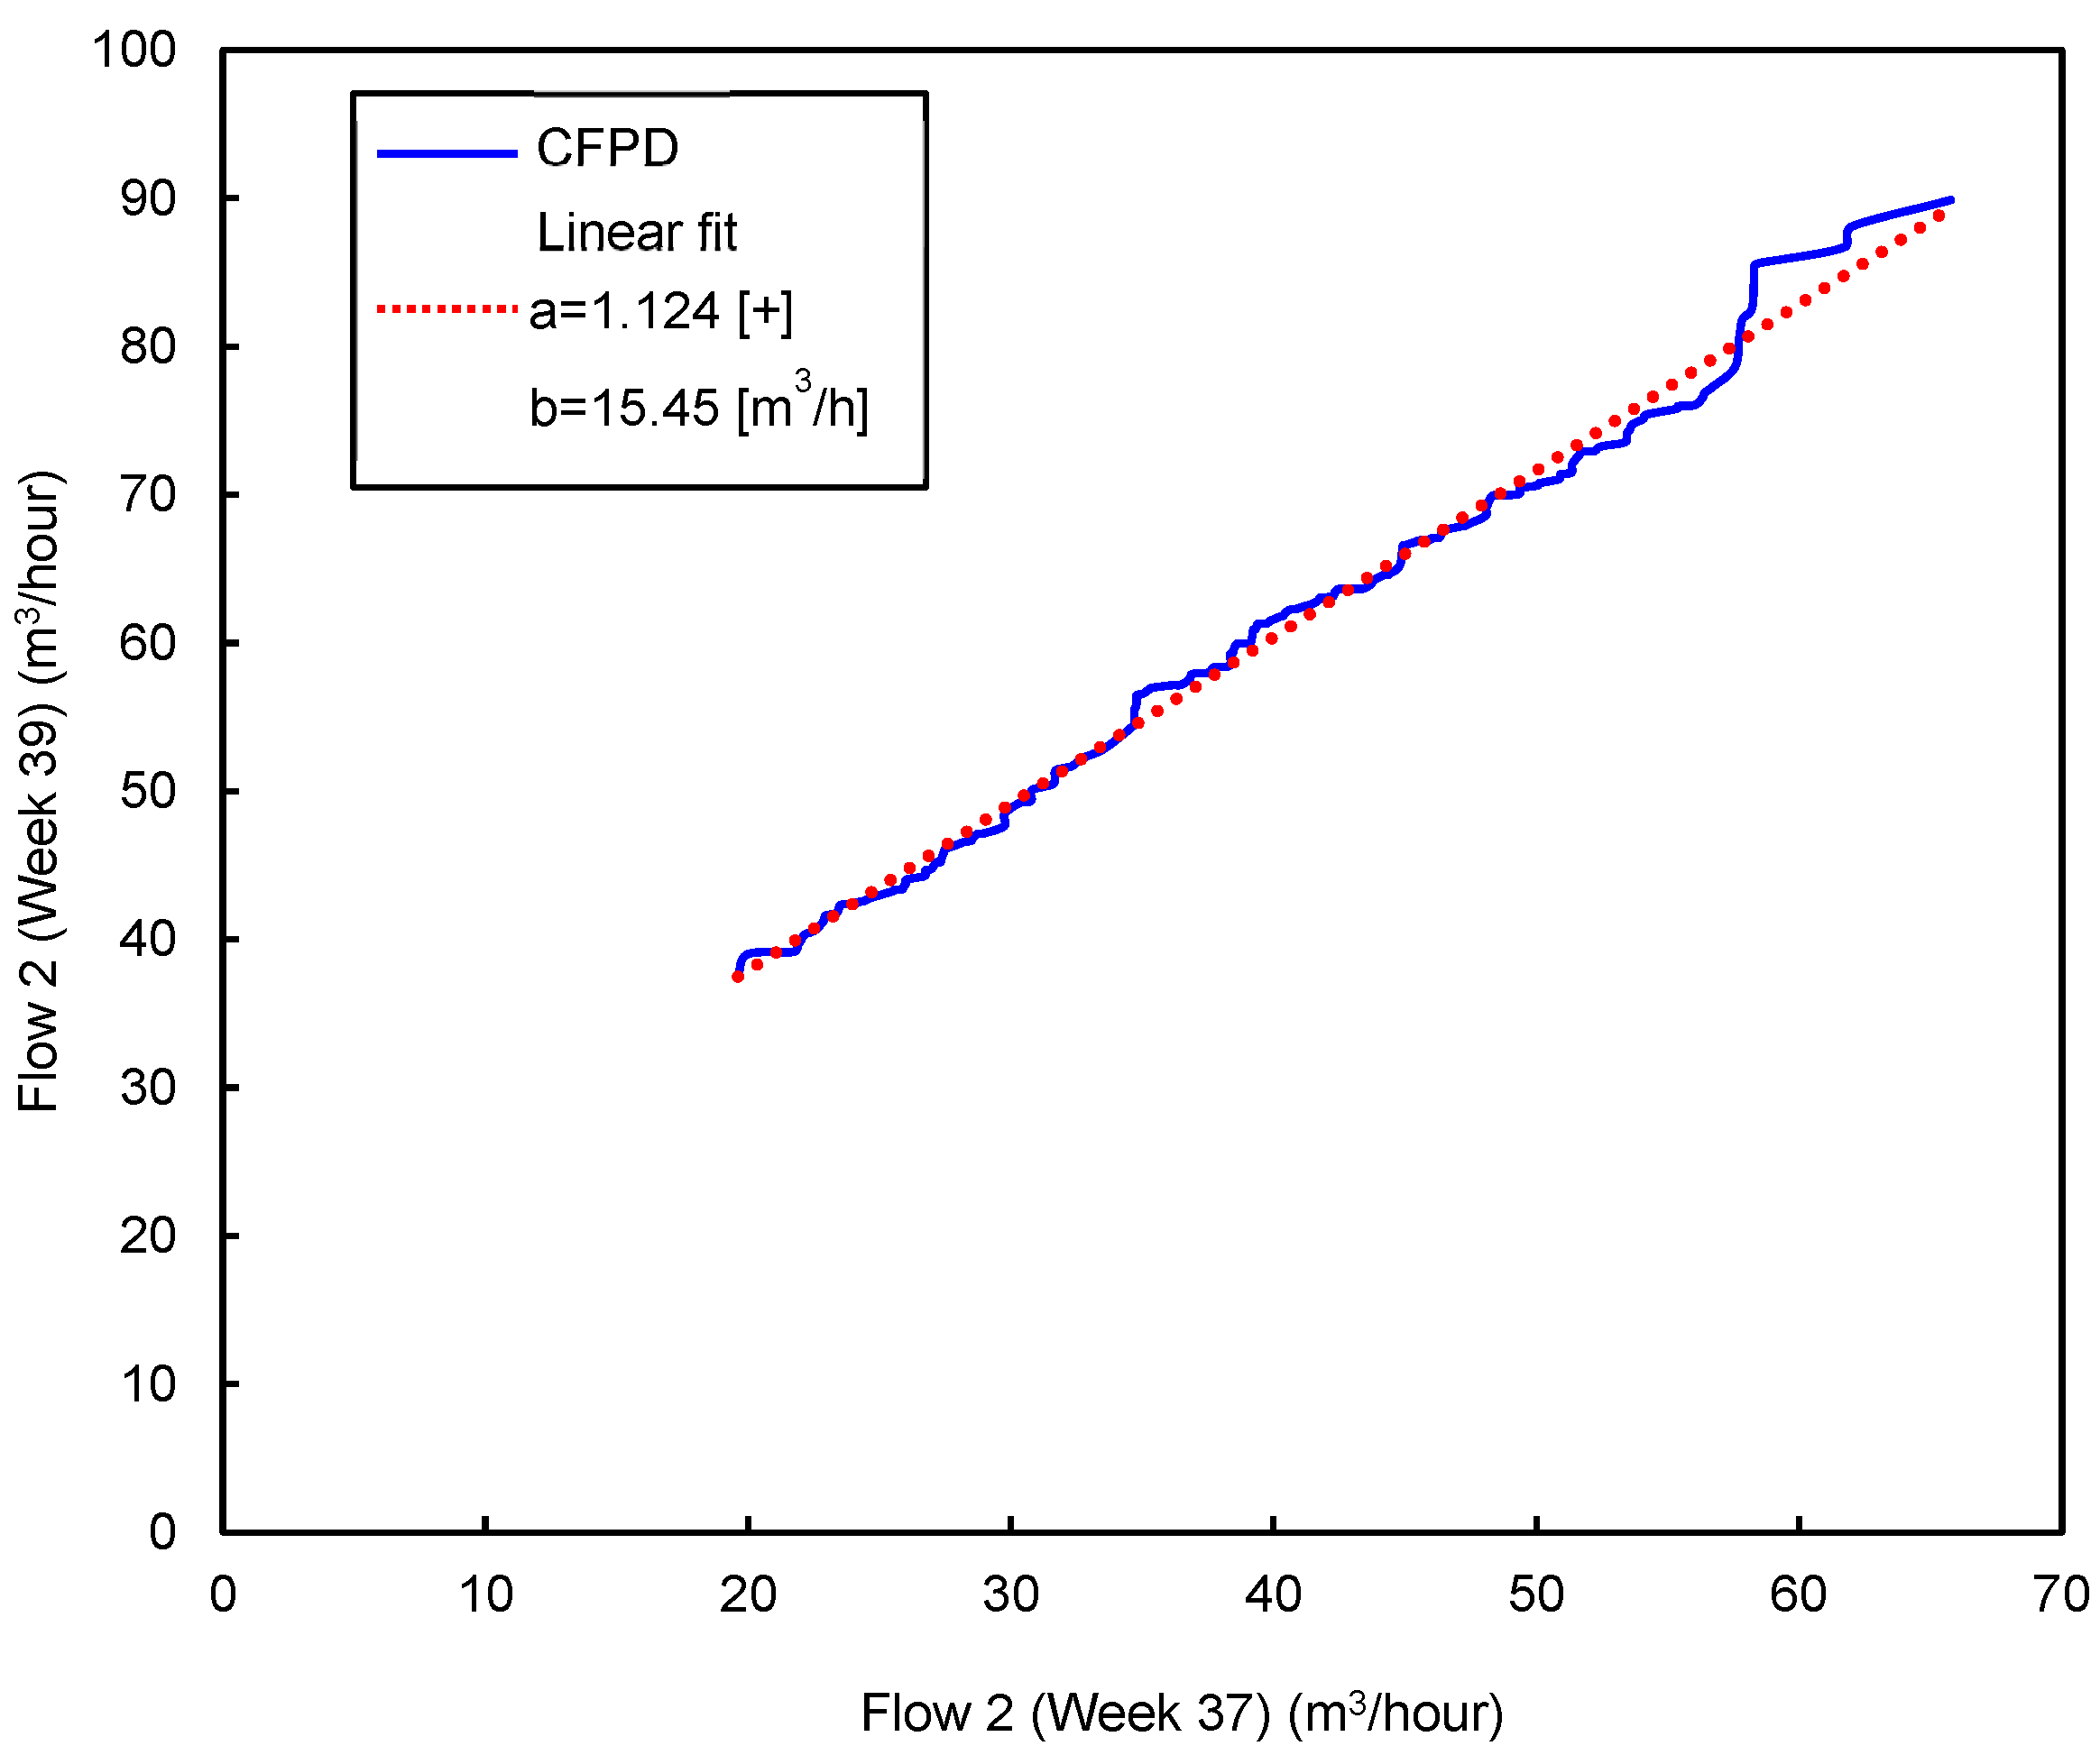
The second period includes the flow patterns from week 23 (June) to the end of the year. Figure 5 and Figure 6 show matrix A and matrix B, respectively. A consistent decrease is detected from weeks 32 to 35, particularly in week 33. This decrease, which coincides with the inconsistent increase, is related to the summer holidays during August. During week 33, the slope of the CFPD increases (a > 1), and the intercept b is lower than 1. This change in opposite ways corresponds to the burst on 11 August. From weeks 37 to 51, an inconsistent decrease (b < 0) was noted, indicating leak repairs. However, two singularities are observed during this period, the first in week 39 and the second in week 44. In week 39, the consistent matrix is the same. For the inconsistent matrix, the comparison between the water consumption in week 39 and the flow in the weeks during the summer shows a similar behavior. An inconsistent increase of 15.45 m3/h is observed; at the same time, the slope (a) tends to be close to 1. Comparing the weekly data between weeks 37 and 39, it can be concluded that there is a leakage occurring at a rate of 15.45 m3/h. Figure 7 shows that the slope (a) is nearly equal to 1, indicating consistent behavior over time. However, the intercept (b) is positive, with a value of 15.45 m3/h, pointing to the occurrence of the third leakage. A slight inconsistent increase is observed in week 44. This week, operating processes were conducted to repair the leaks and clean the network. The consistent and inconsistent decreases in week 52 explain the reduction in water consumption during the Christmas holidays.
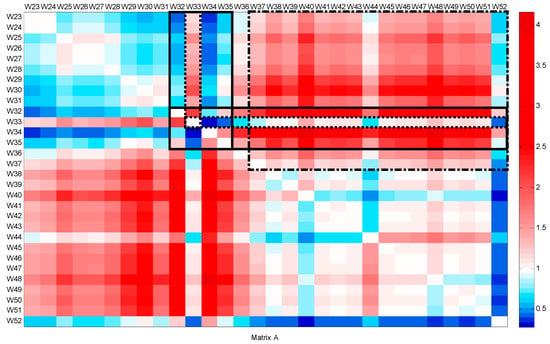
Figure 5.
Slope matrix (A) for CFPD block analysis of the total water supply dataset from week 23 to week 52.
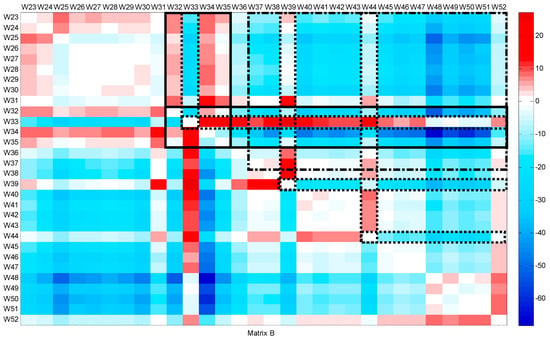
Figure 6.
Intercept matrix (B) for CFPD block analysis of the total water supply dataset from week 23 to week 52.
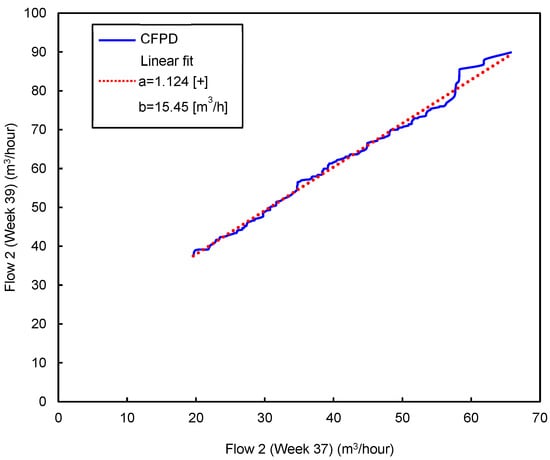
Figure 7.
CPFD plot combining flow patterns on a weekly basis: week 37–week 39.
3.2. Application of the CFPD at the Microscale
The CPFD method was also applied to identify the consistent and inconsistent changes in the water consumption data recorded in a teaching building. The first calculation involves checking the data for any meter faults that might cause erratic changes. This phase included verifying signal integrity and excluding periods where null values were detected to ensure the accuracy of the dataset. Figure 8 shows the results of the CFPD block analysis from week 1 to week 14. It indicates a decrease in water consumption during the first week, corresponding to the New Year holidays. The first significant trend is the consistent decrease observed in week 9 (dark blue color), related to the winter holidays during that week, where water consumption was reduced to half compared to working weeks (a = 0.5 to 0.6). A second feature is the inconsistent decrease observed in week 11 (b = −13 L/h). Between 10 MArch and 16 March, the building consumed less water than usual.
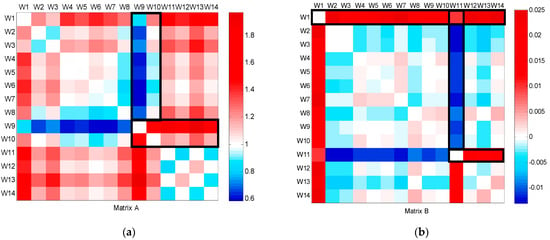
Figure 8.
CFPD block analysis of the teaching building dataset from week 1 to week 14: (a) slope matrix (A); (b) intercept matrix (B).
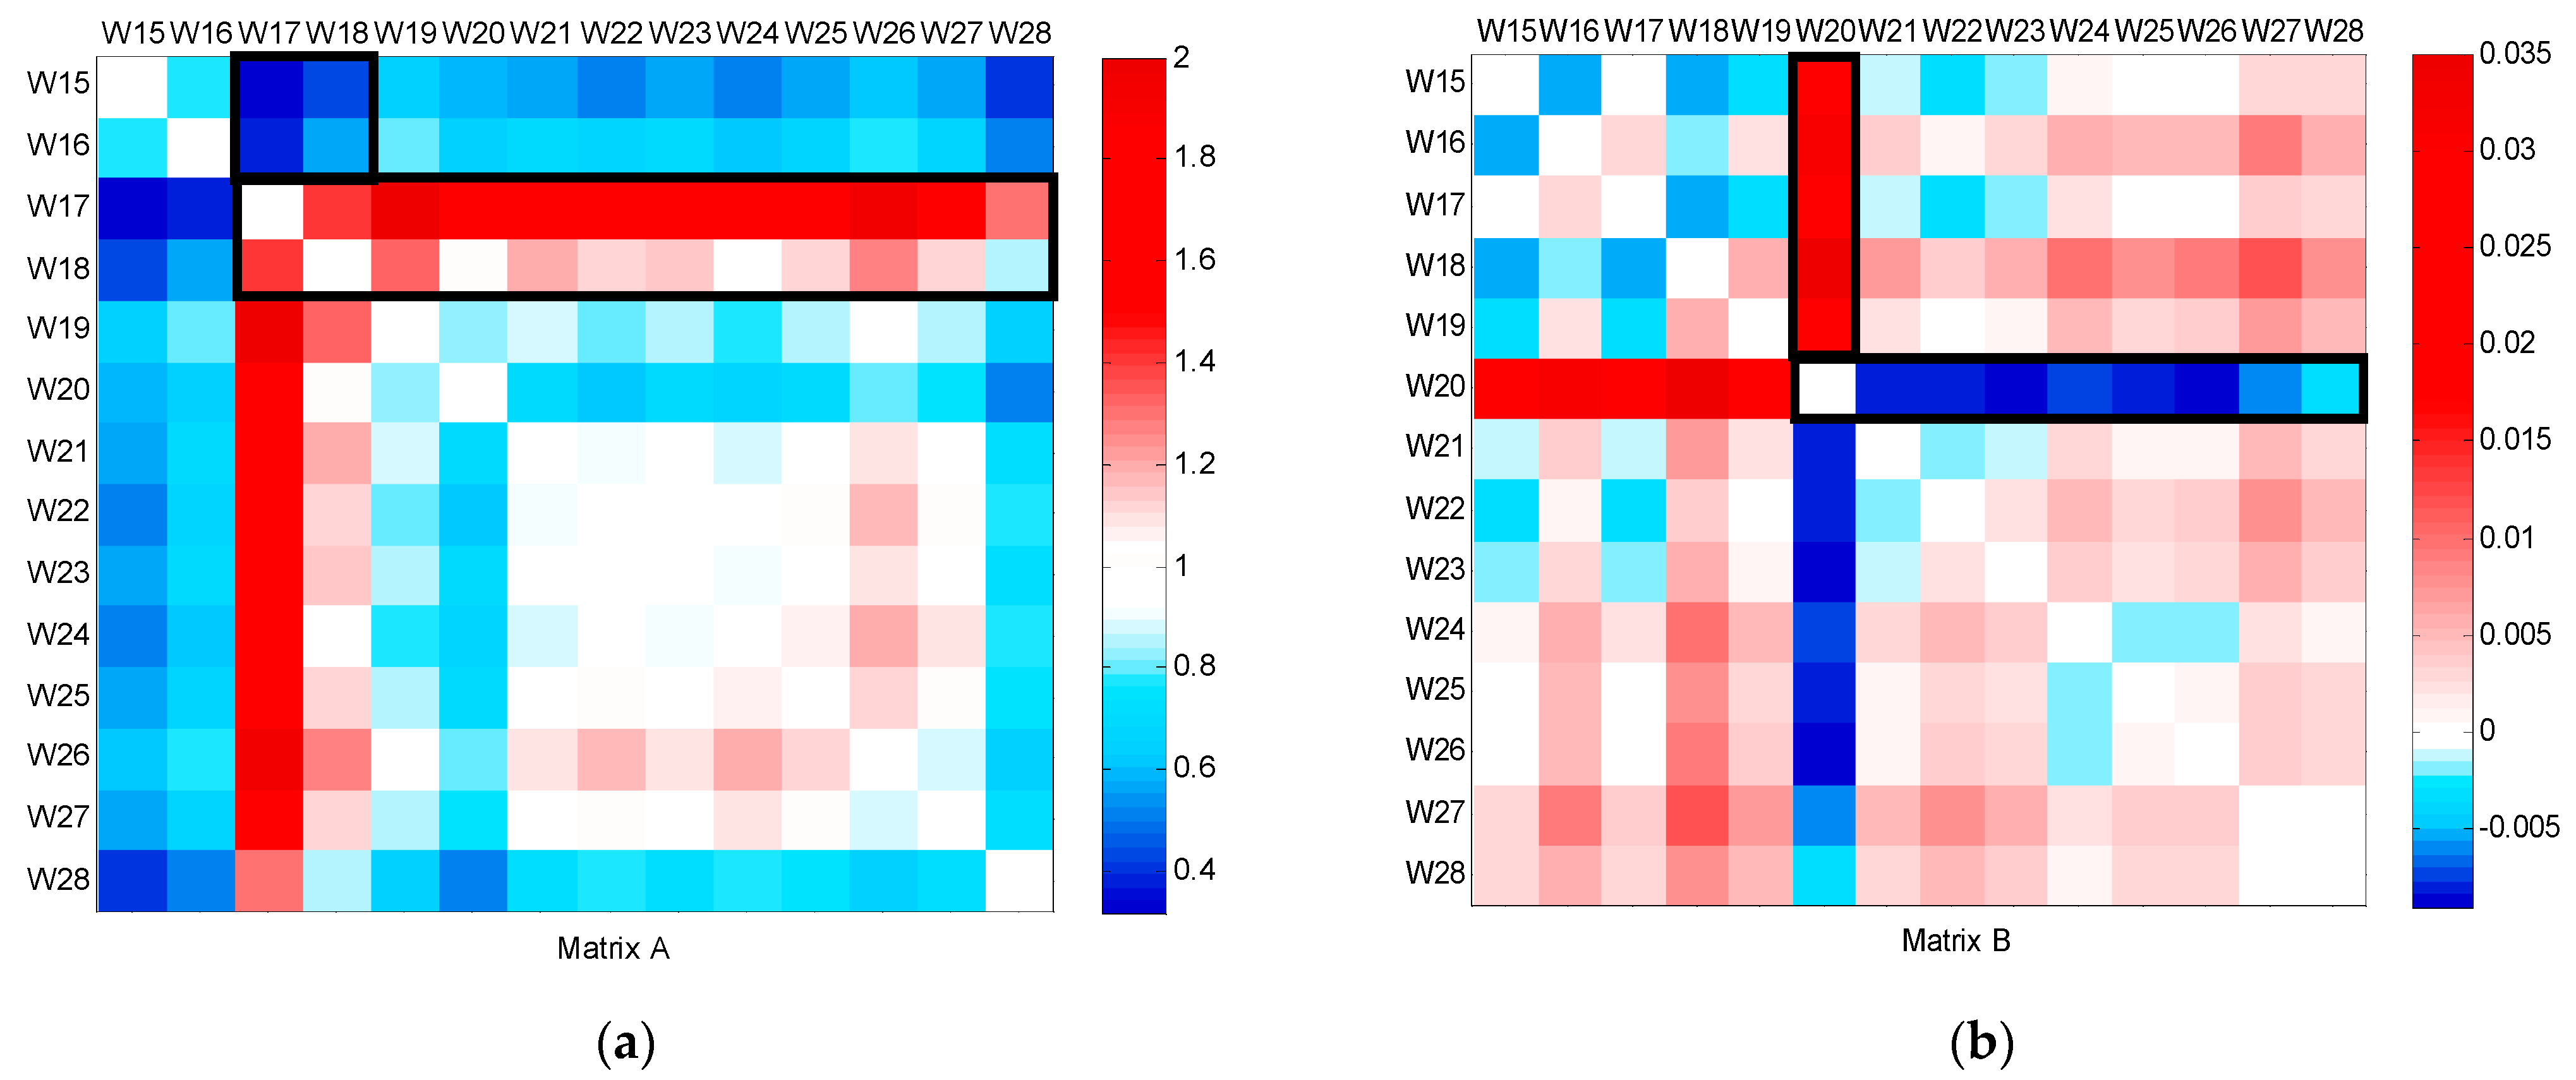
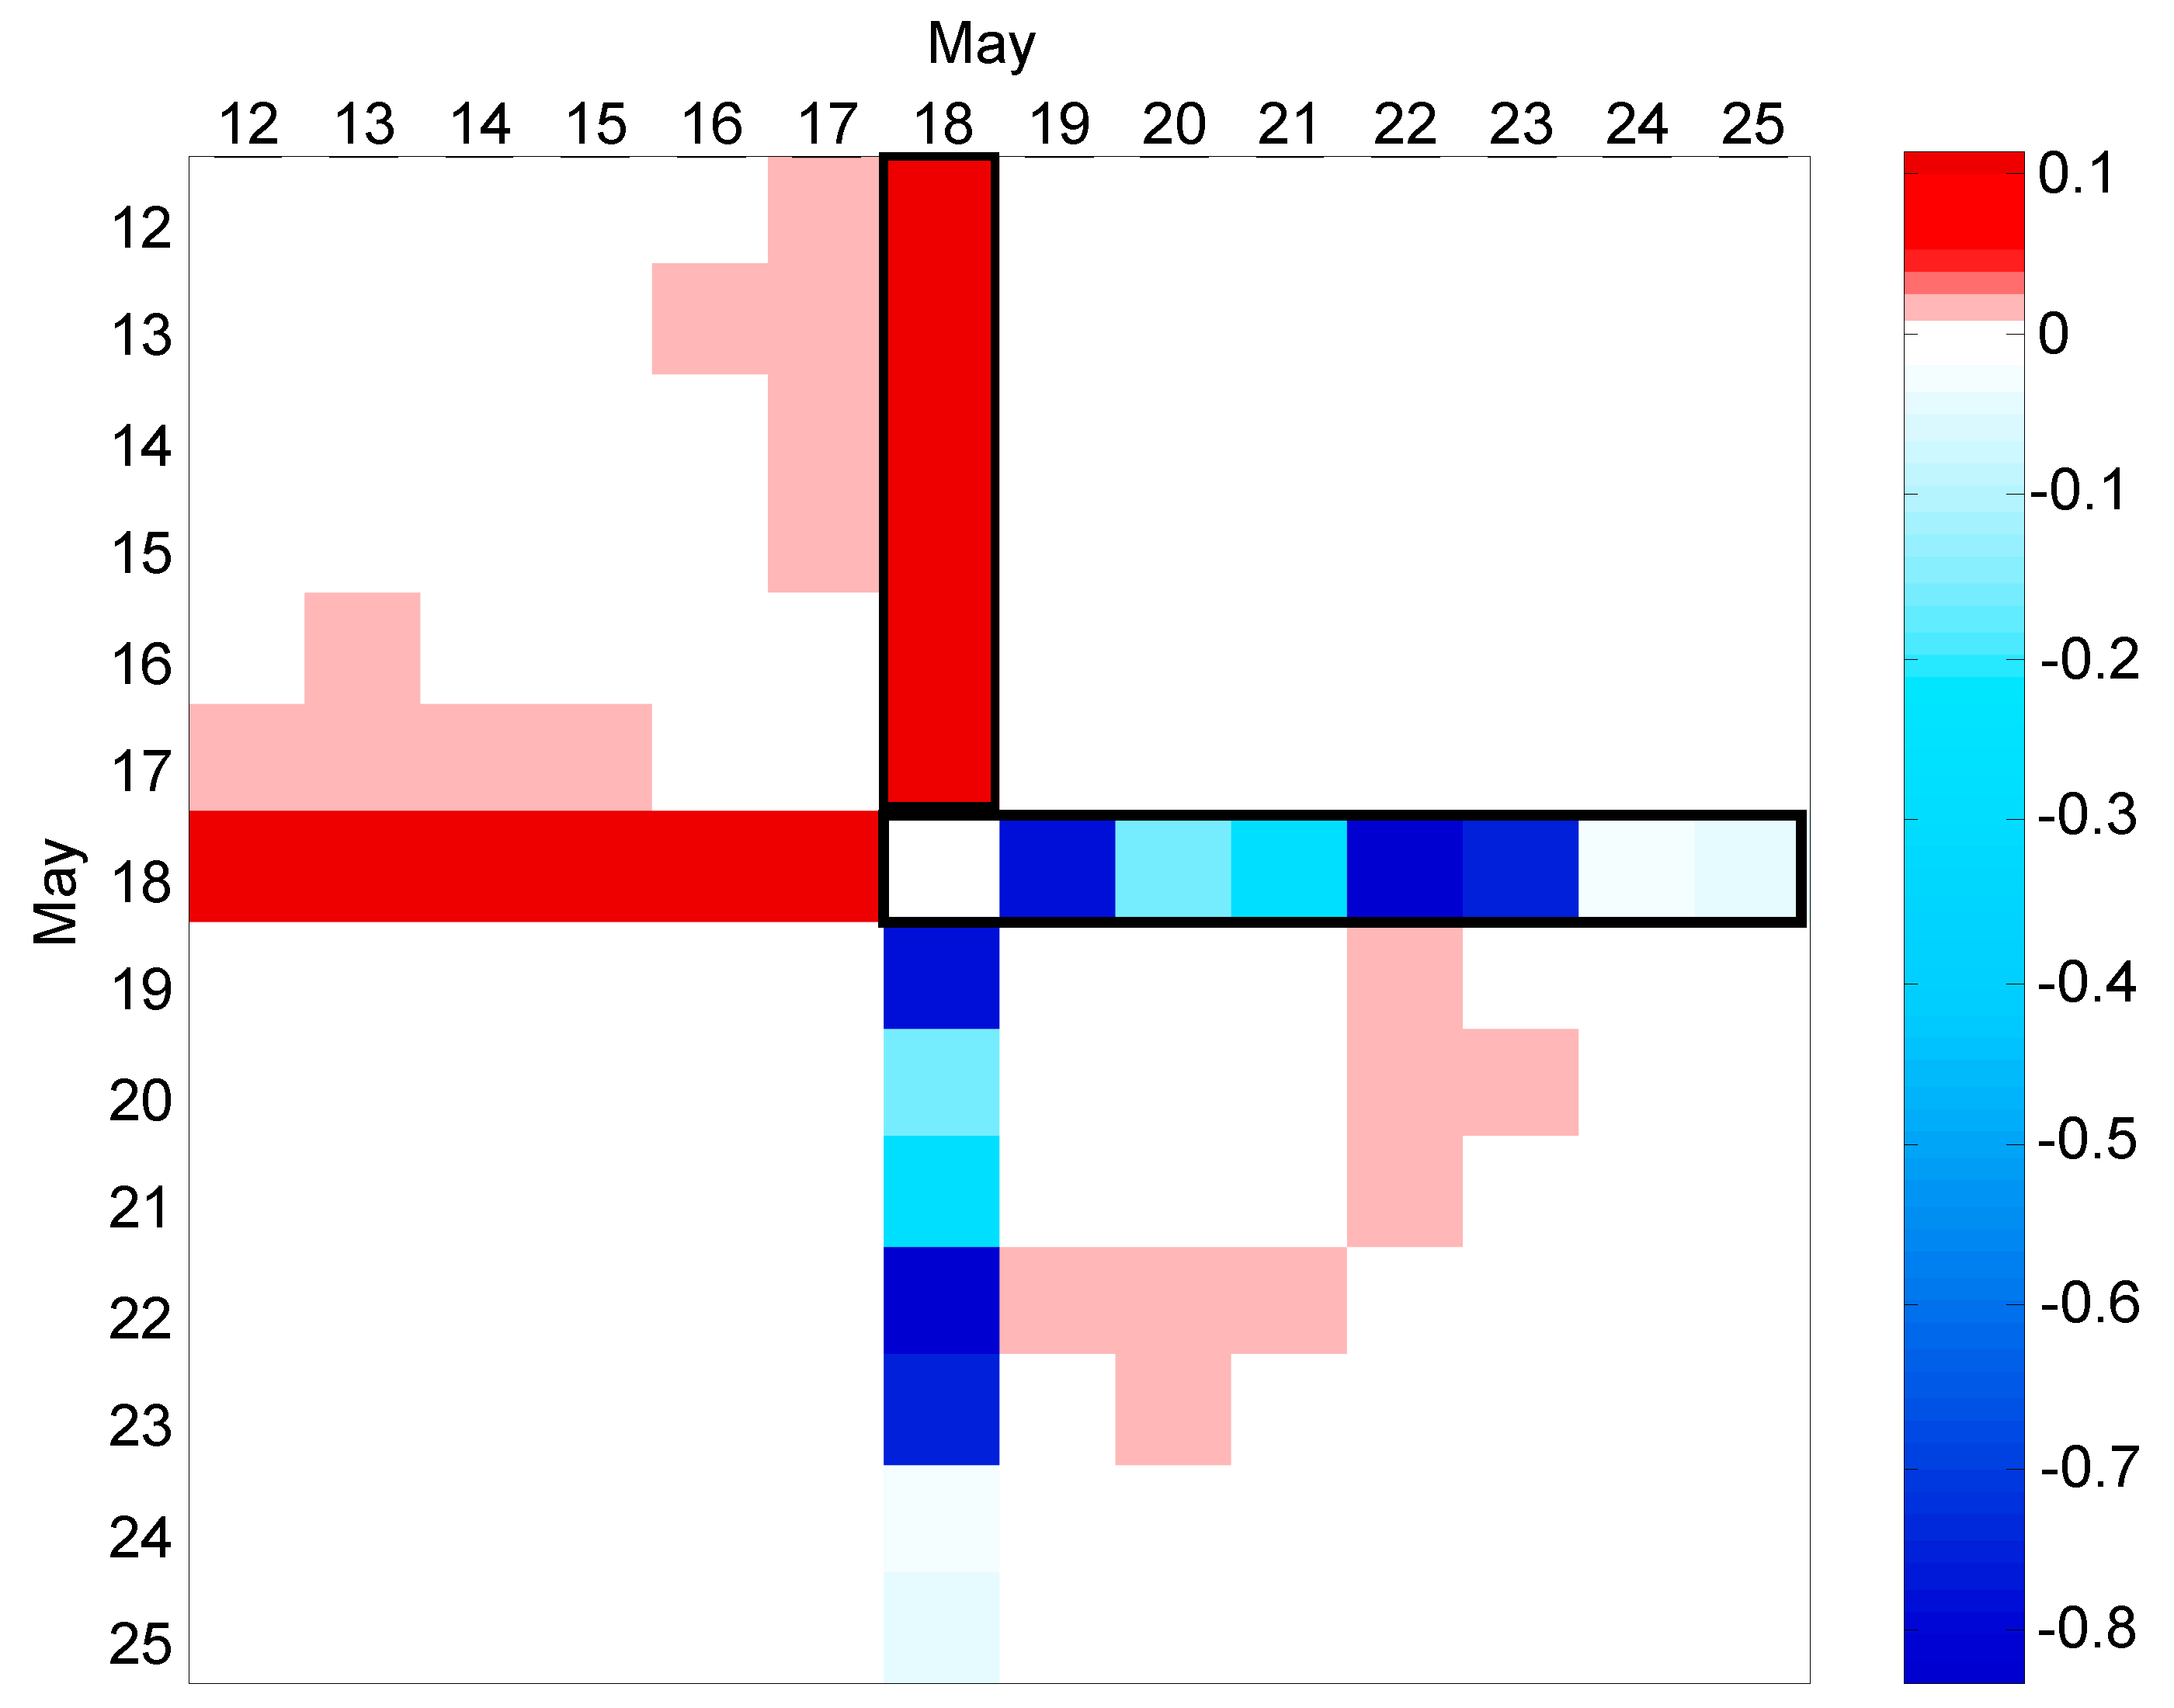
The results of the CFPD block analysis from week 15 to week 28 are shown in Figure 9. As shown in matrix A, water consumption during the spring holidays (weeks 17 and 18) is characterized by a consistent decrease. Matrix B shows an inconsistent change in week 20, which probably corresponds to a leakage. The CFPD daily analysis of the water dataset in a teaching building from 12 May to 25 May is computed to confirm the leakage and determine the starting date of leakage. Following the CFPD block analysis on a daily basis of the water dataset in this building, matrix B in Figure 10 shows a leakage of 100 L/h on 18 May. The analysis also indicates that the leak was repaired the next day, and the flow returned to its average rate.
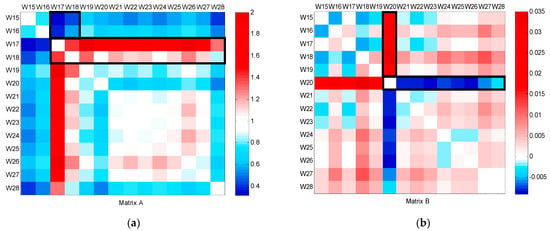
Figure 9.
CFPD block analysis of the teaching building dataset from week 15 to week 28: (a) slope matrix (A); (b) intercept matrix (B).
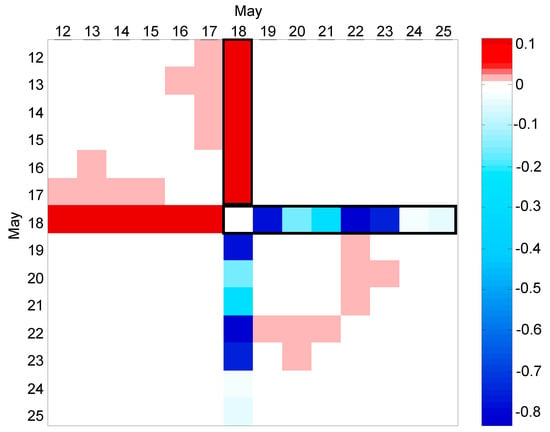
Figure 10.
Intercept matrix (B) for CFPD daily analysis of the water dataset in a teaching building in May.
4. Discussion
The application of the CFPD method at both macroscale and microscale has proven highly effective in detecting water consumption patterns and identifying anomalies like leaks. At the macroscale, the method successfully detected three major leaks, leading to a 33% reduction in water loss. The identification and subsequent repair of these leaks, which restored normal consumption patterns, highlight the CFPD method’s contribution to supporting Sustainable Development Goals (SDGs), particularly SDG 6 (Clean Water and Sanitation), by reducing water wastage through timely detection and intervention. The method also demonstrated its efficiency in detecting variations in water consumption during critical periods, such as winter and summer holidays, as well as during maintenance or construction activities. Furthermore, the CFPD method’s contribution to SDG 11 (Sustainable Cities and Communities) is demonstrated by its capacity to enhance the resilience of the university’s water infrastructure. By effectively identifying leaks during periods of lower water usage, such as university holidays during the summer, the method ensures that the integrity of the water system is preserved, even when operating under reduced demand. This resilience is essential for urban-like environments within the university, where water infrastructure must adapt to varying levels of consumption without compromising service reliability or sustainability. The ability to maintain water system integrity during fluctuating demand periods underscores the importance of the CFPD method in supporting sustainable and resilient campus infrastructure. Water management is closely tied to energy use, particularly in the treatment and distribution of water. Reducing water loss means less energy is required to pump, treat, and distribute water, leading to lower greenhouse gas emissions. This reduction in energy consumption directly supports efforts to mitigate climate change, aligning with the goals of SDG 13 (Climate Action).
While the CFPD method is effective in detecting leaks by analyzing water consumption patterns, integrating it with complementary technologies could significantly enhance its precision, particularly in localizing the leakage. In this study, acoustic surveys were used to pinpoint the leaks identified by CFPD, allowing for accurate repair. Acoustic sensors detect the specific sound frequencies associated with water escaping from pipes, reducing false positives and unnecessary repairs [42,43]. Pressure monitoring systems can also pinpoint the exact location of a leak by correlating pressure drops with CFPD-detected anomalies [44,45]. Additionally, Ground Penetrating Radar (GPR) can be used to detect subsurface leaks by identifying voids or changes in the material surrounding buried pipes, further enhancing leak detection accuracy [46,47]. Satellite and aerial imaging, especially with thermal or infrared capabilities, can identify potential problem areas over large or remote regions [48,49], complementing the findings from CFPD. By combining these technologies with the CFPD method, water utilities can more accurately detect and locate leaks, minimizing water loss and ensuring the long-term resilience of water infrastructure.
5. Conclusions
This paper explored the capacity of the Comparison of the Flow Pattern Distribution (CFPD) method to detect water leaks and understand water consumption behaviors at both microscale and macroscale. It used data from a smart monitoring system at the Scientific City of Lille University. At the macroscale, applying the CFPD method revealed distinct consumption patterns during business days, weekends, and holidays. It also detected water leaks. At the microscale, the CFPD method allowed for the detection of leaks and unusual consumption behaviors in an academic building.
While the CFPD method has demonstrated effectiveness in this study, it presents certain limitations. The method depends on the quality and accuracy of the data collected. Any faults in the metering equipment or data transmission issues could lead to inaccurate results or missed anomalies. Although pre-processing steps were taken to minimize these risks, the possibility of undetected errors remains. Additionally, although CFPD is effective in identifying leaks, it may not always precisely pinpoint the exact location of a leak within the network. This limitation highlights the need to integrate CFPD with other advanced techniques, such as acoustic surveys or pressure monitoring systems, to improve localization accuracy.
This research demonstrates the utility of the CFPD method in real-world settings, emphasizing its role in promoting sustainable water management practices. It helps conserve water and reduce the energy required for water treatment and distribution by enabling precise control over water distribution and minimizing losses. This reduction in energy consumption lowers the carbon footprint associated with water supply, contributing to broader environmental goals related to Sustainable Cities and Communities (Goal 11), Climate Action (Goal 13), and Clean Water and Sanitation (Goal 6).
Author Contributions
Conceptualization, E.F. and I.S.; methodology, E.F. and I.S.; software, E.F.; validation, I.S.; formal analysis, E.F.; data curation, E.F.; writing—original draft preparation, E.F.; writing—review and editing, I.S.; visualization, E.F.; supervision, I.S.; All authors have read and agreed to the published version of the manuscript.
Funding
This research received no external funding.
Data Availability Statement
The data is unavailable due to privacy concerns.
Conflicts of Interest
The authors declare no conflicts of interest.
References
- Bhaduri, A.; Bogardi, J.; Siddiqi, A.; Voigt, H.; Vörösmarty, C.; Pahl-Wostl, C.; Bunn, S.E.; Shrivastava, P.; Lawford, R.; Foster, S.; et al. Achieving Sustainable Development Goals from a Water Perspective. Front. Environ. Sci. 2016, 4, 64. [Google Scholar] [CrossRef]
- Ait-Kadi, M. Water for Development and Development for Water: Realizing the Sustainable Development Goals (SDGs) Vision. Aquat. Procedia 2016, 6, 106–110. [Google Scholar] [CrossRef]
- Benson, D.; Gain, A.K.; Giupponi, C. Moving beyond water centricity? Conceptualizing integrated water resources management for implementing sustainable development goals. Sustain. Sci. 2020, 15, 671–681. [Google Scholar] [CrossRef]
- Singh, M.; Ahmed, S. IoT based smart water management systems: A systematic review. Mater. Today Proc. 2021, 46, 5211–5218. [Google Scholar] [CrossRef]
- Ramos, H.M.; McNabola, A.; López-Jiménez, P.A.; Pérez-Sánchez, M. Smart Water Management towards Future Water Sustainable Networks. Water 2020, 12, 58. [Google Scholar] [CrossRef]
- Bharat, V.; Shubham, S.; Jagdish, D.; Amol, P.; Renuka, K. Smart water management system in cities. In Proceedings of the 2017 International Conference on Big Data Analytics and Computational Intelligence (ICBDAC), Chirala, India, 23–25 March 2017; pp. 267–271. [Google Scholar]
- Krishnan, S.R.; Nallakaruppan, M.K.; Chengoden, R.; Koppu, S.; Iyapparaja, M.; Sadhasivam, J.; Sethuraman, S. Smart Water Resource Management Using Artificial Intelligence—A Review. Sustainability 2022, 14, 13384. [Google Scholar] [CrossRef]
- Di Nardo, A.; Boccelli, D.L.; Herrera, M.; Creaco, E.; Cominola, A.; Sitzenfrei, R.; Taormina, R. Smart Urban Water Networks: Solutions, Trends and Challenges. Water 2021, 13, 501. [Google Scholar] [CrossRef]
- Slaný, V.; Lučanský, A.; Koudelka, P.; Mareček, J.; Krčálová, E.; Martínek, R. An Integrated IoT Architecture for Smart Metering Using Next Generation Sensor for Water Management Based on LoRaWAN Technology: A Pilot Study. Sensors 2020, 20, 4712. [Google Scholar] [CrossRef]
- Joseph, K.; Sharma, A.K.; van Staden, R. Development of an Intelligent Urban Water Network System. Water 2022, 14, 1320. [Google Scholar] [CrossRef]
- Giudicianni, C.; Herrera, M.; Nardo, A.d.; Adeyeye, K.; Ramos, H.M. Overview of Energy Management and Leakage Control Systems for Smart Water Grids and Digital Water. Modelling 2020, 1, 134–155. [Google Scholar] [CrossRef]
- Boyle, T.; Giurco, D.; Mukheibir, P.; Liu, A.; Moy, C.; White, S.; Stewart, R. Intelligent Metering for Urban Water: A Review. Water 2013, 5, 1052–1081. [Google Scholar] [CrossRef]
- Muhammetoglu, A.; Albayrak, Y.; Bolbol, M.; Enderoglu, S.; Muhammetoglu, H. Detection and Assessment of Post Meter Leakages in Public Places Using Smart Water Metering. Water Resour. Manag. 2020, 34, 2989–3002. [Google Scholar] [CrossRef]
- Boulos, P.F.; Jacobsen, L.B.; Heath, J.E.; Kamojjala, S. Real-time modeling of water distribution systems: A case study. J. AWWA 2014, 106, E391–E401. [Google Scholar] [CrossRef]
- Andrić, I.; Vrsalović, A.; Perković, T.; Aglić Čuvić, M.; Šolić, P. IoT approach towards smart water usage. J. Clean. Prod. 2022, 367, 133065. [Google Scholar] [CrossRef]
- Okoli, N.J.; Kabaso, B. Building a Smart Water City: IoT Smart Water Technologies, Applications, and Future Directions. Water 2024, 16, 557. [Google Scholar] [CrossRef]
- Monks, I.; Stewart, R.A.; Sahin, O.; Keller, R. Revealing Unreported Benefits of Digital Water Metering: Literature Review and Expert Opinions. Water 2019, 11, 838. [Google Scholar] [CrossRef]
- Ramos, H.M.; Kuriqi, A.; Besharat, M.; Creaco, E.; Tasca, E.; Coronado-Hernández, O.E.; Pienika, R.; Iglesias-Rey, P. Smart Water Grids and Digital Twin for the Management of System Efficiency in Water Distribution Networks. Water 2023, 15, 1129. [Google Scholar] [CrossRef]
- Liu, A.; Mukheibir, P. Digital metering feedback and changes in water consumption—A review. Resour. Conserv. Recycl. 2018, 134, 136–148. [Google Scholar] [CrossRef]
- Spang, E.S.; Miller, S.; Williams, M.; Loge, F.J. Consumption-Based Fixed Rates: Harmonizing Water Conservation and Revenue Stability. J. AWWA 2015, 107, E164–E173. [Google Scholar] [CrossRef]
- Alejandrino, R.S.; Diomampo, M.C.G.; Balbin, J.R. Smart Water Meter with Cloud Database and Water Bill Consumption Monitoring via SMS and Mobile Application. In Proceedings of the 2022 IEEE International Conference on Automatic Control and Intelligent Systems (I2CACIS), Shah Alam, Malaysia, 25–25 June 2022; pp. 90–95. [Google Scholar] [CrossRef]
- Nguyen, K.A.; Stewart, R.A.; Zhang, H.; Sahin, O.; Siriwardene, N. Re-engineering traditional urban water management practices with smart metering and informatics. Environ. Model. Softw. 2018, 101, 256–267. [Google Scholar] [CrossRef]
- Świętochowski, K.; Andraka, D.; Kalenik, M.; Gwoździej-Mazur, J. The Hourly Peak Coefficient of Single-Family and Multi-Family Buildings in Poland: Support for the Selection of Water Meters and the Construction of a Water Distribution System Model. Water 2024, 16, 1077. [Google Scholar] [CrossRef]
- Britton, T.C.; Stewart, R.A.; O’Halloran, K.R. Smart metering: Enabler for rapid and effective post meter leakage identification and water loss management. J. Clean. Prod. 2013, 54, 166–176. [Google Scholar] [CrossRef]
- Gurung, T.R.; Stewart, R.A.; Beal, C.D.; Sharma, A.K. Smart meter enabled informatics for economically efficient diversified water supply infrastructure planning. J. Clean. Prod. 2016, 135, 1023–1033. [Google Scholar] [CrossRef]
- Cominola, A.; Nguyen, K.; Giuliani, M.; Stewart, R.A.; Maier, H.R.; Castelletti, A. Data Mining to Uncover Heterogeneous Water Use Behaviors From Smart Meter Data. Water Resour. Res. 2019, 55, 9315–9333. [Google Scholar] [CrossRef]
- Rathore, M.M.; Ahmad, A.; Paul, A.; Rho, S. Urban planning and building smart cities based on the Internet of Things using Big Data analytics. Comput. Netw. 2016, 101, 63–80. [Google Scholar] [CrossRef]
- Hu, Z.; Chen, B.; Chen, W.; Tan, D.; Shen, D. Review of model-based and data-driven approaches for leak detection and location in water distribution systems. Water Supply 2021, 21, 3282–3306. [Google Scholar] [CrossRef]
- Nimri, W.; Wang, Y.; Zhang, Z.; Deng, C.; Sellstrom, K. Data-driven approaches and model-based methods for detecting and locating leaks in water distribution systems: A literature review. Neural Comput. Appl. 2023, 35, 11611–11623. [Google Scholar] [CrossRef]
- Liang, B.; Verma, S.; Xu, J.; Liang, S.; Li, Z.; Wang, Y.; Chen, F. A Data Driven Approach for Leak Detection with Smart Sensors. In Proceedings of the 2020 16th International Conference on Control, Automation, Robotics and Vision (ICARCV), Shenzhen, China, 13–15 December 2020; pp. 1311–1316. [Google Scholar]
- Soldevila, A.; Boracchi, G.; Roveri, M.; Tornil-Sin, S.; Puig, V. Leak detection and localization in water distribution networks by combining expert knowledge and data-driven models. Neural Comput. Appl. 2022, 34, 4759–4779. [Google Scholar] [CrossRef]
- Kammoun, M.; Kammoun, A.; Abid, M. Experiments based comparative evaluations of machine learning techniques for leak detection in water distribution systems. Water Supply 2021, 22, 628–642. [Google Scholar] [CrossRef]
- Sousa, D.P.; Du, R.; Mairton Barros da Silva, J., Jr.; Cavalcante, C.C.; Fischione, C. Leakage detection in water distribution networks using machine-learning strategies. Water Supply 2023, 23, 1115–1126. [Google Scholar] [CrossRef]
- Park, S.; Ha, J.-H. Development of computational algorithms for daily water leak detection in district metered areas based on the principal component analysis. Desalination Water Treat. 2021, 227, 93–103. [Google Scholar] [CrossRef]
- Mazzolani, G.; Berardi, L.; Laucelli, D.; Simone, A.; Martino, R.; Giustolisi, O. Estimating Leakages in Water Distribution Networks Based Only on Inlet Flow Data. J. Water Resour. Plan. Manag. 2017, 143, 04017014. [Google Scholar] [CrossRef]
- Romero-Ben, L.; Alves, D.; Blesa, J.; Cembrano, G.; Puig, V.; Duviella, E. Leak Localization in Water Distribution Networks Using Data-Driven and Model-Based Approaches. J. Water Resour. Plan. Manag. 2022, 148, 04022016. [Google Scholar] [CrossRef]
- Van Thienen, P.; Pieterse-Quirijns, I.; Vreeburg, J.; Vangeel, K.; Kapelan, Z. Applications of discriminative flow pattern analysis using the CFPD method. Water Supply 2013, 13, 906–913. [Google Scholar] [CrossRef]
- Fidelis Costa, D.; Kepler Soares, A. CFPD Method for Consumption Pattern Changes Identification in a District Metering Area with Digital Water Meters. In Proceedings of the World Environmental and Water Resources Congress 2021, Virtually, 7–11 June 2021; pp. 1014–1022. [Google Scholar]
- Van Thienen, P.; Montiel, F. Flow Analysis and Leak Detection with the CFPD Method in the Paris Drinking Water Distribution System. In Proceedings of the 11th International Conference on Hydroinformatics HIC, New York, NY, USA, 17–21 August 2014. [Google Scholar]
- Van Thienen, P. A method for quantitative discrimination in flow pattern evolution of water distribution supply areas with interpretation in terms of demand and leakage. J. Hydroinform. 2013, 15, 86–102. [Google Scholar] [CrossRef]
- Farah, E.; Shahrour, I. Leakage Detection Using Smart Water System: Combination of Water Balance and Automated Minimum Night Flow. Water Resour. Manag. 2017, 31, 4821–4833. [Google Scholar] [CrossRef]
- Sitaropoulos, K.; Salamone, S.; Sela, L. Frequency-based leak signature investigation using acoustic sensors in urban water distribution networks. Adv. Eng. Inform. 2023, 55, 101905. [Google Scholar] [CrossRef]
- Fan, H.; Tariq, S.; Zayed, T. Acoustic leak detection approaches for water pipelines. Autom. Constr. 2022, 138, 104226. [Google Scholar] [CrossRef]
- Levinas, D.; Perelman, G.; Ostfeld, A. Water Leak Localization Using High-Resolution Pressure Sensors. Water 2021, 13, 591. [Google Scholar] [CrossRef]
- Zeidouni, M.; Pooladi-Darvish, M.; Keith, D.W. Leakage detection and characterization through pressure monitoring. Energy Procedia 2011, 4, 3534–3541. [Google Scholar] [CrossRef][Green Version]
- De Coster, A.; Pérez Medina, J.L.; Nottebaere, M.; Alkhalifeh, K.; Neyt, X.; Vanderdonckt, J.; Lambot, S. Towards an improvement of GPR-based detection of pipes and leaks in water distribution networks. J. Appl. Geophys. 2019, 162, 138–151. [Google Scholar] [CrossRef]
- Ayala–Cabrera, D.; Herrera, M.; Izquierdo, J.; Ocaña–Levario, S.J.; Pérez–García, R. GPR-Based Water Leak Models in Water Distribution Systems. Sensors 2013, 13, 15912–15936. [Google Scholar] [CrossRef]
- Chatelard, C.; Muñoz, J.S.; Krapez, J.C.; Mazel, C.; Olichon, V.; Polo, J.B.; Frédéric, Y.M.; Hélias, F.; Barillot, P.; Legoff, I.; et al. Leak Detection in Water Transmission Systems by Multispectral Remote Sensing with Airplane and UAV. In Proceedings of the IGARSS 2019—2019 IEEE International Geoscience and Remote Sensing Symposium, Yokohama, Japan, 28 July–2 August 2019; pp. 7124–7127. [Google Scholar]
- Smith, B.; John, G.; Stark, B.; Christensen, L.E.; Chen, Y. Applicability of unmanned aerial systems for leak detection. In Proceedings of the 2016 International Conference on Unmanned Aircraft Systems (ICUAS), Arlington, VA, USA, 7–10 June 2016; pp. 1220–1227. [Google Scholar]
Disclaimer/Publisher’s Note: The statements, opinions and data contained in all publications are solely those of the individual author(s) and contributor(s) and not of MDPI and/or the editor(s). MDPI and/or the editor(s) disclaim responsibility for any injury to people or property resulting from any ideas, methods, instructions or products referred to in the content. |
© 2024 by the authors. Licensee MDPI, Basel, Switzerland. This article is an open access article distributed under the terms and conditions of the Creative Commons Attribution (CC BY) license (https://creativecommons.org/licenses/by/4.0/).

