1. Introduction
The problem of reservoir dredging has plagued the water conservancy industry for many years. The gradual development of sedimentation leads to the extension of backwater, the inundation of land, an impact on navigation, and the weakening of the flood control and water supply functions due to the encroachment of the reservoir capacity. The reduction in the sediment transport of the river also leads to an increase in erosion in the downstream channel and seawater erosion in the estuary [
1,
2,
3]. In Northern China, where water resources are relatively scarce, the issue of reduced water supply reliability due to sedimentation is particularly pressing [
4].
To maintain a substantial effective reservoir capacity over the long term and delay the onset of siltation equilibrium, researchers have explored strategies such as joint sediment discharge scheduling of cascade reservoirs [
5,
6], single-reservoir sediment discharge scheduling [
7,
8,
9], and deep-water dredging technology [
10,
11]. In terms of the joint dispatching of sediment discharge in cascade reservoirs, some researchers [
12,
13] have conducted extensive theoretical and experimental studies on density flow sediment discharge and riverbed erosion and deposition. Currently, the artificial shaping of density flows for sediment discharge has been successfully applied in the sediment dispatching of the Wanjiazhai–Sanmenxia–Xiaolangdi cascade reservoir system on the Yellow River. In terms of sediment discharge scheduling in a single reservoir, researchers have conducted significant research on the influence mechanism with multiple objectives, including sediment discharge, water supply, power generation, flood control scheduling, and flood resource utilization, which provide valuable references for solving the optimal scheduling scheme of reservoirs with comprehensive utilization requirements built on sediment-rich rivers [
14,
15,
16,
17,
18]. Regarding deep-water dredging technology, researchers have primarily focused on enhancing pipeline sediment discharge, reducing water consumption rates, minimizing wear, lowering power consumption, and mitigating the impact of cutterheads on the dispersion of underwater pollutants [
19,
20]. In order to ensure that the water supply is not compromised during the flood season when sediment is being discharged by lowering the water level in the main reservoir, the authors of [
21,
22] investigated the utilization of natural reservoir conditions or the construction of a new reverse-regulating reservoir to ensure water supply security for users during the sediment discharge periods of main water supply reservoirs. They transformed the issue into an optimization problem of water quantity dispatching for a group of reservoirs.
However, except for deep-water dredging, none of the above-mentioned dredging methods are suitable for dams without bottom outlets. Numerous reservoirs constructed in the 1950s and 1960s were driven by the urgent need for flood control and water supply. To minimize investment and expedite project completion for immediate benefits, the impact of sedimentation was rarely considered in the design process; many reservoirs did not equip the bottom hole for sediment discharge, relying solely on reserved sedimentation storage to extend their service life. This rendered measures such as emptying for sediment discharge, density current sediment removal, clear-water storage and sediment discharge, and high-channel sand dragging ineffective, all of which depend on bottom outlets for sediment removal [
23]. In recent years, among the reinforcement projects for medium and small reservoirs, it is common to add low-level outlets such as sediment discharge bottom outlets, flood discharge tunnels, and drain tunnels to enhance flood discharge capacity and increase sediment removal. However, the water cost of using water flow to flush and remove sediment is too high, making it difficult to apply in water-scarce regions. Particularly in the reservoirs constructed in Shaanxi and Shanxi provinces, located on the Loess Plateau, the vegetation coverage remains low even after implementing the “Grain for Green” policy. The soil erosion caused by heavy rainstorms is exceptionally severe. The reserved sediment storage capacity has been nearly depleted after several infrequent floods, with some heavily silted reservoirs becoming effectively obsolete. Those tasked with flood control are forced to further lower their flood limit levels, resulting in increased water abandonment and reduced water supply reliability. The utility of these reservoirs in serving economic and social development needs is gradually falling behind.
Therefore, the sedimentation issues in reservoirs without bottom outlets can only be resolved through investment in dredging. The investment-to-return ratio of reservoir dredging plans is a critical indicator in determining the feasibility of dredging projects. However, the future social, economic, and flood prevention benefits of dredging cannot be accurately measured in monetary terms. Therefore, the current substantial investment amount is the main reason why reservoir dredging projects struggle to get off the ground. Reducing the investment amount for dredging is a key focus in the design of dredging plans [
24,
25,
26]. Generally, the higher the proportion of dry land dredging, the lower the total investment in dredging and the higher the dredging efficiency. Compared with deep-water dredging, dry land dredging is simple and low in cost, making it the most cost-effective aspect among the three major investments in dredging, transportation, and disposal. However, the biggest drawback of dry land dredging is the suspension of reservoir functions, which is unacceptable for water supply reservoirs in Northern China. Some design proposals suggest that utilizing reverse-regulating reservoirs to temporarily take over the water supply tasks of reservoirs undergoing dredging can further lower the operational water level during the dredging process, thereby increasing the proportion of dry land dredging. In a sediment dredging plan for Reservoir A in Northern China, which involves the removal of 40 million m
3 of sediment, the construction of a water supply tunnel from downstream Reservoir B to the water users has been proposed. This would enable Reservoir B to substitute for the 26 million m
3 of drinking water previously supplied by Reservoir A. Consequently, the operating water level of Reservoir A could be reduced, leading to a decrease in the dredging investment from CNY 3.785 billion to CNY 3.12 billion. However, this plan has not yet been implemented. Utilizing reservoirs with certain hydraulic connections for compensatory regulation, coupled with a modest investment in supporting projects, can reduce the cost of sediment dredging while enhancing the regional capacity for water allocation. This approach presents an intriguing solution.
China is advancing the construction of its national water network project, which, based on natural and artificial water bodies, will gradually enhance hydraulic connections between them through engineering measures. This initiative aims to strengthen water resource allocation capabilities, achieve mutual water supply across basins, address the uneven spatial distribution of water resources on a larger scale, and accelerate the management of groundwater over-extraction. The construction of the national water grid primarily encompasses water transfer projects and storage facilities. Beyond the newly constructed single water diversion projects, establishing a network-like framework is gradually achieved by adding key interconnection projects and integrating with previously built inter-basin water transfer systems. This network extends artificial, controllable water conveyance pipelines, tunnels, channels, reservoirs, and natural rivers to cover human settlements, akin to the distribution of nerve endings. If these water transfer projects can be fully utilized, complemented by necessary investment in supporting facilities to establish more complex water volume connections between reservoirs and enhance their mutual compensation capabilities, completely draining severely silted reservoirs for dry land dredging might be feasible.
Based on the above analysis, this study presents a research approach for siltation reservoir groups in water-scarce areas through compensatory regulation to achieve dry land dredging. Using a typical inter-basin water diversion project in Northern China as the research object, we address the optimization of sequential emptying and dredging strategies for water supply reservoir groups. First, we clarify the hydraulic connections between reservoirs and then select a typical dry year group for the basin. By employing a two-step optimization method, we construct both single-reservoir optimal scheduling models and multi-reservoir joint multi-objective optimal scheduling models. Through optimization calculations under different emptying sequences, we utilized a subjective–objective comprehensive weighting method to select the optimal solution [
27]. By analyzing the water supply effects under various emptying sequences, we obtain the mechanism of influence between the characteristics of the reservoir, the sequence of emptying, and the operation indicators. The research findings offer new methods for dredging siltation reservoirs in water-scarce regions, providing valuable references for reservoir managers, river basin managers, dredging service industries, and policy makers in relevant departments.
2. Overview of the Study Area
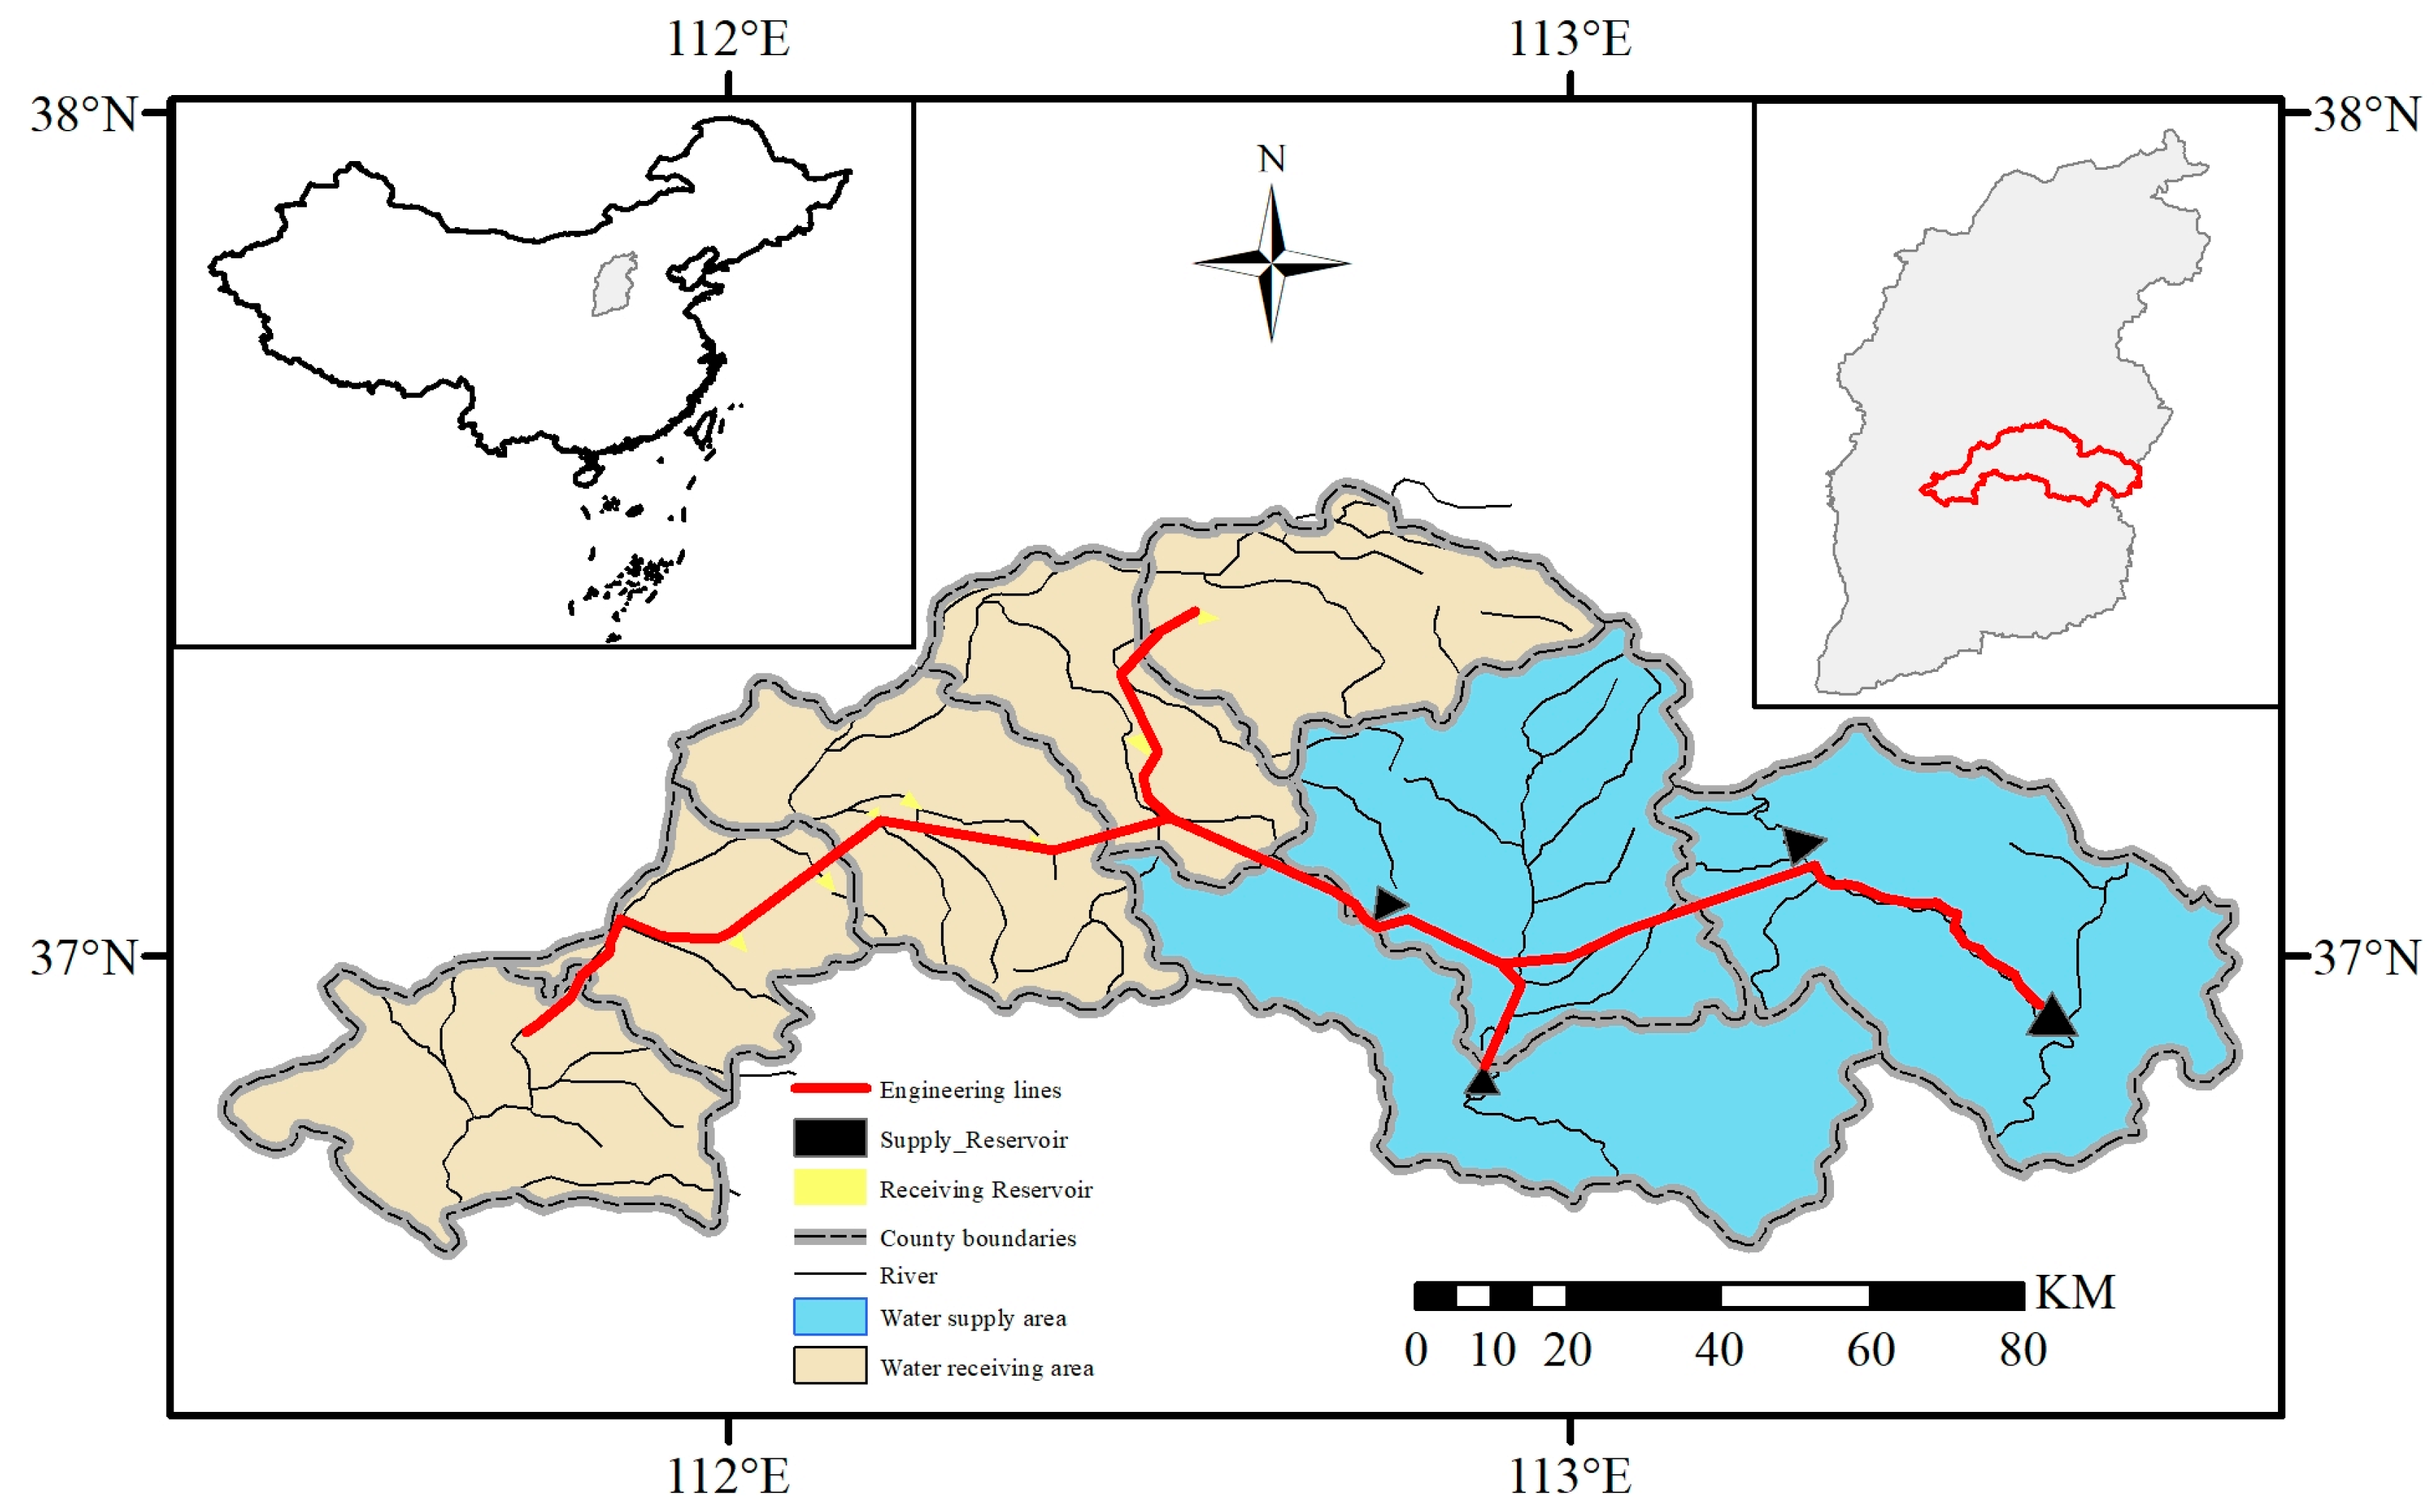
Figure 1 illustrates a water supply project in Northern China that transfers water from a relatively abundant basin to a water-scarce region, addressing the shortfall in industrial, domestic, and agricultural water needs. For clarity, this study divides the project into the transfer area and the receiving area. The transfer area has a per capita water resource volume of 820 m
3, while the receiving area has 257 m
3. Although the per capita water resource volume in China is 2100 m
3, it only accounts for 28% of the global average. Therefore, objectively speaking, the water resource in the transfer area is not abundant. Consequently, this project connects four reservoirs (ZC, YZ, GH, and SX) to achieve the designed annual water transfer target of 112 million m
3. However, three of these source reservoirs were constructed in the 1950s and 1960s and are now severely silted. This has weakened their flood control and water storage capabilities, resulting in a low fill rate. The actual water supply capacity of the project is significantly lower than the designed requirements.
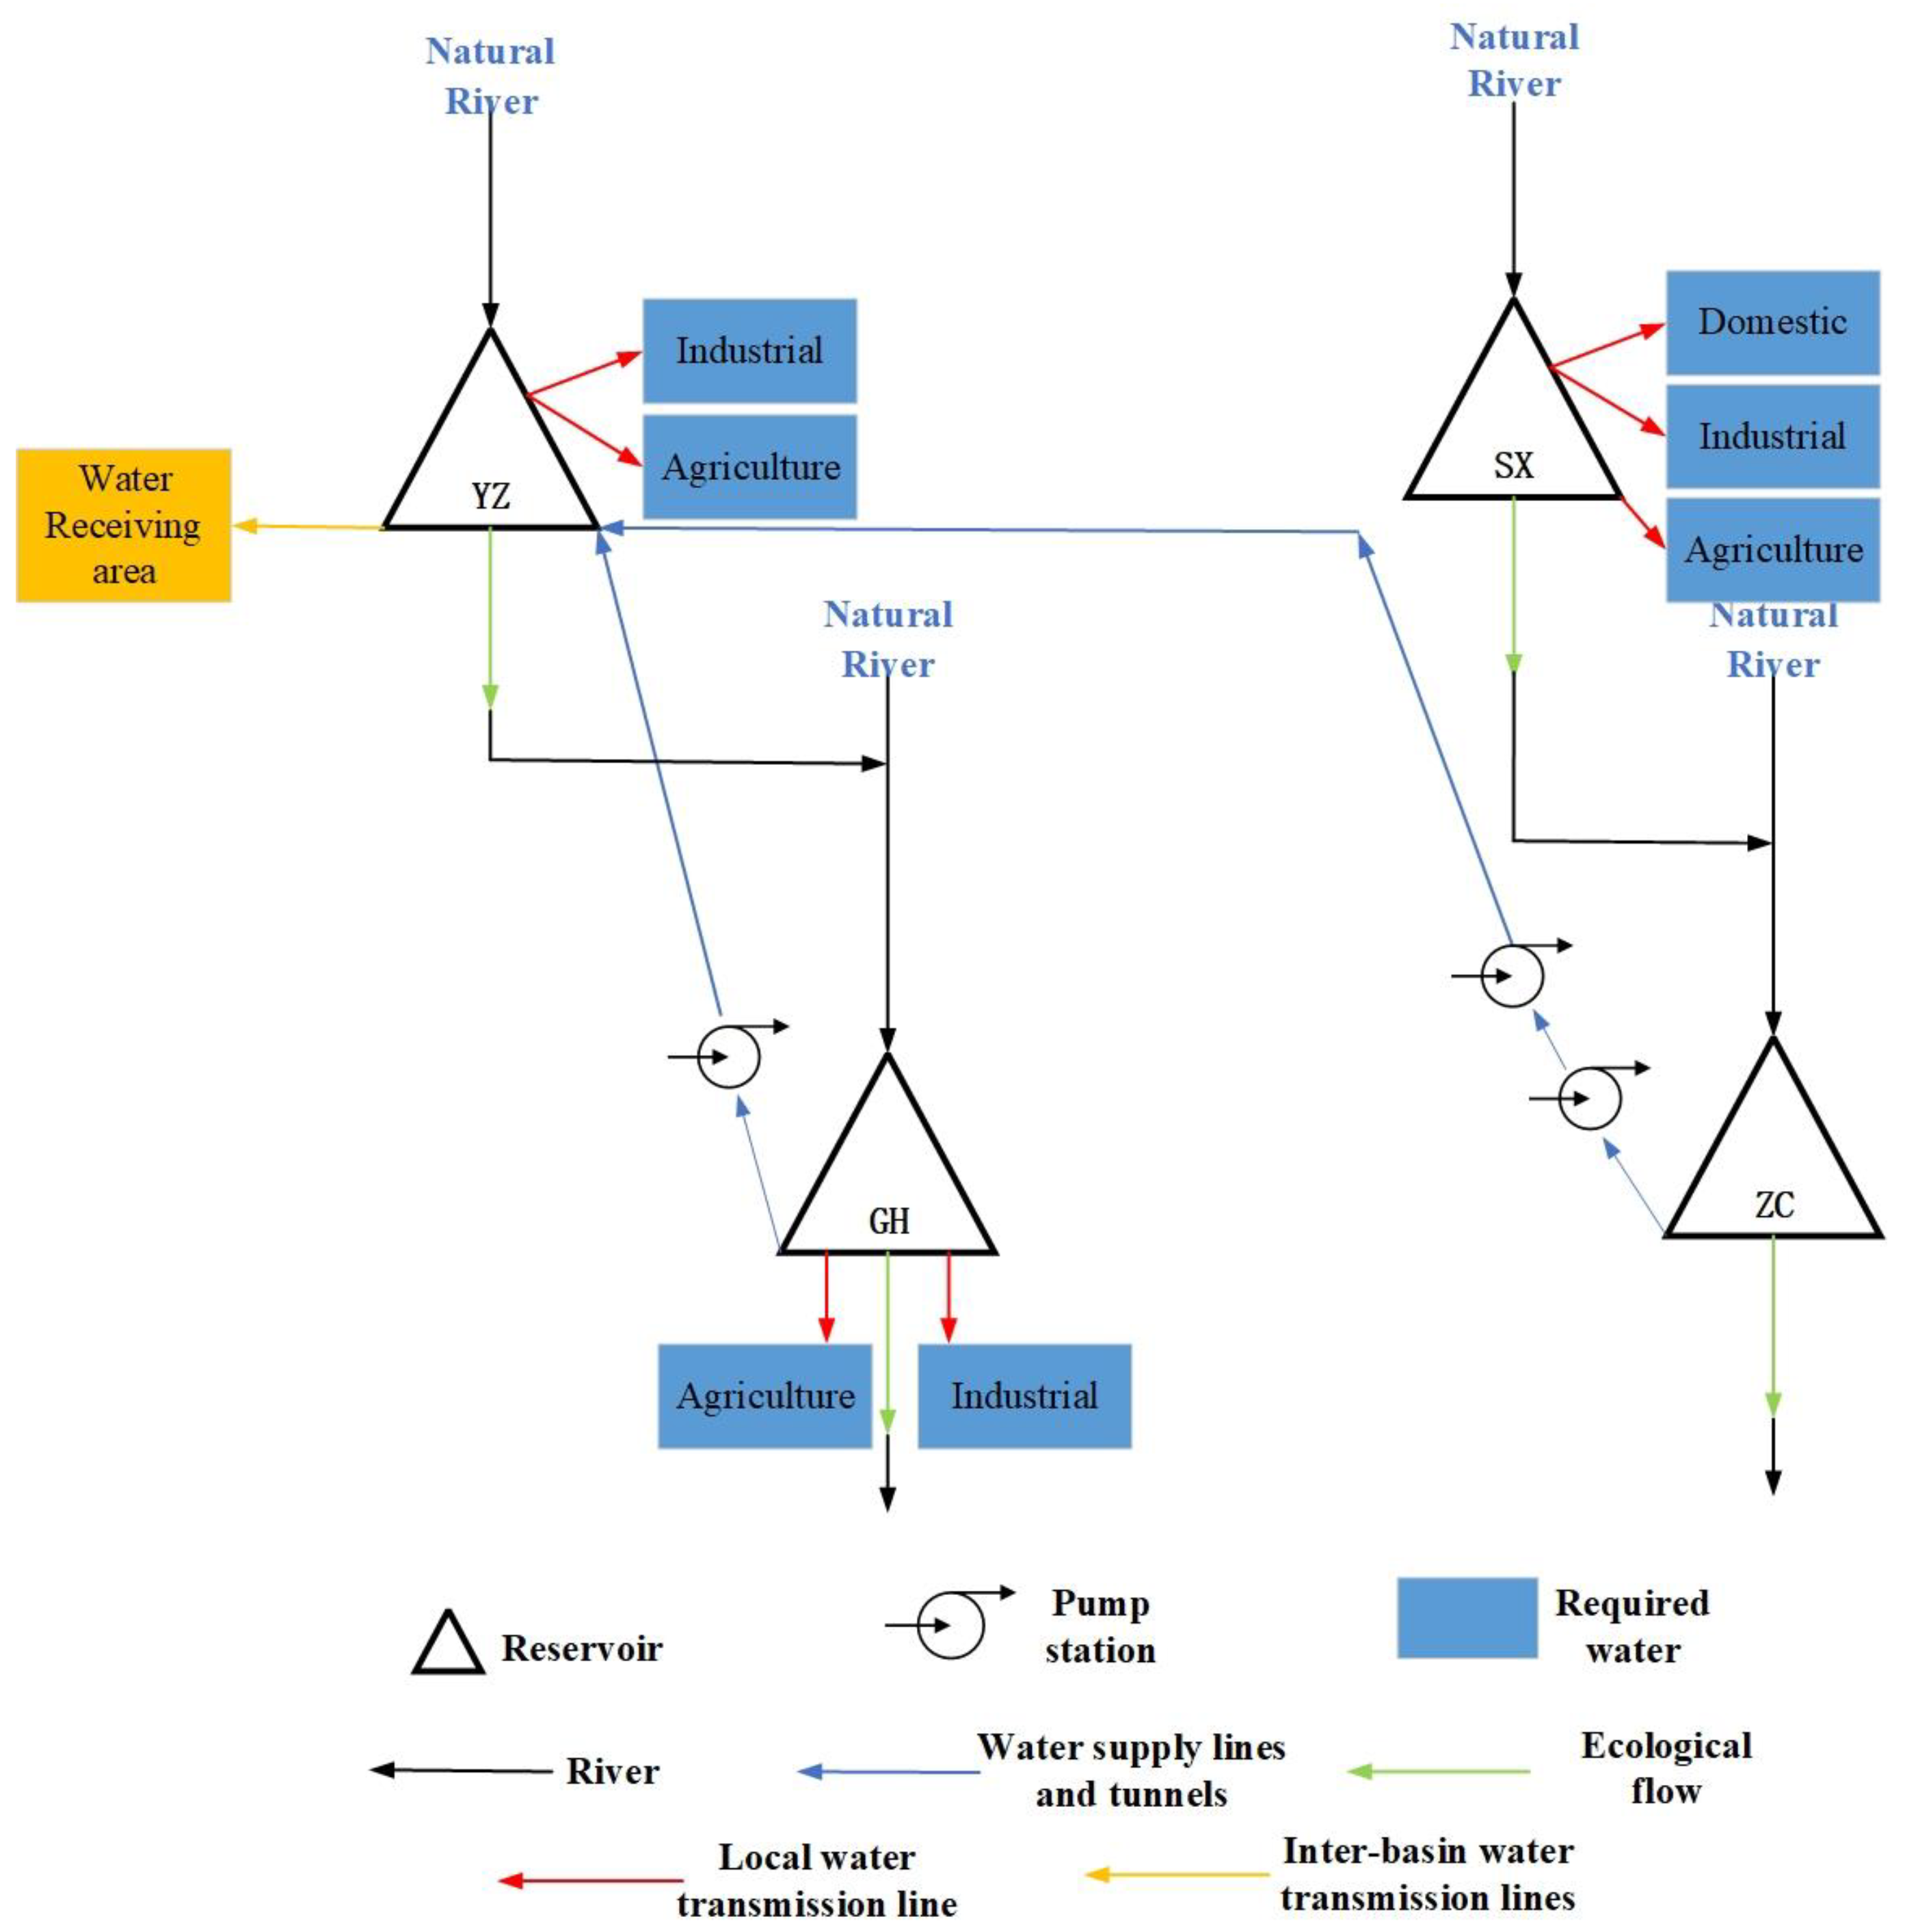
Figure 2 illustrates the hydraulic connections among four source reservoirs in the transfer area. Among them, the ZC reservoir is a newly constructed reservoir that has not yet begun to store water, while the YZ, GH, and SX reservoirs have varying degrees of sedimentation. The water from the YZ and SX reservoirs can flow by gravity to the receiving area, resulting in lower water supply costs. In contrast, the GH and ZC reservoirs, due to their lower altitudes, require pumping through 1- and 2-stage pumping stations, respectively, to be transported to the receiving area, leading to higher water supply costs. To clarify the current storage capacity curves of each reservoir, the research team conducted an oblique survey of the ZC reservoir (empty) using a drone equipped with a visible light camera in June 2022. Measurements of the YZ, GH, and SX reservoirs were conducted in March and April 2023 using drones with visible light cameras and unmanned boats equipped with multi-beam echo sounders [
28]. Upon analyzing the sedimentation conditions of three reservoirs based on the design data from the time of their construction, it was concluded that each reservoir had accumulated sediments equivalent to 21.2%, 50.5%, and 13.1% of their originally designed total storage capacities, respectively.
The four water source reservoirs in the transfer area each are responsible for supplying water to their respective regions. Industrial, domestic, and agricultural water demands are projected based on the assessments of future population growth and economic development by government planning departments. The ecological water demand within river channels is calculated using the Qp method after fitting long-series monthly average inflow data with a P-III-type curve [
29]. The receiving area is a concentrated water-deficient region comprising five towns, where groundwater has long been one of the primary water sources. Prolonged overexploitation has led to severe groundwater depression cones. In terms of total volume, this inter-basin water supply project cannot replace the local groundwater source and can only replace a portion of the groundwater to mitigate the ecological and environmental degradation caused by the overexploitation of groundwater.
3. Methodology
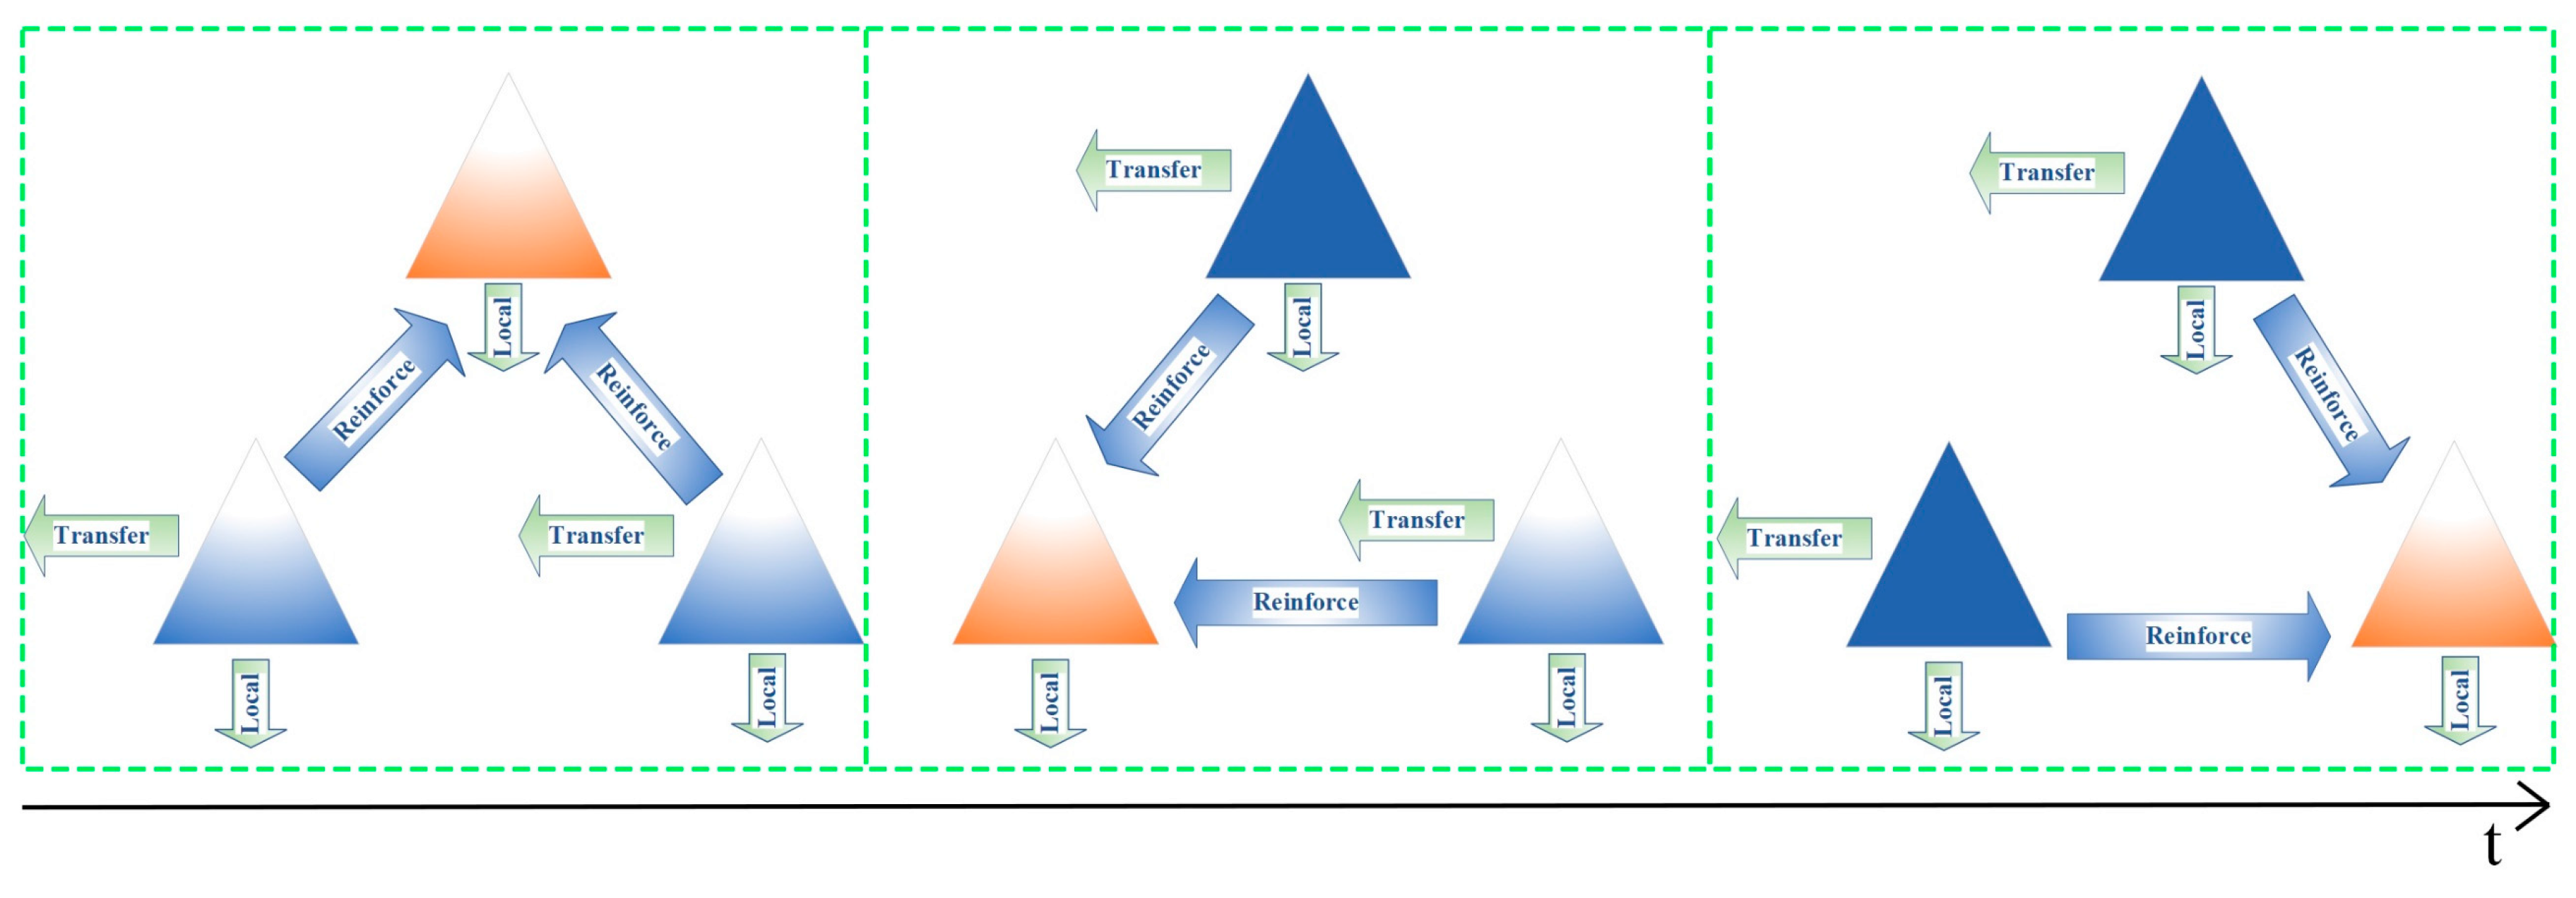
It is widely acknowledged that the lower the reservoir water level, the greater the proportion of the dry land dredging volume and the higher the efficiency of dredging. However, lowering the water level can impact the reservoir’s water supply function. Therefore, this study proposes the concept of sequential dry land dredging by emptying reservoirs in rounds. As shown in
Figure 3, the process involves sequentially draining reservoirs with severe siltation for dry land dredging, with the water supply tasks during the draining period compensated by reservoirs hydraulically connected to the ones being dredged. This approach ensures efficient dry land dredging without compromising the water supply function of the reservoirs. Hydraulic connections can be categorized into natural and artificial types. Natural hydraulic connections involve the compensation of downstream reservoirs by upstream reservoirs. In contrast, artificial hydraulic connections are achieved by constructing pipes, tunnels, and channels to enable upstream reservoirs to compensate for downstream reservoirs. Additionally, pump stations and pipelines can be constructed to allow downstream reservoirs to compensate for upstream reservoirs.
However, the decision on the sequence for emptying the reservoir group with the lowest risk cannot be made directly. This is due to the following reasons: the water transfer company possesses its own constructed pipelines, tunnels, canals, valves, and pumping stations. However, the ownership of the reservoirs and water resources does not belong to the water transfer company. The company only holds the right to dispatch a portion of the water volume under the premise of reaching a consensus with each reservoir to ensure the supply of water resources to the receiving area. It should be clearly stipulated that the benefits generated from replacing dredging reservoirs with compensation reservoirs for water supply should accrue entirely to the management entity of the compensation reservoirs, with water prices maintained at the original price, and the water transfer company shall not have a share. Additionally, the electricity costs incurred during the water compensation process when utilizing pumping stations should be borne by the water transfer company. Therefore, the water transfer company requires an optimal emptying sequence plan and a joint-dispatching scheme for reservoir groups to reduce its operational costs and ensure a stable water supply to the receiving area. Obviously, the initial phase of dredging is the most challenging period, characterized by a reduced number of reservoirs involved in water supply, the weakest capacity for water transfer, difficulties in profitability, the highest costs, and the greatest risks in compensation regulation. As more reservoirs complete dredging and the overall water supply capacity increases, the difficulty in profitability decreases, and the risks associated with compensation regulation also diminish. The ideal sequence for emptying and dredging should enhance profits at the initial stage of dredging while reducing compensation risks. However, the profitability at the early stage of dredging is related to water prices, transferred water volumes, and electricity costs. High-value water users have high requirements for reliability, which determines whether users will be willing to purchase water.
Should the SX reservoir be the first to release water, its water supply responsibilities would solely fall on the ZC reservoir. However, during the initial period when the overall water supply capacity is at its lowest, the electricity costs incurred by the ZC reservoir to compensate for water supply through pumping stations appear relatively high compared to the profit from the water supply.
If the YZ reservoir is the first to be emptied, its water supply responsibilities can be jointly undertaken by SX, GH, or ZC reservoirs. Among these, both GH and ZC reservoirs require pumping stations, while the SX reservoir can flow naturally to the vicinity of the YZ reservoir through a tunnel. However, the storage capacity of the SX reservoir is relatively small, and the pressure of simultaneously supplying water to both the local area and the YZ reservoir is significant, resulting in a high risk of water supply disruption. Therefore, it is likely that the pumping stations of the ZC and GH reservoirs will need to be activated.
Should the GH reservoir be the first to release water, its supply duties can be jointly undertaken by SX, YZ, and ZC reservoirs. Utilizing the gravity-fed supply from YZ and SX reservoirs offers the lowest cost. However, if the inflow to YZ and SX reservoirs is insufficient to meet both local demand and the demand of the GH reservoir, water must be drawn from the ZC reservoir, necessitating a rational allocation between gravity-fed and pumped water.
Based on the above discussion, it may be most rational to discharge the GH reservoir first, as the support from the water volumes of the two reservoirs might render it unnecessary to activate the pump station at the ZC reservoir. Additionally, given that the GH reservoir has the largest storage capacity, initiating sediment removal can enhance the subsequent amount of water available for external transfer. From a profit perspective, the most cost-effective approach is to first dredge reservoirs capable of gravity-fed water supply. However, in this case, the two reservoirs that can utilize gravity-fed water may not achieve a stable outflow for external water transfer, or the stable outflow may be minimal.
From the perspective of the social benefits of dredging, there should be no distinction between priority and delay in the dredging sequence. However, these arguments are merely qualitative and have not been simulated with typical inflow data and scheduling plans, lacking quantitative results for reference. Moreover, it is not rigorous to simply determine which reservoir to empty first based on cost-effectiveness and then directly decide to empty that reservoir first. The sequence of emptying and dredging silted reservoirs is a sequential decision-making process, and its merits need to be judged based on the water supply index performance and the trend of water supply index changes throughout the whole dredging period.
4. Optimization Dispatching Model of Emptying Dredging
4.1. Optimization Strategies and Decision Variables
The volume of soil is a primary factor in determining the duration of dredging projects; ascertaining the volume of dredging can roughly establish the project timeline. However, even with advance planning of the dredging volume and construction period, it is difficult to accurately predict the actual duration. The probability of occurrence of factors such as funding issues, weather conditions, epidemic outbreaks, and mechanical failures that lead to work stoppages, as well as additional risk mitigation and slope-rectification tasks that may be added during the reservoir dredging period is considered to be the same in this study. Therefore, different emptying sequences are not expected to impact the overall construction period.
Consequently, water supply indices can be calculated under the conditions of a typical dry year. However, due to the varying dredging durations of individual reservoirs, the results calculated over a single typical year are highly contingent. Extending the scheduling period would significantly increase the dimensionality of decision variables, thereby increasing the difficulty of finding a global optimal solution. This study ultimately selected a 3-year scheduling period with monthly scheduling intervals. Utilizing long-series inflow data for each reservoir, the P-III curve was employed to rank the total 3-year runoff volumes, resulting in the design of dry year groups for each reservoir. Finally, the total sum of squared deviations was minimized to select the typical dry year group for the transfer area [
30].
This article does not consider shipping and power generation flows because reservoirs with shipping functions and significant power generation benefits are mostly located in regions abundant in water resources. These reservoirs are constructed to a high standard, with complete hub engineering, and most possess the capability to discharge sediment at low water levels, thus not requiring consideration under the background of this article. However, the impact on flood prevention during the emptying and desilting process is significant. In the event of rare heavy rainstorms, to ensure the flood discharge safety of downstream river channels, the emptied reservoirs will be refilled to store floodwaters and then emptied again after the flood season. This will inevitably reintroduce some sediment.
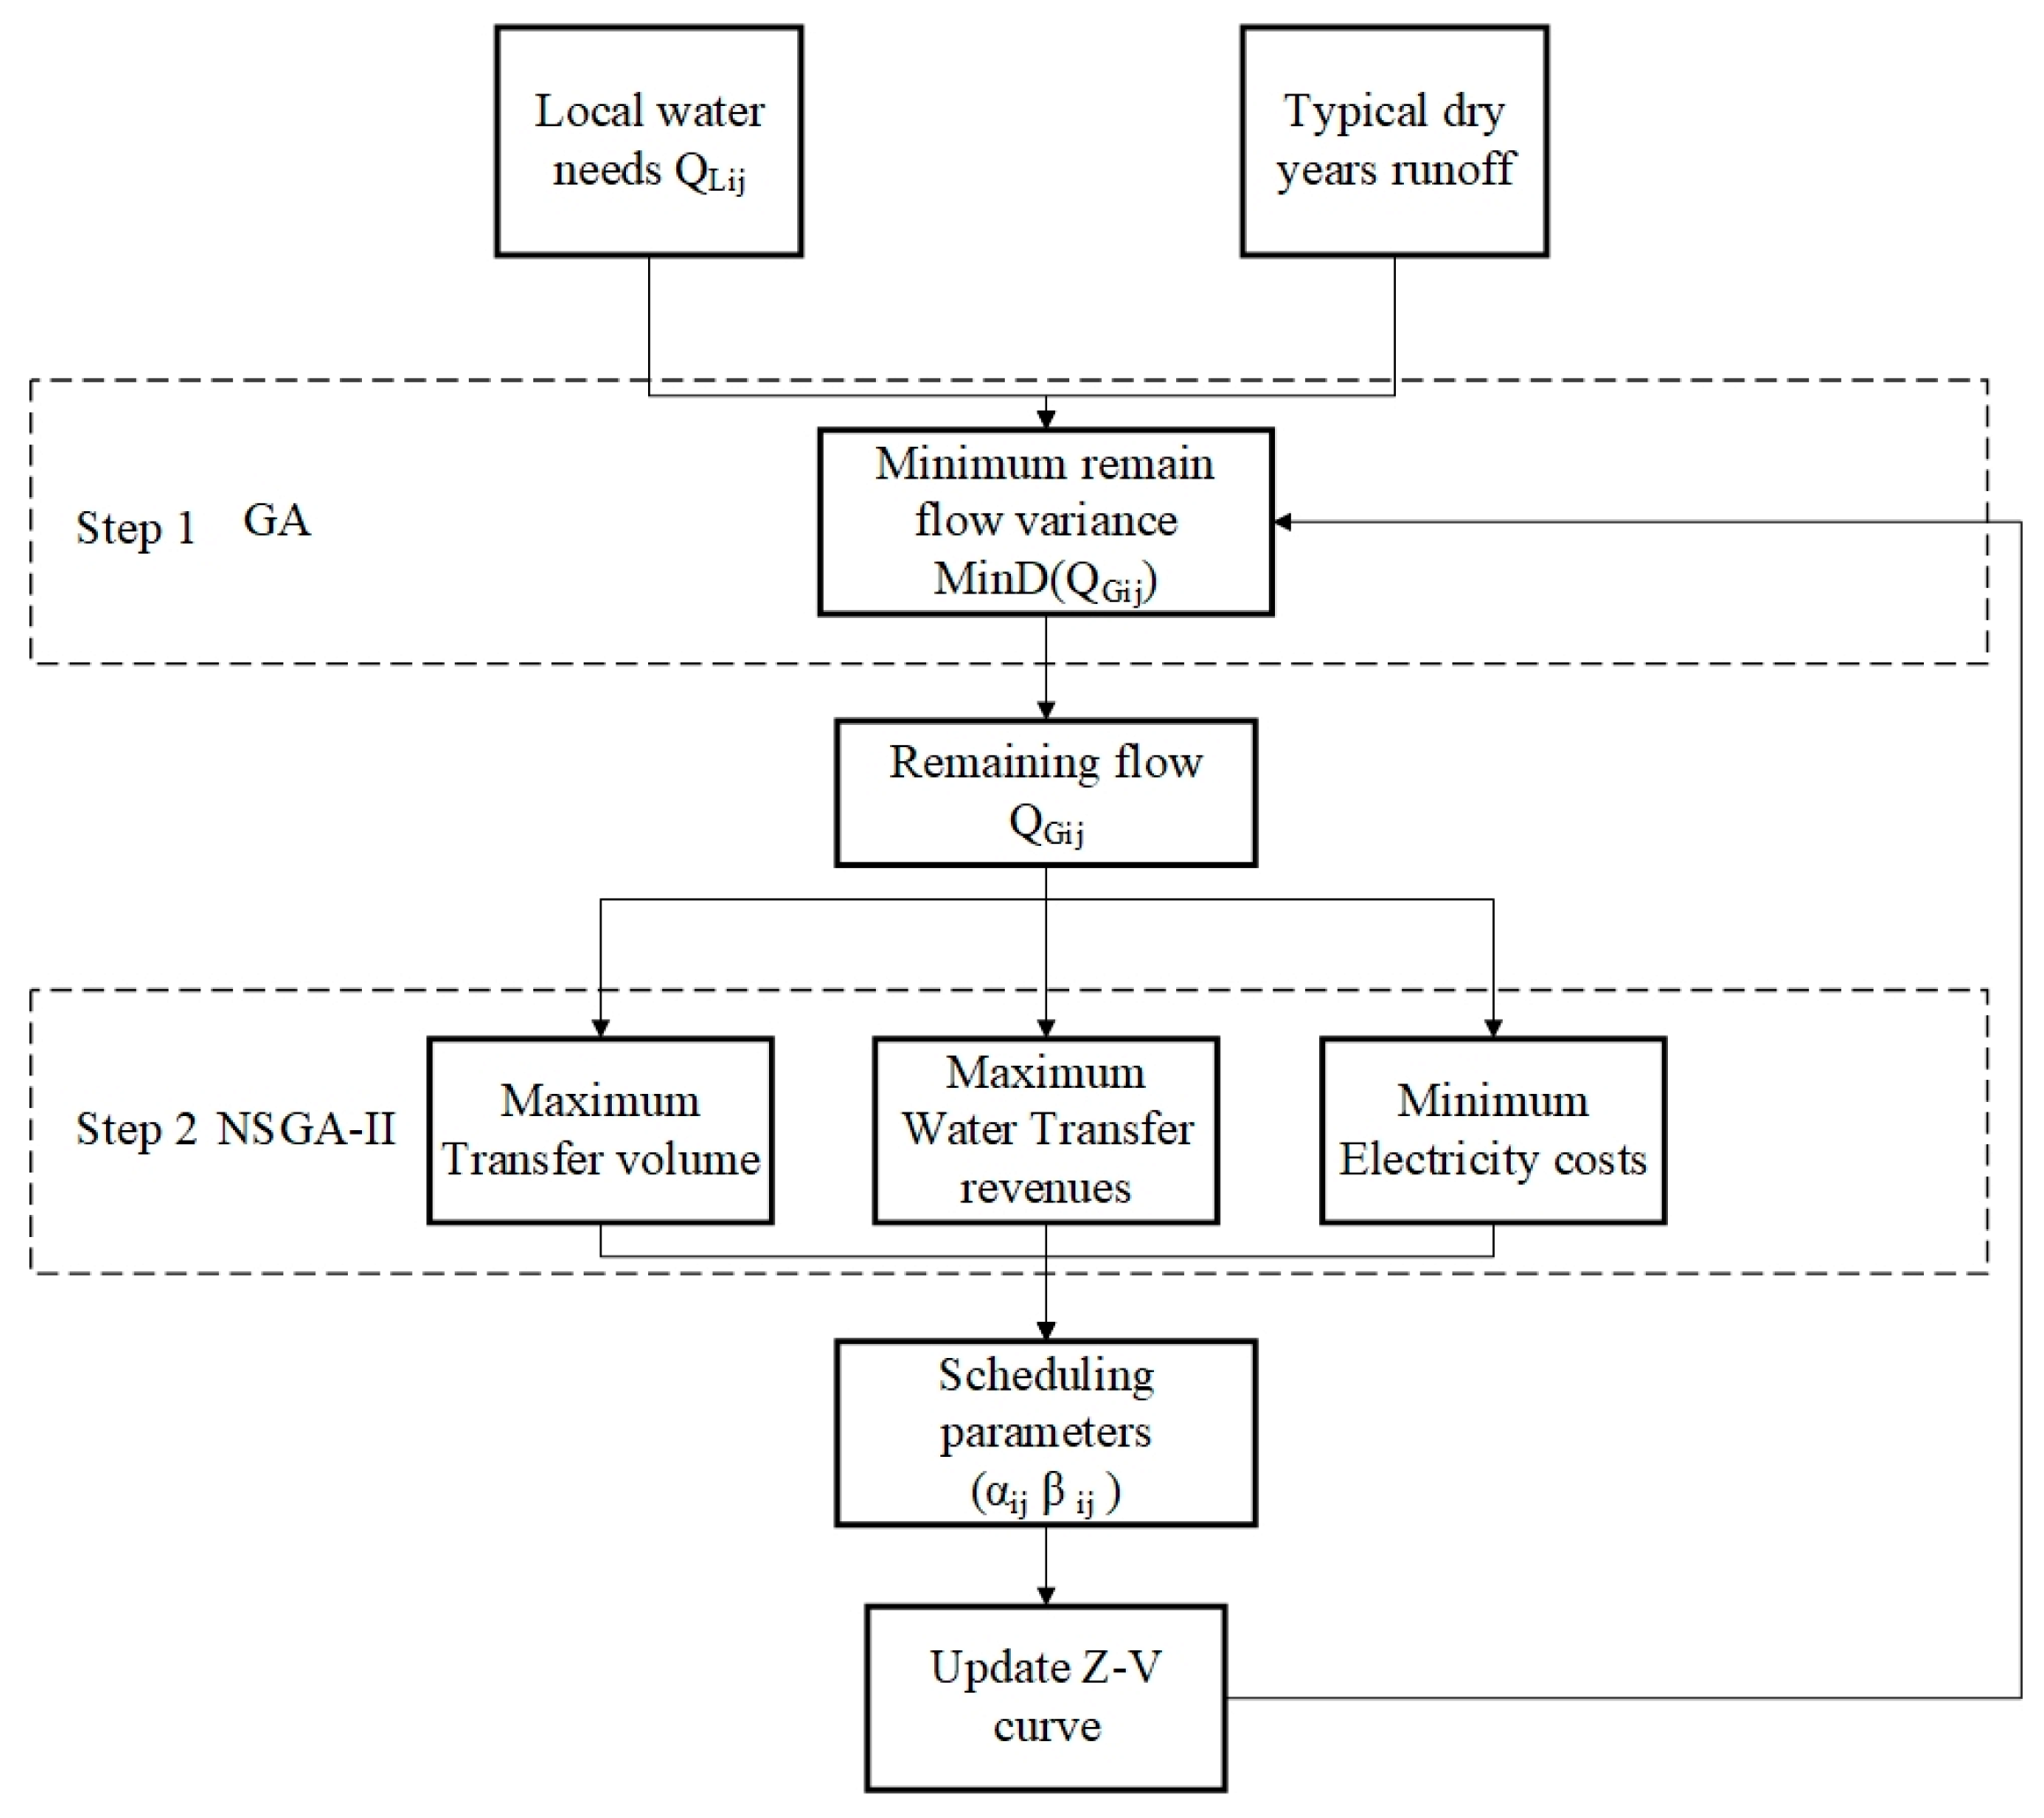
The outflow from the compensating reservoir group consists of three types of flows: external transfer, compensatory, and discharge (local water demand). Consequently, at least the end-of-period water level and two types of flows need to be considered as decision variables. However, due to the numerous constraints, random search algorithms prove inefficient when faced with the vast solution space and the potential fragmentation of the feasible domain by constraints. Therefore, this paper uses two-step optimization to reduce the dimensionality of the model, as shown in
Figure 4.
The first step is taking the water level at the end of the period as the decision-making variable and optimizing each reservoir individually to minimize the variance of the remaining flow QGij, subject to the constraint of meeting the local water demand. Here, QGij represents the total of transferred and compensatory flows, resulting in the optimal remaining flow process that each reservoir can provide through individual regulation.
In the second layer, the optimal remaining flow of each reservoir serves as the upper limit, dividing the remaining flow into two parts: external transfer flow and compensatory flow. These are distinguished by the proportion coefficient α for external transfer flow and the utilization coefficient β for drawing water from different reservoirs, transforming the decision variables into the α, β values for each reservoir and time period. The values of α and β range from 0 to 1, undergoing multi-objective optimization.
4.2. Objective Function
The objective function of the second step involves three aspects: the total water supply, revenue, and cost. The revenue is calculated by multiplying the price of water by the total amount of water transferred. The water pricing for inter-basin water transfer projects should be determined under the coordination of the government, considering both the construction costs of the project and the local development context, ensuring that the water price fluctuates within a reasonable range. This approach aims to secure a certain profit for the inter-basin water transfer companies while reducing the water costs for users.
The study area suffers from widespread water scarcity and reservoir siltation, leading to a low water supply guarantee rate. This situation has dampened the enthusiasm of high-value water users to utilize transferred water while creating a conflict between the water fee payment capacity of agricultural users and the costs incurred by the water transfer company [
31].
When a floating water price is employed to attract high-value water users, it is necessary to base the pricing on the supply effectiveness of the water transfer company. This approach draws on the broad and shallow damage principle, which evenly distributes water deficits across time periods [
32].
This study defines floating water prices as follows: even when the total water supply is substantial, it cannot replace the groundwater sources in the water-receiving area. Assuming that water fees are settled at the end of the year if the water scarcity rate in the receiving area is more uniform, it indicates that the water supply trend aligns with the water usage trend, signifying better water supply effectiveness. Thus, the corresponding water price should be increased. Conversely, if the variance of the water scarcity rate in the receiving area is larger, it indicates that the water supply trend does not meet the water usage trend, and the corresponding water price should be reduced [
33]. In reducing electricity costs, drawing water from different reservoirs implies varying extraction costs, and to minimize these costs, it is essential to avoid using pump stations as much as possible.
In the first step, in addition to the reservoir that has been emptied, the local water supply tasks of each reservoir are independently undertaken, serving as constraints for individual reservoir optimization; in the second step, the water supply tasks assigned to the emptied reservoir are compensated by other reservoirs, acting as constraints for joint optimization.
The objective function for the single-objective optimization model for a single reservoir is as follows:
where Q
Gij represents the remaining flow of the reservoir j during time period i, and Q
Oij and Q
Lij represent the outflow and local water demand flow of period i, respectively.
The objective function for the multi-objective optimization model of the reservoir group is as follows:
- (1)
Maximum external water transfer
where
αij represents the proportion of remaining flow that reservoir j allocates for external transfer during period i; and
βij represents the proportion of remaining flow that reservoir j utilizes during period i.
where Pri represents the unit price of the water supply; Var represents the variance of water scarcity rate in the receiving area, where the smaller the variance of the water scarcity rate, the higher the unit price. The base water price is set at 5 CNY/m
3.
- (3)
Lowest electricity rates
where C represents the electricity price, P
h represents the total power consumption of pump station h over the entire scheduling period, and K represents the number of pump stations.
4.3. Constraints
- (1)
Water balance constraint
where V
ij and V
i+1j represent the reservoir j capacities for time periods i and i + 1, respectively; V
Nij represents the inflow volume during time period i; V
Lij represents the local water supply volume during time period i; V
Tij represents the volume of water transferred from external sources at time period i; V
Sij represents the compensatory water volume at time period i; V
Aij represents the discharge of water abandoned during time period i; V
Eij represents the amount of water lost by way of evaporation at time period i of reservoir j; E
ij represents the water surface evaporation depth of reservoir j at time period i, derived from the design report of each reservoir; S
ij represents the average water surface area of the reservoir at time period i of reservoir j, which can be obtained by querying the water level–area curve, because the water level–area curve after dredging is difficult to estimate, so the same curve is adopted as before dredging.
- (2)
Water transport capacity constraints
where Q
Tij represents the transfer flow from reservoir j during time period i; Q
Sij represents the compensatory flow from reservoir j during time period i; and Q
Uj represents the maximum value of the tunnel and pumping station water conveyance capacity allocated to reservoir j by the inter-basin water transfer project.
- (3)
Water level operation constraints
where X
ij represents the water level of reservoir j during time period i; X
Lij and X
Uij represent the permissible minimum and maximum water levels of reservoir j during time period i, respectively; the value of X
Lij is set at the dead storage level of each reservoir; and X
Uij is determined by the flood limit level during the flood season and the normal storage level during the non-flood season. These controls are applied irrespective of whether the reservoir has been dredged, adhering to the current characteristic water level regulations.
- (4)
Compensation for water supply constraints
where Q
Li represents the water demand flow of the reservoir during emptying and dredging.
4.4. Initial Conditions
To maximize the assurance of water demand during consecutive dry years, it is advisable to commence the emptying construction of a specific reservoir when all reservoirs are fully stocked or at their highest water levels, typically after the flood season, which marks the peak water level within a year. In this study, the starting time is the beginning of October, the dispatch period is from the beginning of October of the first year to the end of September of the third year, and the starting water level is set at the normal storage level, which means that the compensation reservoir group should ensure that the reservoir group is full at the end of the flood season through accurate meteorological forecasting and scheduling during the flood season of the current year.
4.5. Solution Selection
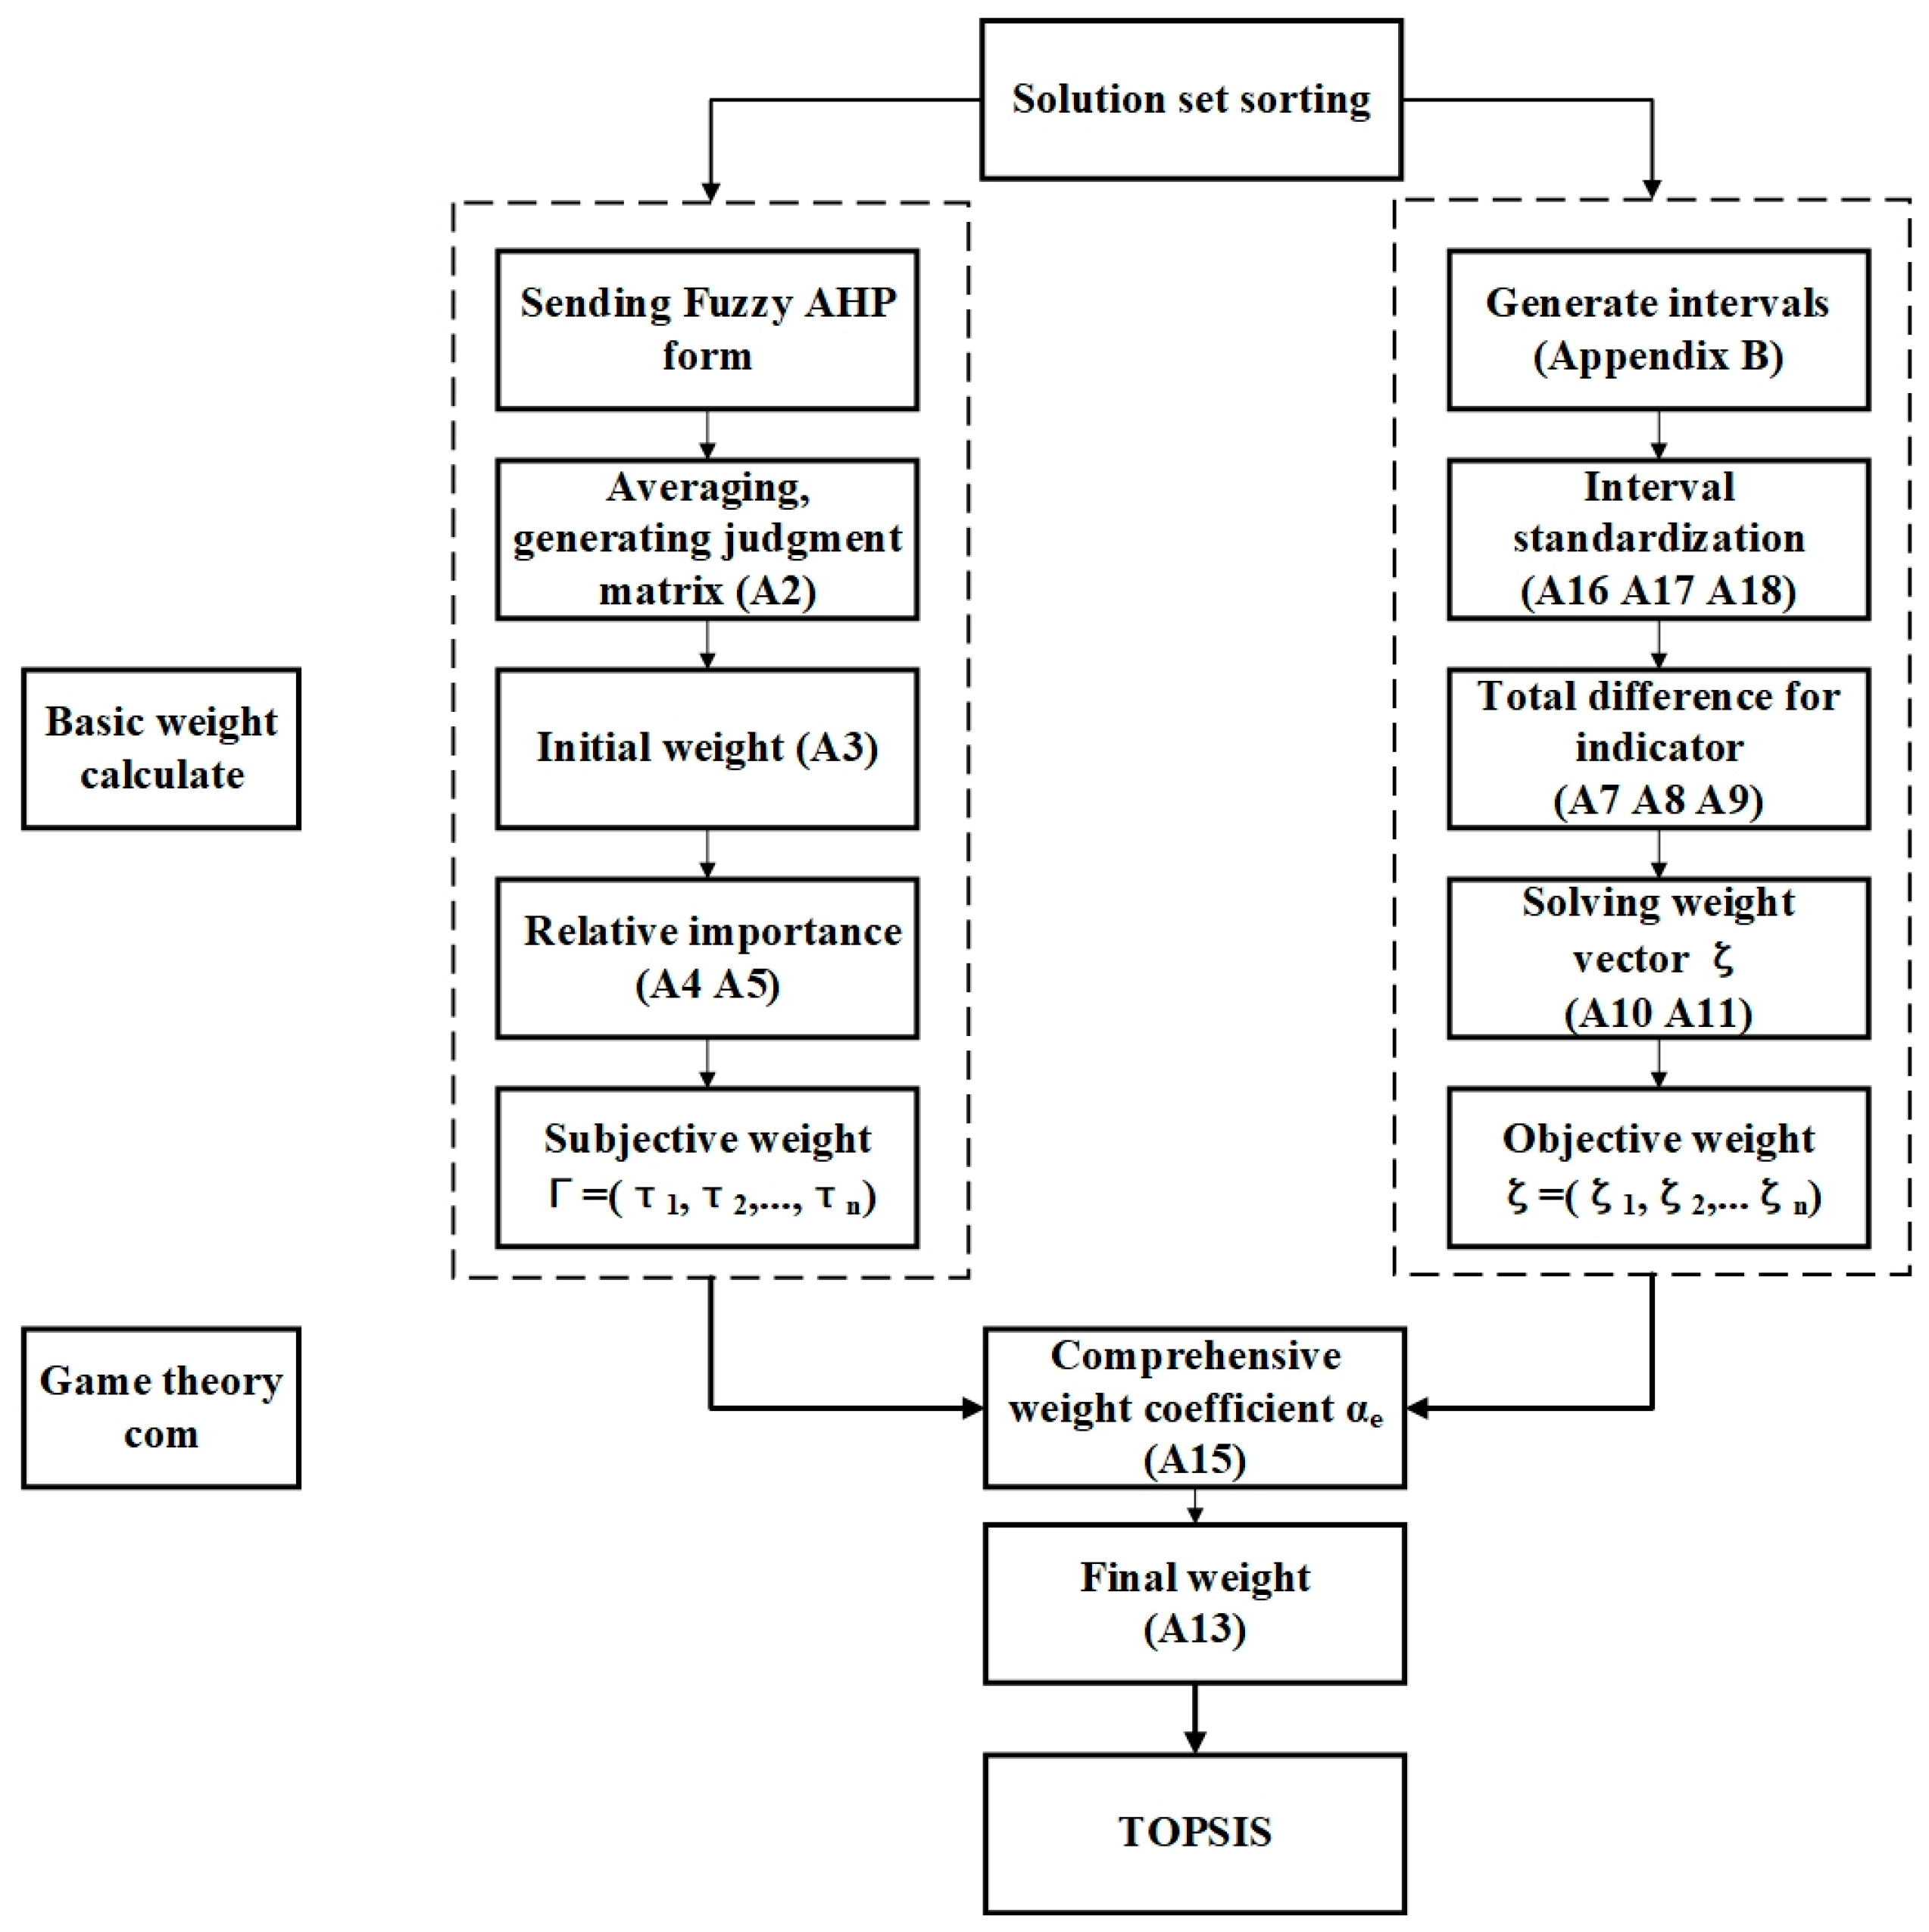
Figure 5 shows the weighting process for sorting Pareto sets in this paper. The game theory-based approach that integrates subjective and objective weighting is employed [
27], and the Pareto set obtained from the second-step optimization is scored and ranked. The subjective weighting employs triangular fuzzy numbers to represent the comparative judgments of the importance between pairwise indicators [
34,
35], forming a Fuzzy Analytic Hierarchy Process. If only the subjective weights are considered, the indicator with a more concentrated distribution of solutions may obtain larger weights, thereby increasing the probability of selecting the local optimal solution. Therefore, objective weighting utilizes a method based on the degree of interval separation, characterizing the degree of separation of the solution set under each indicator.
Appendix B shows the method for converting indicator values into intervals. Finally, a comprehensive weighting method based on game theory is introduced [
36], which seeks a balanced and consistent solution between the subjective and objective weights, minimizing the deviation between the final possible weights and the individual basic weights, thereby obtaining the final comprehensive weighting value. The specific formula for calculating the basic weights
Γ,
ζ, and the coefficient α
e of the base weight are shown in
Appendix A.
5. Results and Discussion
5.1. Typical Dry Year Group
The specific drought frequency was set at 95%, and the least squares approximation method was employed to calculate the typical dry year group for the watershed, yielding the hydrological years of 1991 to 1993. As
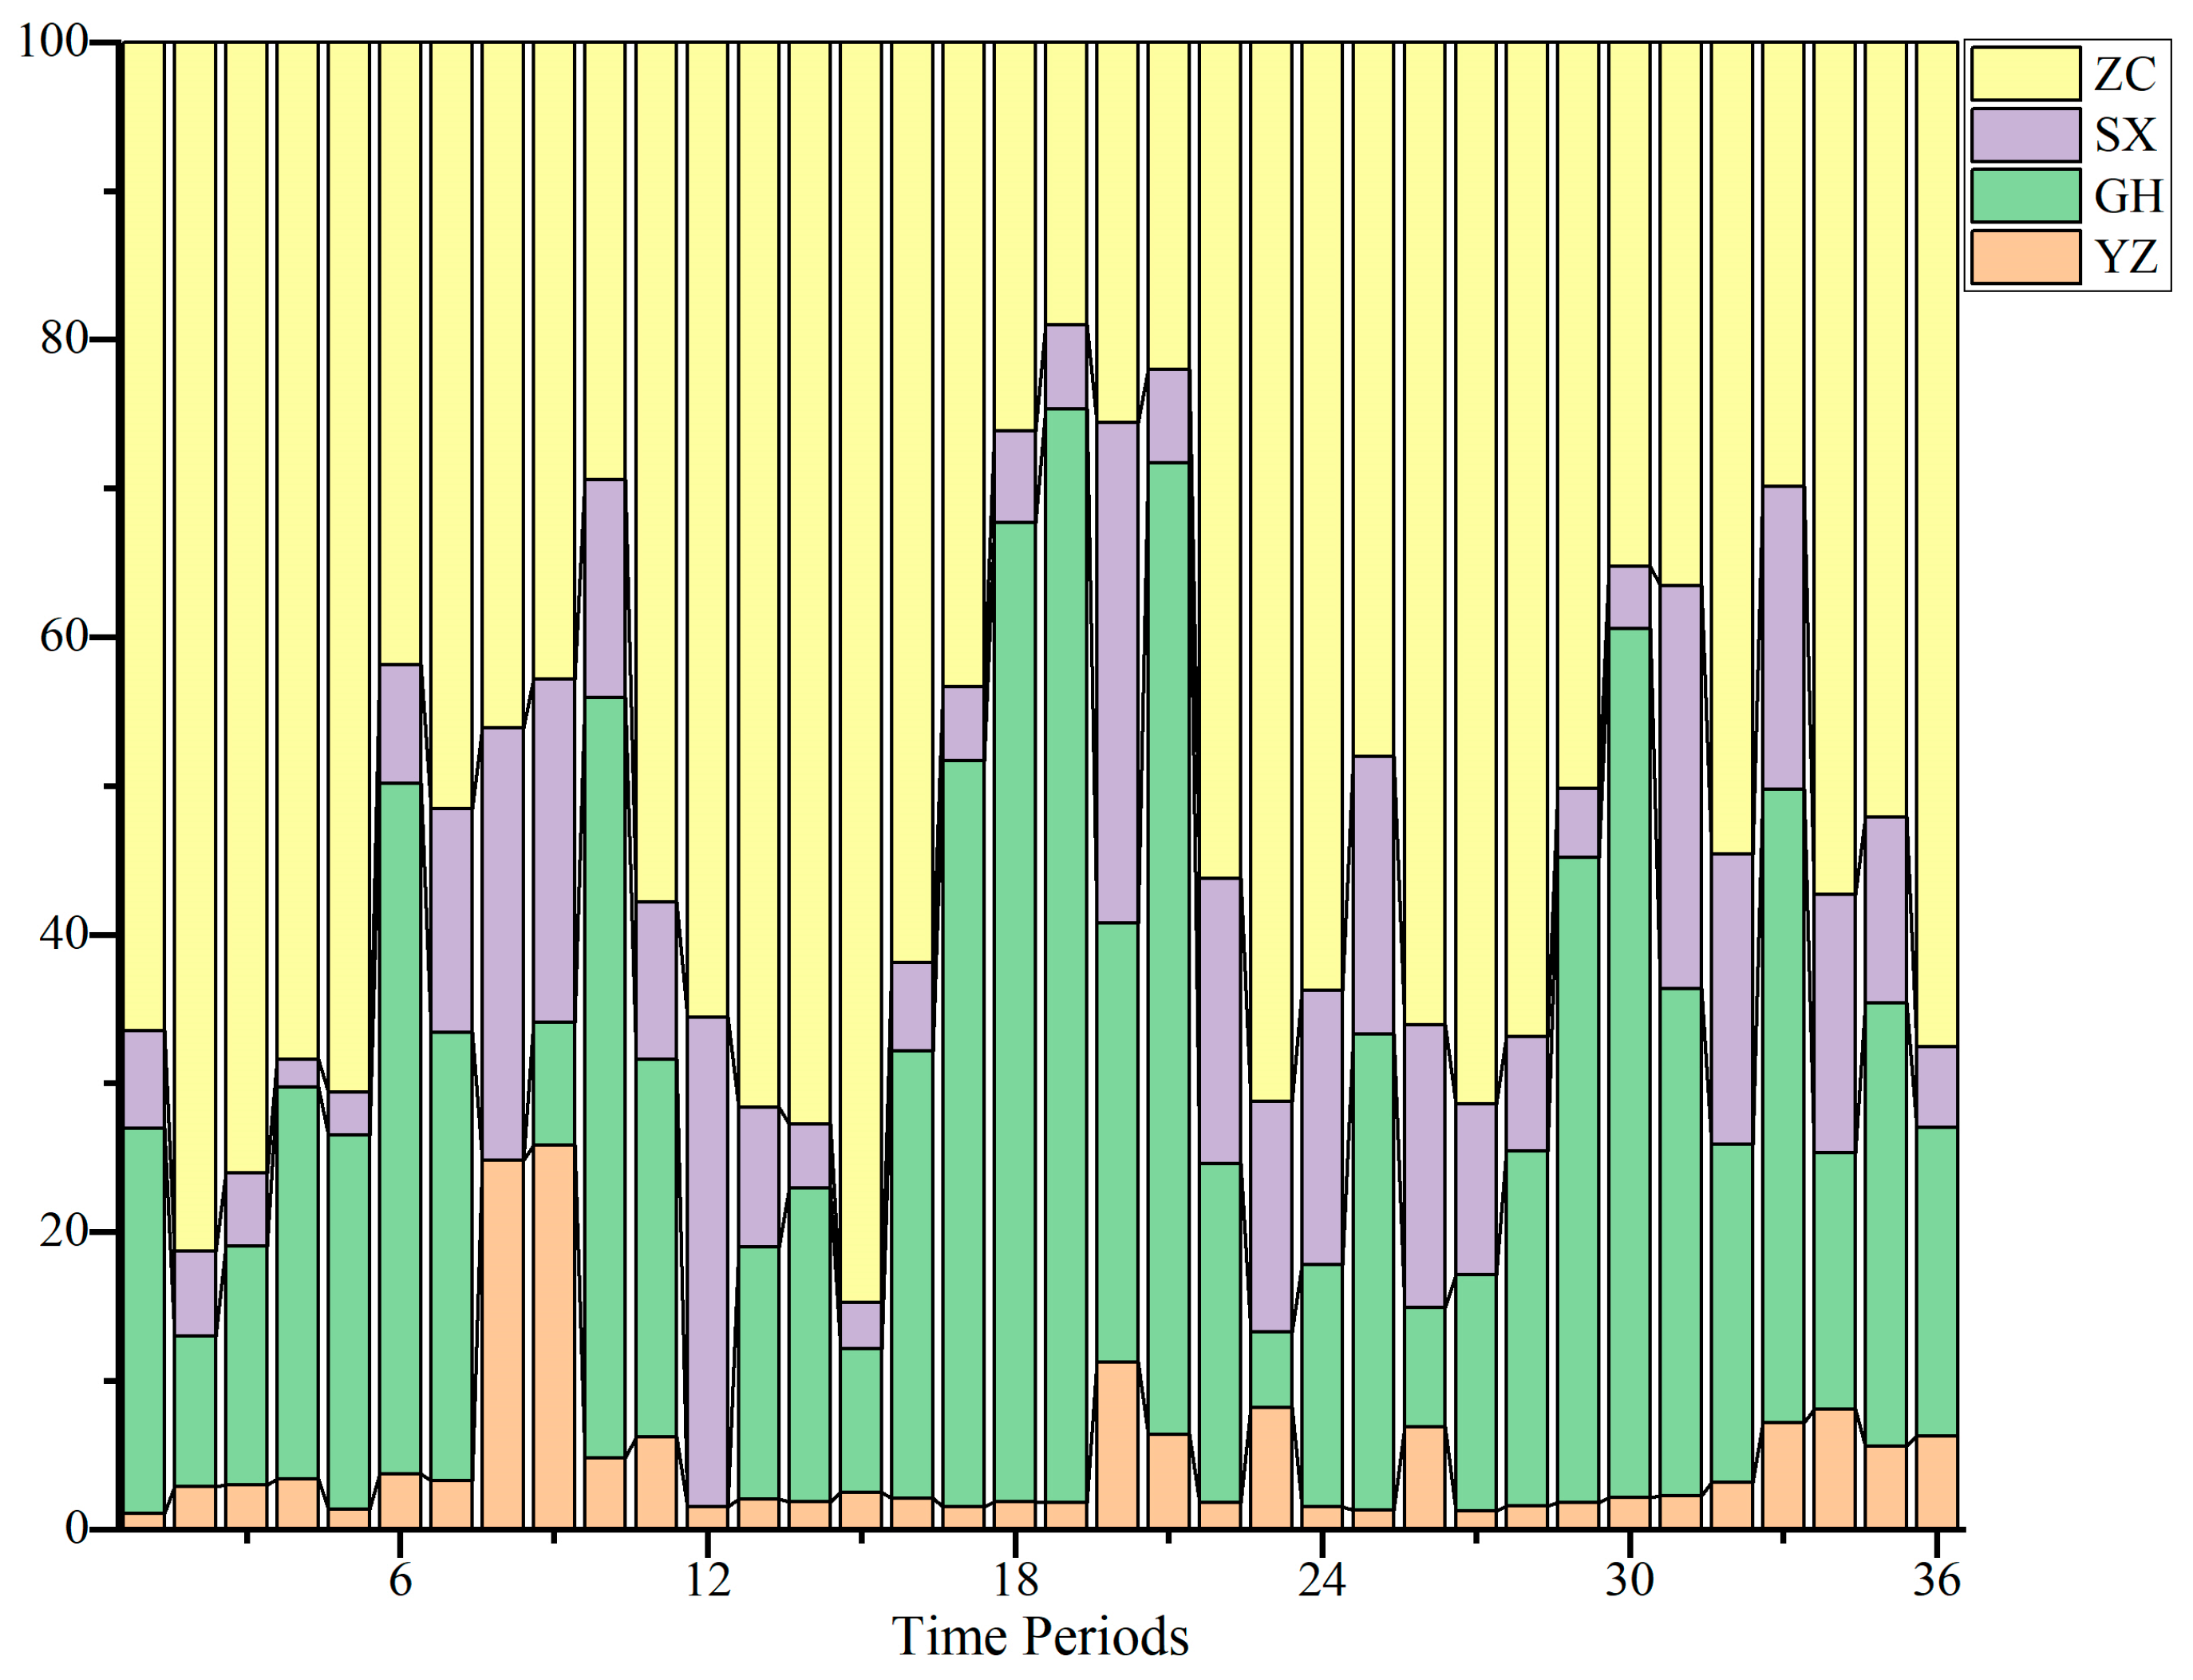
Figure 6 shows, the inflow to the two reservoirs that rely on gravity-fed water supply was relatively small, whereas the inflow to the two reservoirs supplied by pumping stations was significantly larger.
5.2. The Volume of Sediment Removal and the Curve of Reservoir Capacity Post-Dredging
When the sedimentation in a reservoir becomes so severe that investment in dredging is deemed necessary, it is common to not fully restore the original storage capacity. Particularly, sedimentation below the dead storage level is often not considered for removal, not only due to the high costs associated with deep-water dredging but also because the legal status of the dead storage level renders the loss of dead storage capacity acceptable. Dredging operations in reservoirs typically focus on increasing the beneficial storage capacity, with the dredging elevation generally exceeding that of the intake structures. Additionally, a significant portion involves dry excavation of areas exposed in the middle to latter sections of the reservoir. The minimum operational water level during the dredging period determines the proportion of deep-water dredging to dry land excavation.
Among the three reservoirs studied in this paper, YZ is a lake-type reservoir with a large water surface area and relatively shallow depth, GH is a river-type reservoir with a small water surface area but greater depth, and SX is intermediate between the two. The design of the dredging scheme must ensure that the dredged material falls within the ultimate effective storage capacity and minimize the areas of ineffective dredging to reduce the amount of backfill [
37].
Because the three reservoirs in this study were built many years ago, the original riverbed elevation data are missing, making it difficult to determine an accurate longitudinal river profile. Additionally, dredging entails significant investment, and during the design phase, it is crucial to consider cost issues comprehensively, not merely aiming for the highest dredging volume.
Table 1 presents the design schemes and internal reports on sediment accumulation and dredging volumes of completed and planned reservoir dredging projects collected in this study. Considering that there is competition between dredging volumes and costs in any reservoir, and this competition intensity is generally consistent across different regions and times, the schemes have already balanced dredging volumes and costs during design. Through statistical analysis of the proportion of dredging volumes to total sediment accumulation in these cases, the dredging volumes for the three reservoirs in this study were determined.
This study ultimately determined the dredging volume to be 25% of the total sediment accumulation, focusing on clearing the beneficial storage capacity to expand the reservoir capacity within the normal operational water level range. The post-dredging new storage capacity curve was obtained by superimposing an exponential function (water level–storage recovery) curve on the existing storage capacity curve.
Figure 7 illustrates the water level–storage capacity curves before and after dredging. It should be emphasized that under the joint operation of reservoir groups, the dredging volume of each reservoir is a value that can be optimized, although the dredging volume is set to a uniform ratio in this study, which does not hinder the exploration of the change law of each index.
5.3. Optimization Results
Figure 8a,b, respectively, illustrate the optimization results of the first step and the optimization results of the second step in the first phase with the order GH-SX-YZ.
Figure 9 shows the correlation relationships between each pair of objectives. The remaining flow after dredging in each reservoir has slightly increased. Under the conditions of the extremely dry year group, the remaining flow of YZ, SX, and GH reservoirs can be increased by 7.58%, 0.85%, and 5.4%, respectively, after dredging compared with before dredging; the competitive relationships between total water transfer volume, water transfer revenues, and power cost are quite evident.
The optimal solution is selected from the Pareto set obtained by the second-step optimization. Initially, the subjective weighting is conducted using the Fuzzy Analytic Hierarchy Process, where multiple experts are invited to score the importance levels of three objectives. Each scoring session provides the upper and lower bounds of relative importance as well as the median, forming a judgment matrix.
The subjective weights obtained through the Fuzzy Analytic Hierarchy Process are as follows:
Based on the weights assigned by multiple experts, the water supply volume is deemed the most significant, followed by the income, with the costs considered the least important. The weights of income and costs are relatively close. This indicates that people pay more attention to the total amount of water supplied during the dispatch period, which means that the receiving area is in a state of severe water shortage, and the benefits and costs of the water supply company will not be of concern for the time being.
Taking ±0.2% as the expansion range of the upper and lower bounds of the index fuzziness, the objective weight calculated based on the distancing degree of the interval number is (taking the order GH-SX-YZ as an example) as follows:
The comprehensive weight obtained by integrating subjective and objective weights based on game theory is as follows:
The solution set obtained based on the calculation of the separation degree of interval exhibits a relatively uniform distribution under the three objectives, with weights approaching each other. The result, after integrating both subjective and objective weights, remains predominantly influenced by subjective weights.
Based on the comprehensive weights obtained, the TOPSIS method is employed to score and rank the solution set [
38], thereby identifying the optimal solution under each sequence.
As shown in
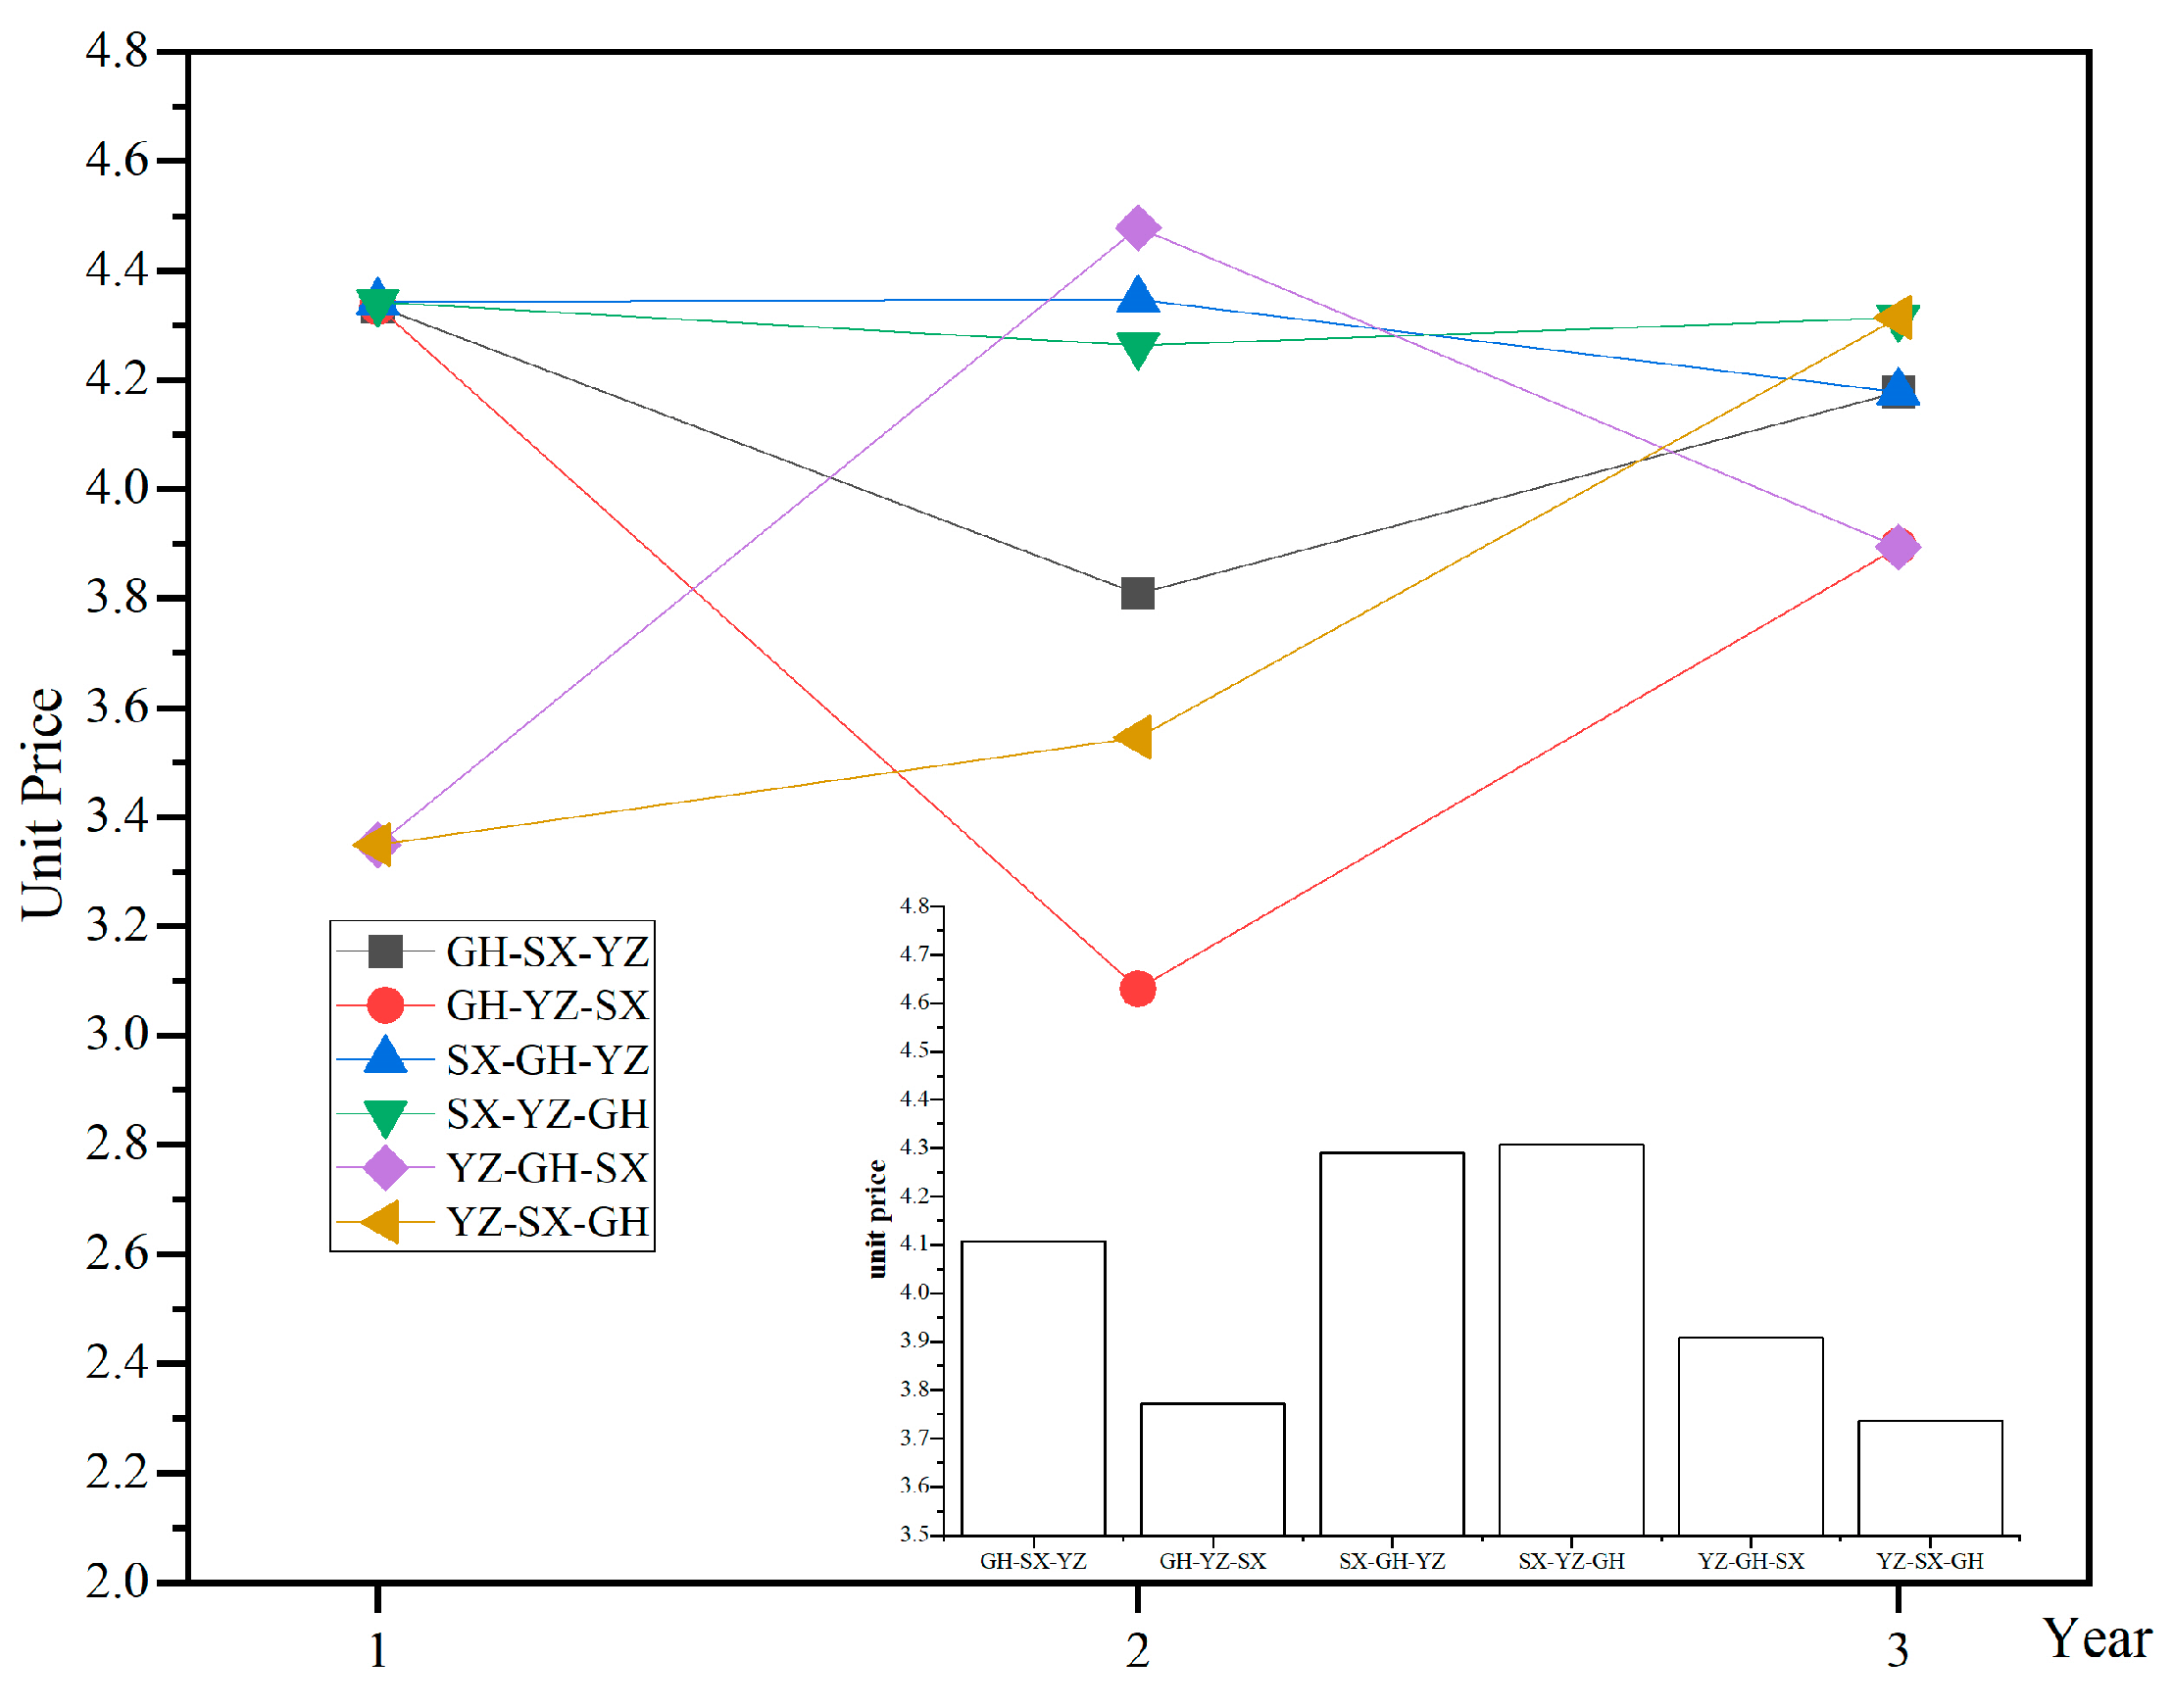
Figure 10, the disparities in water prices are primarily evident during the period when the first two reservoirs are being emptied for dredging. Subsequently, the differences in water prices gradually diminish, indicating a decreasing variance in water scarcity rates in the receiving area. This trend suggests that water transfers stabilize as the reservoir dredging is completed. Regarding the trend of water price changes, societal development tends to gradually reduce water prices, while water users prefer lower average water prices. The difference between the water price and the end of the water price is calculated, and the more the water price is reduced, the more favorable the water price change trend is. Therefore, the ranking of various schemes based on the advantages and disadvantages of water price trends and average water prices is presented in
Table 2.
Figure 11b illustrates the transfer flow under various sequences. The trend of transfer flow is similar to that of the water demand process.
Figure 11a shows the water supply satisfaction under different sequences. During the dredging period of the YZ reservoir, the water supply satisfaction maintained a high level across all orders. In contrast, the GH reservoir experienced lower levels during its dredging period. This clearly demonstrates the decisive role of large reservoirs and abundant water rivers in determining water supply satisfaction.
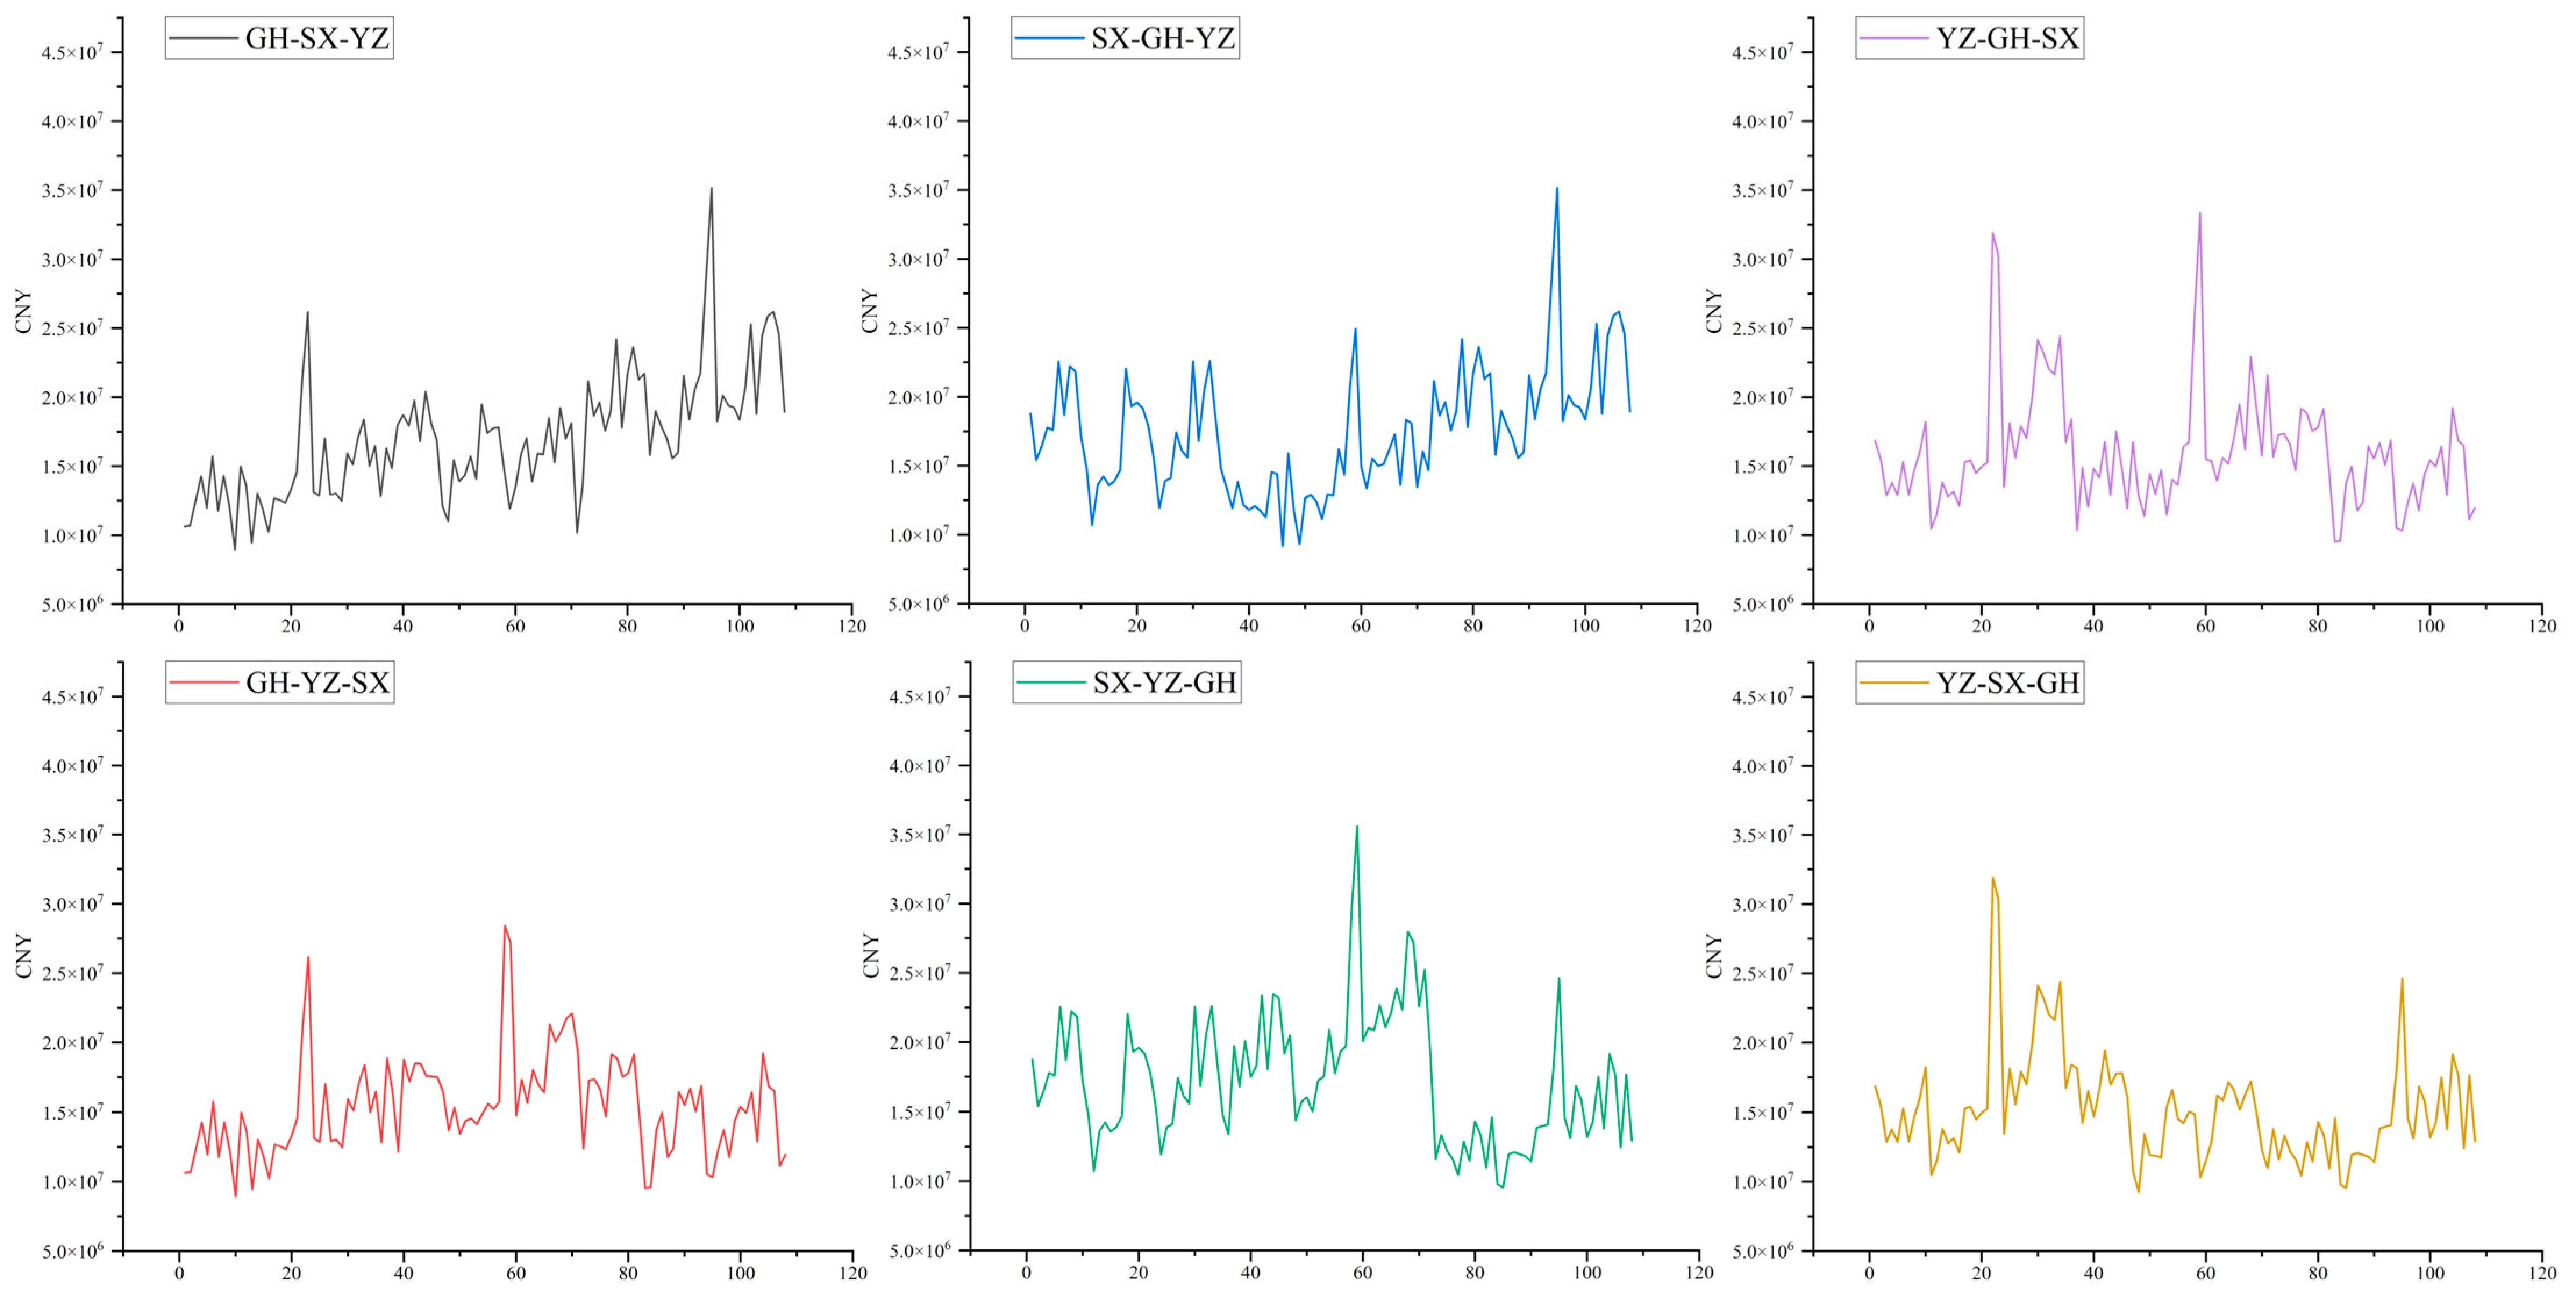
Figure 11c illustrates the cumulative transfer flow diagrams under six sequences. (1) The two schemes that were the first to empty the GH reservoir grew the slowest in the first phase. After the first phase, the GH-YZ-SX gradually surpasses other schemes to become the one with the greatest water supply volume, attributable to the large reservoir capacity and abundant inflow of GH. (2) The GH-SX-YZ scheme, after the first phase, does not experience the rapid growth seen in the GH-YZ-SX scheme; instead, its growth accelerates starting from the third phase due to the natural inflow at the SX reservoir section being greater than that at the YZ reservoir. (3) The SX-YZ-GH scheme, after the first phase, accelerates its growth more rapidly than the SX-GH-YZ scheme because it first empties YZ and, with a larger GH reservoir capacity, has a stronger capability for transfer flow. (4) The two schemes led by YZ emptying have a larger water transfer volume in the first phase, with stable growth rates in the second and third phases. This indicates that the overall increase in water supply caused by emptying SX first and emptying GH first is close. This is because the water from the GH reservoir is limited by the maximum flow rate of the pumping station, while the water from the SX reservoir is transported through a tunnel with a high upper limit, resulting in a similar actual water supply capacity between the two reservoirs. From the curve perspective, the total water supply of YZ-SX-GH is superior to that of YZ-GH-SX. The ranking based on the total water supply is shown in
Table 2.
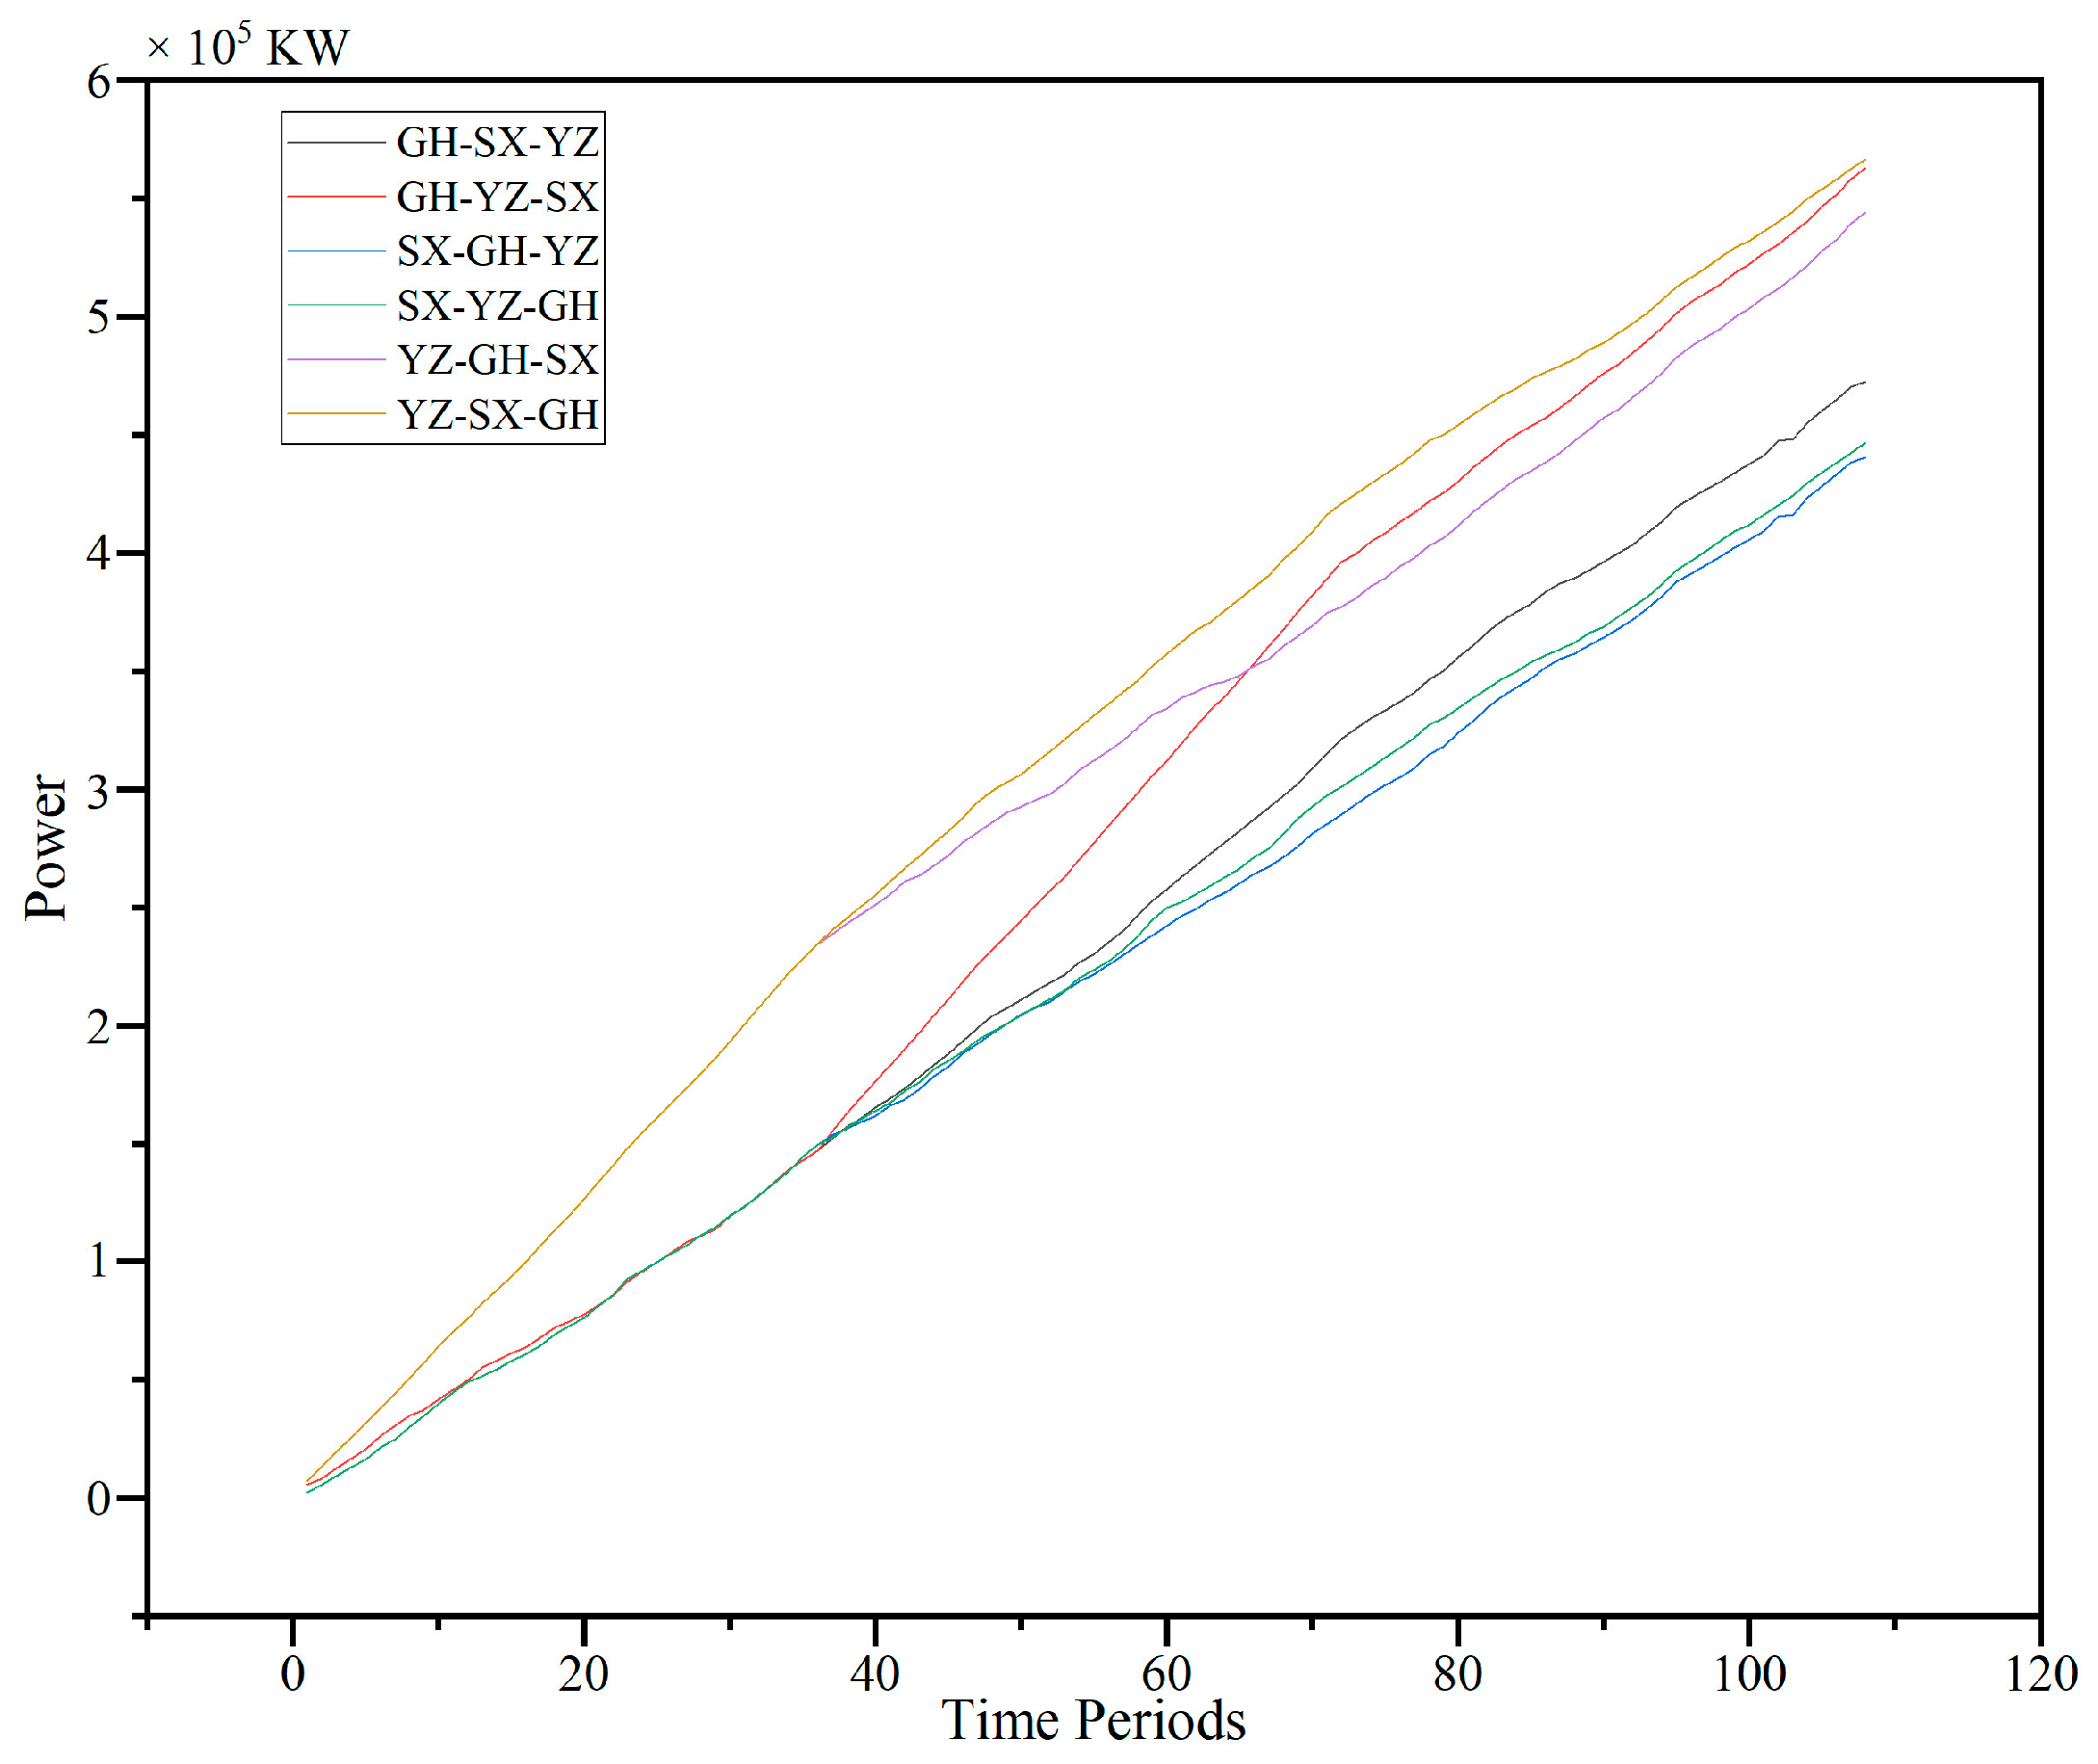
Figure 12 illustrates the cumulative power values of pump stations with different sequences. From the second stage to the conclusion, the ranking of cumulative power values among the various scenarios remains largely unchanged. The scheme with the lowest total power is SX-GH-YZ, while the scheme with the highest total power is YZ-SX-GH.
Empirically, the earlier the dredging of the gravity-fed water reservoir is completed, the lower the proportion of using pumping stations should be, and the total cumulative power would be lower compared to dredging the pumping station reservoir first. However, the calculation results show the opposite conclusion. This is because the objective function is not a fixed value that needs to be met, nor does this paper specify the total amount or process of water transfer; rather, it uses the water transfer volume and the variance of the water shortage rate as the evaluation criterion. In actual operation, the specified water transfer flow may lead to water abandonment, which should be avoided as much as possible in optimization scheduling. This also underscores the significance of quantitative analysis. The ranking according to the total power of each scheme is shown in
Table 2.
Figure 13 illustrates the profit curves estimated with varying water prices and fixed electricity costs. It can be observed that the periods with higher profits across all sequences coincide with the periods when the YZ reservoir is emptied for dredging. This is due to the relatively small natural inflow of water to the YZ reservoir, which increases the overall instability of the water supply when it participates in the supply. Given the significant instability factors associated with transfers and compensations during the initial dredging phase, it is preferable for the water supply profit to exhibit a declining trend. If the reservoir is desilted in order of runoff from small to large, the overall water supply profit will show a downward trend. The ranking obtained based on the trend of water supply profits is presented in
Table 2.
Figure 14 illustrates the proportion of gravitational and pumping stations across various schemes. During the dredging periods of GH across various schemes, the proportion of water transfer by pumping stations has significantly decreased. The optimal sequence for emptying should aim to reduce the usage proportion of pumping stations in the early stages, indicating that the GH-SX-YZ sequence is the most favorable. In comparing the GH-SX-YZ and GH-YZ-SX schemes, it is evident that emptying in the order of reservoir inflow from largest to smallest facilitates a more pronounced trend of increasing the proportion of pump station usage.
Table 2 shows the metrics further extracted from the results of multi-objective optimization and ranks them based on the advantages and disadvantages of each scheme under these indicators. It can be seen that GH-YZ-SX and SX-GH-YZ are two schemes with more obvious characteristics. GH-YZ-SX is beneficial for water users to save water costs, and SX-GH-YZ is beneficial for water transfer companies to obtain more profits and save water transfer costs.
6. Conclusions
The issue of reservoir dredging has long plagued the water conservancy industry. With the implementation of the national water network strategy, new solutions to reservoir dredging have emerged. To explore the optimal sequence for emptying and dredging multiple reservoirs in rotation, this study established a two-step optimization scheduling model. Using a typical dry year group as the input, the optimal operation schemes under individual reservoir scheduling were solved. On this basis, the optimal schemes for joint reservoir group scheduling under different emptying sequences were solved and selected. Through comparative analysis of the water supply effects under various sequences, the following main conclusions were drawn:
Under the conditions of 25% dredging and extremely dry years, the remaining flow of YZ, SX, and GH reservoirs increased by 7.58%, 0.85%, and 5.4%, respectively;
As the dredging process nears completion, the water supply’s stability gradually improves, reducing the variance of water scarcity rates. Consequently, the disparity in water prices diminishes accordingly;
The level of satisfaction with water supply and the variance of water shortage rates are determined by reservoirs with large runoff and substantial storage capacity, which decisively influence the profit value;
According to the descending order of the storage capacity of reservoirs, emptying and dredging the reservoirs can facilitate an increasing trend in the utilization ratio of pumping stations, thereby reducing the relative usage ratio of pumping stations in the initial phase;
Emptying and dredging the reservoir according to the order of the amount of water coming from the reservoir from small to large is more conducive to reducing the profit;
The optimization results, which aim to minimize the variance of water scarcity rates, contradict empirical judgments, underscoring the critical importance of quantitative analysis in the optimal scheduling of reservoir groups;
Reservoir managers and water transfer managers pay more attention to the total amount of water transferred, and the profits and costs of water transfer companies are not a concern for the time being.
This research offers a new idea for the dredging projects of reservoir groups, serving as a reference for reservoir dispatchers and dredging service industry professionals; however, there are areas for improvement in the present study, including the following: (1) The selection of a typical dry year group for the basin at a 95% guarantee rate was based on the method of minimizing the sum of squared deviations. However, inflow to some reservoirs in this group exceeds their own frequency discharge results. Therefore, it is necessary to continuously monitor new inflow data to select a more representative typical year group that aligns with the design guarantee rate. (2) Given the many feasible solutions, the optimal solution obtained through the weighting method is somewhat contingent, leading to contradictory conclusions when general patterns are analyzed. Future research should enhance the study of indicators for the optimization of scheduling schemes involving rounds of emptying and sediment removal. To clearly understand the impact of sediment removal in each reservoir on various indicators, it is advisable to select mutually independent indicators for evaluation. (3) Rounds of emptying and dredging are projects involving social stability and economic development, and there are still many vague indicators in the evaluation of the program that have not been considered in this paper. If these indicators are weighted according to Chang’s method, some indicators with a weight of 0 may be generated. Subsequently, the method of reference to [
39] can be used to synthesize the relative importance calculation methods of Mikhailov [
40] and Wang and Chin [
41] and to use Mamdani’s FIS method to rank the alternatives [
42].
