Article

Mapping Flood Impacts on Mortality at European Territories of the Mediterranean Region within the Sustainable Development Goals (SDGs) Framework

by
Iraklis Stamos
1,* and
Michalis Diakakis
2
1
European Commission, Joint Research Centre (JRC), 41092 Seville, Spain
2
Faculty of Geology and Geoenvironment, National and Kapodistrian University of Athens, Panepistimioupoli, 15784 Athens, Greece
*
Author to whom correspondence should be addressed.
Water 2024, 16(17), 2470; https://doi.org/10.3390/w16172470
Submission received: 22 July 2024 / Revised: 27 August 2024 / Accepted: 28 August 2024 / Published: 30 August 2024
(This article belongs to the Special Issue Risks of Hydrometeorological Extremes)

Abstract

:
Despite significant advances in technology and flood risk management, as well as the countless risk prevention initiatives undertaken by governments and institutions in recent decades, flood hazards persist in threatening human life and health, especially under the effects of climate change. To assess the effectiveness of the various programs or measures devised to protect human life and health from floods, it is crucial to measure and understand its impacts on society, establishing the capability to track indicators or metrics that reflect the spatial distribution and temporal progress of floods and their impacts. In this context, this study uses disaster loss data derived from international disaster databases adapted in regional context following the Nomenclature of Territorial Units for Statistics level 2 (or NUTS2), to examine the spatial distribution and temporal evolution of deaths, directly attributable to flood disasters. In addition, we explore the potential of currently available datasets in understanding and monitoring flood-related mortality, an important standardized progress indicator of flood disaster impacts. This study is framed within the United Nations’ Sustainable Development Goals (SDGs), recently adopted by the European Union, and is focused on the Union’s territories in the Mediterranean region, an area particularly sensitive to climate change. Results show interesting spatial patterns, and generally inconclusive temporal trends, although locally we see evidence of both an increase and a decline in flood mortality. In addition, this work discusses the currently available datasets potential, weaknesses and limitations, as well as the importance of tracking flood impacts on human life in a future increasingly influenced by extreme weather events and climate change.

1. Introduction

Despite significant advances in forecasting and warning systems [1,2,3,4,5], in flood risk management initiatives, and the implementation of flood-protection measures and technologies [6], the occurrence of catastrophic floods resulting in substantial human casualties remains a major threat. This ongoing risk is evident globally [7] and throughout Europe [8], as underscored by recent devastating events [9,10].
The increased vulnerability across many parts of Europe, coupled with the threat of climate change, emphasizes the urgency of understanding better and monitoring the frequency and the distribution of such events. As extreme weather-related disasters are expected to become more frequent and severe [11,12,13], it becomes also crucial to enhance preparedness and resilience by understanding better their impact on communities and particularly on human life.
The emphasis on monitoring, collecting, and studying loss and damage data associated with climate-related disasters, including non-economic losses such as human casualties and others, aligns with international conventions like the United Nations Framework Convention on Climate Change (UNFCCC), the UNDRR Sendai Framework for Risk Reduction (2015–2030), and the Paris Agreement, but are also tightly related with United Nations’ Sustainable Development Goals [14,15,16].
All types of disaster loss data is essential for developing effective risk management policies and civil protection strategies [17] and therefore for a sustainable future, when it comes to protection from climate-related hazards.
The importance of monitoring disaster losses within the framework of the Sustainable Development Goals (SDGs) and Agenda 2030 is underscored by several factors. Firstly, effective monitoring facilitates the evaluation of progress towards disaster risk reduction as well as resilience-building targets outlined in SDG 11 (Sustainable Cities and Communities) and SDG 13 (Climate Action). Secondly, integrating disaster loss data into broader development frameworks highlights connections between disasters and other social and developmental challenges like poverty, urbanization, and environmental changes and facilitates monitoring these targets. Furthermore, it allows policymakers to assess whether efforts to enhance resilience are achieving desired outcomes. This holistic understanding is crucial for implementing sustainable development approaches as emphasized by the SDGs. The European Union (EU) has enhanced its efforts to monitor disaster impacts by gradually building a comprehensive disaster management framework to safeguard its citizens against a variety of natural disasters. This includes various monitoring systems, legislative frameworks like the EU Civil Protection Mechanism (UCPM) and the Floods Directive 2007/60, and initiatives embedded in the European Green Deal and European Climate Law, in an effort to integrate disaster risk reduction into broader climate policies and promote long-term resilience and sustainability across Europe.
Across Europe, in the past few decades, the absence of a standardized approach to recording flood fatalities both at the continental level and within individual countries has resulted in the absence of comprehensive up-to-date data on flood-related mortality. This deficiency stems from a variety of factors, including differing methodologies in disaster consequences and post-disaster data collection, and disparities in the objectives and in the resources allocated towards such record-keeping efforts [8].
In the last two decades, gradually more and more research sheds light on flood mortality in quantitative and qualitative terms [18,19]. In Europe several publications provided insights on the influence of different factors on mortality [20], including the demographics of the victims [21], the use of vehicles [22], the role of different environments [23], the activity of the victims [24], developing event-based [25], national-scale [26,27,28], or regional databases [8,29,30].
In addition to the input of recent research, a gradually larger group of international databases such as EM-DAT [31], DFO [32], HANZE [33] and others has been developed, containing the data on different aspects of the losses of flooding (and other disaster types). Recently, the Joint Research Centre has developed a platform for illustrating disaster losses [34], providing a very useful foundation for improving the understanding monitoring losses largely based on certain existing international databases.
However, there is still only limited work in examining the evolution of these fatalities in a continuous manner and there is no conclusive understanding of their spatiotemporal trends across the region. Especially in the Mediterranean region, previous research has not yet exploited new datasets that have been published recently [8,35,36] providing new opportunities in terms of completeness of data on flood-related fatalities for the area.
Recognizing this gap, the aim of this work is to explore the temporal and spatial distribution of flood-related mortality utilizing existing publicly available datasets in an effort to improve our understanding of flood impacts on human life in the Mediterranean, a region that has been shown to be particularly sensitive to climate change [37].
In pursuit of this goal, the study collects data from diverse disaster databases and other studies and present and examines them at the Nomenclature of Territorial Units for Statistics 2 (or NUTS2) level and contextualizes by population, providing a higher resolution image of mortality in the region following the statistical regions defined by the EU.

2. Data and Methods

2.1. Study Area

The Mediterranean is a region of immense geomorphological and ecological diversity, encapsulating countless different landscapes, including large urban environments, and densely populated coastal areas.
The region exhibits also a diverse array of climatic conditions [38,39], attributed to its extensive geographical expanse and varied topography. Hot, dry summers and mild, wet winters prevail in southernmost regions, while alpine climates dominate mountainous areas, with colder temperatures and significant precipitation, creating a variety of interplay between geomorphological features and atmospheric dynamics, crucial for comprehending regional climate patterns but also influencing the nature of flood hazards.
The region also hosts a multitude of critical infrastructure such as transportation networks, power plants, communication systems, and many others alongside a wide array of socio-economic activities ranging from agriculture to industrial production. The area is densely populated with significant urban areas as well as historic cities and places of culture. Τhis density and concentration of infrastructure and population also render it highly vulnerable to the devastating impacts of flooding events [40]. The coastal area, in particular, serves as a hub for tourism, trade, and transportation, and it is a central component of the blue economy, which is one of the most critical pillars of economic development for the region and is considered vulnerable as well to flooding and risks associated with climate change in general [41].
A large part of the Mediterranean region is prone to flash floods [29,42], which are drained by small (sometimes mountainous) torrents and have little or no water at all for most of the year. The region is characterized by scarcity and fragmentation of data when it comes to flood impacts.

2.2. Data

To create a comprehensive database, data on flood mortality were collected mainly from publicly available international disaster and fatality datasets, as well as newly developed databases for the Mediterranean region (Table 1). In addition to these datasets, we used country-specific reports and studies that were used as independent sources to ensure a high-degree of completeness and quality of the data. The flood events and their impacts derived from were cross-referenced with these country-specific reports, studies and country-level databases, as we as scientific publications to ensure accuracy in casualty numbers.
With respect to geographical coverage, this study included Croatia (HR), Cyprus (CY), France (FR), Greece (EL), Italy (IT), Malta (MT), Portugal (PT), Slovenia (SI), and Spain (ES). In the case of France we included only its southern part, namely the regions: Aquitaine (FRI1), Limousin (FRI2), Auvergne (FRK1), Rhône-Alpes (FRK2), Languedoc-Roussillon (FRJ1), Midi-Pyrénées (FRJ2), Provence-Alpes-Côte d’Azur (FRL0), and Corsica (FRM0) (Figure 1).

2.3. Analysis

Based on all the collected data a new comprehensive database was developed containing all the events and the fatalities caused. The data collected from the above sources were adapted in regional context by assigning the NUTS2 region in which they occurred based on the location information contained in the sources above. When multiple NUTS2 regions were hit by a flood event, then we assigned all these territories, but also assigned the respective fatalities to each one of them. In this way, we were able to explore comparisons with population for each region and facilitate future exploration of associations and relationships with various factors (given diverse statistical data are available at the NUTS2 regions). For each flood event, the sources were individually compared as a primary method of data quality control to ensure maximum completeness. Additionally, each event was meticulously examined and underwent thorough evaluation regarding its overlap with other hazards, to distinguish between casualties caused by floods and those resulting from associated concurrent phenomena such as landslides and debris flows.
After the development of the database and taking care to allocate the fatalities in the respective different NUTS2 areas based on location information contained in the databases or in other publications (see Table 1), we projected the fatality totals on maps for two study periods, namely 1900–2023 and 1980–2023. This was done to explore their spatial distribution and to identify potential spatial patterns across the region.
Apart from the spatial dimension, we assessed the temporal evolution of the aforementioned human losses for each NUTS2 element. In detail, to explore their temporal trends, we estimated the positive/negative trends for each NUTS2 region, using the slope value of a best fit line, for the period 1980–2023. The best fit line was derived by applying a least squares algorithm on the annual number fatalities. The outcome of the algorithm was for each region an equation of the following form:
y = a x + b
where “a” represents the coefficient of the independent variable, illustrating the slope value of the best fit line and “b” represents the y-intercept, which is the value of y when x is zero.
In this analysis, we chose the period from 1980 to 2023 due to the extensive coverage provided by numerous independent and overlapping sources, which ensures the completeness of the record and enhances the comprehensiveness and accuracy of the data. In addition to this, we applied a Poisson regression test, previously used for analyzing count data [36,53,54] to examine the statistical significance of any temporal trends identified in each of the NUTS2 regions.
To present the aggregate data we used (i) flood fatality totals (ii) flood fatality totals per 100,000 of population and (iii) the slope value for each NUTS2 region in the study area. In terms of population we used the 1991, 2001, 2011 and 2021 censuses derived from Eurostat as well as from the Italian National Institute of Statistics (ISTAT), the Spanish National Statistics Institute (INE), the Statistical Service of Cyprus (CYSTAT), the Croatian Bureau of Statistics (DZS), the Statistical office of the Republic of Slovenia (SORS), the National Statistics Institute of Portugal (INE), The National Institute of Statistics and Economic Studies of France (INSEE) and the Hellenic Statistical Authority (ELSTAT).
As a final step, we evaluated and discussed the results, identifying patterns and evaluating the feasibility of monitoring schemes with the currently available datasets.

3. Results

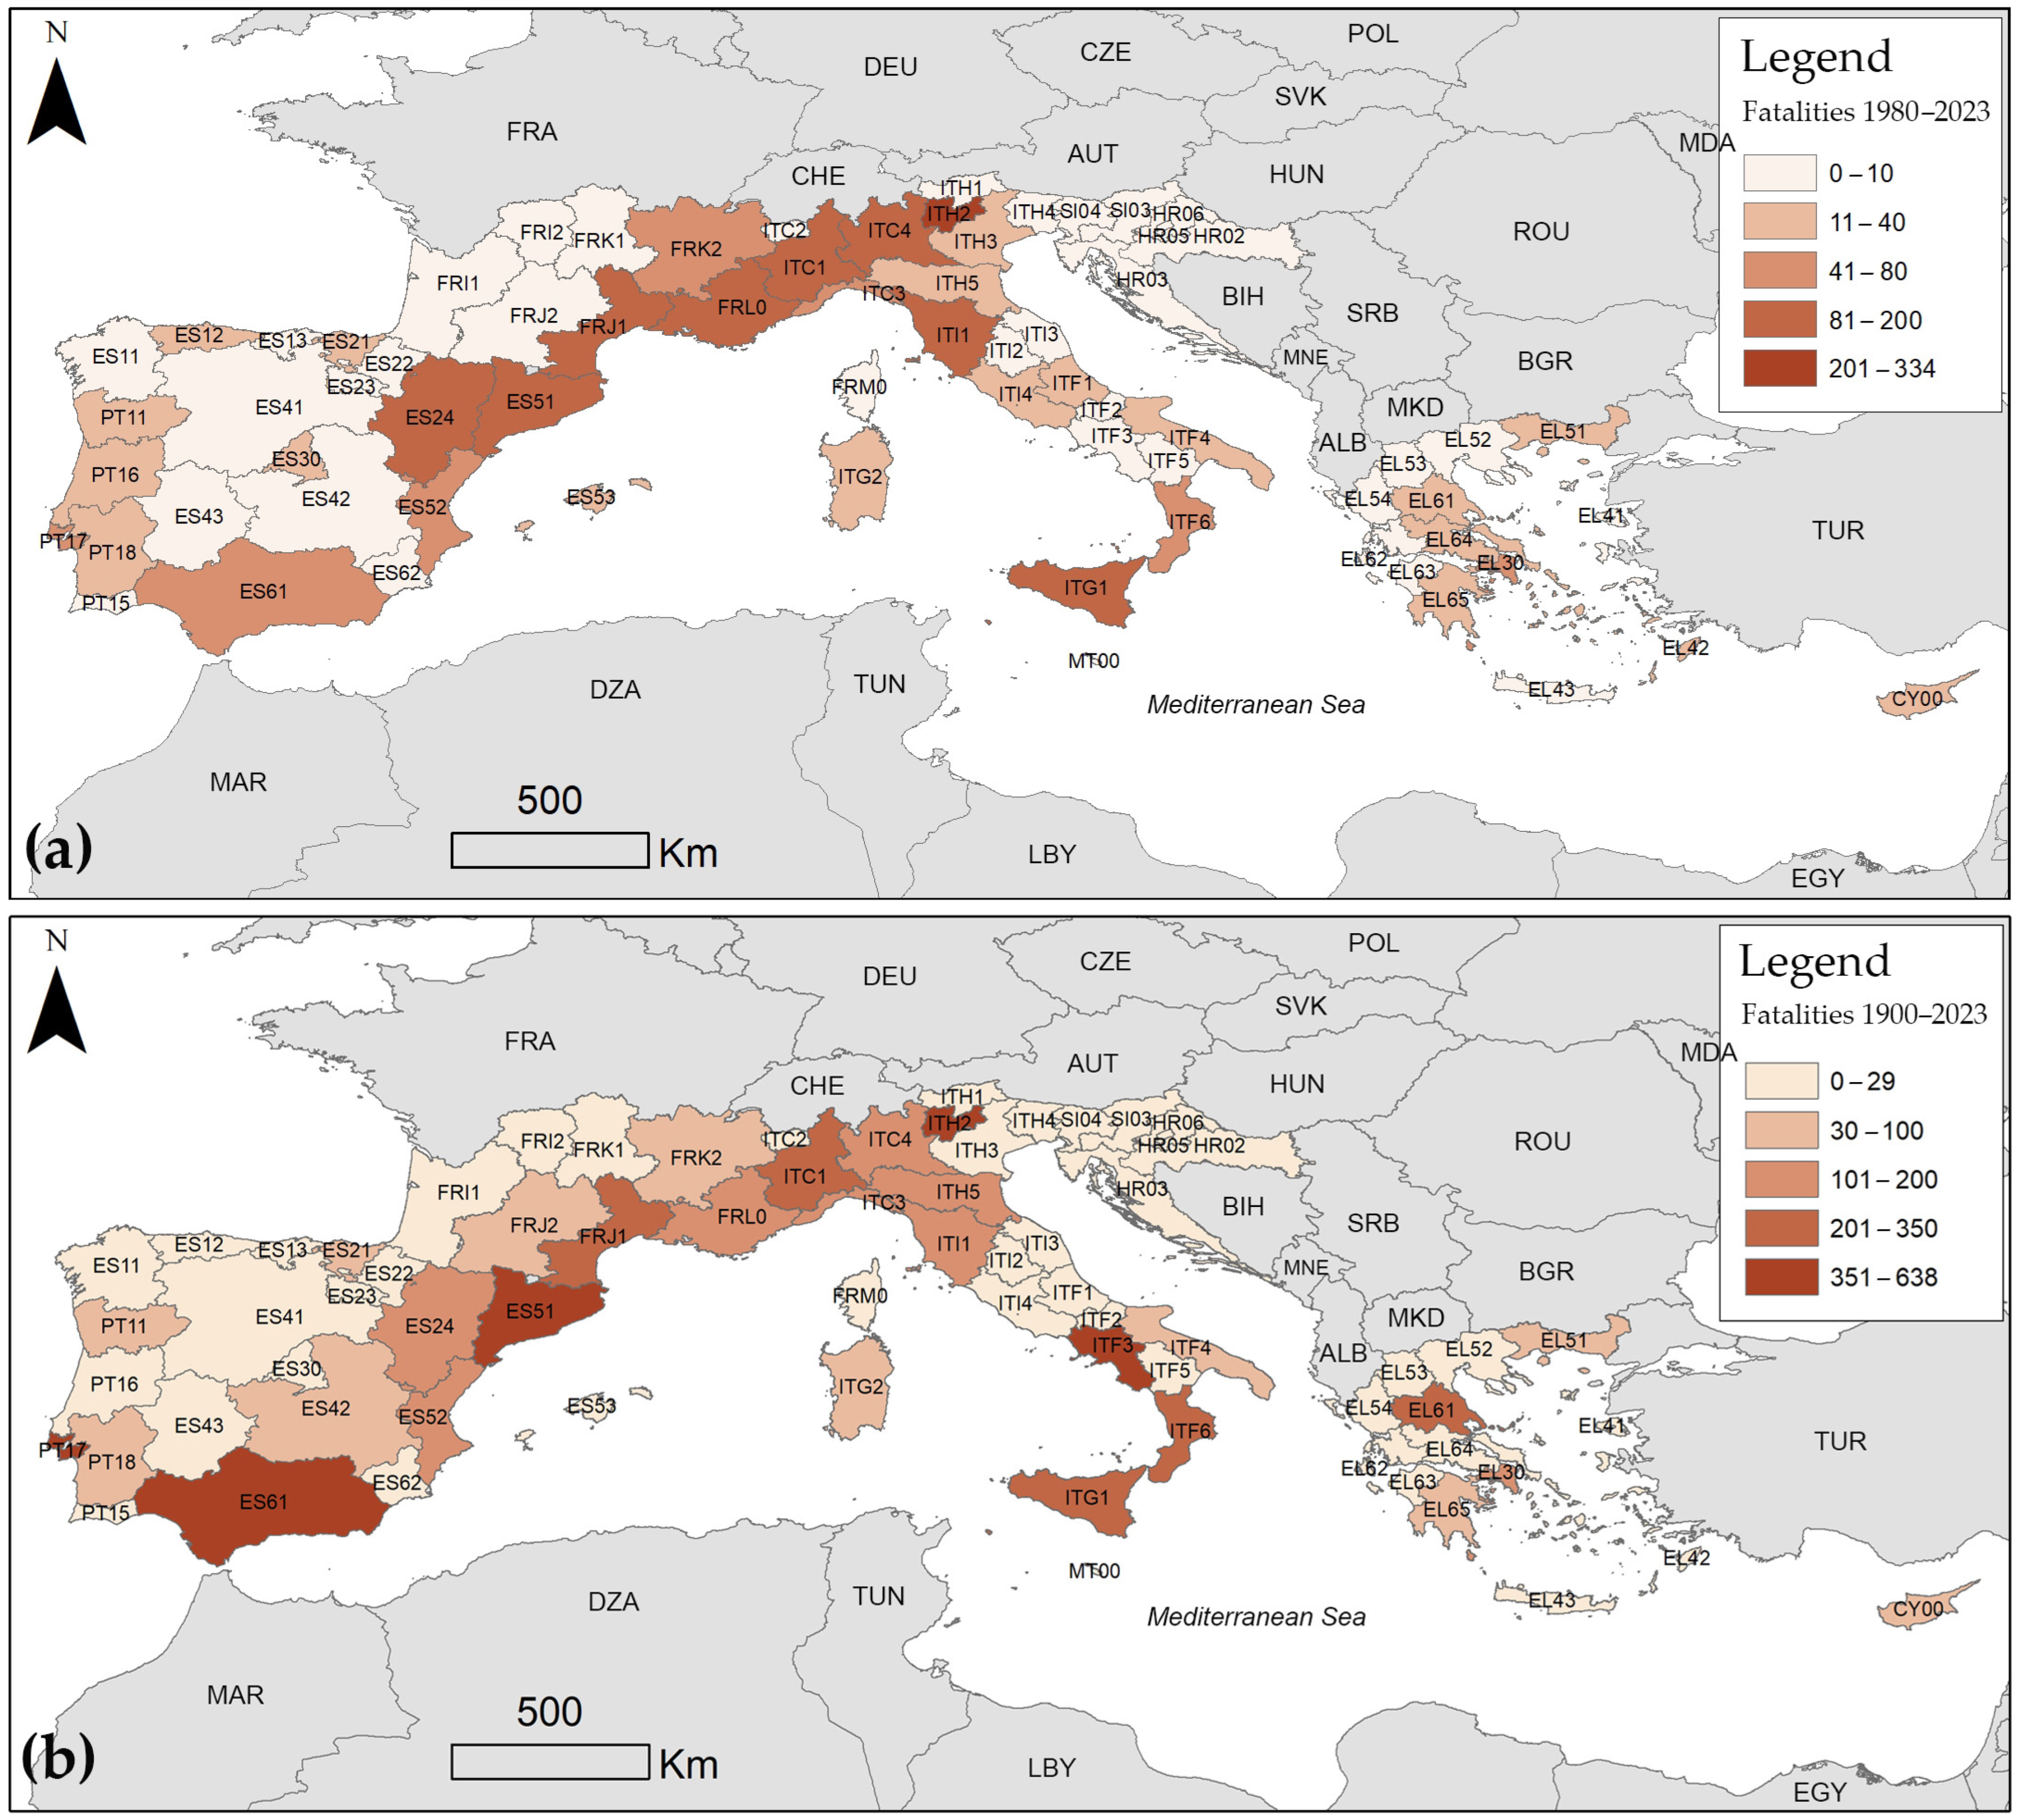
We identified a total of 6276 fatalities in the period 1900–2023 and a total of 2331 fatalities in the period 1980–2023, across the study area, showing a diversity of values as expected in different regions, ranging from very low to very high.
By dividing the study area in 73 NUTS2 regional territories, one can see that between 1980 and 2023 (Figure 2a), the highest number of fatalities was observed in the region encompassing northeast Spain (Catalonia, Aragon, and Valencia), southern France (Languedoc-Roussillon, Provence-Alpes-Côte d’Azur), and northern Italy (Piedmont, Liguria, Lombardy, Trentino, and Tuscany), along the Mediterranean coastline of the Balearic Sea, the Gulf of Lions and the Ligurian Sea, forming a zone characterized by elevated mortality rates in this period. Lower values appear in central parts of Spain and France, central parts of Italy, Slovenia and Croatia, as well as the northern and northwestern parts of Greece.
By studying the total number of flood-related fatalities between 1900–2023 amongst the same NUTS2 territories (Figure 2b), one can see approximately the same pattern, with the axis developed between northeastern Spain, southern France and northern Italy again forming a high-mortality zone. Exception to this similarity are the higher numbers in Lisbon (Portugal), in southern Spain (Andalucia), central Greece (Thessaly) and in southern Italy (Campania, Calabria and Sicily). Overall, especially in the western part of the study area the regions on the Mediterranean coast appear to present higher numbers of total fatalities (see for example France and the Iberian Peninsula).
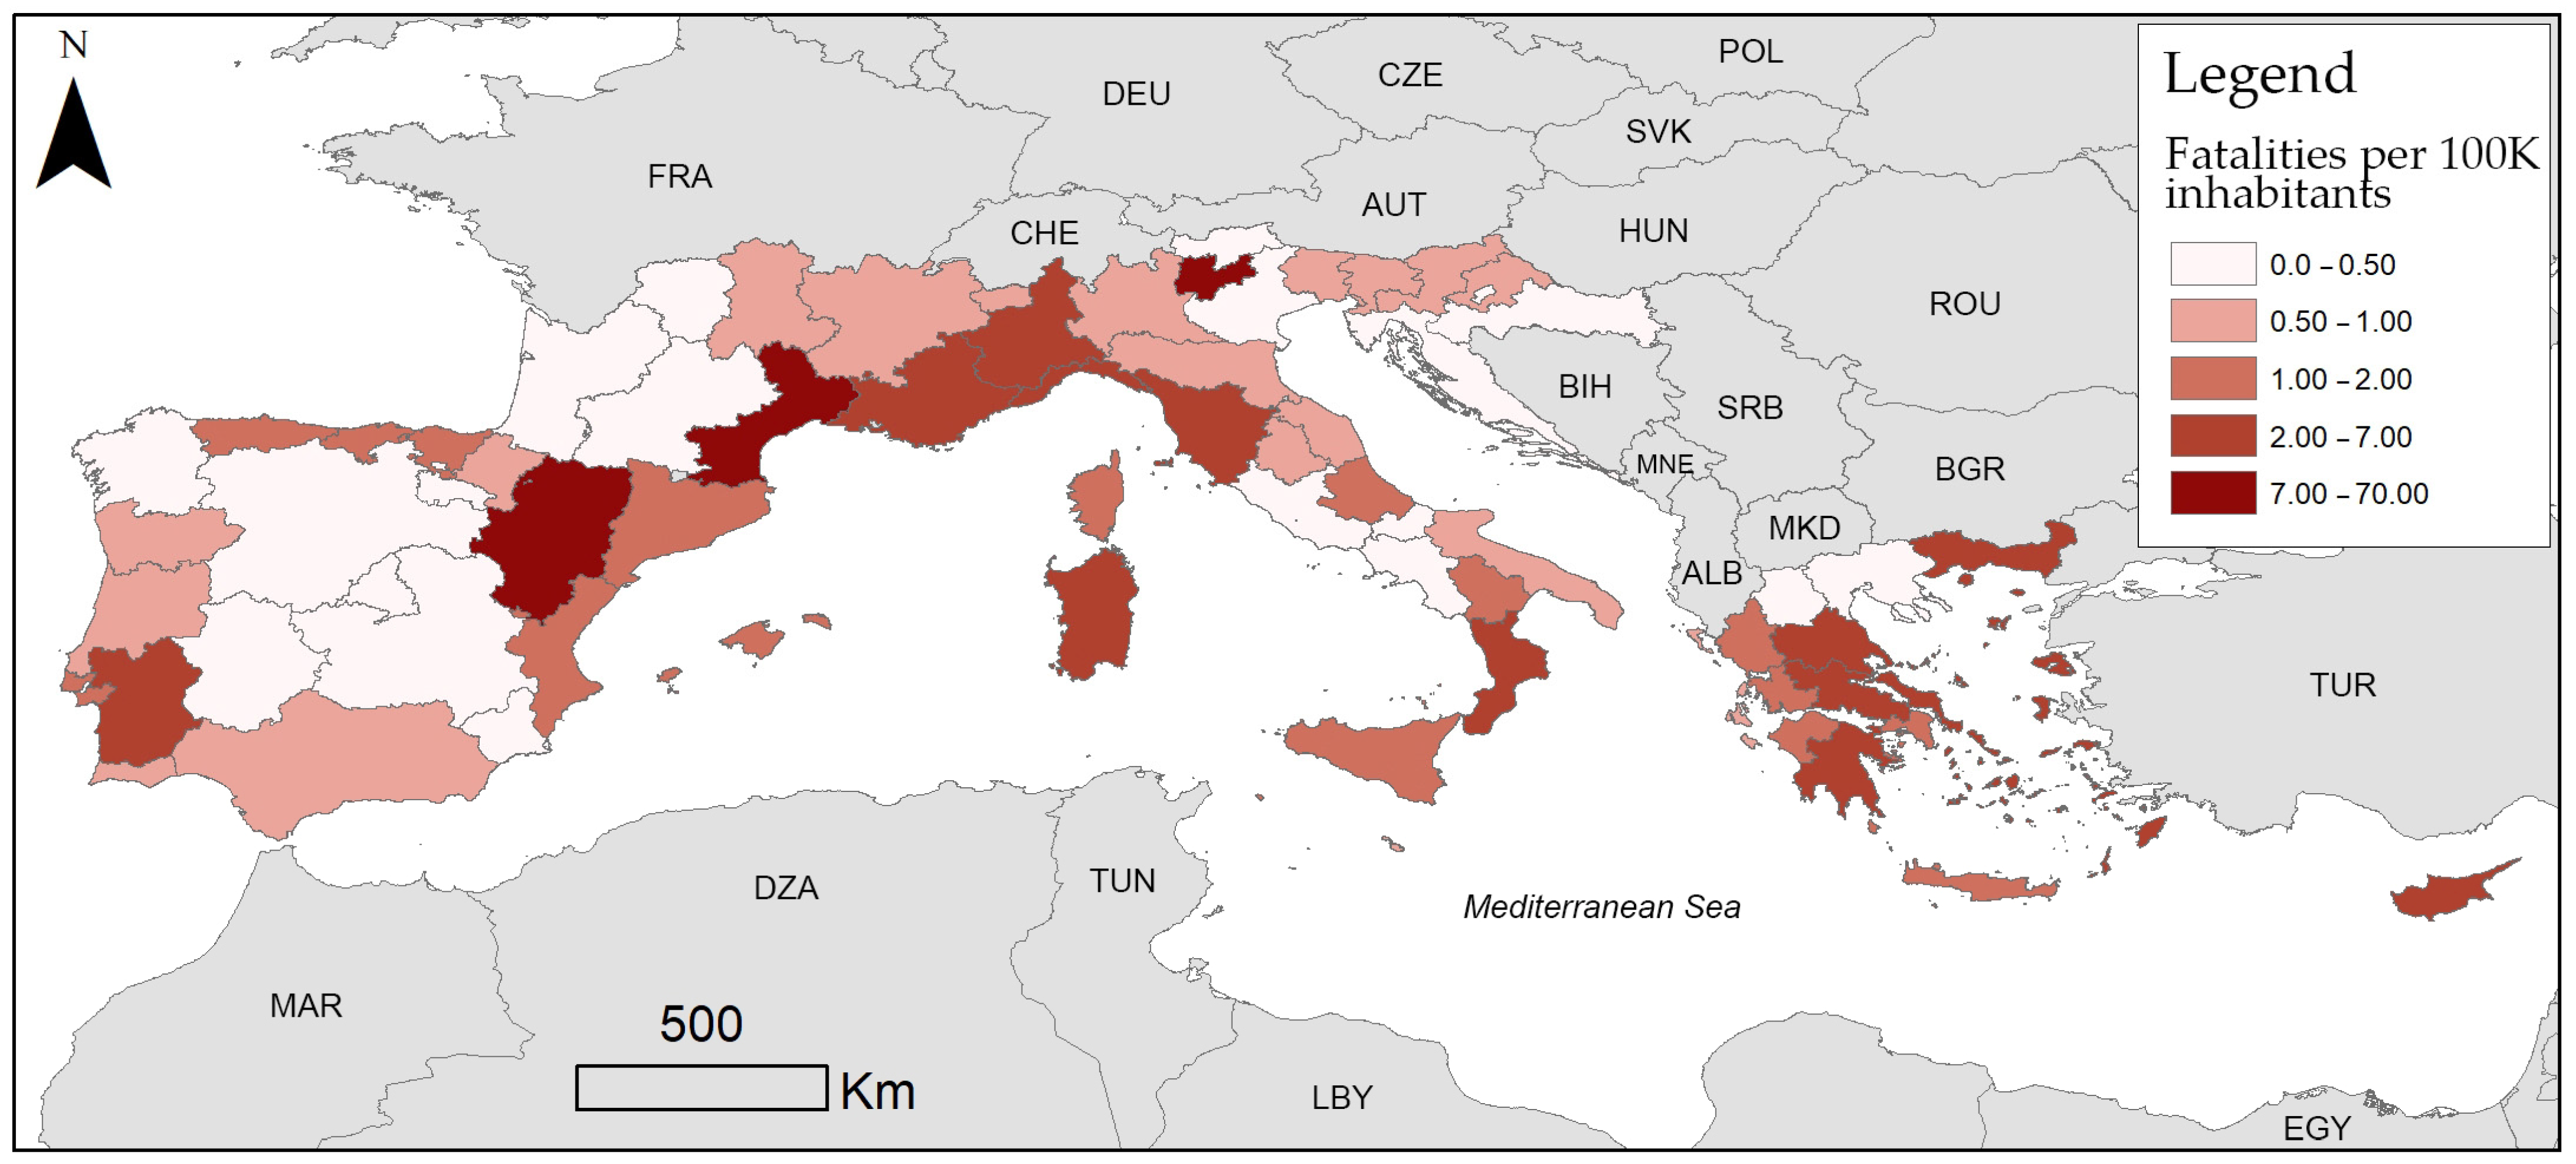
When the total fatality values are divided by the population of each NUTS2 region (Figure 3), the same high-mortality area (northeastern Spain—south France—north Italy) stands out as in fatality totals with highest values appearing in Aragon (Spain), Languedoc-Roussillon (south France) and Trento (North Italy). However, other parts of the study area appear to have high values as well differentiating the above spatial pattern. This includes islandic territories, namely: Sicily and Sardegna (Italy), North Aegean, South Aegean and Crete (Greece), the Balearic Islands (Spain), Corsica (France) and Cyprus indicating that in despite their small population they retain a relatively high number of fatalities. The high values appear also in some continental regions (i.e. Catalonia, Calabria, Provence-Alpes-Côte d’Azur, Piedmont, Liguria and Tuscany, Alentejo and eastern parts of continental Greece that is Attica, Central Greece, Thessaly, Peloponnese and Eastern Macedonia). Lower values of are recorded in the central parts of Spain, the parts of France not on the Mediterranean coast, central and northeastern parts of Italy, Slovenia, and Croatia.
The number of fatalities in each NUTS2 region (1980–2023) with their respective population (census 2021) were found to have a marginally statistically significant relationship (Pearson coefficient = 0.322, p = 0.005, N = 73).
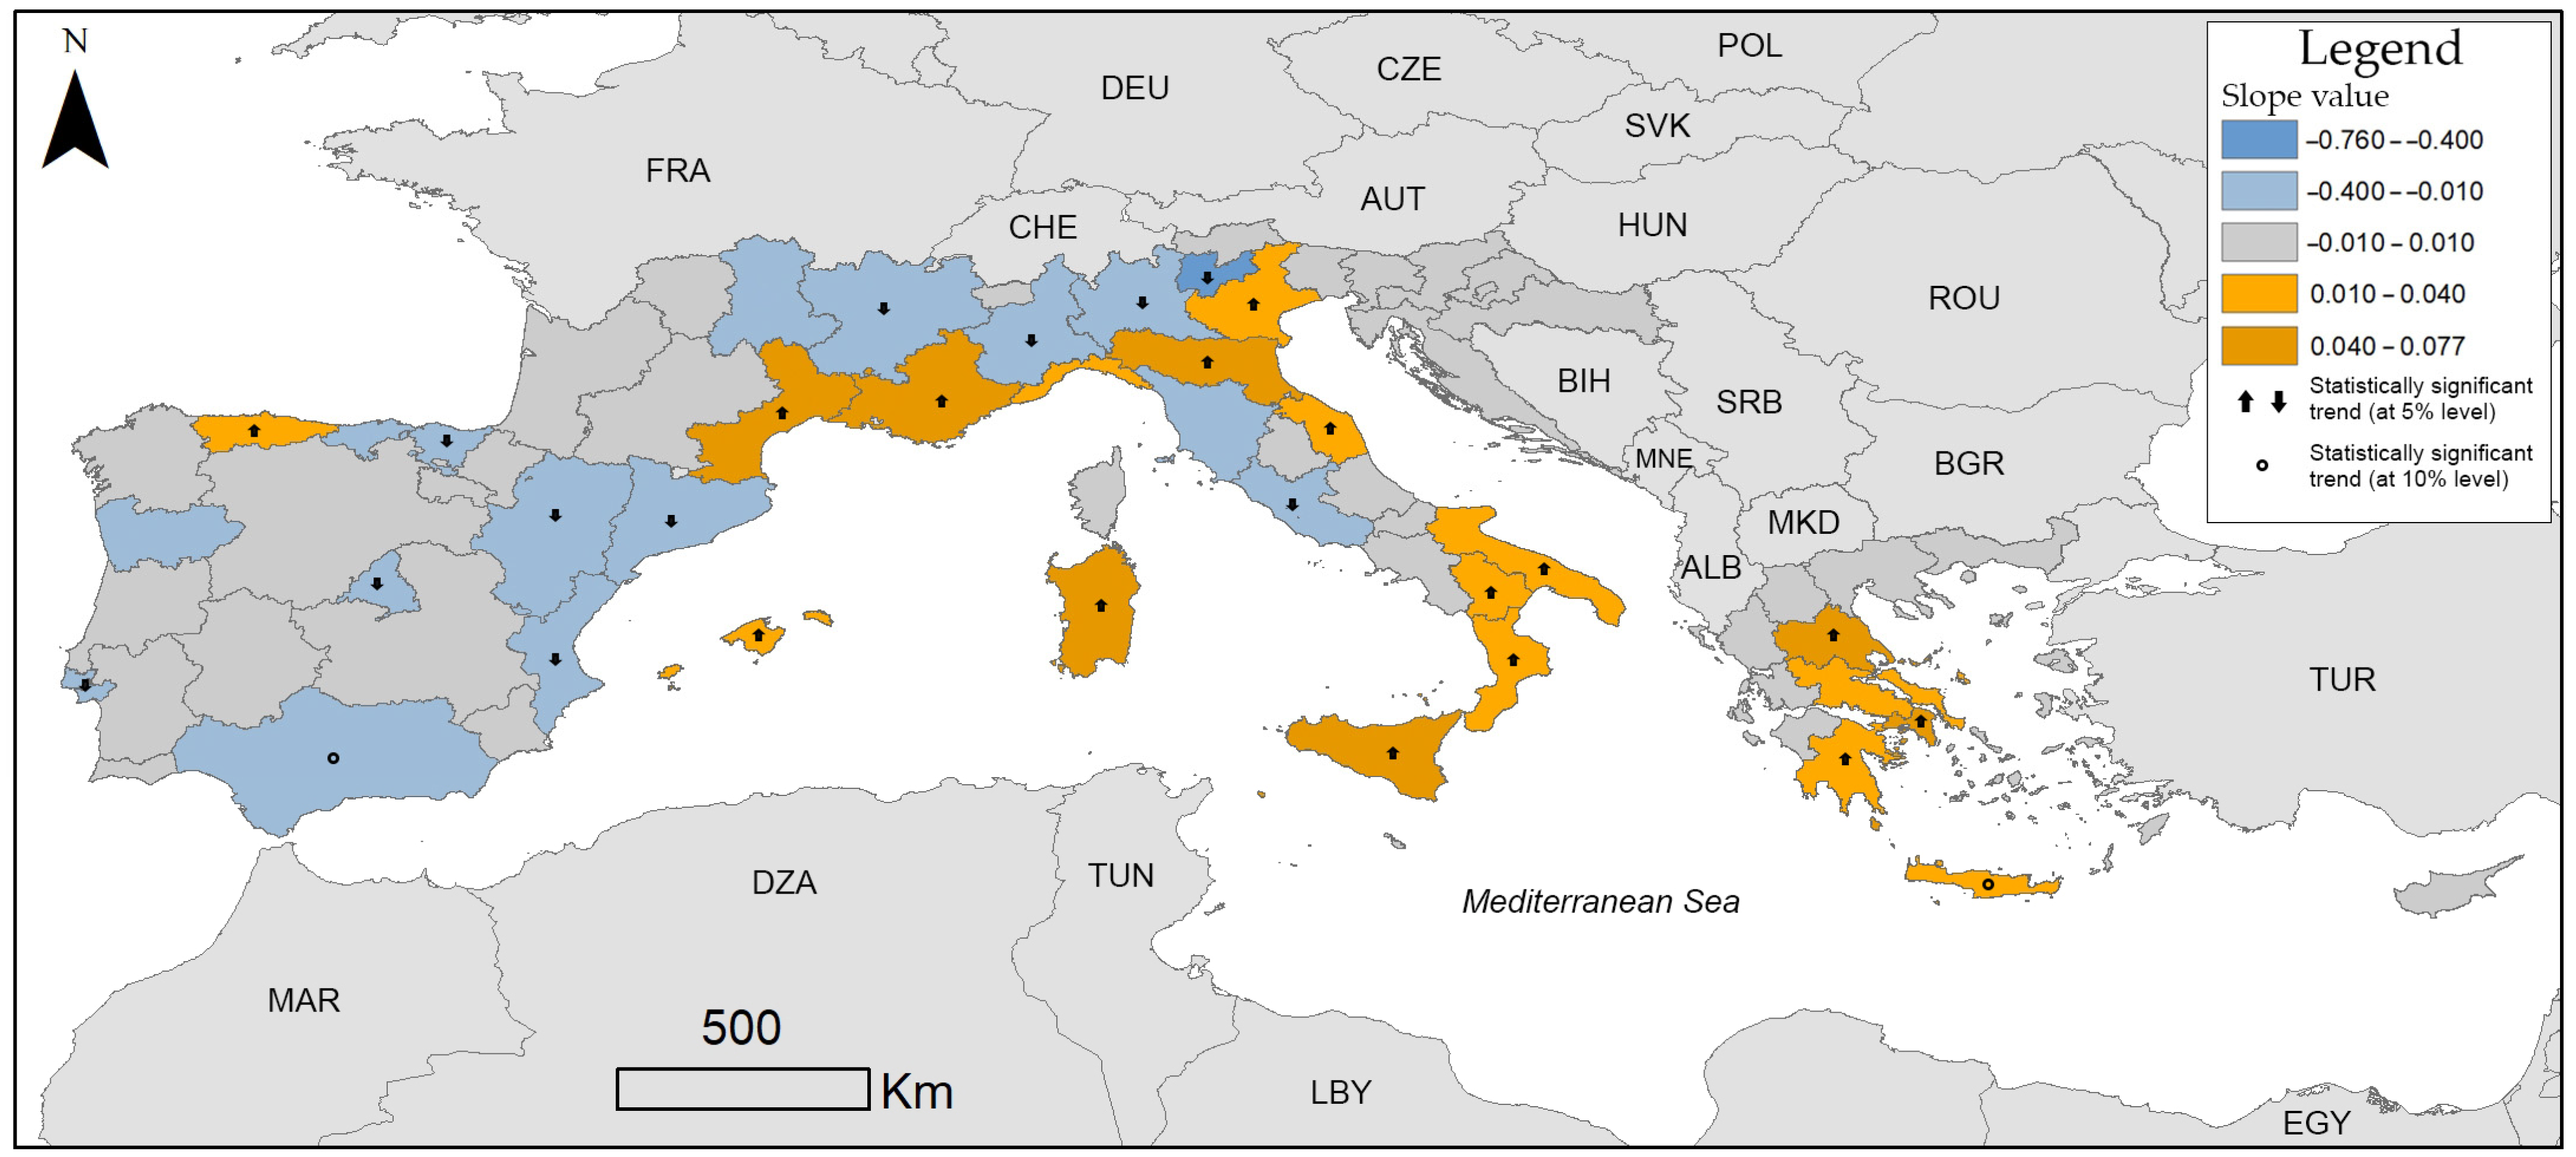
In terms of temporal evolution of fatalities, we explored potential increasing or decreasing trends per region. To this end, we developed a map (Figure 4) illustrating the slope value of a best fit line for the period 1980–2023 in each NUTS2 region. Overall, there is no homogenous increase or decline in the numbers of deaths across the study area. The negative slope values are as common as positive ones, but they present comparatively higher values. The majority of areas present a relatively stable regime with very small slope values (from −0.01 to +0.01). The calculated slopes have relatively small values, indicating trends are not clear. Increasing trends are appearing mostly in south France and parts of north, northeast and south Italy, and Greece. Decreasing trends are recorded in parts of Spain, southern France, and northern Italy.
To examine the statistical significance of trends, we applied a Poisson regression on the number of fatality occurrences (count) throughout the study period (1980–2023) in all 73 regions. Certain regions showed indeed statistically significant increasing or decreasing trends at 5% and 10% levels (Figure 4). The relevant numbers are shown in Table 2.

4. Discussion

The aim of this study was to explore flood-related mortality within the European Union’s territories in the Mediterranean region, particularly focusing on an improved understanding of their spatial and temporal distribution through the exploitation of newly published datasets, together with existing ones for the first time. Specifically, our research leverages six publicly available datasets to create a comprehensive database of 6276 fatalities over the period from 1900 to 2023, including 2331 fatalities from 1980 to 2023, enabling database enables a detailed examination of the spatial and temporal distribution of flood-related deaths in the region. Analysis of the spatial distribution of fatalities reveals a noticeable pattern, with higher incidence rates observed along the axis comprising northeast Spain (Catalonia, Aragon, and Valencia), southern France (Languedoc-Roussillon, Provence-Alpes-Côte d’Azur), and northern Italy (Piedmont, Liguria, Lombardy, Trentino, and Tuscany), in agreement with prior research findings [55,56]. This concentration of fatalities can be attributed to specific climatic patterns prevalent in the region, notably the propensity for short, intense bursts of rainfall. The topographical features surrounding the Mediterranean Sea, especially at this part facilitate the convergence of low-level atmospheric flows and the uplift of warm, moist air masses originating from the Mediterranean Sea toward the coasts, thereby fostering active convection [57]. In addition, differences in population density (found in the present study to show statistically significant association), especially along the Mediterranean coasts, driven by a concentration of various socioeconomic activities such as tourism, trade, and transportation can be a factor influencing the spatial distribution. This pattern is in agreement with the higher flood discharge values identified the region [55], characterizing this area as a “hotspot” of extreme flood discharge and mortality [57]. It’s also in agreement with the findings of Amponsah et al. [58] and Partotny et al. [59] indicating that the area is a high impact region when it comes to flooding. In general, the western part appears to record a higher absolute number of flood-related deaths. However, when this pattern is normalized by population we see an increase in the eastern part of the region.
Concerning the spatial distribution of flood fatalities, it has to be noted that certain limitations exist in the present approach. Mapping fatalities per NUTS2 regions must be considered with caution due to their different population densities and size, their diverse landscape and geomorphology, the different extent of floodplains, as well as the differences in surface area. Thus, for example, larger or more densely populated regions could report higher numbers of fatalities not necessarily because they are more vulnerable to floods, but simply due to the higher number of people exposed to risk. In addition, flood events can be highly localized and vary greatly in intensity, meaning that even within the same region, some areas might experience severe flooding while others remain relatively unaffected. Therefore, it should be noted that the values presented on the above maps are not supposed to provide a uniform value of flood impacts across each region. They are rather a statistical mapping of flood mortality indicators aimed to provide an overview of the spatial and temporal patterns across the region.
Regarding the temporal evolution of fatalities, the examination of the direction of temporal trends across the study area did not reveal a consistent homogenous pattern of increase or decrease. Instead, the analysis indicated divergent trends, with some regions exhibiting positive, others showing negative slope values, and some areas displaying inconclusive trends indicating a relatively stable regime in the last 43 years. In most areas, the slope values were minimal, suggesting a lack of significant changes, consistent with previous literature [57].
Results indicate an absence of decreasing trends in the eastern part of the Mediterranean, encompassing substantial portions of Italy, Croatia, and Greece, a trend that is also noted for high-mortality flood events by Diakakis et al. [36]. Conversely, large parts of Spain, France, and Italy exhibit a slight decline in the number of fatalities, while Portugal demonstrates a mostly neutral slope values. In detail, in Greece we see statically significant increasing trends (at the 5% level) in Attica (EL30), Thessaly (EL61), Peloponnese (EL65) and Crete (EL43) (at the 10% level). In Italy the eastern part of the country from north to south shows an increase. In the north these regions are Veneto (ITH3), Emilia Romana (ITH5) and Marche (ITI3) while in the south an increase is recorded in Puglia (ITF4), Basilicata (ITF5), Calabria (ITF6) and Sicily (ITG1).
In the western part of the study region (i.e. the Iberian Peninsula), an overall decline in the number of fatalities is illustrated, with the exception of Asturias (ES12) in northwestern Spain and several regions in central Spain and Portugal which appear to present inconclusive (or neutral) trends. Statistically significant trends show a decrease in Andalusia (ES61), Valencian Community (ES52), Catalonia (ES51), Aragon (ES24), Madrid (ES30), Cantabria (ES13), and Basque Community (ES21),. This overall decline in Spain is generally reflected in previous studies regarding flood events in the region [60,61], but further research is needed to establish a connection. Portugal shows mostly neutral or negative values particularly in Lisbon area (PT17), in agreement with findings of Pereira et al. [62] on flood mortality in the country.
A more mixed imaged appears in the central part of the study area, with southwest France recording neutral trends, Mediterranean France presenting statistically significant increasing trends (Languedoc-Roussillon—FRJ1 and Provence-Alpes-Côte d’Azur—FRL0), while the adjacent regions at their northern boundaries show a statistically significant decline (namely: Auvergne—FRK1, and Rhône-Alpes- FRK2). Northwestern Italy records a statistically significant decline as well (namely: Piemonte—ITC1, Lombardy—ITC4, Trento—ITH2 and Lazio—ITI4).
In islandic regions we see mostly upward, in Balearic Islands (ES53), Sardinia (ITG2), Sicily (ITG1) and Crete (EL43), or neutral trends (Malta—MT00, Cyprus—CY00, Corsica—FRM0), while there is no evidence of decline.
Overall, one could argue based on these results, that there is a clear difference in the temporal trends of flood-related fatalities between the western part (mostly decline) and the eastern part (mostly increase) of the study area, whereas the central part illustrates a mixed signal.
In general, despite extended year to year variability of flood frequencies throughout the study period that we observed and the multiple parts of the study area with inconclusive trends, there is a considerable number of NUTS2 regions with weak but statistically significant trends.
The different trends of flood-related deaths could be attributed to changes in population exposed to flood hazard [63] expansion of urban areas and the broader rise of population in the region. Although specific data on the concentration of population within floodplains is not available, a chi-square test shows that there is a statistically significant association between the direction of population change of each NUTS2 region (increase or decline) and the direction of the trend of flood fatalities (increasing or decreasing) in the same region. This test shows a p-value of 0.042 (Pearson Chi-Square = 4.121, df = 1, N = 74) and indicates a moderate effect of the direction of change of population on the direction of change of fatalities in each region, based on Cramer’s value (0.239) of the test. Further research is needed look into how changes in population affect flood mortality, but higher population density in the floodplains, gradual expansion of the use of vehicles and the road network in hazard zones, as previous works have suggested [64] could have played a role.
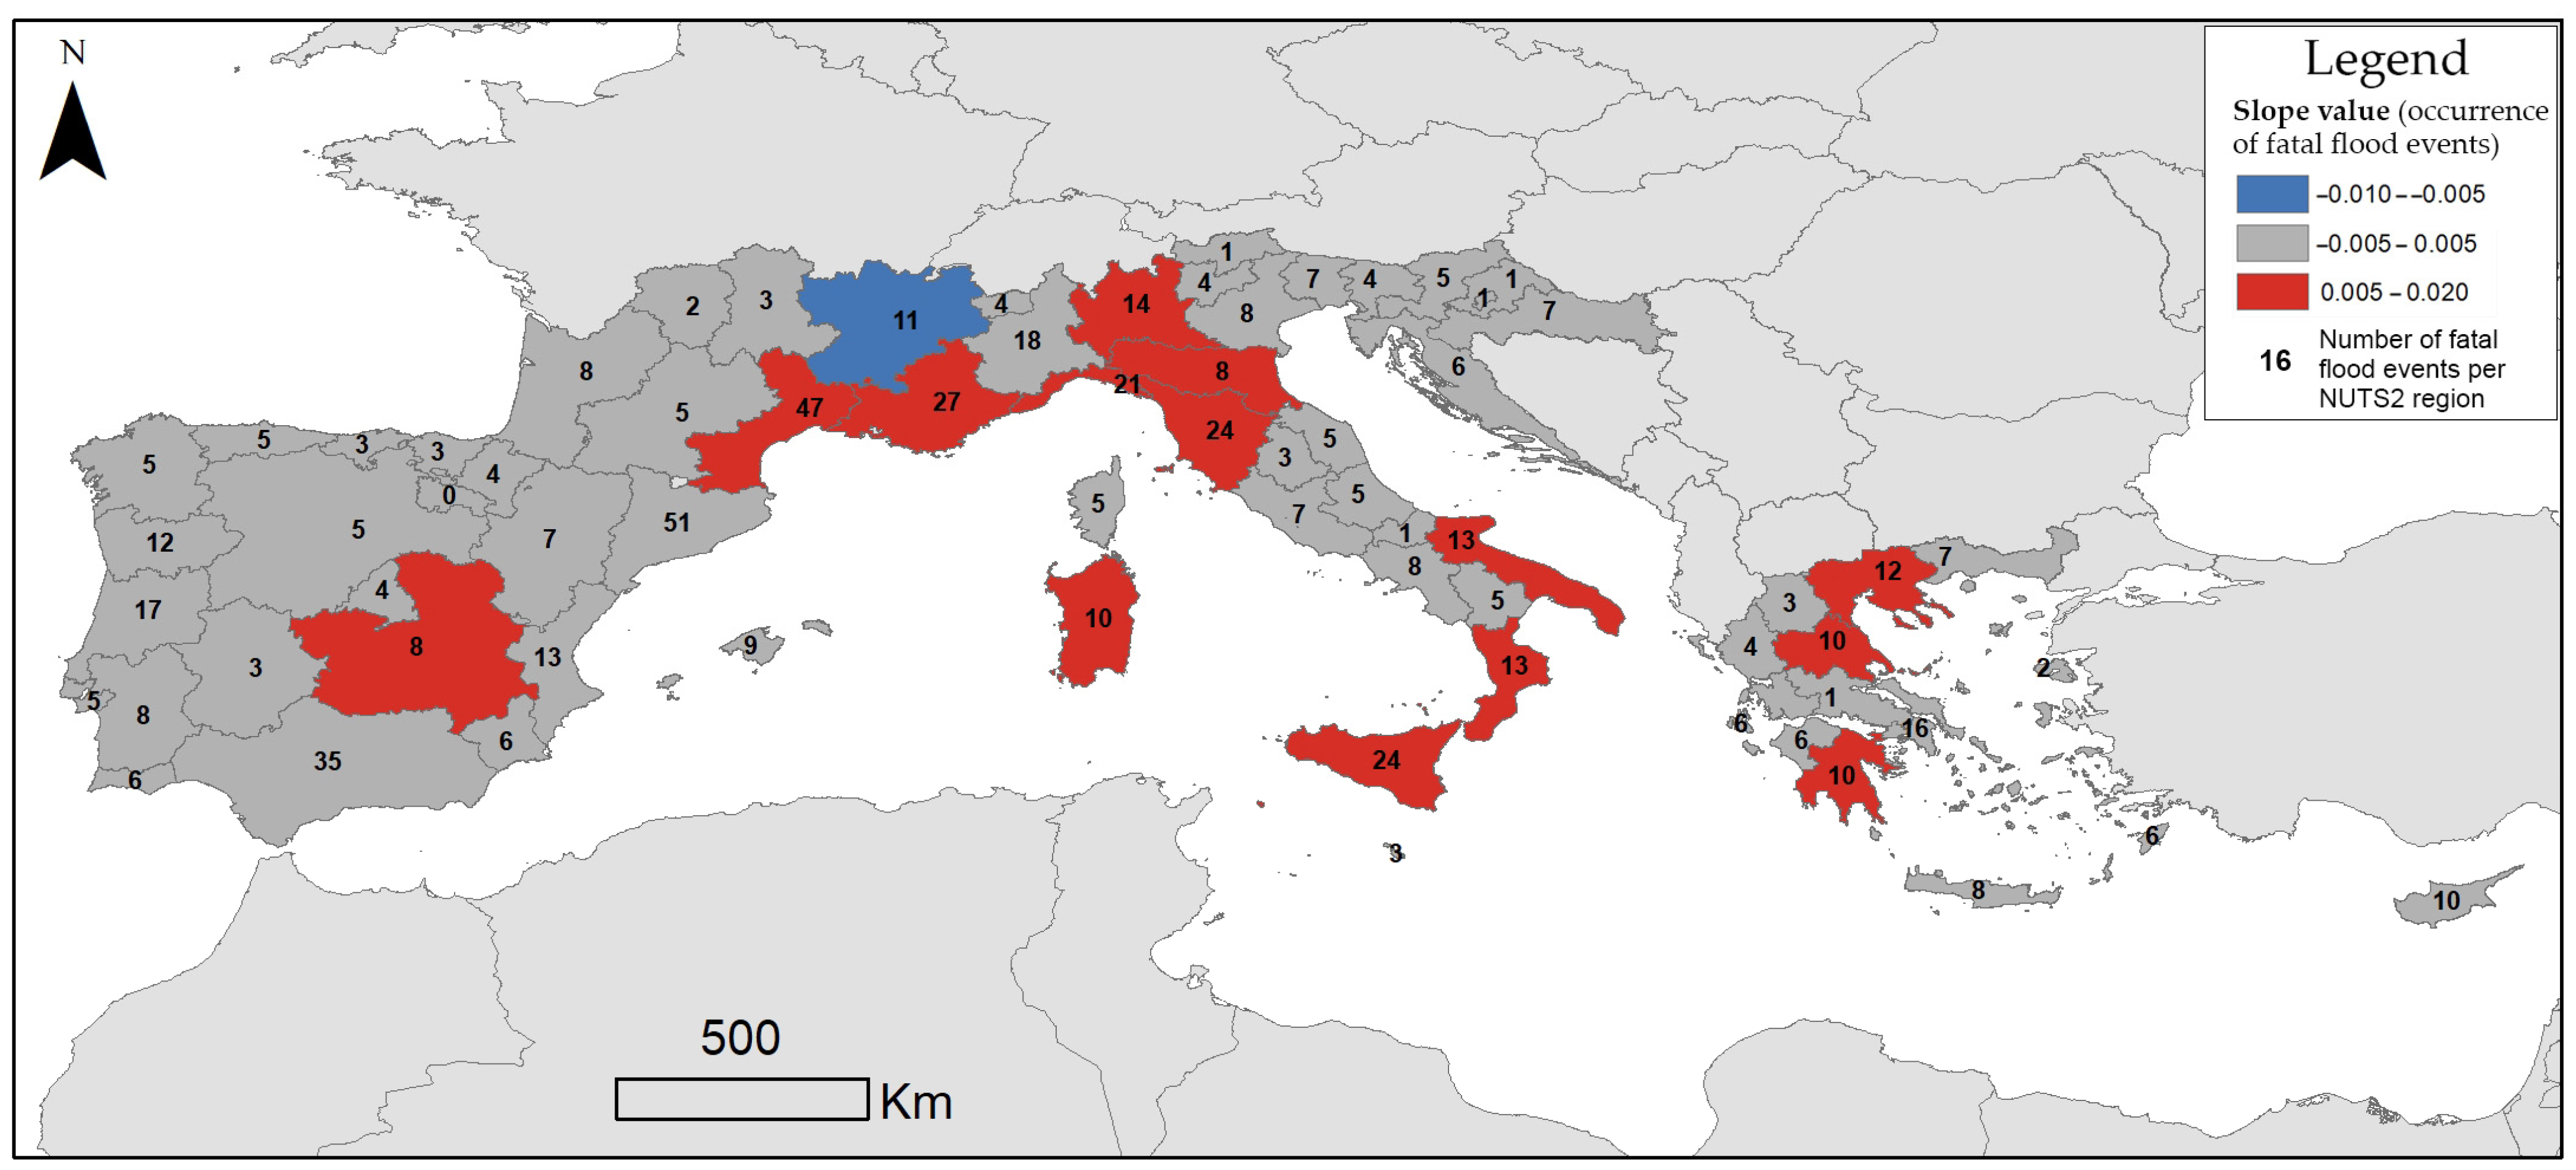
Climatic changes can affect the frequency and intensity of extreme weather events through various mechanisms [65]. As global temperatures rise, the atmosphere holds more moisture, and the warmer sea temperatures provide additional energy fueling more intense storms. This has the potential to lead to a rise in flood frequency and could be also responsible for changes in flood impacts [66], as for example has been recorded for the northeast of Spain [67]. For instance, positive trends recorded in areas in south France [68] could be connected with the rise in fatalities identified in the present study in this area. However, it has to be noted that a rise in flood events, does not necessarily correspond to a rise in fatalities. The nature and the severity of floods, as well as the general level of protection of citizens (e.g. quality of infrastructure, warning systems etc.) could influence casualty numbers significantly. Given the lack of complete datasets on flood events for the study area, further research is needed to produce conclusive results on flood frequency trends in the region to be able to explore the role of climate change in flood mortality. Examination of only the flood events that have caused fatalities (identified in this study) shows that in a large part of the area trends are inconclusive due to the small number of occurrences or showing very small slope values (Figure 5). Nevertheless, taking into account these limitations, south France, north and south Italy and parts of Greece show positive trends in the number of fatal flood events corresponding to areas where we have identified a rise in mortality.
Other factors such as land use changes or forests degradation could also play a role in flood frequency [69,70] although region-wide data are not currently available for the study period.
Nevertheless, due to the sensitivity of such trends to high-mortality floods, examination of the temporal evolution of fatalities has to be updated and reevaluated frequently.
The reliability of assessing temporal trends is expected to improve as fatality data series lengthen in terms of timeframe, providing more comprehensive insights into the evolution of human flood-related losses over time. With regard to temporal trends before 1980, the inherent datasets have limitations in terms of completeness especially regarding small scale flood events. Thus, despite the existence of datasets that extend to more than 100 years the high probability of missing values especially from minor flood events, renders them unreliable in extracting flood mortality trends. The era before 1980 is covered by fewer datasets. On the contrary, after 1980 due to the existence of multiple datasets, allows us to consider the existing records reasonably complete when used together providing a 43-year period of a consistent and continuous mortality archive.
Longer term data can be studied, when limited to analysis of extreme events that due to their magnitude ensure are well recorded across the region, creating a continuous and complete record for many decades, as previous research for the Eastern Mediterranean has shown (e.g. Diakakis et al. [36]). Nevertheless, even in longer study periods trends are not always conclusive, especially for rare extreme events [36].
It would be interesting for future research to examine possible relationship of these trends with that climatic variability (local and regional). In addition, it would be useful for research to explore the complex interplay between extreme weather events, the various factors that control the watersheds’ hydrologic response, different flood protection initiatives that are established in the region, as well as the variability of human presence across the study area as factors in the temporal evolution of flood fatalities.
An advantage of approaching projecting in NUTS2 region level is that it allows to capture the differences in vulnerability across regions created due to various influencing factors (i.e. climate, geomorphology, population, infrastructure, socio-economic activities) that are often masked when we examine flood fatalities on a national level.
The findings of our work have significant implications for the SDGs, particularly SDG 11 (Sustainable Cities and Communities) and SDG 13 (Climate Action). SDG 11 emphasizes the importance of making cities inclusive, safe, resilient, and sustainable: this directly aligns with the need to reduce flood-related fatalities, particularly in densely populated and vulnerable coastal regions. The identification of high-mortality zones in regions such as northeastern Spain, southern France, and northern Italy highlights areas where targeted interventions could be most effective. These areas, characterized by both high population density and exposure to extreme weather events, are the ones that will require prioritized comprehensive urban planning and infrastructure improvements, to name but a few ways to mitigate the risks associated with floods. Additionally, the temporal trends observed in our paper, with regions showing increasing fatalities, for example in northern Italy, underscore the urgent need for climate adaptation strategies as advocated by SDG 13. The increasing trends in flood-related deaths in parts of southern France, and Greece suggest that these areas are particularly vulnerable to the effects of climate change, including more frequent and intense rainfall events. To address these challenges, it is essential to strengthen climate resilience among others through the implementation of early warning systems, improved disaster preparedness, and resilient infrastructure in these high-risk regions. Our findings support the importance of integrating disaster risk reduction into national and regional policies, as outlined in the Sendai Framework for Disaster Risk Reduction, which is closely linked to the achievement of the SDGs. By monitoring flood impacts at the sub-national level, as demonstrated in this research, policymakers can develop targeted interventions that not only reduce flood-related fatalities but also contribute to broader SDGs, ensuring that progress is made in creating safer, more resilient communities across the Mediterranean region.
Overall, this work demonstrates that monitoring flood impacts on human life as for example within the framework of SDGs is feasible, yet constrained by certain limitations inherent in the currently available datasets. The primary shortcomings concern the non-regular update of some of them. In addition, the different standards used (e.g., minimum number of deaths for an event to enter in the database and others) and the different sources used leads to differences in numbers of fatalities, injuries or affected people. In the present study this problem was addressed by studying local detailed reports. However, compilation of a comprehensive ad-hoc database out of the existing ones can be considered necessary to ensure completeness of data in the studied area as has been shown in previous research [8,34] addressing disaster mortality or disaster impacts. Overall, by building a coherent, continuous, as well as complete archive of flood mortality characterized by high accuracy in terms of fatality location and number, it can be considered possible to monitor flood mortality across the EU’s territories of the Mediterranean region, with the currently available datasets in an accurate and reliable way.
Another limitation of the available datasets concerns the lack of completeness in flood event record and of information on their magnitude and hydrological characteristics. The aforementioned data would be particularly useful in exploring temporal trends of flooding and examining their associations with flood impacts. Monitoring flood impacts would benefit from future research focusing on this subject (i.e., systematic collection of flood event numbers and characteristics).
Improving fatality data collection and reporting would benefit monitoring of human losses from floods. A standardized way of reporting national and sub-national mortality data that will be collected in a comprehensive regularly updated database would immensely benefit effective monitoring and therefore informed policymaking and risk mitigation strategies implementation. Cooperation between relevant authorities across the region sharing data and best practices, as well as designating focal points in each country responsible for data collection and communication are considered important steps towards this goal.
Such an effective monitoring scheme would help understand better the vulnerable population and how dangerous circumstances may develop, a basic knowledge for creating public awareness campaigns, but also policymakers can assess whether efforts to reduce flood risk are yield results. In general monitoring disaster losses on a sub-national level supports evidence-based decision-making by providing policymakers with insights into the societal impacts of disasters, and strengthens their capability to prioritize resources, allocate funding, and formulate policies aimed at reducing disaster risk locally.

5. Conclusions

The study investigates flood-related mortality within the European Union’s Mediterranean territories, focusing on providing a better understanding of the spatial and temporal distribution in a high resolution (NUTS2 administrational level) by developing a comprehensive database using for the first time 6 publicly available datasets combined.
The findings present a particular spatial pattern with high numbers between NE Spain and NW Italy. In addition, they show a difference in temporal trends between the western, and the eastern parts of the study area, with a general decline as opposed to a general increase in fatality numbers respectively, as many of the areas record statistically significant trends.
The findings demonstrate that while it is feasible setup a database useful for monitoring flood mortality, this endeavor is hindered by limitations inherent in the currently available datasets as irregular updates, and different standards.
Based on the work described above, it can be concluded that the establishment a standardized manner for uniform data collection stands as an important necessity in addressing the existing deficiency and in facilitating the efficacious monitoring flood impacts on human life, ensuring uniformity, accuracy and consistency of data across diverse geographical regions and temporal contexts.
Consistent data collection in the future have the potential to extract even more robust conclusions on spatiotemporal distribution of fatalities, fostering the comparability of fatality trends over time, thereby enabling a comprehensive analysis of patterns, causative influences, and intervention effectiveness.
This in turn empowers understanding and measuring the problem at higher and central levels of administration, providing more insights for European Union to intervene in an effective way or recommend interventions. The insights gained from this paper not only underscore the importance of addressing regional disparities in flood-related fatalities but also highlight the critical need for integrated approaches in policy development. Aligning future flood risk management strategies with the SDGs, particularly those focused on sustainable cities and climate action, will be essential for reducing mortality and enhancing resilience across the Mediterranean region and beyond.

Author Contributions

Conceptualization, I.S. and M.D.; methodology, I.S. and M.D.; software, M.D.; validation, I.S. and M.D.; formal analysis, I.S. and M.D.; investigation, M.D.; data curation, M.D.; writing—original draft preparation, I.S. and M.D.; writing—review and editing, I.S. and M.D.; visualization, M.D.; supervision, I.S.; project administration, I.S.; funding acquisition, I.S. All authors have read and agreed to the published version of the manuscript.

Funding

This research received no external funding.

Data Availability Statement

The scientific output expressed in this article does not imply a policy position of the European Commission. Neither the European Commission nor any person acting on behalf of the Commission is responsible for the use that might be made of this publication. For information on the methodology and quality underlying the data used in this publication for which the source is neither Eurostat nor other Commission services, users should contact the referenced source. The designations employed and the presentation of material on the maps do not imply the expression of any opinion whatsoever on the part of the European Union concerning the legal status of any country, territory, city or area or of its authorities, or concerning the delimitation of its frontiers or boundaries.

Conflicts of Interest

The authors declare no conflict of interest.

References

  1. Hapuarachchi, H.A.P.; Wang, Q.J.; Pagano, T.C. A review of advances in flash flood forecasting. Hydrol. Process. 2011, 25, 2771–2784. [Google Scholar] [CrossRef]
  2. Jain, S.K.; Mani, P.; Jain, S.K.; Prakash, P.; Singh, V.P.; Tullos, D.; Kumar, S.; Agarwal, S.P.; Dimri, A.P. A Brief review of flood forecasting techniques and their applications. Int. J. River Basin Manag. 2018, 16, 329–344. [Google Scholar] [CrossRef]
  3. Wu, W.; Emerton, R.; Duan, Q.; Wood, A.W.; Wetterhall, F.; Robertson, D.E. Ensemble flood forecasting: Current status and future opportunities. Wiley Interdiscip. Rev. Water 2020, 7, e1432. [Google Scholar] [CrossRef]
  4. Adams, T.E.; Pagano, T.C. Flood Forecasting: A Global Perspective, 1st ed.; Adams, T.E., Pagano, T.C., Eds.; Academic Press: Cambridge, MA, USA, 2016. [Google Scholar]
  5. Perera, D.; Seidou, O.; Agnihotri, J.; Mehmood, H.; Rasmy, M. Challenges and Technical Advances in Flood Early Warning Systems (FEWSs). In Flood Impact Mitigation and Resilience Enhancement; Huang, G., Ed.; IntechOpen: London, UK, 2020; p. 194. [Google Scholar]
  6. Levy, J.K.; Hall, J. Advances in flood risk management under uncertainty. Stoch. Environ. Res. Risk Assess. 2005, 19, 375–377. [Google Scholar] [CrossRef]
  7. Munich, Re. Risks from Floods, Storm Surges and Flash Floods. Underestimated Natural Hazard; Munich Re: Munich, Germany, 2021. [Google Scholar]
  8. Papagiannaki, K.; Petrucci, O.; Diakakis, M.; Kotroni, V.; Aceto, L.; Bianchi, C.; Brázdil, R.; Gelabert, M.G.; Inbar, M.; Kahraman, A.; et al. Developing a large-scale dataset of flood fatalities for territories in the Euro-Mediterranean region, FFEM-DB. Sci. Data 2022, 9, 166. [Google Scholar] [CrossRef]
  9. Lehmkuhl, F.; Schüttrumpf, H.; Schwarzbauer, J.; Brüll, C.; Dietze, M.; Letmathe, P.; Völker, C.; Hollert, H. Assessment of the 2021 summer flood in Central Europe. Environ. Sci. Eur. 2022, 34, 107. [Google Scholar] [CrossRef]
  10. Dimitriou, E.; Efstratiadis, A.; Zotou, I.; Papadopoulos, A.; Iliopoulou, T.; Sakki, G.K.; Mazi, K.; Rozos, E.; Koukouvinos, A.; Koussis, A.D.; et al. Post-Analysis of Daniel Extreme Flood Event in Thessaly, Central Greece: Practical Lessons and the Value of State-of-the-Art Water-Monitoring Networks. Water 2024, 16, 980. [Google Scholar] [CrossRef]
  11. Romero, R.; Emanuel, K. Medicane risk in a changing climate. J. Geophys. Res. Atmos. 2013, 118, 5992–6001. [Google Scholar] [CrossRef]
  12. Giorgi, F.; Lionello, P. Climate change projections for the Mediterranean region. Glob. Planet. Chang. 2008, 63, 90–104. [Google Scholar] [CrossRef]
  13. Zittis, G.; Almazroui, M.; Alpert, P.; Ciais, P.; Cramer, W.; Dahdal, Y.; Fnais, M.; Francis, D.; Hadjinicolaou, P.; Howari, F.; et al. Climate Change and Weather Extremes in the Eastern Mediterranean and Middle East. Rev. Geophys. 2022, 60, e2021RG000762. [Google Scholar] [CrossRef]
  14. United Nations. The UN Sustainable Development Goals, 1; United Nations: Geneva Switzerland, 2015. [Google Scholar]
  15. United Nations. United Nations Paris Agreement—United Nations Framework Convention on Climate Change, 1; United Nations: Paris, France, 2015. [Google Scholar]
  16. UNISDR. Sendai Framework for Disaster Risk Reduction 2015–2030, 32; United Nations Office for Disaster Risk Reduction—UNISDR: Geneva, Switzerland, 2015. [Google Scholar]
  17. Khan, A.; Gupta, S.; Gupta, S.K. Multi-hazard disaster studies: Monitoring, detection, recovery, and management, based on emerging technologies and optimal techniques. Int. J. Disaster Risk Reduct. 2020, 47, 101642. [Google Scholar] [CrossRef]
  18. Ahern, M.; Kovats, R.S.; Wilkinson, P.; Few, R.; Matthies, F. Global Health Impacts of Floods: Epidemiologic Evidence. Epiemiol. Rev. 2005, 27, 36–46. [Google Scholar] [CrossRef]
  19. Alderman, K.; Turner, L.R.; Tong, S. Floods and human health: A systematic review. Environ. Int. 2012, 47, 37–47. [Google Scholar] [CrossRef] [PubMed]
  20. Petrucci, O. Review article: Factors leading to the occurrence of flood fatalities: A systematic review of research papers published between 2010 and 2020. Nat. Hazards Earth Syst. Sci. 2022, 22, 71–83. [Google Scholar] [CrossRef]
  21. Salvati, P.; Petrucci, O.; Rossi, M.; Bianchi, C.; Pasqua, A.A.; Guzzetti, F. Gender, age and circumstances analysis of flood and landslide fatalities in Italy. Sci. Total Environ. 2018, 610–611, 867–879. [Google Scholar] [CrossRef] [PubMed]
  22. Diakakis, M.; Deligiannakis, G. Vehicle-related flood fatalities in Greece. Environ. Hazards 2013, 12, 278–290. [Google Scholar] [CrossRef]
  23. Diakakis, M.; Deligiannakis, G.; Andreadakis, E.; Katsetsiadou, K.N.; Spyrou, N.I.; Gogou, M.E. How different surrounding environments influence the characteristics of flash flood-mortality: The case of the 2017 extreme flood in Mandra, Greece. J. Flood Risk Manag. 2020, 13, e12613. [Google Scholar] [CrossRef]
  24. Ruin, I.; Creutin, J.; Anquetin, S. Human exposure to flash floods—Relation between flood parameters and human vulnerability during a storm of September 2002 in Southern France. J. Hydrol. 2008, 361, 199–213. [Google Scholar] [CrossRef]
  25. Vinet, F.; Lumbroso, D.; Defossez, S.; Boissier, L. A comparative analysis of the loss of life during two recent floods in France: The sea surge caused by the storm Xynthia and the flash flood in Var. Nat. Hazards 2012, 61, 1179–1201. [Google Scholar] [CrossRef]
  26. Špitalar, M.; Brilly, M.; Kos, D.; Žiberna, A. Analysis of flood fatalities-Slovenian illustration. Water 2020, 12, 64. [Google Scholar] [CrossRef]
  27. Diakakis, M.; Deligiannakis, G. Flood fatalities in Greece: 1970–2010. J. Flood Risk Manag. 2017, 10, 115–123. [Google Scholar] [CrossRef]
  28. Brázdil, R.; Chroma, K.; Dolák, L.; Rehorˇ, J.; Rezníchova, L.; Zahradníček, P.; Dobrovolný, P. Fatalities associated with the severe weather conditions in the Czech Republic, 2000–2019. Nat. Hazards Earth Syst. Sci. 2021, 21, 1355–1382. [Google Scholar] [CrossRef]
  29. Vinet, F.; Bigot, V.; Petrucci, O.; Papagiannaki, K.; Llasat, M.C.; Kotroni, V.; Boissier, L.; Aceto, L.; Grimalt, M.; Pasqua, A.A.; et al. Mapping Flood-Related Mortality in the Mediterranean Basin. Results from the MEFF v2.0 DB. Water 2019, 11, 2196. [Google Scholar] [CrossRef]
  30. Petrucci, O.; Aceto, L.; Bianchi, C.; Bigot, V.; Br, R.; Pereira, S.; Kahraman, A.; Kılıç, Ö.; Kotroni, V.; Llasat, M.C.; et al. Flood Fatalities in Europe, 1980–2018: Variability, Features, and Lessons to Learn. Water 2019, 11, 1682. [Google Scholar] [CrossRef]
  31. Guha-Sapir, D.; Below, R.; Hoyois, P. EM-DAT: The CRED/OFDA International Disaster Database; Center for Research on the Epidimiology of Disasters: Brussels, Belgium, 2021. [Google Scholar]
  32. Brakenridge, G.R. Global Active Archive of Large Flood Events; Dartmouth Flood Observatory: Boulder, CO, USA, 2021. [Google Scholar]
  33. Paprotny, D.; Morales-nápoles, O.; Jonkman, S.N. HANZE: A pan-European database of exposure to natural hazards and damaging historical floods since 1870. Earth Syst. Sci. Data 2018, 10, 565–581. [Google Scholar] [CrossRef]
  34. Antofie, T.; Luoni, S.; Marin Ferrer, M.; Faiella, A. Risk Data Hub–Web Platform to Facilitate Management of Disaster Risks; Publications Office of the European Union: Luxembourg, 2019. [Google Scholar]
  35. Petrucci, O.; Papagiannaki, K.; Aceto, L.; Boissier, L.; Kotroni, V.; Grimalt, M.; Llasat, M.C.; Llasat-Botija, M.; Rosselló, J.; Pasqua, A.A.; et al. MEFF: The database of MEditerranean Flood Fatalities (1980 to 2015). J. Flood Risk Manag. 2019, 12, e12461. [Google Scholar] [CrossRef]
  36. Diakakis, M.; Papagiannaki, K.; Fouskaris, M. The Occurrence of Catastrophic Multiple-Fatality Flash Floods in the Eastern Mediterranean Region. Water 2023, 15, 119. [Google Scholar] [CrossRef]
  37. Lionello, P.; Scarascia, L. The relation between climate change in the Mediterranean region and global warming. Reg. Environ. Chang. 2018, 18, 1481–1493. [Google Scholar] [CrossRef]
  38. Lionello, P. The Climate of the Mediteerranean Region. From the Past to the Future; Lionello, P., Ed.; Elsevier: Amsterdam, The Netherlands, 2012; ISBN 9780124160422. [Google Scholar]
  39. Lionello, P.; Malanotte-rizzoli, P.; Boscolo, R.; Alpert, P.; Artale, V.; Li, L.; Luterbacher, J.; May, W.; Trigo, R.; Tsimplis, M.; et al. The Mediterranean climate: An overview of the main characteristics and issues. Dev. Earth Environ. Sci. 2006, 4, 1–26. [Google Scholar] [CrossRef]
  40. Faccini, F.; Luino, F.; Paliaga, G.; Roccati, A.; Turconi, L.; Petroselli, A.; Pelorosso, R.; Vojtek, M. Flash Flood Events along the West Mediterranean Coasts: Inundations of Urbanized Areas Conditioned by Anthropic Impacts. Land 2021, 10, 620. [Google Scholar] [CrossRef]
  41. Nicholls, R.J.; Hoozemans, F.M.J. The Mediterranean: Vulnerability to coastal implications of climate change. Ocean Coast. Manag. 1996, 31, 105–132. [Google Scholar] [CrossRef]
  42. Tarolli, P.; Borga, M.; Morin, E.; Delrieu, G. Analysis of flash flood regimes in the North-Western and South-Eastern Mediterranean regions. Nat. Hazards Earth Syst. Sci. 2012, 12, 1255–1265. [Google Scholar] [CrossRef]
  43. European Environment Agency Flood Phenomena. European Past Floods; European Environment Agency: Brussels, Belgium, 2015.
  44. WDD. Preliminary Flood Risk Assessment Final Report; Water Development Department, Ministry of Agriculture, Rural Development and Environment of Cyprus: Lefkosia, Cyprus, 2011; Volume 70.
  45. Papagiannaki, K.; Lagouvardos, K.; Kotroni, V. A database of high-impact weather events in Greece: A descriptive Atmospheric impact analysis for the period 2001–2011. Nat. Hazards Earth Syst. Sci. 2013, 13, 727–736. [Google Scholar] [CrossRef]
  46. ISPRA. Annuario Dei Dati Ambientali 2003–2023; Instituto Superiore per la Protezione e la Ricerca Ambientale: Rome, Italy, 2023.
  47. Petrucci, O.; Pasqua, A.A. Historical climatology of storm events in the mediterranean: A case study of damaging hydrological events in Calabria, Southern Italy. In Advances in Natural and Technological Hazards Research; Diodato, N., Bellocchi, G., Eds.; Springer: Berlin/Heidelberg, Germany, 2014; Volume 39, pp. 249–268. ISBN 9789400779488. [Google Scholar]
  48. Zezere, J.L.; Pereira, S.; Tavares, A.O.; Bateira, C.; Trigo, R.M.; Ze, J.L.; Quaresma, I.; Santos, P.P.; Santos, M.; Verde, J. DISASTER: A GIS database on hydro-geomorphologic disasters in Portugal. Nat. Hazards 2014, 72, 503–532. [Google Scholar] [CrossRef]
  49. Kovačić, T. Analysis of Short-Term Rainfall Characteristics Related to the Pluvial Floods in the City of Zagreb; University of Zagreb: Zagreb, Croatia, 2020. [Google Scholar]
  50. Malta Energy and Water Agency Preliminary Flood Risk Assessment for the Malta River Basin District; Malta Energy and Water Agency: Valetta, Malta, 2013.
  51. Main, G.; Gauci, R.; Schembri, J.A.; Chester, D.K. A multi-hazard historical catalogue for the city-island-state of Malta (Central Mediterranean). Nat. Hazards 2022, 114, 605–628. [Google Scholar] [CrossRef]
  52. Boissier, L. La Mortalité liée aux Crues Torrentielles Dans le Sud de la France: Une Approche de la Vulnérabilité Humaine Face à L’inondation; Université Paul Valéry—Montpellier III: Montpellier, France, 2013. [Google Scholar]
  53. Gardner, W.; Mulvey, E.P.; Shaw, E.C. Regression analyses of counts and rates: Poisson, overdispersed Poisson, and negative binomial models. Psychol. Bull. 1995, 118, 392–404. [Google Scholar] [CrossRef]
  54. Elhai, J.D.; Calhoun, P.S.; Ford, J.D. Statistical procedures for analyzing mental health services data. Psychiatry Res. 2008, 160, 129–136. [Google Scholar] [CrossRef]
  55. Gaume, E.; Bain, V.; Bernardara, P.; Newinger, O.; Barbuc, M.; Bateman, A.; Blaškovičová, L.; Blöschl, G.; Borga, M.; Dumitrescu, A.; et al. A compilation of data on European flash floods. J. Hydrol. 2009, 367, 70–78. [Google Scholar] [CrossRef]
  56. Llasat, M.C.; Llasat-Botija, M.; Prat, M.A.; Porcú, F.; Price, C.; Mugnai, A.; Lagouvardos, K.; Kotroni, V.; Katsanos, D.; Michaelides, S.; et al. High-impact floods and flash floods in Mediterranean countries: The FLASH preliminary database. Adv. Geosci. 2010, 23, 47–55. [Google Scholar] [CrossRef]
  57. Gaume, E.; Borga, M.; Llasat, M.C.; Maouche, S.; Lang, M.; Diakakis, M. Mediterranean extreme floods and flash floods. In Proceedings of the The Mediterranean Region under Climate Change: A Scientific Update; Sabrié, M.-L., Gibert-Brunet, E., Mourier, T., Eds.; IRD Editions: Marseille, France, 2016; pp. 133–145. [Google Scholar]
  58. Amponsah, W.; Ayral, P.-A.; Boudevillain, B.; Bouvier, C.; Braud, I.; Brunet6, P.; Delrieu, G.; Didon-Lescot, J.-F.; Gaume, E.; Lebouc, L.; et al. Integrated high-resolution dataset of high-intensity European and Mediterranean flash floods. Earth Syst. Sci. Data 2018, 10, 1783–1794. [Google Scholar] [CrossRef]
  59. Paprotny, D.; Sebastian, A.; Morales-Nápoles, O.; Jonkman, S.N. Trends in flood losses in Europe over the past 150 years. Nat. Commun. 2018, 9, 1985. [Google Scholar] [CrossRef] [PubMed]
  60. Santos, M.S.; Mediero, L.; Lima, C.H.R.; Moura, L.Z. Links between different classes of storm tracks and the flood trends in Spain. J. Hydrol. 2018, 567, 71–85. [Google Scholar] [CrossRef]
  61. Barredo, J.I.; Saurí, D.; Llasat, M.C. Assessing trends in insured losses from floods in Spain 1971–2008. Nat. Hazards Earth Syst. Sci. 2012, 12, 1723–1729. [Google Scholar] [CrossRef]
  62. Pereira, S.; Zêzere, J.L.; Quaresma, I.; Santos, P.P.; Santos, M. Mortality Patterns of Hydro-Geomorphologic Disasters. Risk Anal. 2016, 36, 1188–1210. [Google Scholar] [CrossRef]
  63. Rentschler, J.; Salhab, M.; Jafino, B.A. Flood exposure and poverty in 188 countries. Nat. Commun. 2022, 13, 3527. [Google Scholar] [CrossRef]
  64. Diakakis, M. Have flood mortality qualitative characteristics changed during the last decades? The case study of Greece. Environ. Hazards 2016, 15, 148–159. [Google Scholar] [CrossRef]
  65. IPCC. Climate Change 2023: Synthesis Report. Contribution of Working Groups I, II and III to the Sixth Assessment Report; IPCC: Geneva, Switzerland, 2023. [Google Scholar]
  66. Llasat, M.C.; Marcos, R.; Turco, M.; Gilabert, J.; Llasat-Botija, M. Trends in flash flood events versus convective precipitation in the Mediterranean region: The case of Catalonia. J. Hydrol. 2016, 541, 24–37. [Google Scholar] [CrossRef]
  67. Cortès, M.; Turco, M.; Ward, P.; Sánchez-espigares, J.A.; Alfieri, L.; Llasat, M.C. Changes in flood damage with global warming on the eastern coast of Spain. Nat. Hazards Earth Syst. Sci. 2019, 19, 2855–2877. [Google Scholar] [CrossRef]
  68. Giuntoli, I.; Renard, B.; Lang, M. Floods in France. In Changes in Flood Risk in Europe; Kundzewicz, Z.W., Ed.; IAHS Special Publication/CRC Press/Balkema: Leiden, The Netherlands, 2012; pp. 199–211. [Google Scholar]
  69. Schilling, K.E.; Gassman, P.W.; Kling, C.L.; Campbell, T.; Jha, M.K.; Wolter, C.F.; Arnold, J.G. The potential for agricultural land use change to reduce flood risk in a large watershed. Hydrol. Process. 2014, 28, 3314–3325. [Google Scholar] [CrossRef]
  70. Saghafian, B.; Farazjoo, H.; Bozorgy, B.; Yazdandoost, F. Flood intensification due to changes in land use. Water Resour. Manag. 2008, 22, 1051–1067. [Google Scholar] [CrossRef]
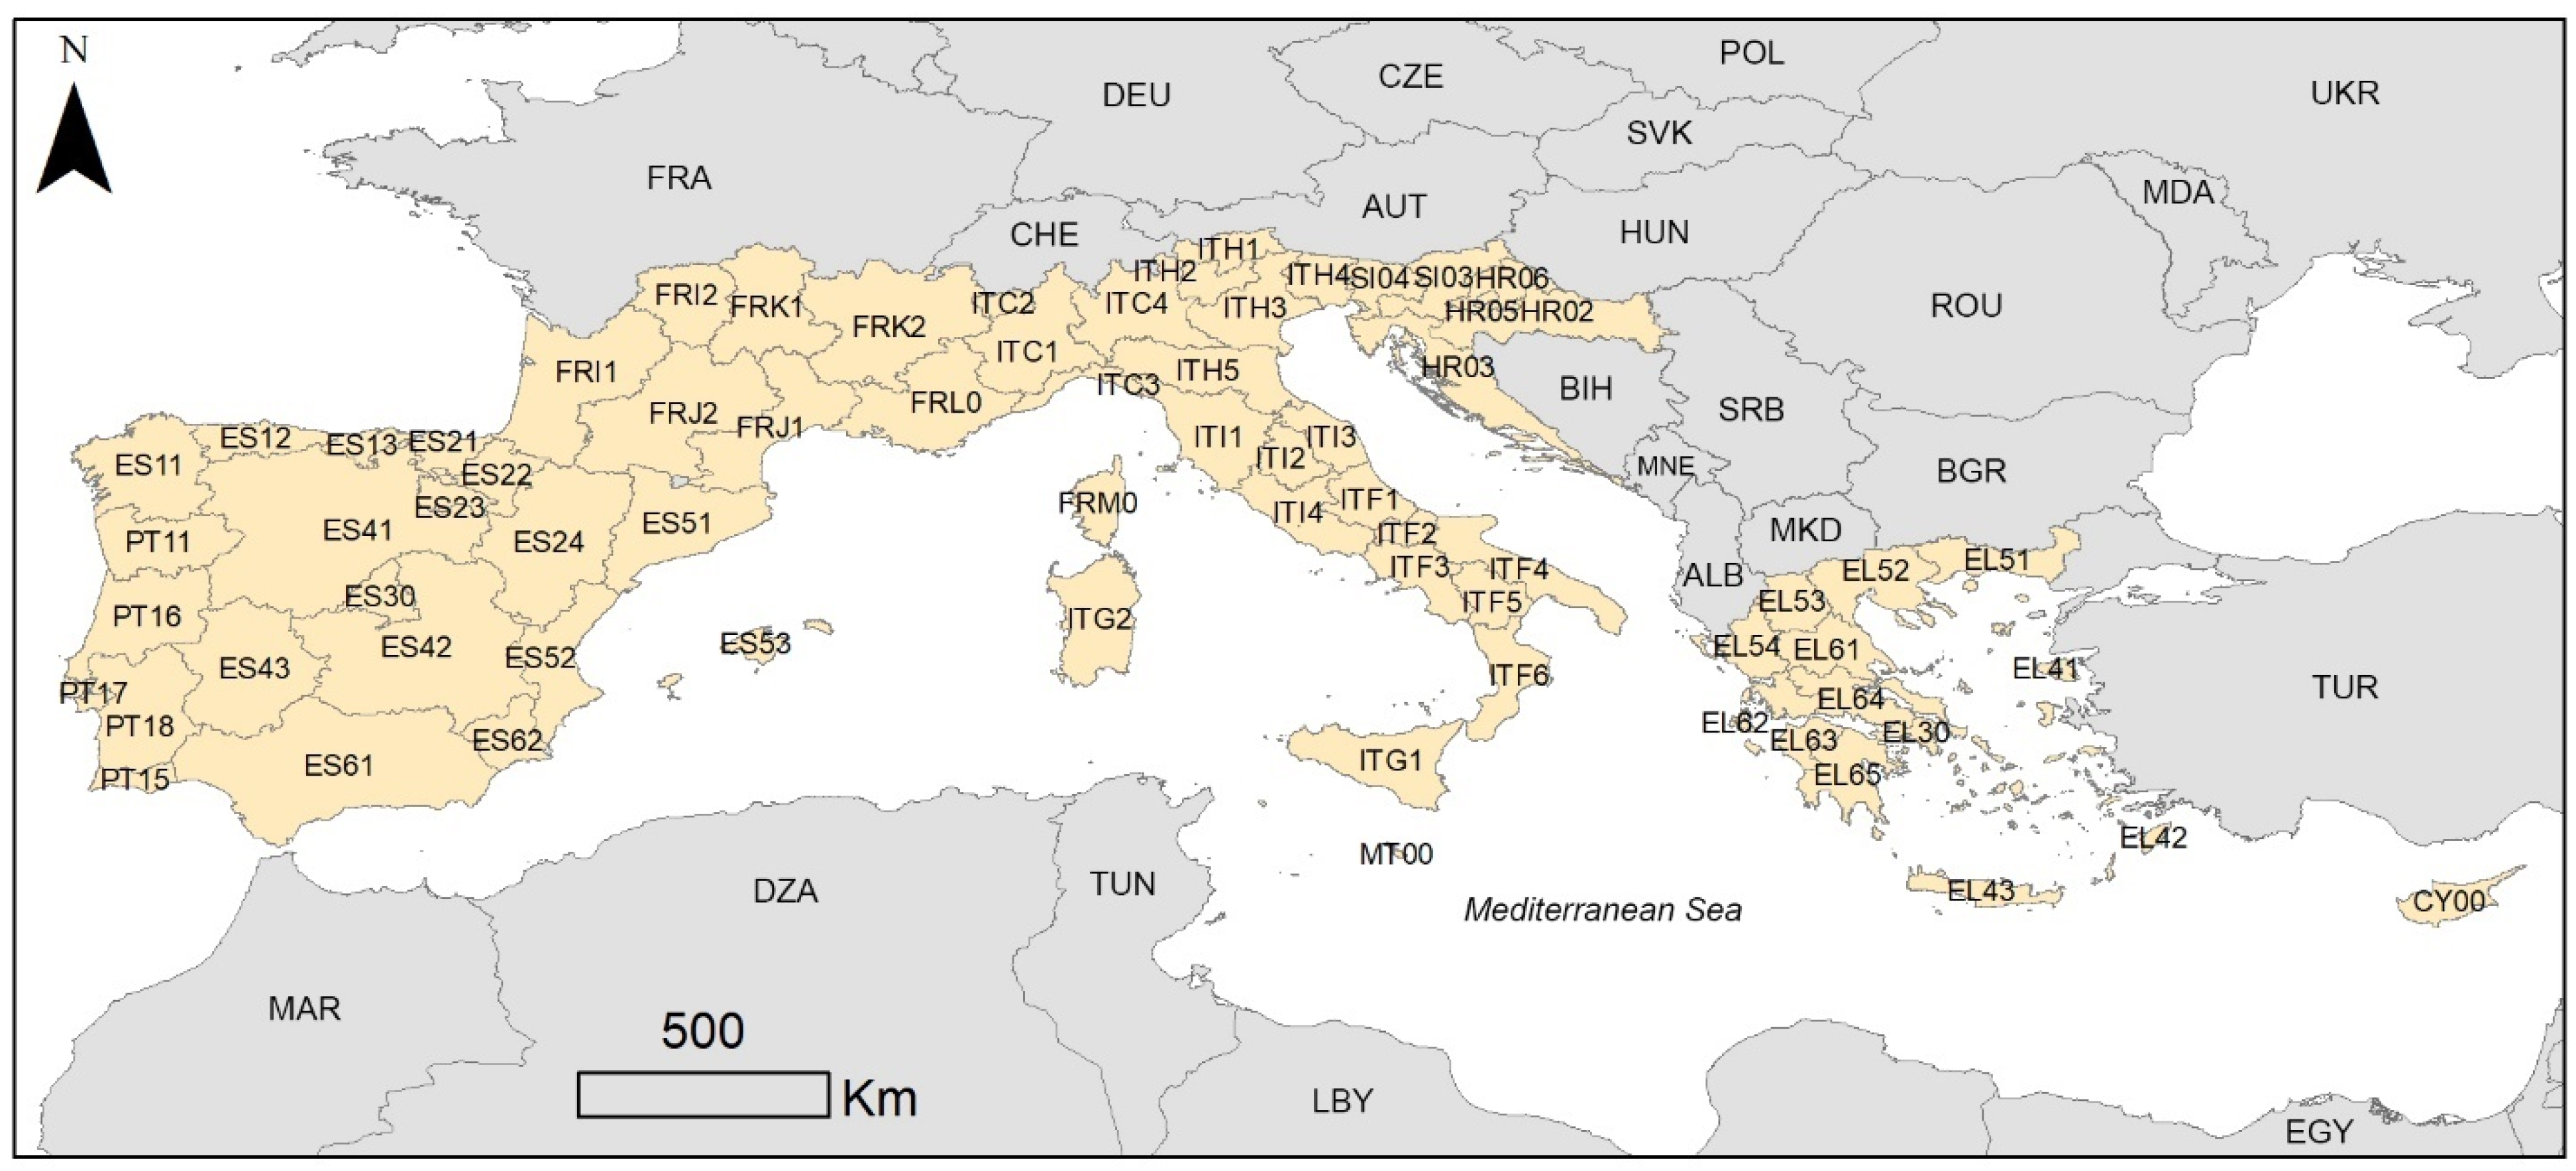
Figure 1. Map of the territories included in the database in yellow with the codes of the NUTS2 regions. Note the abbreviations of the surrounding countries: Morocco (MAR), Algeria (DZA), Tunisia (TUN), Libya (LBY), Egypt (EGY), Turkiye (TUR), Bulgaria (BGR), North Macedonia (MKD), Albania (ALB), Montenegro (MNE), Bosnia Herzegovina (BIH), Moldova (MDA), Hungary HUN), Slovakia (SVK), Switzerland (CHE), Germany (DEU), Poland (POL), Ukraine (UKR), Romania (ROU), and the rest of France (FRA).
Water 16 02470 g001
Figure 2. Map of the study area and its regions (NUTS2 level), as well as the surrounding countries, showing (a) total number of fatalities recorded in 1980–2023 the database in 5 classes and (b) the total number of fatalities recorded in 1900 to 2023 in the database in 5 classes.
Water 16 02470 g002
Figure 3. Map of the study area and its regions (NUTS2 level) showing the total number of fatalities recorded in the database per 100,000 population in 5 classes. The population estimate was based on average of 1991, 2001, 2011 and 2021 censuses (see sources of population data in Section 2.3).
Water 16 02470 g003
Figure 4. Map of the study area and its regions (NUTS2 level) showing in 5 groups (color scale) the slope value of the best fit line of the temporal evolution of the total number of fatalities recorded in the database (for 1980–2023), which shows with warm colours the regions where the number of fatalities is increasing, and with cool colours the regions where the number of fatalities is decreasing (within the study period). Dark grey colours denote the regions that present a relatively stable regime with very small (from −0.01 to +0.01) values. Arrows pointing upwards and downwards denote statistically significant increasing or decreasing trends at 5% level respectively. Circles denote statistically significant trends at 10% level.
Water 16 02470 g004
Figure 5. Map of the study area and its regions (NUTS2 level) showing in 3 groups the slope value of the best fit line of the temporal evolution and the total number of fatal flood events recorded in the database (for 1980–2023) per region. Red color denotes positive values and blue color denotes negative values, whereas grey color denotes inconclusive trends or values very close to zero.
Water 16 02470 g005
Table 1. Data sources, their types and their coverage.
TypeTitleSourceTime Coverage
I.D.EM-DATGuha-Sapir et al. [31]1900–2023
I.D.Global Active Archive of Large Flood Events of Dartmouth Flood ObservatoryBrakenridge [32]1985–2023
I.D.Hanze-EPaprotny et al. [33]1870–2016
I.D.European Past Floods (EPF)EEA [43]1980–2015
I.D.FFEM-DBPapagiannaki et al. [8]1980–2020
I.D.Eastern Mediterranean High Mortality flood databaseDiakakis et al. [36]1880–2021
C. R. (Cyprus)Preliminary Flood Risk Assessment Report for Cyprus WDD [44]1880–2015
C. S. (Greece)A database of high-impact weather events in Greece Papagiannaki et al. [45]2001–2023
C. S. (Greece)Flood fatalities in GreeceDiakakis and Deligiannakis [27]1960–2023
C. R. (Italy)Annuario dei dati ambientaliISPRA [46]2003–2023
C. R. (Italy)Historical climatology of storm events in the mediterranean: A case study of damaging hydrological events in Calabria, Southern ItalyPetrucci and Pasqua [47]1951–2014
C. S. (Portugal)DISASTER: a GIS database on hydro-geomorphologic disasters in PortugalZêzere et al. [48]1865–2014
C. S. (Croatia)Analysis of Short-Term Rainfall Characteristics Related to the Pluvial Floods in the City of ZagrebKovačić [49]2007–2017
C. R. (Malta)Preliminary Flood Risk AssessmentMalta Energy and Water Authority [50]1979–2012
C. S. (Malta)multi-hazard historical catalogue for the city-island-stateof MaltaMain et al. [51]Selected events
C. S. (South France)Mortality of floods in the south of France (in French)Boissier [52]Selected events
Note(s): I.D. = International Database, C.R. = Country report, C.S. = Country study.
Table 2. Poisson regression results for NUTS2 regions.
NUTS2 Region CodePoisson Coefficientp-Value
EL300.03130.003
EL610.10500.000
EL650.05200.028
PT17−0.27400.000
PT300.03670.002
FRK1−0.23350.002
FRL00.01700.013
FRK2−0.07800.000
FRJ10.01770.002
ES120.09000.004
ES13−0.09500.037
ES21−0.23300.000
ES24−0.02290.000
ES530.05100.008
ES30−0.06500.004
ES51−0.03750.000
ES52−0.07300.000
ITC1−0.03200.000
ITC4−0.05900.000
ITF40.03200.048
ITF50.06360.055
ITF60.02900.016
ITG10.02100.011
ITG20.05540.000
ITH2−0.17000.000
ITH30.04100.039
ITH50.12000.000
ITI30.08840.009
ITI4−0.04560.030
ES61−0.01800.088
EL430.05500.054
Disclaimer/Publisher’s Note: The statements, opinions and data contained in all publications are solely those of the individual author(s) and contributor(s) and not of MDPI and/or the editor(s). MDPI and/or the editor(s) disclaim responsibility for any injury to people or property resulting from any ideas, methods, instructions or products referred to in the content.