Article

Degradation of Aniline and Antimony in Printing and Dyeing Wastewater by Micro-Oxygenated Hydrolytic Acidification and Their Removal Effects on Chemical Oxygen Demand and Ammonia Nitrogen

1
Institute of Engineering Management, Hohai University, Nanjing 211100, China
2
Jiangsu Key Laboratory of Environmental Science and Technology, School of Environmental Science and Engineering, Suzhou University of Science and Technology, Suzhou 215009, China
*
Author to whom correspondence should be addressed.
Water 2024, 16(17), 2436; https://doi.org/10.3390/w16172436
Submission received: 29 July 2024 / Revised: 23 August 2024 / Accepted: 26 August 2024 / Published: 28 August 2024

Abstract

:
The degradation characteristics of aniline and antimony in printing and dyeing wastewater during the micro-oxygenated hydrolytic acidification process and its effect on COD and ammonia nitrogen removal were investigated in this experiment. Firstly, the effects of control factors such as pH, dissolved oxygen (DO), and sludge concentration on COD and ammonia nitrogen removal in the hydrolysis acidification section were optimized. It was recommended that the pH value should be maintained at 6.5; low DO (0–0.5 mg/L) could assist in the conversion of nitrogen for subsequent treatment; the optimum treatment temperature was 25 °C; finally, it was recommended that the sludge concentration should be controlled at 4 mg/L during the operation. Secondly, the effects of aniline and antimony on COD and nitrogen removal were investigated. It was found that when the concentration of aniline was increased from 0.4 mg/L to 5.4 mg/L, the COD concentration in the effluent increased by 96.5%, which indicated that aniline was toxic to anaerobic sludge and obviously inhibited the degradation of COD. When the concentration of antimony was increased from 0.05 mg/L to 2.05 mg/L, the COD removal rate was only 2.9%, which was much lower than that of the water samples with no antimony added. The anaerobic sludge concentration decreased from 5.58 g/L to 3.44 g/L, which indicated that aniline and antimony had a strong inhibitory effect on the activity of anaerobic bacteria and inversely affected COD removal.

1. Introduction

As a pillar industry in China, the textile printing and dyeing industry plays an important role in the development of the national economy [1,2]. Water pollution caused by synthetic dyes is an increasingly serious environmental concern due to its carcinogenic effects on human beings and aquatic organisms [3]. In addition, printing and dyeing wastewater with complex composition usually has a high pH, high turbidity, poor biodegradability, and high chroma [4,5]. Improper discharge of printing and dyeing wastewater may endanger the aquatic environment and human health. In China, the discharge standards for printing and dyeing wastewater from new enterprises are strictly controlled, requiring that the direct discharge limits for CODCr, BOD5, ammonia nitrogen, and total nitrogen shall not exceed 80 mg/L, 20 mg/L, 10 mg/L, and 15 mg/L, respectively (GB 4287-2012, China) [6]. Therefore, there is a need to treat printing and dyeing wastewater for its safe discharge, and to develop new technologies for the treatment of printing and dyeing wastewater in order to meet the stringent discharge standards and necessities [7,8,9].
The treatment technology for printing and dyeing wastewater has been constantly updated and advanced. Due to the continuous improvement of wastewater discharge standards and the requirement to reduce the impact upon and harm to the environment, technologies such as adsorption, membrane separation process, chemical oxidation, and biological treatment have been developed to effectively treat textile printing and dyeing wastewater [10]. Hydrolytic acidification (HA) is a cost-effective biological treatment method with unique advantages in enhancing the biodegradability of dyes; it is widely used in the treatment of chemical wastewater, printing and dyeing wastewater, and other difficult-to-degrade types of wastewater [11,12]. Liu et al. (2017) studied the performance of different stages in the hydrolysis acidification process in the treatment of azo dye and anthraquinone dye wastewater [13]. The decolorization rate, CODCr removal rate, BOD5/CODCr value, and the output of volatile fatty acids (VFAs) in the first stage were better than those in the second stage. Further molecular biological analysis showed that there were significant differences in the microbial community structure in the first and second stages. The dominant species in the first stage was related to the Bacteroides group, while the dominant species in the second stage was related to Bacteroides and Firmicutes. From the results, it can be inferred that different dyes have a significant impact on the existence and function of different microorganisms, which may provide information for the screening and domestication of bacteria in the actual printing and dyeing wastewater treatment process; Gu et al (2018) proposed a new integrated hydrolysis/acidification and multi-oxidation/aerobic process to remove color and nitrogen in azo dye wastewater [14]. System performance, the degradation pathways of azo dyes, and nitrogen metabolism pathways were studied through a quadrupole time-of-flight and metagenome analysis. The proposed process effectively removed color and nitrogen, with removal percentages of 89.4% and 54.0%, respectively. Controlling low dissolved oxygen concentration in multiple aerobic processes can enhance nitrogen removal; Jin et al (2019) designed a hydrolytic acidification flat plate ceramic membrane bioreactor (HA-CMBR) for the treatment of high-intensity dyeing wastewater [15]. The start-up phase of the reactor was completed in 29 days by using cultivated seed sludge. The COD removal rate was about 62%, the fluidized COD was 7800 mg/L, and the organic load rate was 7.80 kg COD/m3/d, while over 99% of the chroma was removed. The results showed that HA-CMBR has good removal performance in treating dyeing wastewater; Guo et al (2020) studied the effect of salinity on dye removal efficiency and analyzed soluble microbial products (SMPs), extracellular polymers (EPSs), and microbial communities under different salinities [11]. As the salinity increased, the removal rate of dye and COD in the HA reactor decreased. Under high salinity, SMPs and EPSs increased significantly, mainly because more polysaccharides were synthesized than proteins. In addition, sequencing analysis showed that high salinity changed the microbial community structure. This work will help to understand the impact of salinity on removal efficiency and microbial communities in the HA process.
Our literature review revealed that most of the existing research mainly focuses on the removal of COD and chroma from printing and dyeing wastewater. However, aniline and antimony are very commonly detected in printing and dyeing wastewater; therefore, clarification regarding the impact of aniline and antimony on the removal of COD and nitrogen in sewage treatment plants is necessary. In addition, some studies have reported that the micro-aeration in the hydrolysis acidification process can prevent the sludge from clogging the pipeline. From the point of view of comprehensive operating costs and effects, the use of a micro-oxygen hydrolysis acidification process is more economical than the fully enclosed hydrolysis acidification process, and it also has higher operational feasibility [14,16]. In this study, the effects of aniline and antimony on the removal of COD and NH3-N in relation to the changes in sludge concentration and permeability in a typical printing and dyeing wastewater treatment process were investigated by means of micro-oxygenated hydrolytic acidification. The optimum conditions for the micro-oxygenated hydrolysis acidification process were first explored, and then the inhibitory effects of aniline and antimony on sludge characteristics and the micro-oxygenated hydrolysis acidification process were investigated.

2. Material and Methods

2.1. Inoculation

The hydrolytic acidification sequencing batch reactor (SBR) was inoculated with anaerobic sludge from an industrial wastewater treatment plant, and the influent of the reactor came from the effluent of the air flotation tank. The water parameters from influent and effluent is shown in Table 1.
According to the literature, the acute and chronic biological standard values of antimony were deduced according to the distribution of species sensitivities, which were 511.7 μg/L and 148.3 μg/L, respectively, beyond which the nervous system of organisms would be severely damaged [19]. As for aniline, the discharge standard for water pollution in the textile dyeing and finishing industry (GB 4287-2012) [6] stipulates that the discharge limit for aniline in printing and dyeing wastewater is 1.0 mg/L.

2.2. Experimental Setup

This experiment used a cylindrical organic glass SBR with a height of 50 cm, an inner diameter of 15 cm, and an effective volume of 6 L. The experimental device is shown in Figure 1. The reactor ran 3 cycles per day, and the operation cycle was 8 h: water inlet for 10 min, stirring for 2 h, aeration for 5 h, precipitation for 30 min, water outlet for 10 min, and standing for 10 min. The temperature was controlled to room temperature, 25 ± 1 °C. The water inlet and outlet of the reactor, stirring, and aeration were all managed by a timer controlling the opening and closing of the peristaltic pump. The heating and stirring device was a digital constant temperature magnetic stirrer (HCJ-6D), and the aeration device was an air pump (SB-948) [20,21,22].

2.3. Experimental Method

Before the aniline and antimony inhibition test, the wastewater stored in the refrigerator was heated to 25 °C and stabilized for 10 min, and the pH of the water sample was adjusted to neutral with sodium hydroxide solution or hydrochloric acid solution. The DO concentration in the reaction process of the hydrolysis and acidification section was set at 0.5–1.0 mg/L. The test sludge–water ratio was 1:10, 400 mL of activated sludge was added to 4 L of printing and dyeing wastewater, and the sludge concentration in the system was 4 g/L after thorough mixing.
The background concentrations of aniline and antimony in the wastewater used in the experiment were 0.4 mg/L and 50 μg/L, respectively. The actual concentration of aniline and antimony was the sum of the dosing concentration and the background concentration. In the aniline experiment, 0 mg/L, 0.5 mg/L, 1.0 mg/L, 1.5 mg/L, 2.0 mg/L, 3.0 mg/L, 4.0 mg/L, and 5.0 mg/L of aniline (62-53-3, analytical grade, Runjie Chemical, Beijing Budweiser Technology Co., Ltd., Beijing, China) were added. The concentrations added in the antimony inhibition experiment were, respectively: 0 mg/L, 0.05 mg/L, 0.1 mg/L, 0.2 mg/L, 0.5 mg/L, 1.0 mg/L, 1.5 mg/L, and 2.0 mg/L of potassium pyroantimonate (analytical pure, Aladdin, converted to antimony concentration, with 1g of antimony in every 2.25 g of potassium pyroantimonate). A 40 mL water sample was taken from the middle part of the device at the reaction times of 0 h, 1 h, 2 h, 4 h, 6 h, and 8 h. 100 mL of the sludge sample was taken after 8 h of reaction in a pre-weighed beaker and placed into an oven at 105 °C for later weighing to obtain the sludge concentration.
The sludge penetration rate is a measure of how easily water, or other fluids, can pass through the sludge layer. The following methods were adopted in the study: Collect sludge samples from the treatment process. Ensure that the samples are representative of the overall sludge characteristics; the samples should be homogenized to avoid variations in the test results. Regularly measure the biomass concentration in the reactor, usually as mixed liquor suspended solids (MLSS) or volatile suspended solids (VSS). Use standardized methods of gravimetric analysis to determine the concentration of solids. The sludge growth rate (G) can be calculated using the following formula: G = ΔX/Δt, where: ΔX = change in biomass concentration (g/L); and Δt = time interval (days). Alternatively, the yield coefficient (Y) can be calculated, which relates the biomass produced to the substrate consumed: Y = ΔX/ΔS, where: ΔS = substrate removed (mg/L).

2.4. Analytical Method

The determinations of COD, NH3-N, nitrate nitrogen (NO3-N), and TP were conducted in accordance with Standard Methods (GB/T 11903-1989, HJ 535-2009, HJ/T 346-2007 and GB/T 11893-1989, China) [23,24,25,26]. DO and pH were measured with a portable DO rapid tester JPB-607A (Shanghai Lei Magnetic Experimental Equipment Co., Ltd., Shanghai, China), and aniline was measured by ethylenediamine coupling with a Uvmini-1285 (Shanghai Shimadzu Experimental Equipment Co., Ltd., Shanghai, China); aniline was diazotized with nitrite under acidic conditions (pH 1.5–2.0) and coupled with N-(1-naphthalenyl)ethylenediamine hydrochloride to produce a violet-red dye, which was determined spectrophotometrically and measured at a wavelength of 545 nm (GB 11889-89, China) [27]. Antimony was measured by inductively coupled plasma emission spectrometry (HJ 776-2015, China) [28] with an inductively coupled plasma emission spectrometer (ICPE-9000, Shanghai Shimadzu Experimental Equipment Co., Ltd.).
To study the kinetic effects of aniline and antimony on COD and NH3-N removal in the hydrolytic acidification of printing and dyeing wastewater process, a first-class classical kinetic model was used to simulate the variations in COD and NH3-N removal at different concentrations of aniline and antimony. The interaction of aniline with the sludge during hydrolytic acidification was expressed by the sludge permeability equation.
The first-order kinetic is shown in the following Equation (1) [29]:
C = C0·exp(−kt)
In the formula:
C0—initial concentration of pollutants, mg/L;
t—response time, h;
C—pollutant concentration corresponding to t reaction time, mg/L;
k—reaction rate constant of the first-order kinetic model, h−1.
The calculation formula of the sludge penetration rate is shown in Formula (2) [30]:
φ = C / C × 100 %
In the formula:
C —concentration of aniline in the effluent of the biochemical reaction;
C—influent aniline concentration of the biochemical reaction;
φ—penetration rate of aniline to activated sludge.

3. Results and Discussion

3.1. Factors Analysis of the Hydrolysis Acidification Process

In order to study the adaptability of printing and dyeing wastewater to the hydrolysis acidification process, analyses on influencing factors including dissolved oxygen, pH, temperature, and sludge concentration were conducted.

3.1.1. Dissolved Oxygen

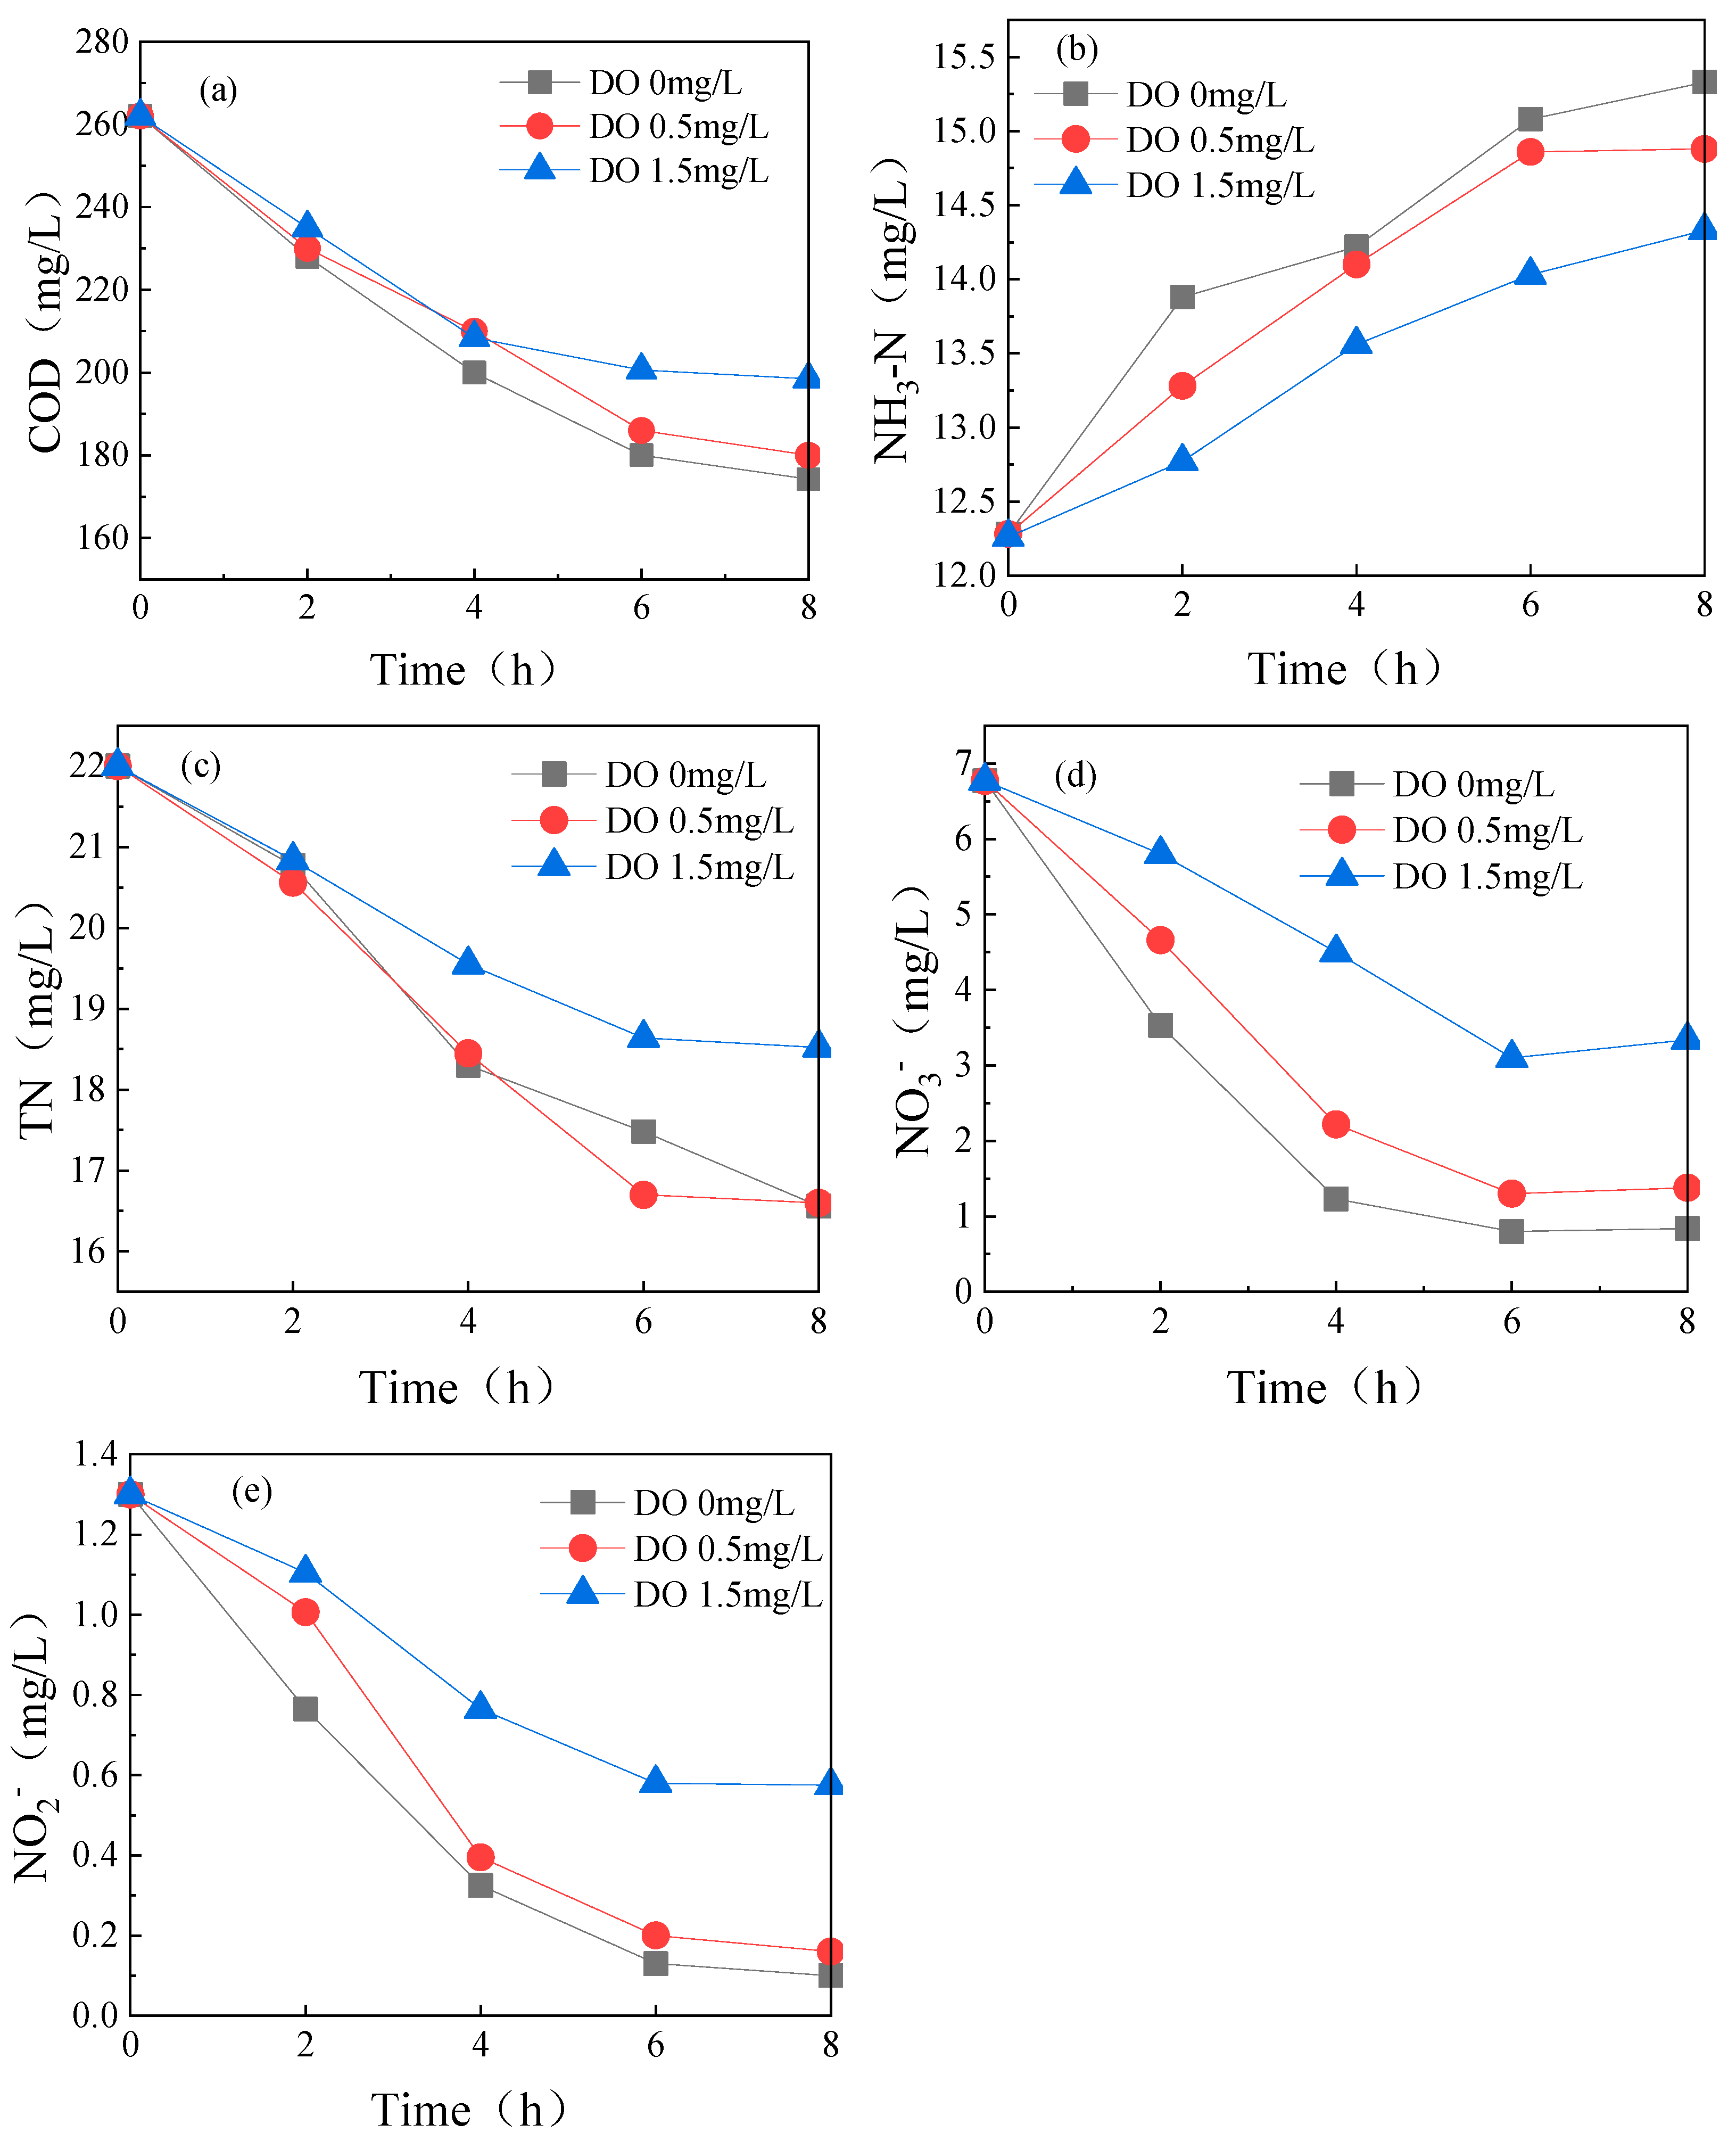
Hydrolysis is the rate-limiting step in conventional HA, but the micro-oxygen environment can accelerate the hydrolysis process during hydrolytic acidification and promote the biodegradation and conversion of difficult-to-degrade organic matter, thus increasing the biodegradability of wastewater [31]. In the experiment, dissolved oxygen (DO) was measured by three sets of concentrations of 0 mg/L, 0.5 mg/L, and 1.5 mg/L, representing anoxic, microaerobic, and aerobic conditions, respectively. Water samples were taken after 2 h, 4 h, 6 h, and 8 h for COD and nitrogen analysis during the course of the hydrolysis acidification process.
It can be seen from Figure 2 that DO influences COD and nitrogen removal. In Figure 2a, within 5 h of the reaction, when the DO concentration was 0 mg/L and 0.5 mg/L, the removal rate was 33.5% and 31.3%, respectively; when the DO concentration was 1.5 mg/L, the removal efficiency of COD was poor, and the removal rate was only 24.2%. From Figure 2b, it can be seen that the concentration of NH3-N increased as DO decreased: The increase rate of NH3-N was 24.8%, 21.2%, and 16.9% when DO was 0 mg/L, 0.5 mg/L, and 1.5 mg/L, respectively. The source of the NH3-N could be from a small amount of conversion of NO3-N and NO2-N to NH4; the ammoniating of organic nitrogen into NH3-N (protein is decomposed by ammoniating bacteria); and a certain amount of NH3-N release from the sludge. From Figure 2c, it can be seen that TN was removed to a certain degree after the reaction was completed, mainly because the removal of nitrate nitrogen from the wastewater leads to a reduction in TN. When the concentration of DO is greater than 1.0 mg/L, the activity of anaerobic bacteria will be suppressed to a certain extent, and the removal effect on TN will also be reduced. When the DO concentration was 0 mg/L, 0.5 mg/L, and 1.5 mg/L, the removal rate of TN was 24.7%, 24.5%, and 15.8%, respectively. The hydrolysis acidification reactors may have achieved some nitrogen removal efficiency through the hydrolysis and detoxification of macromolecular organic matter [32]. From Figure 2d, it can be seen that when the DO concentration was greater than 1 mg/L, the removal of NO3-N was inhibited, and the removal rate after 8 h was only 50.7%; while in anoxic and micro-oxygen conditions, the removal rates of NO3-N were 87.6% and 79.6%, respectively.
From Figure 2e, it can be seen that in anoxic and micro-oxygen conditions, NO2-N was almost completely removed, and the removal rate was as high as 90%. When the DO concentration was greater than 1 mg/L, there was a limited removal of NO2-N of 55.8%. To sum up, the removal effect of each index under a high-dissolved-oxygen environment is poor, which is not conducive to the growth of anaerobic sludge; in hydrolysis acidification, micro-oxygen is introduced as compared to an anoxic state, although the treatment effect of some indexes is poor (COD, nitrate nitrogen, etc.). However, it accelerates the conversion of TN, which greatly reduces the reaction time and increases the hydraulic loading capacity. Similar findings were found by An et al., who concluded that micro-oxygenation improves the biodegradability and treatability of organic pollutants during hydrolytic acidification and promotes the decomposition of nitrogen-containing organic matter [33].

3.1.2. pH Value

Relevant studies have shown that the pH of wastewater in the hydrolysis acidification process should be maintained within a certain range [34]. It is well known that hydrolysis acidification is divided into three stages. The first stage is the hydrolysis stage, where large particles are degraded into small particles. The second stage is the acidification stage, where acetic acid is produced under the action of bacteria, and the pH value will decrease in this stage. The third stage is the methane production stage, during which the pH value will rise.
In the experiment, the effects of different pH values on hydrolysis and acidification were studied. The pH values in the system were 5.5, 6.5, and 7.0 respectively, and 10% sodium hydroxide solution or hydrochloric acid solution was used to adjust the pH value of the wastewater. COD and ammonia nitrogen were used as indicators to study the influence of pH on the hydrolysis and acidification process.
From Figure 3a, it can be seen that pH has a significant effect on the hydrolysis and acidification process. Low pH inhibited the activity of anaerobic bacteria (denitrifying bacteria, etc.), and the removal of COD decreased. At different pH values, most of the reactions were completed within the first 4 h and stabilized after 8 h. At pH 5.5, the removal rate of COD in the first 4 h was 19.3%, and the removal rate of COD after 8 h was 29.8%; at pH 6.5, the removal rate of COD in the first 4 h was 35.9%, and the removal rate of COD after 8 h was 43.0%. At pH 7.0, the removal rate of COD in the first 4 h was 31.9%, and the removal rate of COD after 8 h was 38.1%. This is because a rise in pH inhibits the activity of acid-producing microorganisms, thus affecting the acidification phase [35].Therefore, with regard to COD removal at this stage, pH 6.5 was the best. In Figure 3b, it can be seen that as the pH rose from 5.5 to 7.0, ammonia nitrogen increased slightly. It is possible that the biodegradation process of proteins or other nitrogen-rich organic substrates is facilitated, leading to a slight increase in ammoniacal nitrogen content [36]. It should be noted that extra acid will be also produced later in the hydrolysis and acidification process; therefore, the slightly acidic environment of pH 5.5 is not beneficial to microorganism growth. Also, higher ammonia nitrogen would not be conducive for its subsequent removal. Therefore, pH 6.5 was also the best choice at this stage with regards to ammonia nitrogen concentration variation.

3.1.3. Temperature

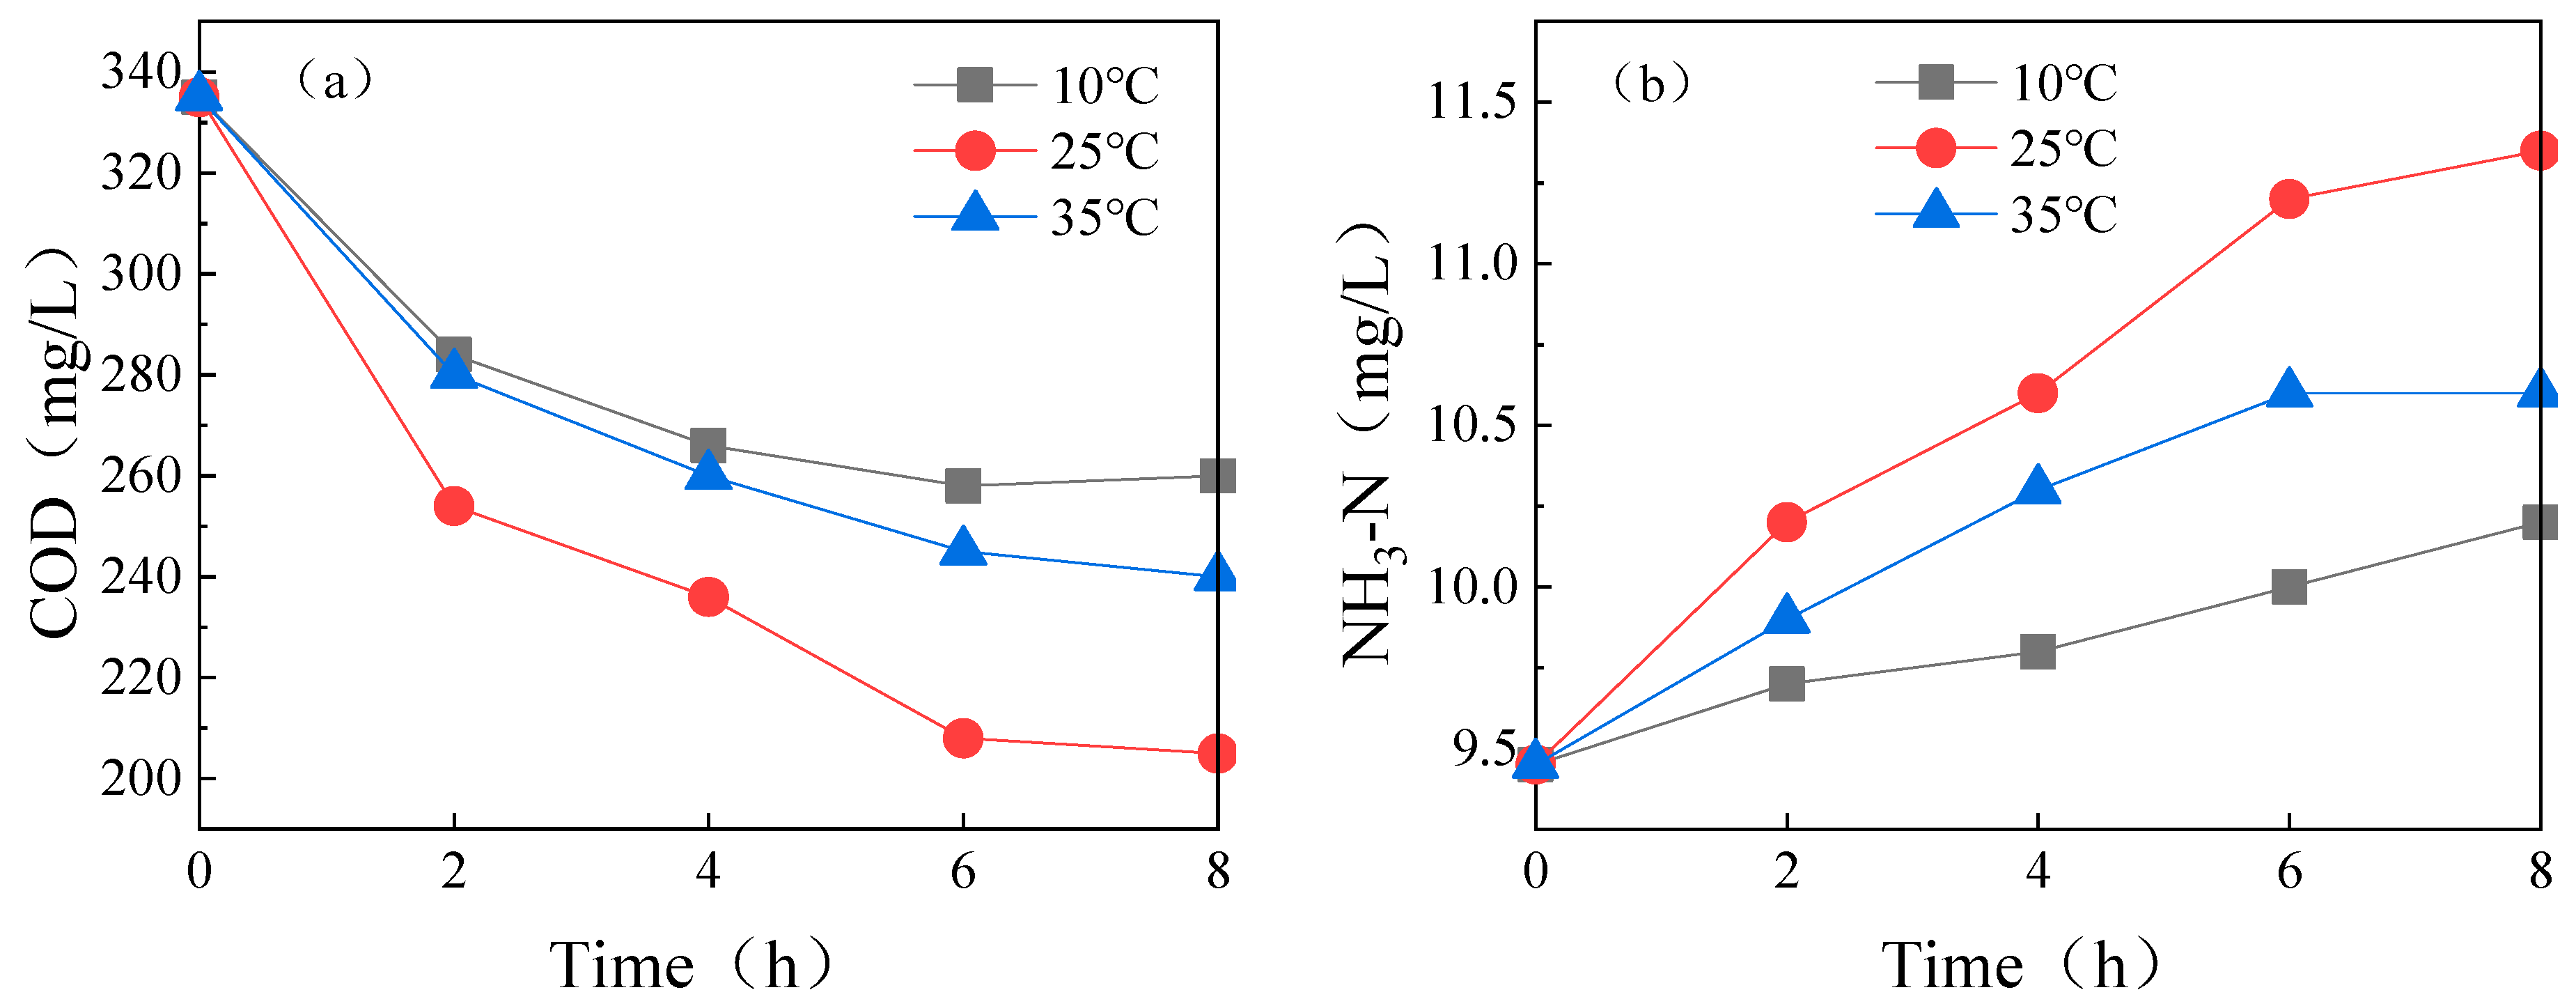
Temperature plays an important role in microbial interactions and the thermodynamic equilibrium of biochemical reactions, affecting the metabolic activities and abundance levels of hydrolyzing and acid-producing bacteria [37,38]. Temperature is also an important indicator affecting sludge microorganism activity during hydrolysis and acidification. In the experiment, 10 °C, 25 °C, and 35 °C were selected to represent four different seasons (winter, spring and autumn, and summer) in Suzhou City in a year. Results are shown in Figure 4.
It can be seen from Figure 4a that different temperatures have different effects on COD and ammonia nitrogen removal. The COD removal rate was the highest when the temperature was 25 °C, and COD was lowest at 10 °C. Temperature control at 10 °C represents a low temperature, and low temperature is conducive to the growth of filamentous bacteria, which will lead to sludge expansion phenomena, reducing the removal rate of COD [39]. After 8 h at 10 °C, the removal rate of COD was 22.4%; at 35 °C, the removal rate of COD was 28.4%; while at the most suitable temperature, 25 °C, the COD removal rate of the sludge was the highest, reaching 38.8%. It is worth noting that the sludge activity at low temperature (10 °C) was worse than that at higher temperature (35 °C). In the practical operations of a wastewater plant, more attention should be paid to the variations in the effluent index in winter. During hydrolysis, nitrogen-containing elements can leave the hydrolysis product system through microbial coagulation or conversion to gases [40]. As for the effect of temperature on ammonia nitrogen removal, from Figure 4b, taking 25 °C as a benchmark, it can be seen that an increase or decrease in temperature will inhibit the increase of ammonia nitrogen. After 8 h, 7.9% of the ammonia nitrogen increased at 10 °C; 20.1% of ammonia nitrogen increased at 25 °C; and 12.2% of ammonia nitrogen increased at 35 °C. This is because an increase in temperature during hydrolysis and acidification may increase the number of aerobic microorganisms, weakening nitrification and leading to an increase in ammonia and nitrogen levels [41].

3.1.4. Sludge Concentration

To study the effect of sludge concentration on the treatment effect of the hydrolysis and acidification process, the analysis indicators used were COD and ammonia nitrogen. The only variable in the reaction is the sludge concentration. The sludge concentrations tested were 2 g/L, 4 g/L, and 6 g/L, respectively. A water sample was taken after 2 h, 4 h, 6 h, and 8 h.
It can be seen from Figure 5a that the sludge concentration has a significant impact on COD and NH3-N removal in the hydrolysis and acidification section. The COD removal rate was 26.3%, 38.7%, and 41.3% when the sludge concentration in the reaction system was 2 g/L, 4 g/L and 6 g/L, respectively. The higher the sludge concentration, the higher the COD removal rate; Figure 5b shows that when the sludge concentration in the reaction system was 2 g/L, 4 g/L, and 6 g/L, the effluent increase rate of NH3-N was 18.0%, 52.8%, 66.7%, respectively. An elevated sludge concentration promotes an increase in NH3-N content during the acidification phase, as more proteins are biodegraded in the sludge [42]. When the sludge concentration is 2 g/L, the removal of COD and the increase of NH3-N are lessened; when the sludge concentration is 6 g/L, the COD removal rate increases a bit with too fast of an increase in NH3-N. Therefore, it is recommended to control the sludge concentration at about 4 g/L during operation [43,44].

3.2. Effect of Aniline and Antimony on the Removal of COD and NH3-N

3.2.1. Effect of Aniline on COD Removal

To evaluate the toxic effect of aniline on micro-oxygen hydrolysis and acidification, the inhibitory effect of different concentrations of aniline on the removal of COD was investigated [45,46].
From Figure 6a, it can be seen that when the influent water contains only the background concentration of aniline (0.4 mg/L), the COD removal efficiency was the highest: The COD was reduced from 385 mg/L to 264 mg/L within 4 h, and the removal rate was 31.4%. After the reaction continued for 8 h, the COD concentration was further reduced to 240 mg/L, and the removal rate was 37.7%. The effluent COD increased with the continuous addition of aniline, and the anaerobic sludge was inhibited. The higher the concentration of the influent aniline, the more obvious the inhibition effect. When 5 mg/L aniline was added, the effluent COD concentration increased to 756.6 mg/L after 8 h of aeration reaction, increasing by 96.5% in total. The presence of residual organic metabolites in the solution during the anaerobic process leads to an increase in the organic content after hydrolytic acidification, which results in a relatively high effluent COD value [47,48]. The above results indicated that aniline is toxic to anaerobic sludge and significantly inhibited the degradation of COD by the anaerobic sludge.
The rate constant k obtained by first-order reaction kinetics fitting is shown in Figure 6b. It can be seen that the reaction rate constant k decreases as the aniline concentration increases. When the aniline concentration in the influent was 0.4 mg/L, the COD degradation rate was 0.06 h−1; when the aniline concentration increased to 5.4 mg/L, the COD degradation rate dropped significantly to −0.08 h−1. The rate constant switched from positive to negative when aniline concentration changed from 2.4 mg/L to 3.4 mg/L, and the effluent COD increased accordingly, indicating that aniline is toxic to activated sludge and inhibits COD removal, so the concentration of aniline in the hydrolysis and acidification section should be controlled.

3.2.2. Effect of Antimony on COD Removal

The inhibitory effect of antimony on micro-oxygen hydrolysis and acidification and the removal of COD was investigated. In the experiment, the background concentration (initial concentration) of influent antimony was 0.05 mg/L. Samples were taken at 2 h, 4 h, 6 h, and 8 h. Similarly, the first-order kinetic equation was used to fit the COD curve with time to study the relationship between the COD degradation rate and the influent antimony concentration.
It can be seen from Figure 7a that when the antimony concentration was 0.05 mg/L (no external antimony was added), the COD value decreased from 320 mg/L to 215 mg/L within 4 h, and the removal rate was 32.8%; moreover, after 8 h the COD concentration was further reduced to 200 mg/L with a removal rate of 37.5%. With the addition of antimony, the removal of COD was inhibited, and the higher the concentration of antimony in the influent water, the more significant the inhibition of COD removal. When 2 mg/L of antimony was added, the COD removal rate was only 2.9% after 8 h of aeration, which was much lower than that of the water without antimony added.
The rate constant k obtained by first-order reaction kinetics fitting is shown in Figure 7b. It can be seen that the reaction rate k decreases as the concentration of antimony increases. When the antimony concentration in the feed water was 0.05 mg/L, the COD degradation rate was 0.06 h−1; however, when the antimony concentration increased to 2.05 mg/L, the COD degradation rate dropped significantly to 0.004 h−1, and the reaction rate was close to zero. This shows that antimony inhibits the micro-oxygen hydrolysis and acidification process and inhibits the removal of COD. The higher the antimony concentration, the more obvious the inhibitory effect.

3.2.3. Effect of Aniline on NH3-N Removal

The inhibitory effect of aniline on micro-aerobic hydrolysis and acidification and the removal of NH3-N in wastewater were investigated. Results are shown in Figure 8. It can be seen that when the influent water contained only the background concentration of aniline (0.4 mg/L), the increase of NH3-N was greater. The NH3-N concentration rose from 9.72 mg/L to 11.34 mg/L within 4 h, with a rate of 16.7%. After the reaction continued for 8 h, the NH3-N concentration further increased to 12.45 mg/L, with a growth rate of 28.1%. With the addition of aniline, the increase of NH3-N was inhibited, and the higher the concentration of influent aniline, the more significant the inhibition. In the case of adding 5 mg/L of aniline, after 8 h of reaction the NH3-N concentration in the effluent was 10.26 mg/L, an increase of only 5.6%, which is much lower than that of water without aniline.
The first-order reaction kinetic equation was used to fit the curve of the ammonia nitrogen concentration with time, and the ammonia nitrogen growth rate constant under different influent aniline concentration conditions was obtained, as shown in Figure 8b. When the influent aniline concentration was 0.4 mg/L, the degradation rate constant of the ammonia nitrogen was −0.031 h−1, indicating that the concentration of ammonia nitrogen was increasing. When the concentration of influent aniline was 5.4 mg/L, the degradation rate constant of the ammonia nitrogen was only −0.01 h−1; the reaction almost stopped, indicating that aniline has a strong inhibitory effect on the activity of anaerobic bacteria.

3.2.4. Effect of Antimony on NH3-N Removal

The effect of antimony on the inhibition of micro-oxygen hydrolysis and acidification and the removal of NH3-N in wastewater was studied to evaluate the toxicity of antimony. Results showed that NH3-N increased to a certain extent during the micro-aerobic hydrolysis and acidification process, and the increase of NH3-N concentration was mainly in the first 4 h. When the antimony concentration in the micro-oxygen hydrolysis and acidification system was 0.05 mg/L, the NH3-N concentration increased from 10.5 mg/L to 12.8 mg/L at 4 h with a growth rate of 21.9%; after 8 h, the NH3-N concentration further increased to 13.6 mg/L, with an increase rate of 29.5%. When 2 mg/L of antimony was added, after 8 h of reaction, the NH3-N concentration in the effluent was 10.7 mg/L, with an increase rate of only 1.9%.
The rate constant k obtained by first-order reaction kinetics fitting was shown in Figure 9b. It can be seen that the reaction rate k decreases with the increase of the antimony concentration. When the antimony concentration in the influent was 0.05 mg/L, the increase rate of NH3-N was 0.03 h−1. When the antimony concentration increased to 2.05 mg/L, the increase rate of NH3-N dropped sharply to 0.002 h−1, indicating that the concentration of antimony is negatively related to the reaction rate, and antimony inhibits the micro-oxygen hydrolysis and acidification process.

3.3. Effect of Aniline and Antimony on Sludge Penetration

By studying the penetration rate of aniline in the hydrolyzed and acidified sludge, the effect of micro-aerobic hydrolysis and acidification on the removal of aniline can be judged.
Figure 10a showed that the sludge in the hydrolysis acidification section has a certain removal effect on aniline. When the influent aniline was 0.4 mg/L, the effluent aniline concentration was 0.61 mg/L, and the penetration rate of aniline to activated sludge was 153.0%. As the concentration of influent aniline increases, the penetration of aniline in the activated sludge gradually decreases. When the concentration of aniline exceeds 2.4 mg/L, the penetration rate of aniline in the activated sludge stabilizes at around 120%. Figure 10b shows that the removal rate of antimony by anaerobic sludge was low.
When the antimony concentration in the aerobic section was 0.05 mg/L, the antimony concentration in the effluent was 0.042 mg/L. The penetration rate of the sludge was 84.0%. As the concentration of antimony in the influent increases, the penetration rate of antimony in the anaerobic sludge gradually increases, which means that it is difficult to remove antimony at this stage. When the antimony concentration was 2.05 mg/L, the penetration rate of antimony in the anaerobic sludge was 97.4%.

3.4. Effect of Aniline and Antimony on Sludge Concentration Change

The change in the concentration of the sludge in the reaction is an important parameter to reflect the treatment’s performance. By studying the sludge concentration change before and after micro-aerobic hydrolysis and acidification, the toxic effect on the sludge can be characterized.
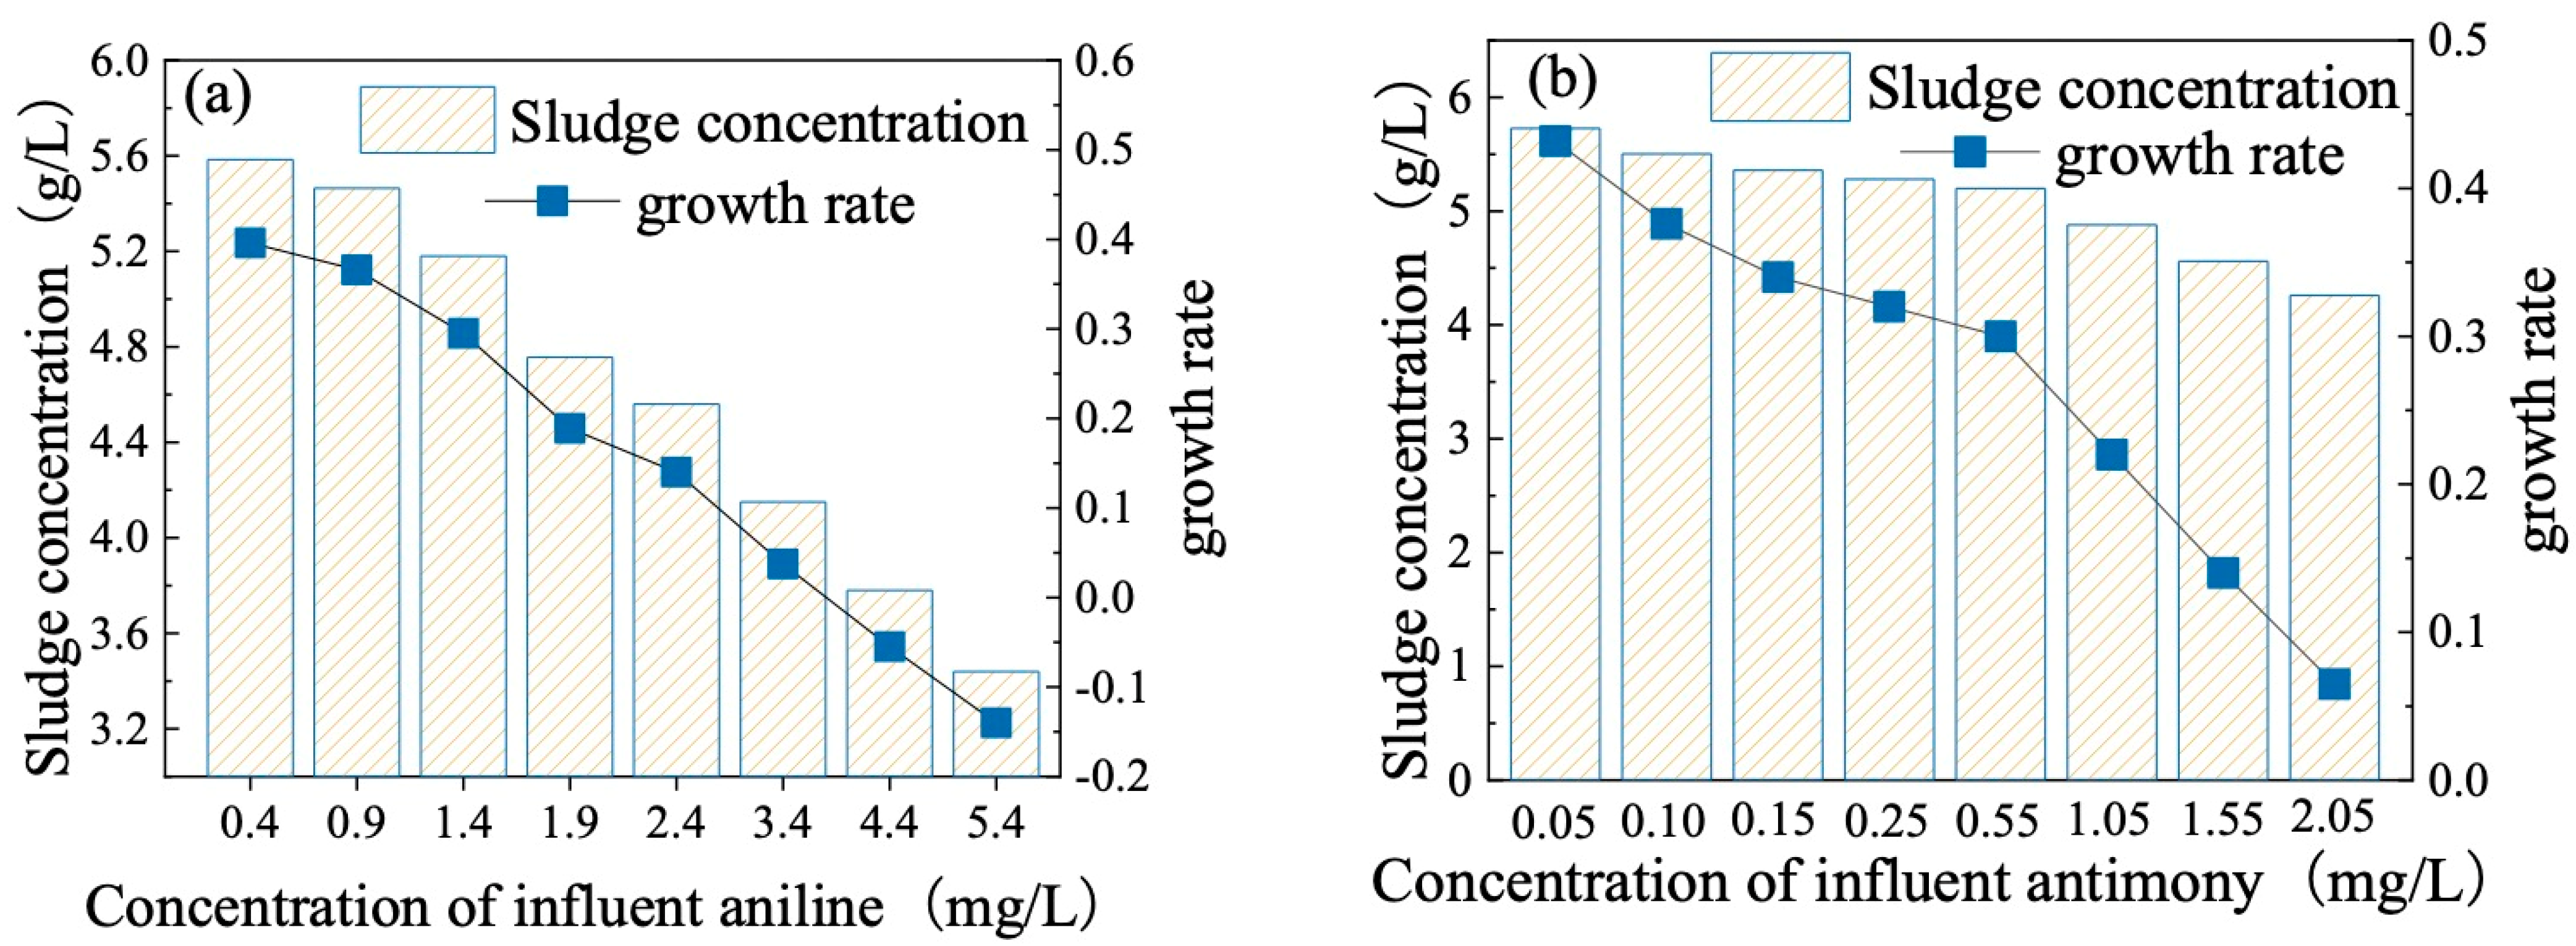
It can be seen from Figure 11a that the remaining amount of anaerobic sludge was significantly related to the influent aniline concentration. The greater the aniline concentration, the slower the increase in the residual sludge concentration and the worse the treatment effect. When the aniline concentration changed from 0.4 mg/L to 5.4 mg/L, the concentration of anaerobic sludge decreased from 5.58 g/L to 3.44 g/L, and the sludge’s growth rate dropped from 39.6% to −14.0%. A growth rate below 0 indicates that the growth of the anaerobic sludge in the micro-aerobic hydrolysis and acidification section was greatly inhibited.
From Figure 11b, it can be seen that the residual anaerobic sludge was also significantly related to the influent antimony concentration. A similar trend was found that resembled the relationship between aniline concentration and the residual sludge concentration: The greater the antimony concentration, the slower the increase in the residual sludge concentration. When the antimony concentration changed from 0.05 mg/L to 2.05 mg/L, the concentration of the sludge decreased from 5.73 g/L to 4.26 g/L, and the growth rate dropped from 43.2% to 6.5%. The high concentration of antimony also inhibited the anaerobic sludge. In addition, when the concentration of antimony in the influent was 2.05 mg/L, the concentration of the sludge after the reaction was still above 4 g/L, indicating that although the removal rate of antimony by anaerobic sludge was very low, the sludge did not cause a large number of microorganism deaths; the antimony may just have inhibiting effects on the sludge [49]. It should be also noted that antimony can form many poorly soluble substances instead of presenting as ions in solution. Antimony may be reduced to antimony (III) under anaerobic conditions in the presence of reducing agents (aniline and other organic compounds). As a result, only some of the introduced antimony is in solution, while the rest is in an insoluble state [50]. In this case, the actual concentration of antimony in solution is lower than the stated concentration, meaning that even lower concentrations of antimony than those stated in this study could bring about inhibiting effects on COD and ammonium removal and sludge penetration.

4. Conclusions

This study investigated the degradation of aniline and antimony through a micro-oxygenated hydrolysis and acidification process, and its effect on the removal of COD and ammonia nitrogen from printing and dyeing wastewater. It also studied the effects of aniline and antimony on the changes in sludge concentration and permeability. It is suggested that pH, temperature, dissolved oxygen, and sludge concentration should be controlled during micro-oxygenic hydrolysis and acidification. In addition, an increase in aniline or antimony concentration inhibits microbial activity in anaerobic sludge, which further affects the removal of COD from wastewater. In conclusion, the results of this study fundamentally demonstrated the negative effects of high concentrations of aniline and antimony on COD and ammonia removal in dyeing wastewater treatment, and the recommended values of aniline and antimony can be used as guideline values for the practical treatment of dyeing wastewater.

Author Contributions

Conceptualization and writing: K.Z.; Validation and formal analysis: S.Y.; Investigation: H.L. All authors have read and agreed to the published version of the manuscript.

Funding

The authors appreciate for funding sources by the National Natural Science Foundation of China (51708381).

Data Availability Statement

Data is available upon request.

Conflicts of Interest

The authors declare no conflict of interest.

References

  1. Li, F.; Huang, J.; Xia, Q.; Lou, M.; Yang, B.; Tian, Q.; Liu, Y. Direct contact membrane distillation for the treatment of industrial dyeing wastewater and characteristic pollutants. Sep. Purif. Technol. 2018, 195, 83–91. [Google Scholar] [CrossRef]
  2. Li, F.; Xia, Q.; Gao, Y.; Cheng, Q.; Ding, L.; Yang, B.; Tian, Q.; Ma, C.; Sand, W.; Liu, Y.J.E.S.W.R.; et al. Anaerobic biodegradation and decolorization of a refractory acid dye by a forward osmosis membrane bioreactor. Water Res. Technol. 2018, 4, 272–280. [Google Scholar] [CrossRef]
  3. Uddin, M.J.; Ampiaw, R.E.; Lee, W. Adsorptive removal of dyes from wastewater using a metal-organic framework: A review. Chemosphere 2021, 284, 131314. [Google Scholar] [CrossRef] [PubMed]
  4. Wang, J.; Zhang, T.; Mei, Y.; Pan, B. Treatment of reverse-osmosis concentrate of printing and dyeing wastewater by electro-oxidation process with controlled oxidation-reduction potential (ORP). Chemosphere 2018, 201, 621–626. [Google Scholar] [CrossRef]
  5. Xu, H.; Yang, B.; Liu, Y.; Li, F.; Shen, C.; Ma, C.; Tian, Q.; Song, X.; Sand, W. Recent advances in anaerobic biological processes for textile printing and dyeing wastewater treatment: A mini-review. World J. Microbiol. Biotechnol. 2018, 34, 165. [Google Scholar] [CrossRef]
  6. GB 4287-2012; Discharge Standards of Water Pollutants for Dyeing and Finishing of Textile Industry [including MODIFICATION 1]. Standardization Administration of China (SAC): Beijing, China, 2012. Available online: https://www.chinesestandard.net/PDF.aspx/GB4287-2012 (accessed on 28 July 2024).
  7. Chen, Q.; Yao, Y.; Zhao, Z.; Zhou, J.; Chen, Z. Long term catalytic activity of pyrite in Heterogeneous Fenton-like oxidation for the tertiary treatment of dyeing wastewater. J. Environ. Chem. Eng. 2021, 9, 105730. [Google Scholar] [CrossRef]
  8. Wu, J.; Li, Q.; Li, W.; Li, Y.; Wang, G.; Li, A.; Li, H. Efficient removal of acid dyes using permanent magnetic resin and its preliminary investigation for advanced treatment of dyeing effluents. J. Clean. Prod. 2020, 251, 119694. [Google Scholar] [CrossRef]
  9. Yao, H.-Y.; Guo, H.; Shen, F.; Li, T.; Show, D.-Y.; Ling, M.; Yan, Y.-G.; Show, K.-Y.; Lee, D.-J. Anaerobic-aerobic treatment of high-strength and recalcitrant textile dyeing effluents. Bioresour. Technol. 2023, 379, 129060. [Google Scholar] [CrossRef] [PubMed]
  10. Ewuzie, U.; Saliu, O.D.; Dulta, K.; Ogunniyi, S.; Bajeh, A.O.; Iwuozor, K.O.; Ighalo, J.O. A review on treatment technologies for printing and dyeing wastewater (PDW). J. Water Process Eng. 2022, 50, 103273. [Google Scholar] [CrossRef]
  11. Guo, G.; Tian, F.; Zhang, L.; Ding, K.; Yang, F.; Hu, Z.; Liu, C.; Sun, Y.; Wang, S. Effect of salinity on removal performance in hydrolysis acidification reactors treating textile wastewater. Bioresour. Technol. 2020, 313, 123652. [Google Scholar] [CrossRef]
  12. Xie, X.; Qin, Y.; Yang, S.; Sun, Y.; Mo, H.; Zheng, H.; Liu, N.; Zhang, Q. Effect of Enhanced Hydrolytic Acidification Process on the Treatment of Azo Dye Wastewater. Molecules 2023, 28, 3930. [Google Scholar] [CrossRef]
  13. Liu, N.; Xie, X.; Yang, B.; Zhang, Q.; Yu, C.; Zheng, X.; Xu, L.; Li, R.; Liu, J. Performance and microbial community structures of hydrolysis acidification process treating azo and anthraquinone dyes in different stages. Environ. Sci. Pollut. Res. 2017, 24, 252–263. [Google Scholar] [CrossRef] [PubMed]
  14. Gu, M.; Yin, Q.; Wang, Z.; He, K.; Wu, G. Color and nitrogen removal from synthetic dye wastewater in an integrated mesophilic hydrolysis/acidification and multiple anoxic/aerobic process. Chemosphere 2018, 212, 881–889. [Google Scholar] [CrossRef] [PubMed]
  15. Jin, Y.; Wang, D.; Zhang, W. Newly Designed Hydrolysis Acidification Flat-Sheet Ceramic Membrane Bioreactor for Treating High-Strength Dyeing Wastewater. Int. J. Environ. Res. Public Health 2019, 16, 777. [Google Scholar] [CrossRef] [PubMed]
  16. Fan, Y.; Chen, X.; Yao, Z.; Li, H.; Wang, D.; Tian, M.; Xu, Z.; Wan, J. A novel inhibition mechanism of aniline on nitrification: Aniline degradation competes dissolved oxygen with nitrification. Sci. Total Environ. 2021, 770, 145205. [Google Scholar] [CrossRef]
  17. DB32/T 3410-2018; Interface Specification of Data Catalog Service for Food Safety Electronic Traceability. Jiangsu Provincial Market Supervision and Administration: Nanjin, China, 2018. Available online: https://www.codeofchina.com/standard/DB32T3410-2018.html (accessed on 28 July 2024).
  18. DB32/T 3761.20-2020; Technical Specifications of Novel Coronavirus Pneumonia Prevention and Control. Part 20: Medical Waste Disposal Institution. Jiangsu Provincial Market Supervision and Administration: Nanjin, China, 2020. Available online: https://www.codeofchina.com/standard/DB32T3761.20-2020.html (accessed on 28 July 2024).
  19. Tao, Y.; Su, H.; Li, H.; Zhu, Y.; Shi, D.; Wu, F.; Sun, F. Ecological and human health risk assessment of antimony (Sb) in surface and drinking water in China. J. Clean. Prod. 2021, 14, 128514. [Google Scholar] [CrossRef]
  20. Bai, J.; Xu, H.; Zhang, Y.; Peng, Z.; Xu, G. Combined industrial and domestic wastewater treatment by periodic allocating water hybrid hydrolysis acidification reactor followed by SBR. Biochem. Eng. J. 2013, 70, 115–119. [Google Scholar] [CrossRef]
  21. Soliman, M.; Eldyasti, A. Development of partial nitrification as a first step of nitrite shunt process in a Sequential Batch Reactor (SBR) using Ammonium Oxidizing Bacteria (AOB) controlled by mixing regime. Bioresour. Technol. 2016, 221, 85–95. [Google Scholar] [CrossRef] [PubMed]
  22. Yong, Z.J.; Bashir, M.J.K.; Ng, C.A.; Sethupathi, S.; Lim, J.-W. A sequential treatment of intermediate tropical landfill leachate using a sequencing batch reactor (SBR) and coagulation. J. Environ. Manag. 2018, 205, 244–252. [Google Scholar] [CrossRef]
  23. GB/T 11903-1989; Water Quality. Determination of Colority. Administration of China (SAC): Beijing, China, 1989. Available online: https://www.chinesestandard.net/PDF/English.aspx/GBT11903-1989 (accessed on 28 July 2024).
  24. HJ 535-2009; Water Quality. Determination of Ammonia Nitrogen. Nesslerreagent Spectrophotometry. Administration of China (SAC): Beijing, China, 2009. Available online: https://www.chinesestandard.net/PDF.aspx/HJ535-2009 (accessed on 28 July 2024).
  25. HJ/T 346-2007; Water Quality. Determination of Nitrate-Nitrogen. Ultraviolet Spectrophotometry. Standardization Administration of China (SAC): Beijing, China, 2007. Available online: https://www.chinesestandard.net/PDF/English.aspx/HJT346-2007 (accessed on 28 July 2024).
  26. GB/T 11893-1989; Water Quality. Determination of Total Phosphorus. Ammonium Molybdate Spectrophotometric Method. Administration of China (SAC): Beijing, China, 1989. Available online: https://www.chinesestandard.net/PDF/English.aspx/GBT11893-1989#:~:text=This%20standard%20specifies%20the%20potassium,the%20determination%20of%20total%20phosphorus (accessed on 28 July 2024).
  27. GB 11889-89; Water Quality—Determination of Amiline Compounds—Spectrophotometric Method with N-(1-naphthyl)ethylenediamine. Standardization Administration of China (SAC): Beijing, China, 1990. Available online: https://www.mee.gov.cn/image20010518/3758.pdf (accessed on 28 July 2024).
  28. HJ 776-2015; Water Quality—Determination of 32 Elements-Inductively Coupled Plasma Optical Emission Spectrometry. Administration of China (SAC): Beijing, China, 2015. Available online: https://www.chinesestandard.net/PDF/English.aspx/HJ776-2015 (accessed on 28 July 2024).
  29. Huang, C.; Xiang, Z.; Huang, J.; Liu, G.; Yu, X.; Liu, W.; Cao, H. Efficient adsorptive removal of Sb(III) and Sb(V) from printing and dyeing wastewater by TiCl4. Chem. Eng. J. 2024, 493, 152858. [Google Scholar] [CrossRef]
  30. Feng, G.; Bai, T.; Ma, H.; Hu, Z.; Guo, Y.; Tan, W. Establishment of the Permeability Model for Soft Solid Sludge Conditioned with Flocculants. ACS Omega 2019, 4, 18574–18581. [Google Scholar] [CrossRef] [PubMed]
  31. Zhang, Z.; Yu, Y.; Xi, H.; Zhou, Y. Review of micro-aeration hydrolysis acidification for the pretreatment of toxic and refractory organic wastewater. J. Clean. Prod. 2021, 317, 128343. [Google Scholar] [CrossRef]
  32. Zhang, B.; Deng, J.; Xie, J.; Wu, H.; Wei, C.; Li, Z.; Qiu, G.; Wei, C.; Zhu, S. Microbial community composition and function prediction involved in the hydrolytic bioreactor of coking wastewater treatment process. Arch. Microbiol. 2022, 204, 426. [Google Scholar] [CrossRef]
  33. An, Y.; Wang, M.; Zhou, Z.; Sun, X.; Cheng, C.; Zhu, S.; Wang, L.; Wu, Z. Enhancing biodegradability of industrial park wastewater by packing carriers and limited aeration in the hydrolysis process. J. Clean. Prod. 2020, 264, 121638. [Google Scholar] [CrossRef]
  34. Ma, H.; Chen, X.; Liu, H.; Liu, H.; Fu, B. Improved volatile fatty acids anaerobic production from waste activated sludge by pH regulation: Alkaline or neutral pH? Waste Manag. 2016, 48, 397–403. [Google Scholar] [CrossRef]
  35. Zhan, W.; Li, L.; Tian, Y.; Lei, Y.; Zuo, W.; Zhang, J.; Jin, Y.; Xie, A.; Zhang, X.; Wang, P.; et al. Insight into the roles of ferric chloride on short-chain fatty acids production in anaerobic fermentation of waste activated sludge: Performance and mechanism. Chem. Eng. J. 2021, 420, 129809. [Google Scholar] [CrossRef]
  36. Wang, Y.; Zang, B.; Gong, X.; Liu, Y.; Li, G. Effects of pH buffering agents on the anaerobic hydrolysis acidification stage of kitchen waste. Waste Manag. 2017, 68, 603–609. [Google Scholar] [CrossRef] [PubMed]
  37. Fan, X.; Shi, S.; Lin, H.; Xia, Y.; He, X.; Zhou, J. The performance and microbial response of zero valent iron alleviating the thermal-alkaline stress and enhancing hydrolysis-acidification of primary sludge. J. Environ. Manag. 2023, 347, 119134. [Google Scholar] [CrossRef]
  38. Lin, Q.; De Vrieze, J.; Li, C.; Li, J.; Li, J.; Yao, M.; Hedenec, P.; Li, H.; Li, T.; Rui, J.; et al. Temperature regulates deterministic processes and the succession of microbial interactions in anaerobic digestion process. Water Res. 2017, 123, 134–143. [Google Scholar] [CrossRef]
  39. Liu, X.; Yang, H.; Fang, X.; Bai, Y.; Su, B.; Huang, H. Comparative study on the performance of hydrolytic acidification immobilized filler and sludge in the pretreatment of municipal wastewater. Environ. Technol. Innov. 2021, 24, 101885. [Google Scholar] [CrossRef]
  40. Luo, X.; Liu, Y.; Muhmood, A.; Zhang, Q.; Wang, J.; Ruan, R.; Wang, Y.; Cui, X. Effect of time and temperature of pretreatment and anaerobic co-digestion of rice straw and swine wastewater by domesticated paddy soil microbes. J. Environ. Manag. 2022, 323, 116218. [Google Scholar] [CrossRef] [PubMed]
  41. Wang, J.; Cao, L.; Liu, Y.; Zhang, Q.; Ruan, R.; Luo, X. Effect of acclimatized paddy soil microorganisms using swine wastewater on degradation of rice straw. Bioresour. Technol. 2021, 332, 125039. [Google Scholar] [CrossRef] [PubMed]
  42. Li, G.; Zhang, P.; Wang, Y.; Sheng, Y.; Lv, X.; Yin, J. Enhancing biological denitrification with adding sludge liquor of hydrolytic acidification pretreated by high-pressure homogenization. Int. Biodeterior. Biodegrad. 2016, 113, 222–227. [Google Scholar] [CrossRef]
  43. Shengquan, Y.; Hui, W.; Chaohua, Z.; Xiaoming, Q. Study of the hydrolytic acidification-SBR process in aquatic products processing wastewater treatment. Desalination 2008, 222, 318–322. [Google Scholar] [CrossRef]
  44. Song, G.; Yu, Y.; Liu, T.; Xi, H.; Zhou, Y. Performance of microaeration hydrolytic acidification process in the pretreatment of 2-butenal manufacture wastewater. J. Hazard. Mater. 2019, 369, 465–473. [Google Scholar] [CrossRef] [PubMed]
  45. Cheng, C.; Geng, J.; Hu, H.; Shi, Y.; Gao, R.; Wang, X.; Ren, H. In-situ sludge reduction performance and mechanism in an anoxic/aerobic process coupled with alternating aerobic/anaerobic side-stream reactor. Sci. Total Environ. 2021, 777, 145856. [Google Scholar] [CrossRef]
  46. Xie, X.; Liu, N.; Yang, B.; Yu, C.; Zhang, Q.; Zheng, X.; Xu, L.; Li, R.; Liu, J. Comparison of microbial community in hydrolysis acidification reactor depending on different structure dyes by Illumina MiSeq sequencing. Int. Biodeterior. Biodegrad. 2016, 111, 14–21. [Google Scholar] [CrossRef]
  47. Arora, P.K. Bacterial degradation of monocyclic aromatic amines. Front. Microbiol. 2015, 6, 820. [Google Scholar] [CrossRef]
  48. Xie, X.; Spiteller, D.; Huhn, T.; Schink, B.; Müller, N. Desulfatiglans anilini Initiates Degradation of Aniline With the Production of Phenylphosphoamidate and 4-Aminobenzoate as Intermediates Through Synthases and Carboxylases From Different Gene Clusters. Front. Microbiol. 2020, 11, 2064. [Google Scholar] [CrossRef]
  49. Hargreaves, A.J.; Vale, P.; Whelan, J.; Constantino, C.; Dotro, G.; Cartmell, E. Mercury and antimony in wastewater: Fate and treatment. Water Air Soil Pollut. 2016, 227, 89. [Google Scholar] [CrossRef]
  50. Filella, M.; Belzile, N.; Chen, Y.W. Antimony in the Environment: A Review Focused on Natural Waters. Part 2. Relevant Solution Chemistry. ChemInform 2003, 34, 23. [Google Scholar] [CrossRef]
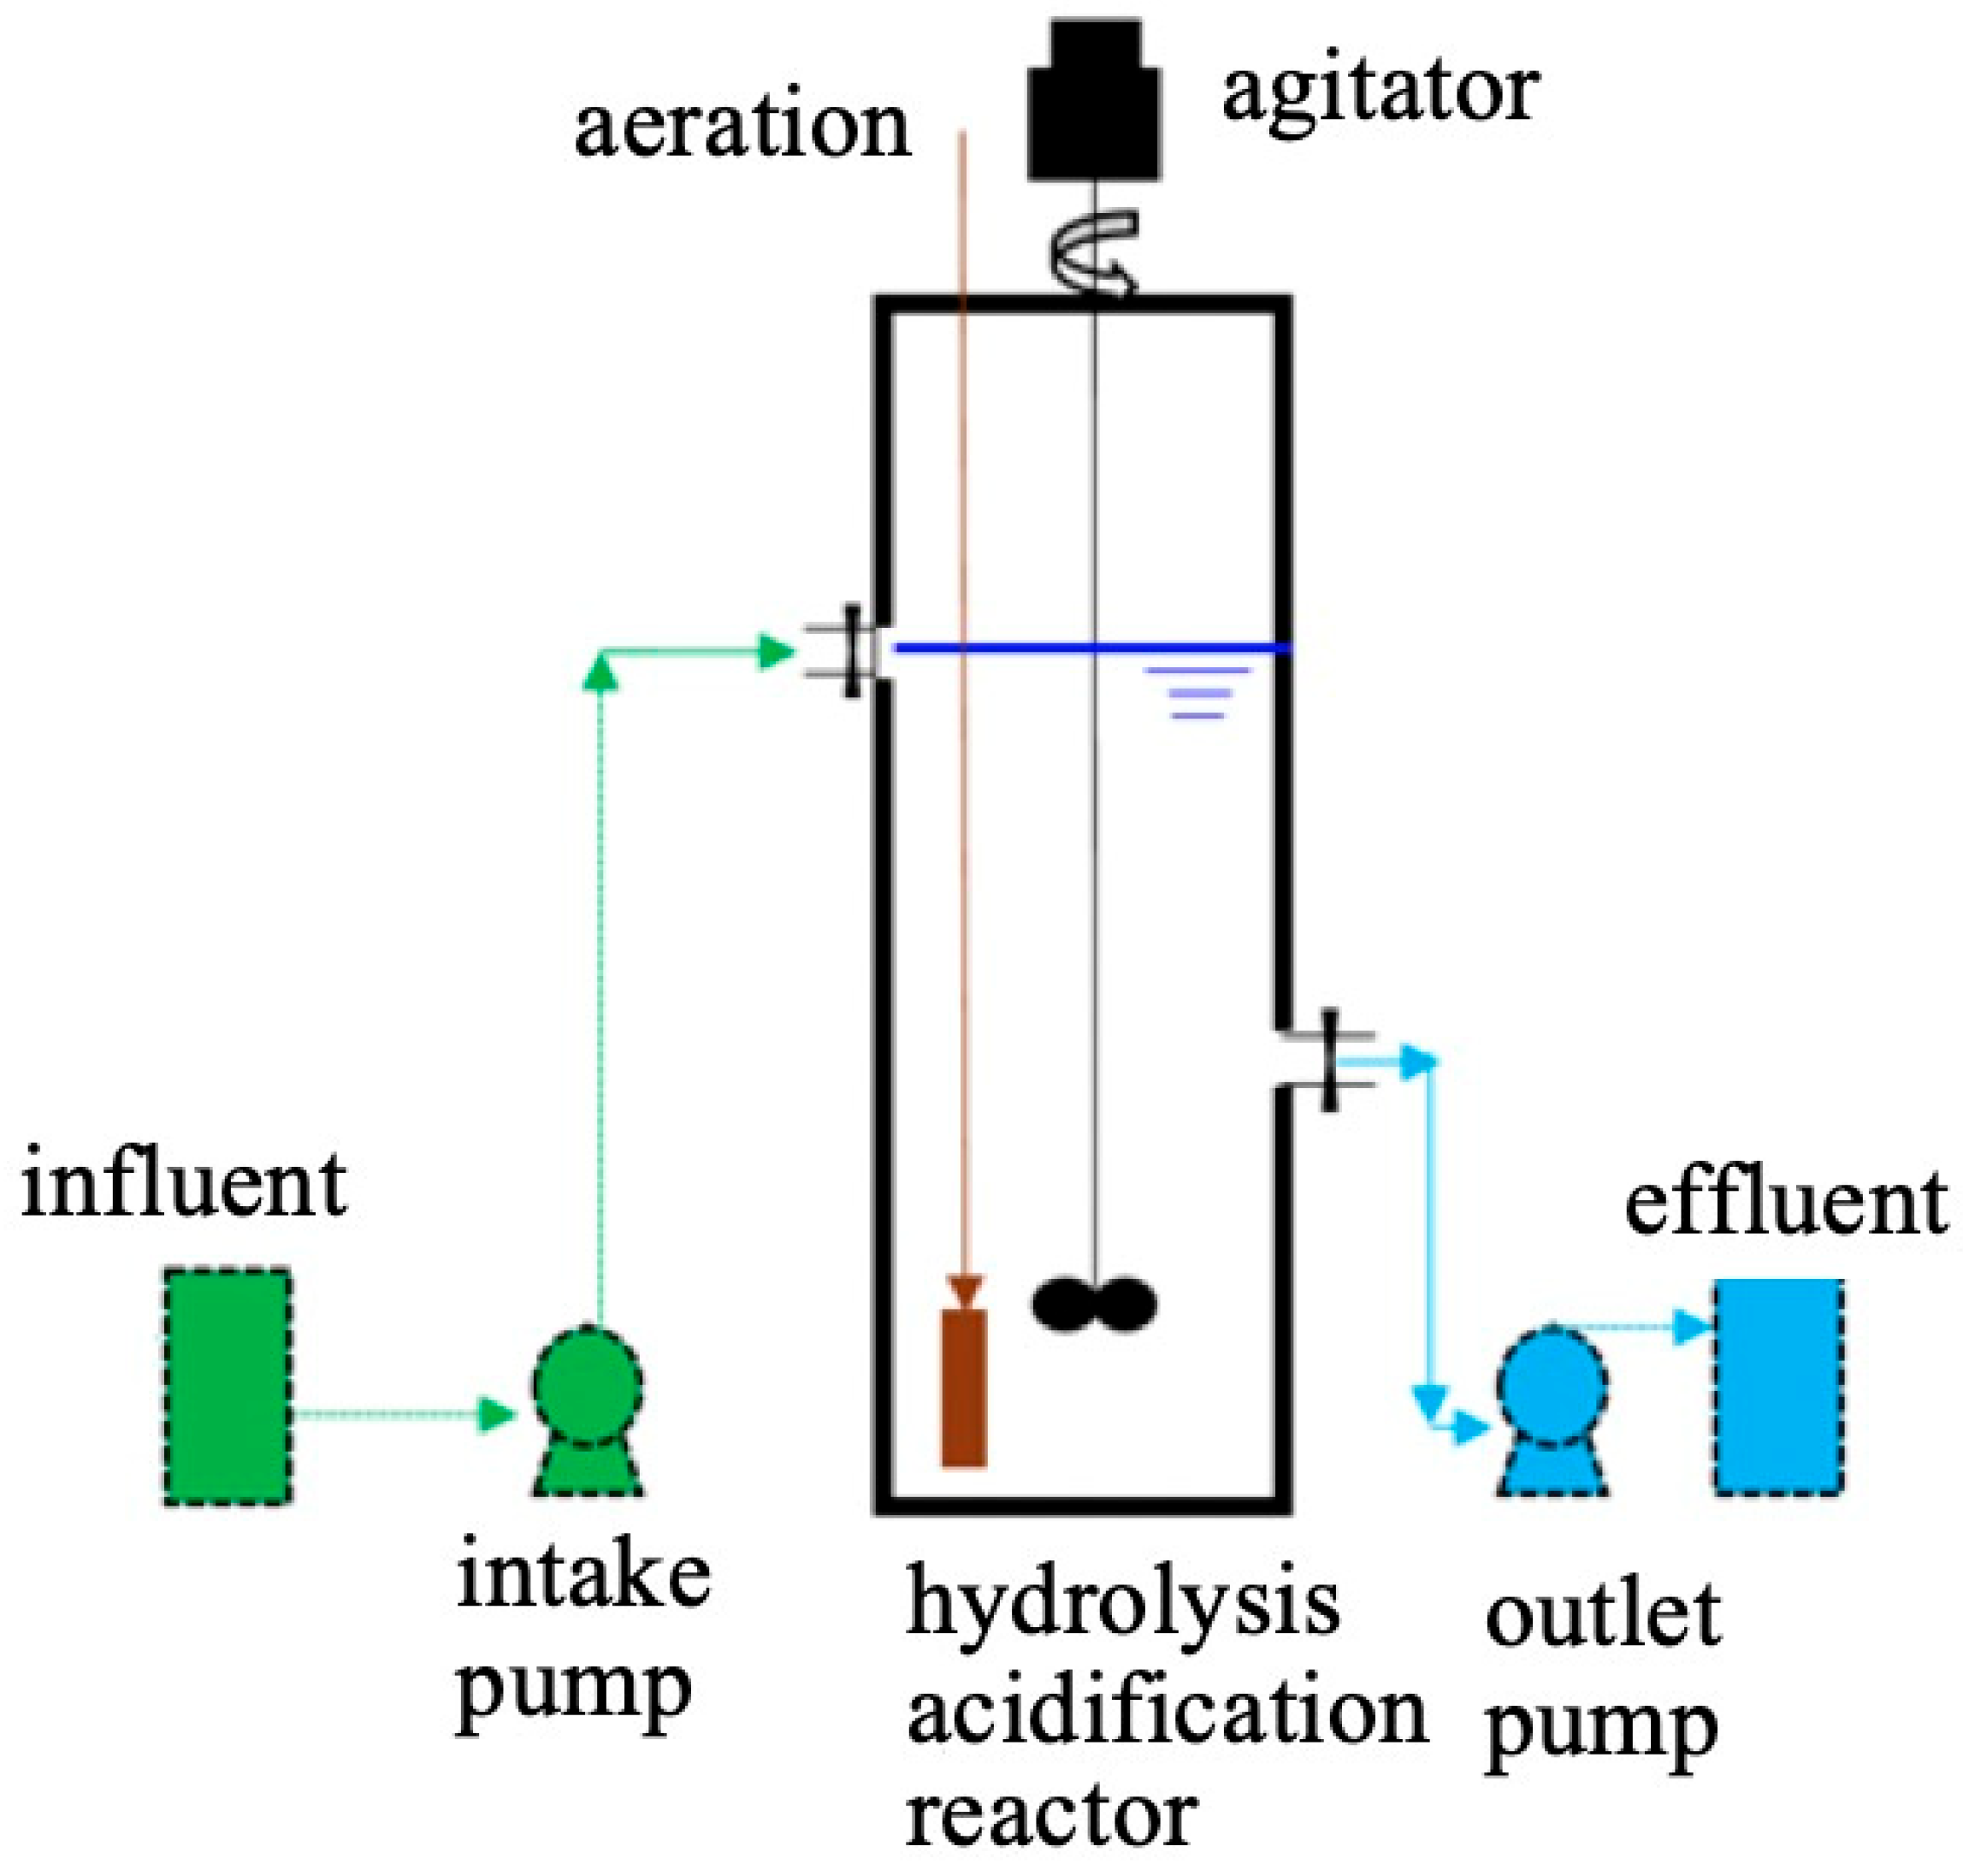
Figure 1. Schematic diagram of experimental setup.
Water 16 02436 g001
Figure 2. The influence of dissolved oxygen on hydrolysis acidification: (a) Chemical oxygen demand (COD); (b) ammonia nitrogen (NH3-N); (c) total nitrogen (TN); (d) nitrate nitrogen (NO3-N); (e) nitrite nitrogen (NO2-N).
Water 16 02436 g002
Figure 3. The influence of different pH values on the hydrolysis and acidification process: (a) COD; (b) ammonia nitrogen (NH3-N).
Water 16 02436 g003
Figure 4. Influence of different temperatures on the removal of COD and ammonia nitrogen: (a) COD; (b) ammonia nitrogen.
Water 16 02436 g004
Figure 5. Influence of different sludge concentrations on the hydrolysis acidification process: (a) COD; (b) ammonia nitrogen (NH3-N).
Water 16 02436 g005
Figure 6. The inhibitory characteristics of aniline on the removal of COD by micro-aerobic hydrolysis and acidification: (a) COD variations under different influent aniline concentrations; (b) COD degradation rate constant under different influent aniline concentrations.
Water 16 02436 g006
Figure 7. Antimony’s inhibitory characteristics for the removal of chemical oxygen demand (COD) by micro-oxygen hydrolysis and acidification: (a) COD with time under different influent antimony concentrations; (b) COD degradation rate constant under different influent antimony concentrations.
Water 16 02436 g007
Figure 8. The inhibitory characteristics of aniline on micro-oxygen hydrolysis and acidification to remove ammonia nitrogen (NH3-N): (a) NH3-N curve with time under different aniline concentrations; (b) NH3-N degradation rate constant under different aniline concentrations.
Water 16 02436 g008
Figure 9. Antimony’s inhibitory characteristics for ammonia nitrogen (NH3-N) removal in anaerobic sludge: (a) NH3-N with time under different influent antimony concentrations; (b) NH3-N degradation under rate constants at different influent antimony concentrations.
Water 16 02436 g009
Figure 10. (a) The concentration of aniline in the effluent of micro-aerobic hydrolysis and acidification and the penetration rate of aniline in anaerobic sludge; (b) The concentration of antimony in the effluent in micro-aerobic hydrolysis and acidification and the penetration rate of antimony in the anaerobic sludge.
Water 16 02436 g010
Figure 11. (a) Concentration and growth rate of anaerobic sludge after micro-aerobic hydrolysis and acidification reaction (b) Concentration and growth rate of anaerobic sludge after micro-aerobic hydrolysis and acidification reaction.
Water 16 02436 g011
Table 1. Inlet and Outlet Water Index (Unit: mg/L except for Chroma and Toxicity).
IndexInfluentDischarge
CODCr (mg/L)180–400100 (50 *)
NH3-N (mg/L)7–1812 (5 *)
Chroma450–70070
Aniline (mg/L)0.4–1.21.0
Antimony (μg/L)50–15050 (20 *)
TN (mg/L)12–2520
Nitrate (mg/L)3–8/
Nitrite Nitrogen (mg/L)0.2–0.6/
Note(s): * “Urban Wastewater Level B Discharge Standard” or “Taihu Lake Region Urban Sewage Treatment Plants and Key Industrial Industries Major Water Pollutant Discharge Limits” (DB32T-2018) [17] and engineering demonstration standards (2020) [18].
Disclaimer/Publisher’s Note: The statements, opinions and data contained in all publications are solely those of the individual author(s) and contributor(s) and not of MDPI and/or the editor(s). MDPI and/or the editor(s) disclaim responsibility for any injury to people or property resulting from any ideas, methods, instructions or products referred to in the content.