1. Introduction
Fractures, as a ubiquitous structural feature within geological formations, are prevalent in a variety of rock and soil types. The morphology, distribution, and surface characteristics of these fractures are pivotal in determining the behavior of fluid flow within the rock matrix, which in turn influences the stability of related geological structures and the efficient exploitation of natural resources. Accurately characterizing the flow dynamics of fluids within fractures is particularly critical for addressing hydrogeological and environmental geological issues, such as the development of oil and gas fields [
1], the prevention of tunnel water inrush [
2], geothermal exploitation [
3], and the management of groundwater contamination [
4].
The size and distribution of fracture aperture widths reflect the interaction between the roughness of the fracture surfaces and their degree of matching [
5]. Over the years, researchers have acknowledged the critical impact of the intricate microgeometry of fractures on seepage. It has been demonstrated that the rough surfaces of a fracture often do not align perfectly; instead, they tend to match beyond a critical scale while operating independently beneath it [
6,
7]. This non-matching behavior results in uneven fracture apertures, which significantly influence fluid flow within these fractures [
8,
9].
Recent studies have delved deeper into the complexities of fracture apertures and their variability. For instance, Huang et al. [
10] highlighted how contact area, aperture variation, and fracture connectivity affect fluid flow in three-dimensional fracture networks, influencing flow tortuosity and channelization. Gao et al. [
11] emphasized that aperture variability is crucial for predicting flow behavior in fractured geothermal reservoirs. Furthermore, Hyman et al. [
12] demonstrated that variations in micro-scale fracture apertures can significantly alter the macro-scale flow properties within fracture networks. They introduced the concept of scale-bridging, showing how local changes in aperture fields can drastically increase flow channelization across an entire network. Additionally, Kun et al. [
13] explored the influence of anisotropic aperture fields on immiscible fluid displacement in rough fractures, finding that anisotropy plays a crucial role in controlling transitions between capillary fingering and viscous fingering during displacement processes.
In related work, Lenci et al. [
14] used Monte Carlo simulations to examine shear-thinning flow in geological fractures, revealing that non-Newtonian behavior enhances flow localization and increases fracture transmissivity, especially under high-pressure gradients. Their findings underscore the importance of incorporating fluid rheology with fracture heterogeneity in flow predictions. In a complementary study, Lenci et al. [
15] developed a lubrication-based solver for shear-thinning fluids in rough fractures, enabling efficient simulations and providing key insights into fluid behavior in complex fracture geometries, emphasizing the need to integrate rheology in subsurface flow analysis.
Other studies have further examined the role of fracture characteristics on permeability. Rong et al. [
16] found that the nonlinear coefficient is highly sensitive to shear deformation in faulting joints. Méheust et al. [
17] attributed fluid flow heterogeneity to the geometric heterogeneity of fractures. Ren et al. [
18] have explored the impact of rough fracture distribution and the anisotropy of fracture morphology on permeability characteristics through numerical simulations, finding that the size and distribution of fractures significantly influence the anisotropy of permeability in rough fractures. As computing technology advances and materials science evolves, Ranjbar et al. [
19] have utilized 3D printed models to investigate how variations in mismatched lengths and surface roughness impact flow dynamics. Their findings indicate that these parameters significantly modify flow velocity and influence the development of confined flow paths. Dong et al. [
20] employed CT scanning and numerical simulation techniques to investigate the variations in fluid flow behavior resulting from fracture misalignments and cavity erosion. Expanding on this foundation, Wang et al. [
21] investigated the impact of fracture displacements ranging from 0 to 10 mm on seepage behavior. They discovered that increasing misalignment distances lead to more complex flow behaviors and enhanced permeability. Luo et al. [
22] employed high-resolution 3D scanning to investigate the direct correlation between the initial roughness of coal fracture surfaces and the fluid flow capacity under various stress conditions, highlighting the critical importance of precise fracture characterization. Shi et al. [
23] conducted a numerical analysis on the radial seepage patterns in fractured media, emphasizing that under certain conditions, seepage deviates from Darcy’s Law, highlighting the complexity introduced by fracture characteristics.
The roughness of fracture surfaces [
24], the spatial distribution of fracture apertures [
25], and the connectivity within the region all impact the dynamic behavior of fluids within fractures. These studies indicate that the relative positional state of the two walls of a fracture is a key factor affecting fluid flow. The size and distribution of the fracture apertures reflect the interaction between the surface roughness of the fractures and their degree of matching. Additionally, Wibowo et al. [
26] have noted that the composition of the rock and the origins of its fractures dictate the roughness of the fracture surfaces, their matching levels, and their geometric relationships. Studies have additionally discovered that within certain scale ranges, natural rock fractures generally display matching features. However, it is under the influences of geological stress, structural formations, and erosive processes that the upper and lower surfaces of rough fractures exhibit pronounced mismatching characteristics. These surface traits are closely associated with the fractures’ geometric forms [
27]. This also highlights the widespread presence of matching and non-matching differences in rough fractures across various types and scales of rock bodies, and there are significant differences in their macroscopic seepage capabilities under the same hydraulic conditions [
28]. Numerous experimental studies have explained the significant role of activities such as shearing, creep, and closure on the fracture surfaces in influencing fluid flow within fractures [
29,
30].
The irregularities on fracture surfaces enhance the contact area and friction during fluid flow, causing the flow paths to become more tortuous and the streamlines to lengthen. These factors exacerbate the inertial losses in the fluids within rough fractures, a phenomenon that is particularly pronounced under high flow velocity conditions [
31]. The findings indicate that the pressure gradient-to-flow rate relationship in fractures displays distinct quadratic non-linear characteristics, with the slope of the curve escalating as the flow rate increases. This is primarily attributed to the fact that as flow velocity increases, the growth rate of the fluid’s inertial forces surpasses that of the viscous forces [
32]. Furthermore, the mismatching features of fracture surfaces can also significantly enhance the nonlinear characteristics of fluid flow within fractures, further confirming the profound impact of surface characteristics on flow behavior [
33].
Previous studies have directly or indirectly shown the impact of mismatched features between upper and lower fracture surfaces on seepage, but most are based on experiments and have certain limitations. Specifically, experimental approaches often face challenges when dealing with complex geometric shapes and inconvenient boundary conditions. These limitations can result in difficulties in accurately capturing the fine changes in fluid dynamics, such as detailed streamlines, precise flow field distribution, and the formation of vortices. For instance, many experimental setups cannot replicate the exact roughness and mismatch conditions of natural fractures, leading to potential discrepancies between observed and actual fluid behaviors. Additionally, previous research has largely focused on qualitative descriptions and understanding of mismatched characteristics, with significant gaps remaining in quantitative characterization and comprehensive analysis. This qualitative focus has limited the ability to predict fracture flow behavior under varying conditions, especially in complex scenarios involving heterogeneous media and anisotropic properties. For example, studies by Méheust et al. [
11] and Ren et al. [
12] highlighted the heterogeneity and anisotropy effects on permeability but did not provide detailed quantitative models to predict these effects under different stress conditions or geometric configurations.
Our study addresses these limitations by employing advanced numerical simulations that allow for precise control over geometric and boundary conditions, enabling detailed investigation of fluid dynamics in mismatched fractures. By using high-resolution mesh generation and performing grid dependency analyses, we ensure the accuracy and reliability of our simulations. Furthermore, we introduce a novel approach to quantify the extent of fracture mismatches and their impact on flow behavior, integrating local velocity fields and tortuosity calculations to provide a comprehensive understanding of the fluid flow mechanisms. This approach not only offers a more detailed quantitative analysis but also enhances the predictive capability for managing complex fluid dynamics problems in groundwater resources and environmental engineering projects.
By addressing these gaps, our study provides a more complete and accurate representation of fluid flow in rough mismatched fractures, offering valuable insights for theoretical advancements and practical applications in geological and environmental sciences.
2. Numerical Model and Methods
2.1. Rough Fracture Upper Surface
Considering the challenges associated with accurately measuring and controlling the geometric morphology of three-dimensional rough fracture surfaces derived from split rocks, Ogilvie et al. [
27] have applied fractal theory to develop an open-source software called Synfrac. The software allows users to precisely control the roughness of the generated three-dimensional single fractures by adjusting the fractal dimension D. This method not only enhances the accuracy of fracture simulations but also provides an effective tool for studying fracture fluid dynamics, enabling researchers to make progress in controlling and reproducing complex fracture structures.
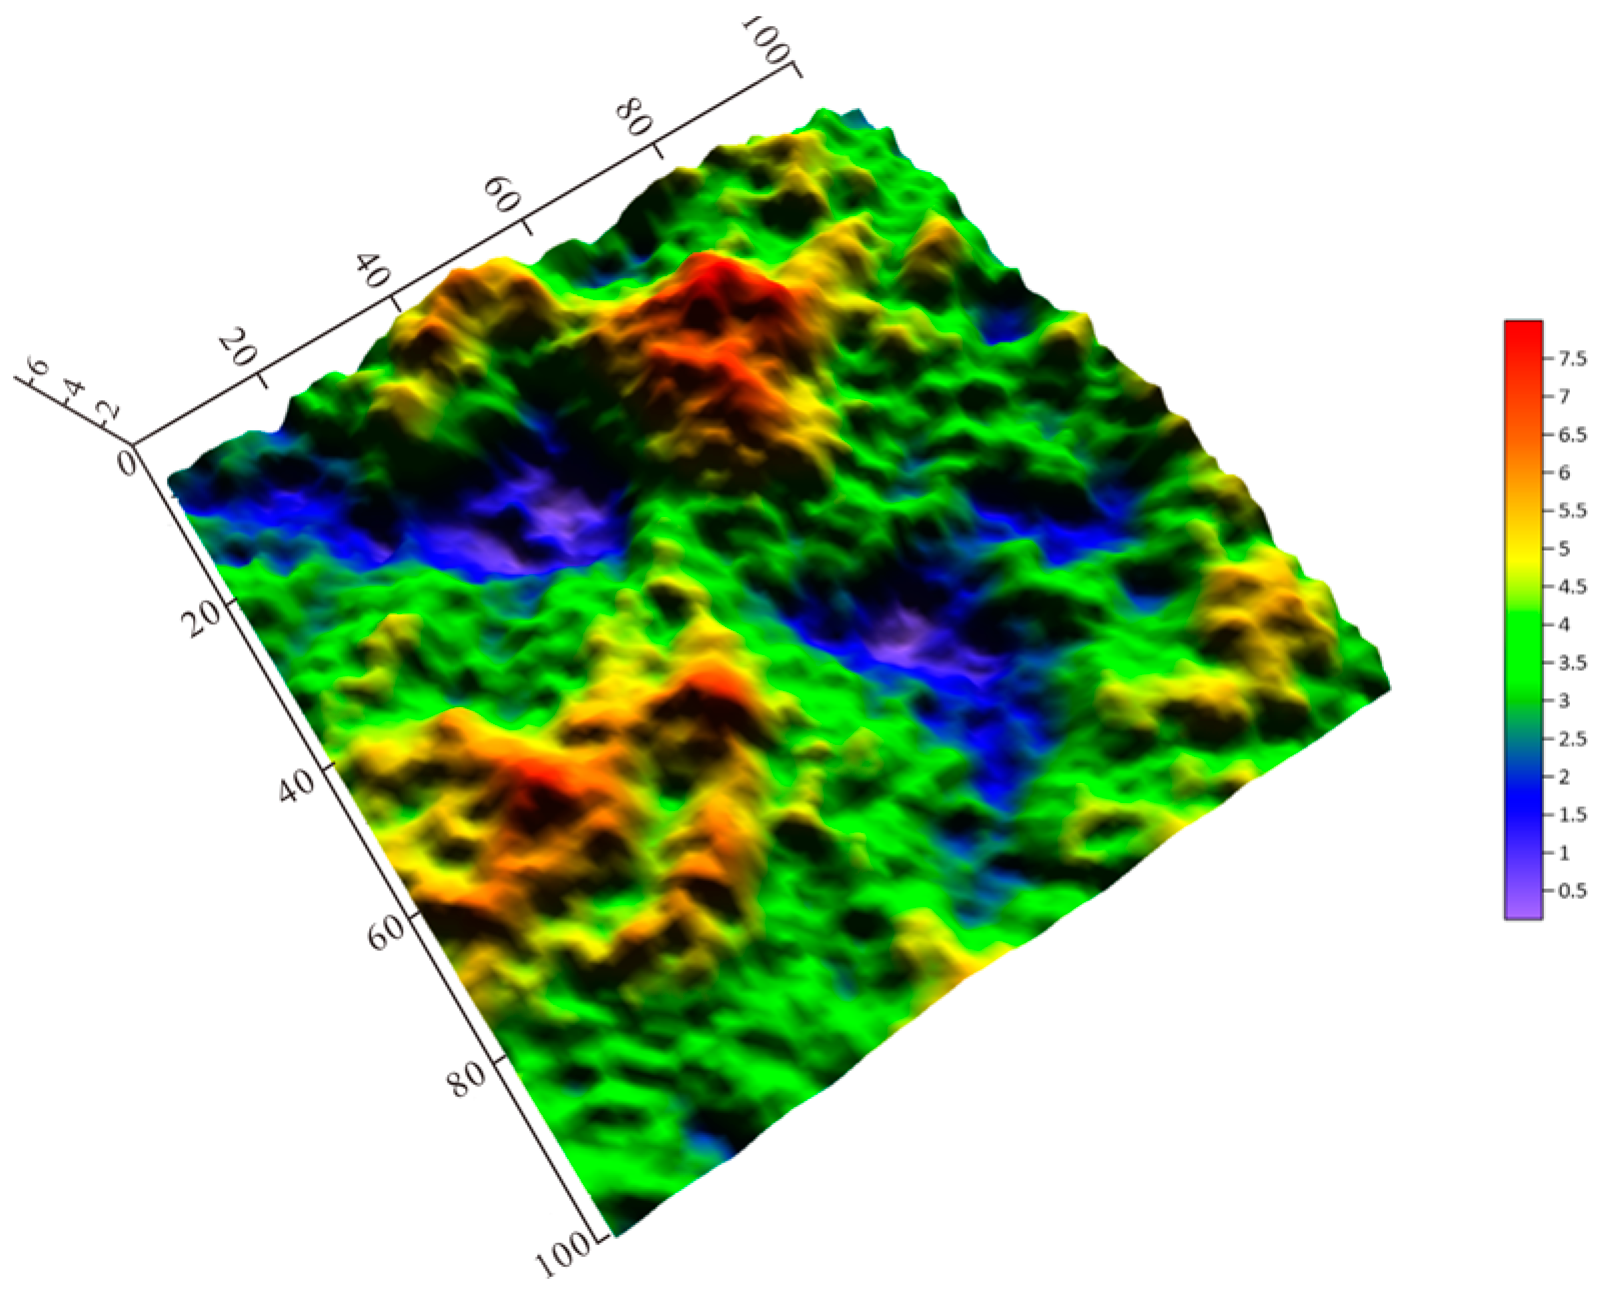
The three-dimensional point cloud data generated by the Synfrac program is processed through interpolation and then imported into the COMSOL Multiphysics 6.1 coupling analysis software. The software’s built-in parametric surface function is used to construct the rough upper surface of the fracture [
34]. To investigate the impact of fracture non-matching on seepage characteristics, an upper fracture surface with a fractal dimension D of 2.2 and a Joint Roughness Coefficient (JRC) of 19.26 was created. The fracture surface measures 100 mm by 100 mm and is isotropic, as depicted in
Figure 1.
2.2. Rough Fracture Lower Surface
Random noise can realistically simulate the non-ideal contact and surface irregularities between fracture faces, thereby improving the prediction of fluid flow characteristics between fractures. In fracture analysis, the three-dimensional point cloud data for the rough upper surface of the fracture is acquired through Synfrac software, which effectively describes the geometric shape of one side of the fracture. By programming in MATLAB 2022b, random noise is added to the upper surface to generate a lower surface with different degrees of matching and the same average aperture .
Random noise is typically added to the existing data points in the form of random variables. The initial data point is
, and with the addition of noise, it changes to
(
x′
).
In this description,
,
σ,
σ denote the random noise added along the
,
and
axes, respectively, with each noise component adhering to a normal distribution. This means that
,
,
, where
denotes the normal distribution.
represents the mean and
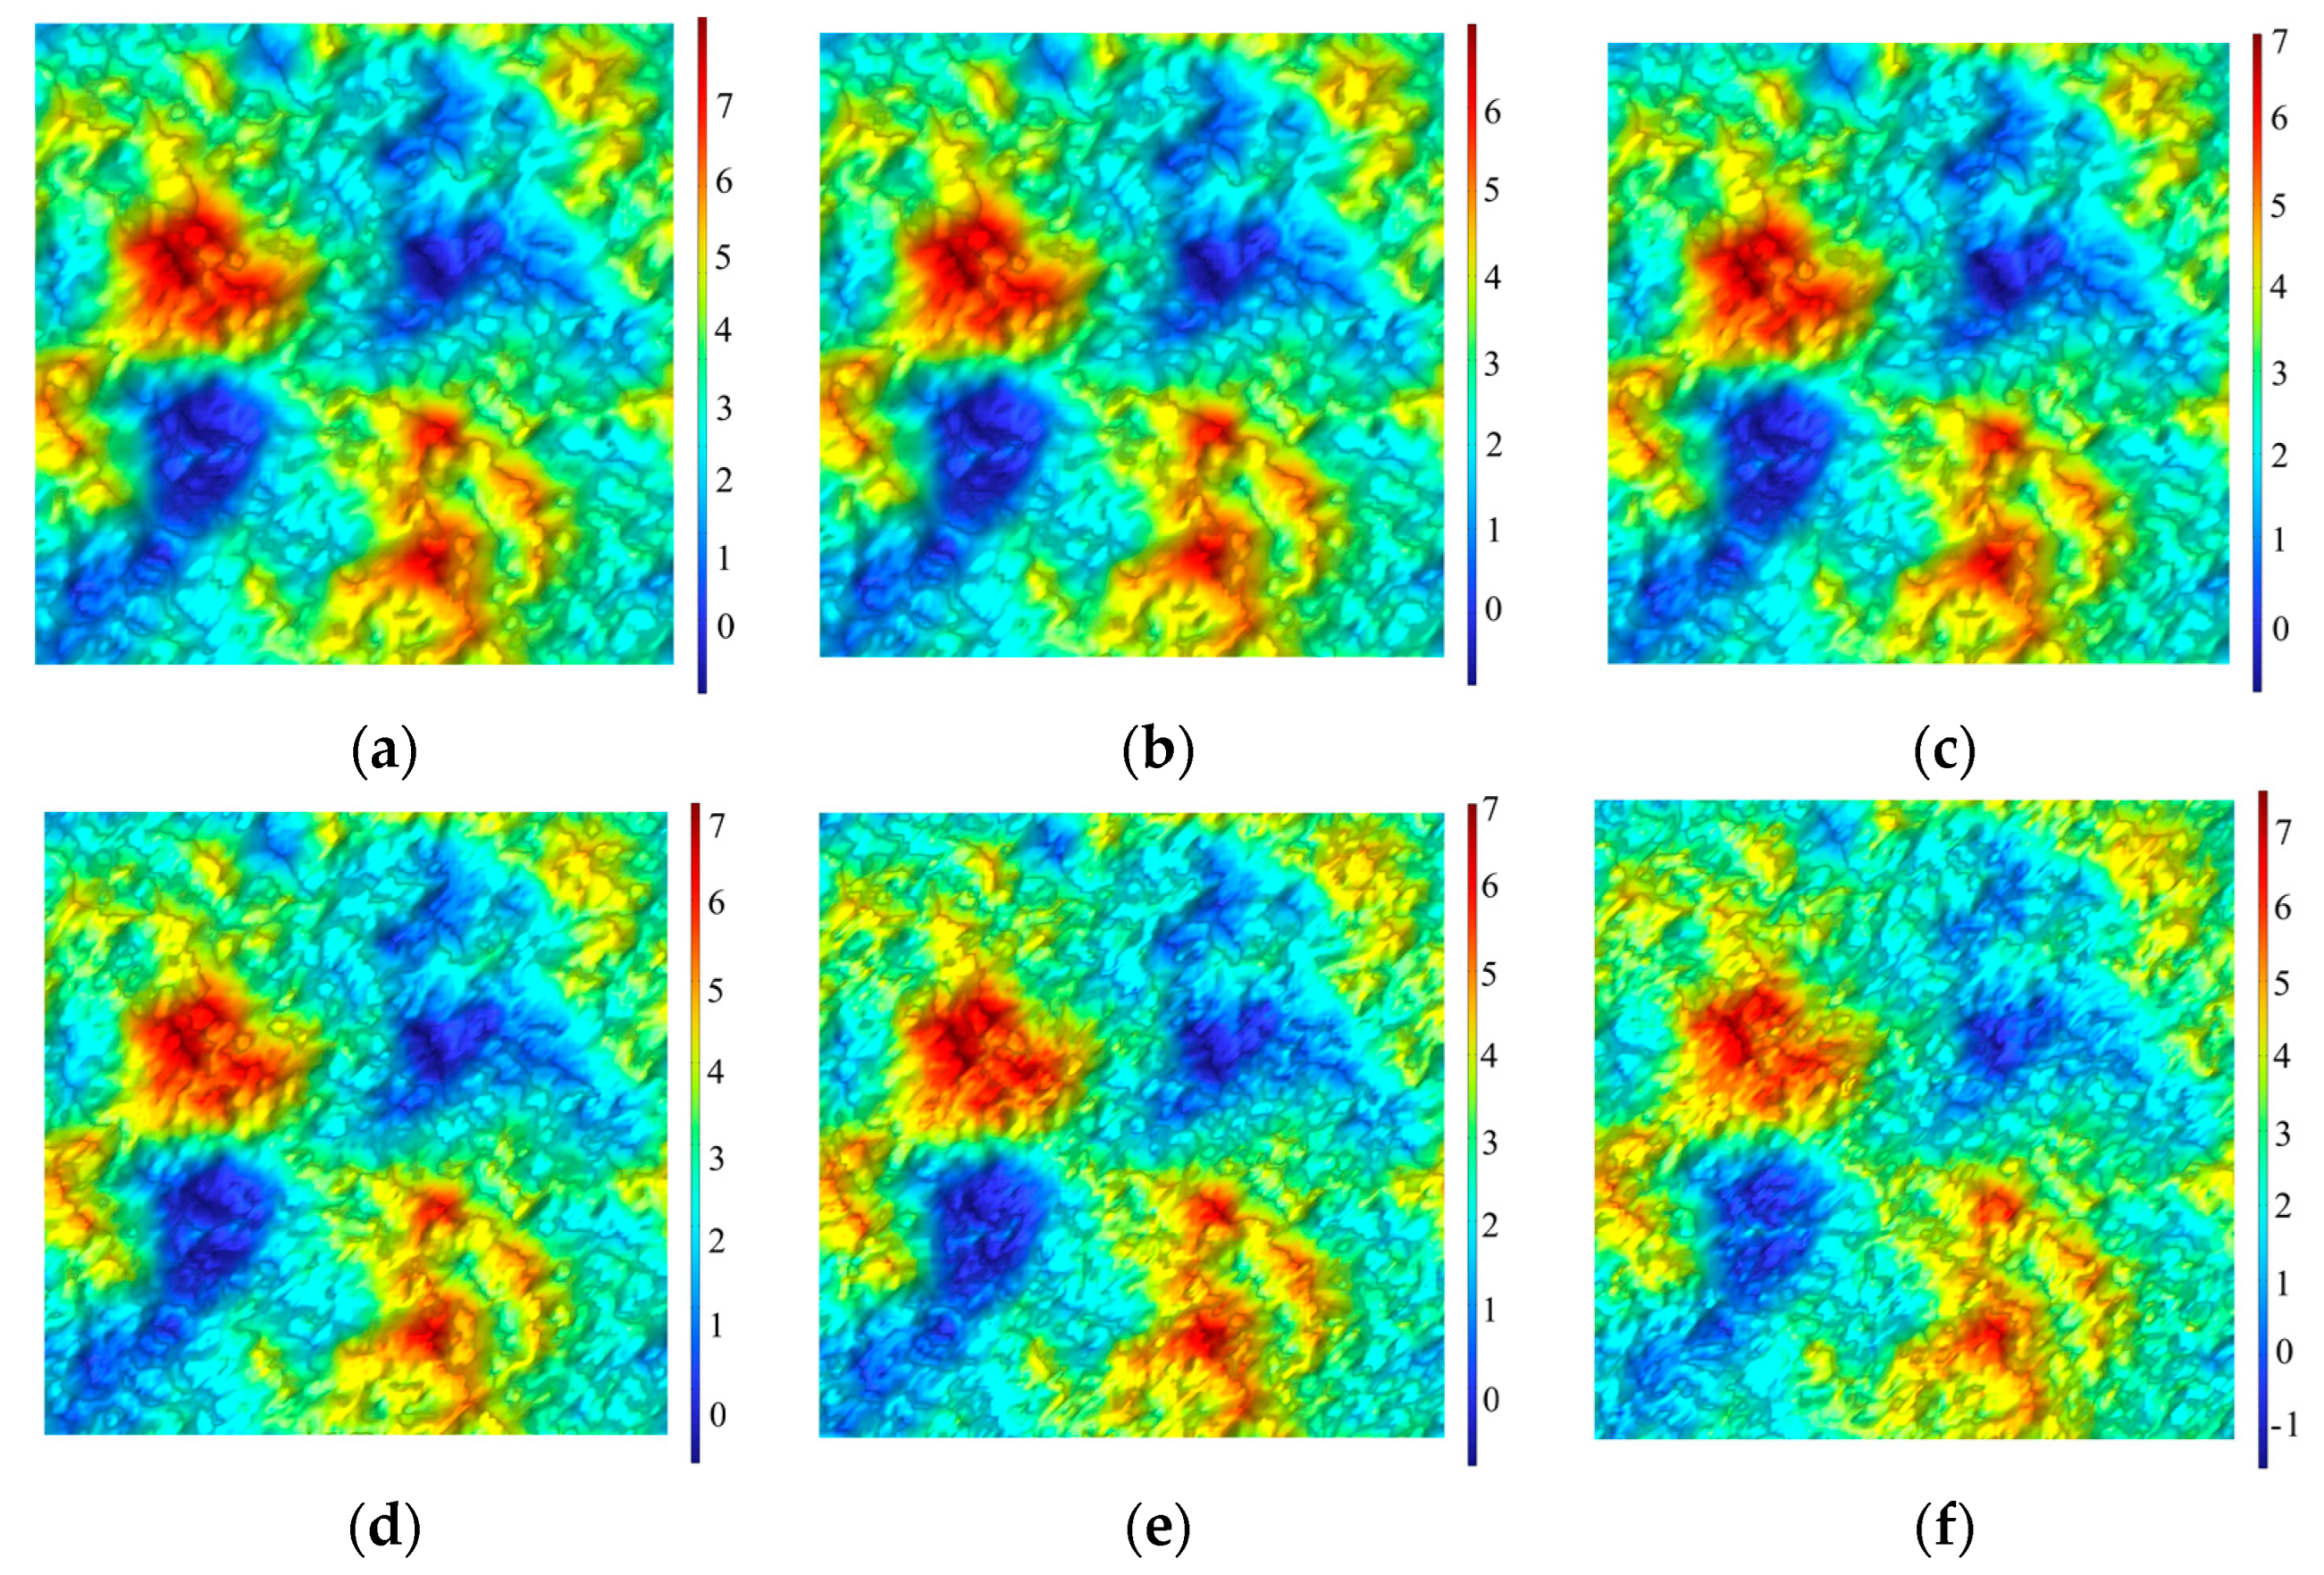
represents the variance. Comparative cloud map of the rough fracture’s upper and lower surfaces, as illustrated in
Figure 2.
2.3. Fracture Geometric Characteristics
The uneven distribution of aperture sizes can significantly affect the transport properties of fluid flow in fractures. In efforts to precisely delineate the internal geometric structures of fractured rock bodies, many researchers have extensively analyzed the spatial distribution of openings in rough fractures. They have predominantly found that normal distribution models are widely utilized to represent the characteristics of aperture distributions in both natural and man-made fractures [
35,
36,
37].
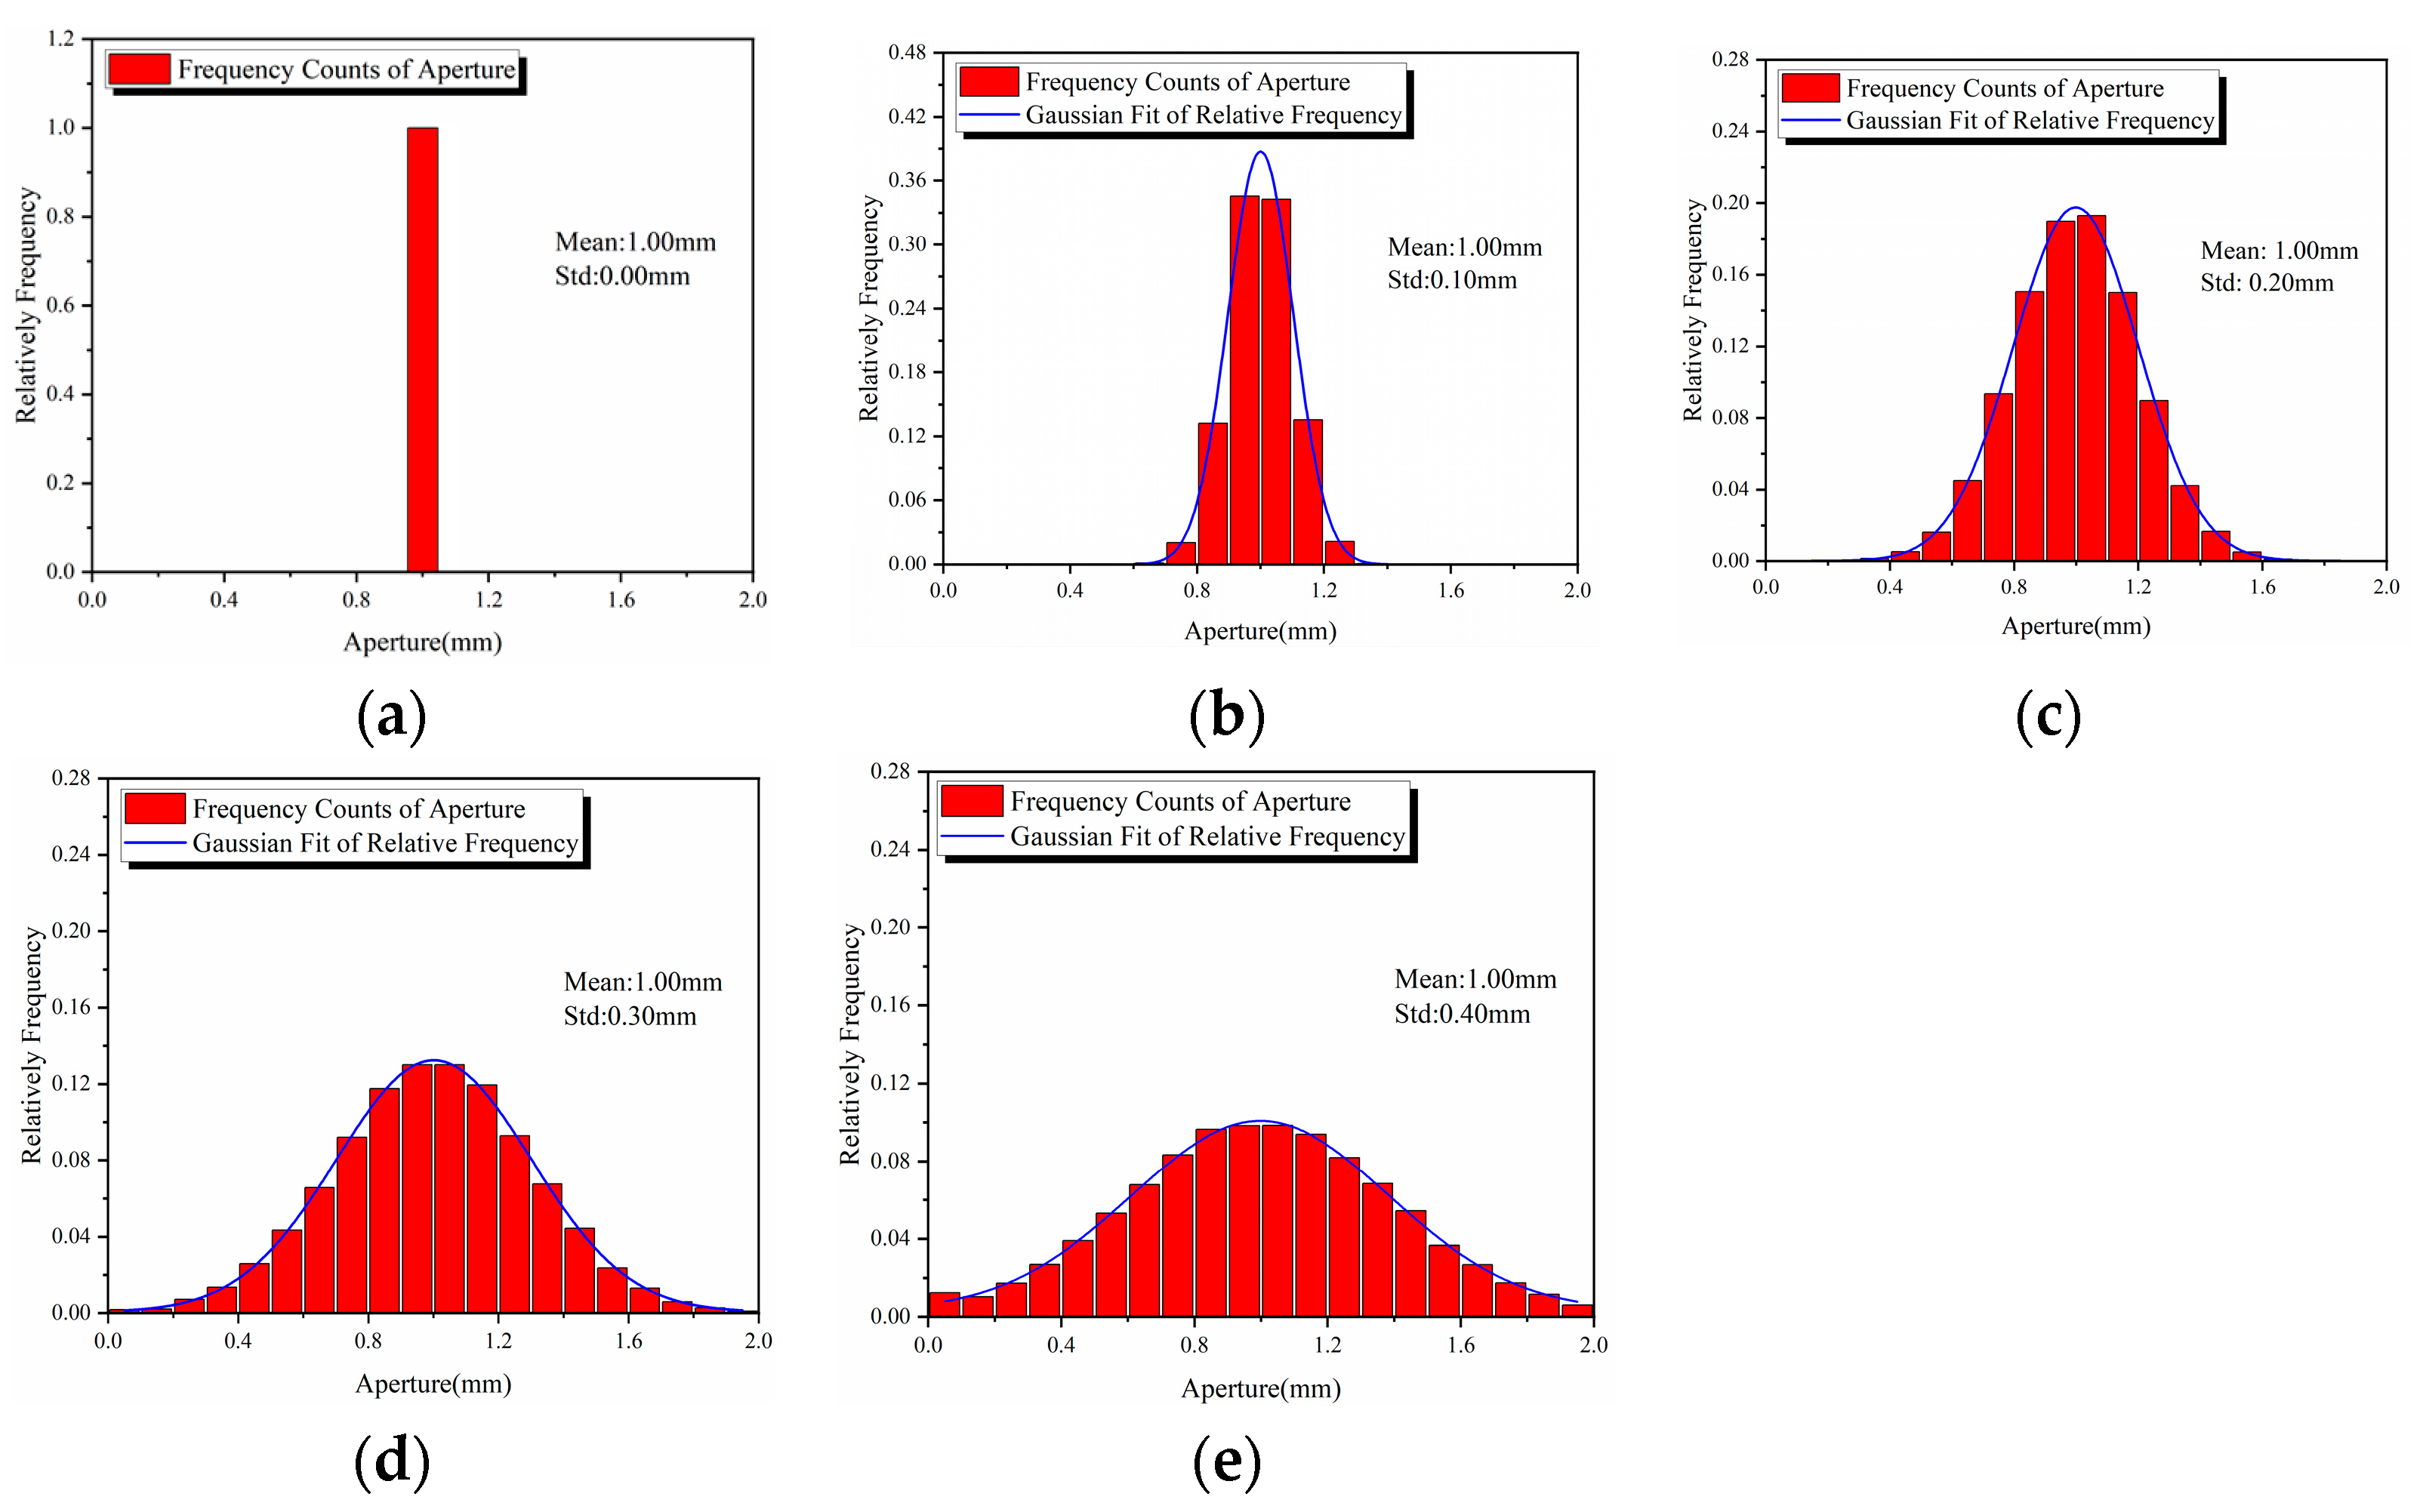
This paper calculates the aperture distribution of three-dimensional fractures with different matching characteristics and plots the corresponding frequency distribution histograms of fracture apertures, as shown in
Figure 3. Analysis of
Figure 3 indicates that, apart from completely matched fractures (
), the aperture data for other fractures follow a normal distribution, with a mean of 1 mm, reflecting an average aperture width of 1 mm. However, as the degree of matching in the fractures increases, the variance of the normal distribution decreases, suggesting a reduction in the variability of the fracture apertures.
To determine the mean and variance of the normal distribution of fracture apertures, the following methodology was employed:
Data Collection: Use Synfrac software to generate three-dimensional point cloud data of the fracture’s upper surface. Synfrac software applies fractal theory, which allows precise control over the roughness of the generated three-dimensional fracture surface.
Aperture Value Calculation: Compare the point cloud data of the upper surface with the point cloud data of the lower surface, and calculate the aperture values at different points by taking the difference.
Data Alignment: Ensure that the point cloud data of the upper and lower surfaces are aligned in the same coordinate system.
Aperture Calculation: For each point, calculate the vertical distance between the upper surface and the lower surface. This distance is the aperture value at that point.
The variance was calculated as:
These steps provided a robust basis for determining the mean and variance of the normal distribution of fracture apertures, thereby allowing for a detailed understanding of how the degree of matching influences the variability of aperture sizes. As the values converge towards the mean aperture width, the probability of encountering extremely “narrow” and “wide” gaps along the flow path significantly decreases, which has an important impact on fluid flow within the fracture.
2.4. Theoretical Background
Darcy’s Law is traditionally applied to describe fluid flow in porous media and rock fractures under conditions of low hydraulic head. Yet, under high hydraulic pressures, while the flow rate remains positively correlated with the hydraulic gradient, its rate of increase exhibits a progressively diminishing non-linear trend. In rough fractures, the flow rates predicted by Darcy’s Law under high permeation pressures frequently show substantial deviations from experimental or observational data. These findings have prompted further studies into the non-linear flow behaviors of fluids to more precisely characterize these complex flow dynamics.
To accurately depict the nonlinear flow characteristics in rock fractures and porous media, the Forchheimer equation and the Izbash equation are often introduced to model this complex phenomenon. These two equations effectively elucidate the complex relationship between the hydraulic gradient and fluid flow rate. Specifically, the Forchheimer equation is extensively applied to delineate the augmented inertial effects in fluid flow, offering a more holistic view for understanding the nonlinear behaviors of fluid dynamics under conditions of high flow rates [
38,
39,
40].
In the equation, is the volumetric flow rate, m3/s. −∇P is the pressure drop gradient across the fracture, Pa/m. A and B are the coefficients of the linear and nonlinear terms of the Forchheimer equation, respectively, describing the energy losses due to viscous and inertial dissipation. is the cross-sectional area of the fracture. is the nonlinear coefficient, associated with the B term, used to quantify the additional pressure loss caused by fluid inertia.
The Reynolds number (
Re) is defined as the ratio of inertial forces to viscous forces [
41], and is expressed by the following equation:
In the formula, represents the fracture aperture. A higher Reynolds number indicates a greater inertial effect acting on the fluid, making it more likely for the fluid flow to transition from a linear to a nonlinear state.
While the Forchheimer and Izbash equations are useful for characterizing non-linear flow behavior, the fundamental principles governing fluid flow in fractures are still based on the Navier-Stokes equations. The Navier-Stokes equations describe the motion of viscous fluid substances and are essential for accurately simulating fluid dynamics within fractures. Under steady-state conditions, the flow of an incompressible Newtonian fluid within a single rough fracture is described by the Navier-Stokes equations and the continuity equation, ensuring accurate simulations of fluid dynamics under various flow conditions.
The Navier-Stokes equation and continuity equation are used to directly simulate fluid flow within rough fractures, providing detailed insights into the flow patterns, velocity fields, and pressure distributions. By combining the empirical Forchheimer and Izbash equations with the Navier-Stokes equations, we can comprehensively understand and predict the behavior of fluid flow in rough fractures under various conditions.
2.5. Numercial Simulation Model and Boundary Conditions
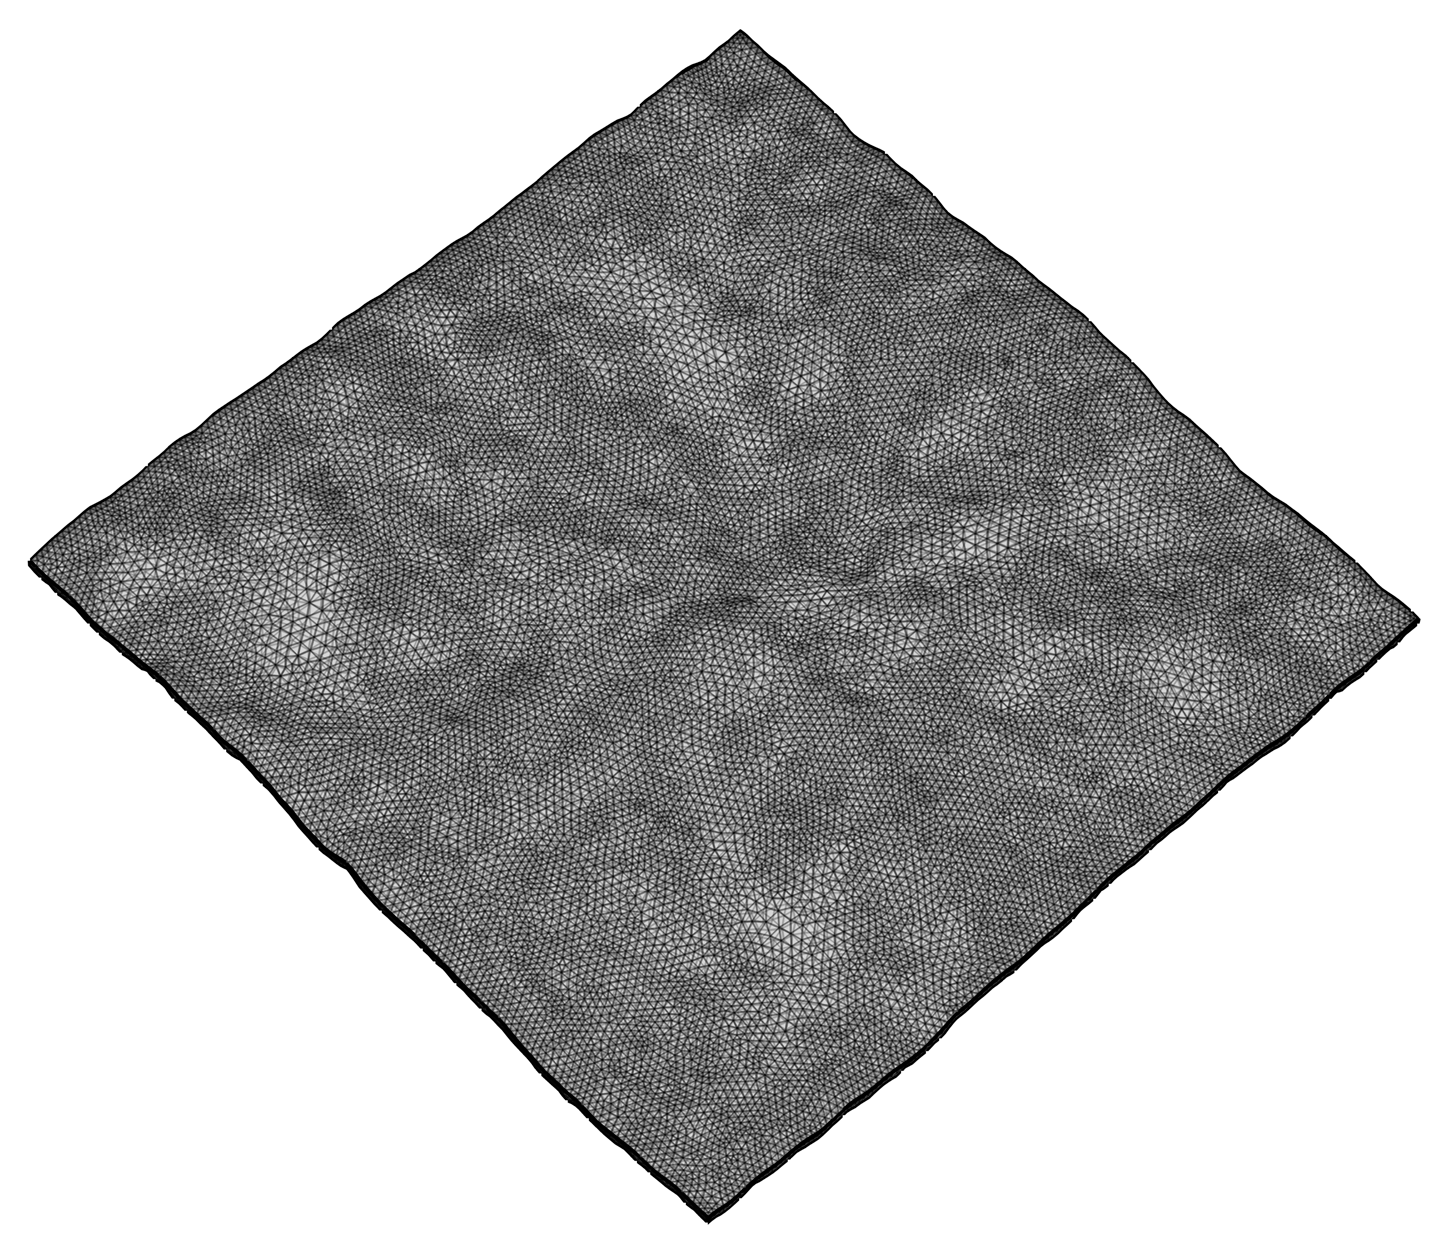
Since the free tetrahedral mesh can effectively divide three-dimensional space, this paper selects the free tetrahedral mesh to discretize the constructed model. The mesh size of the rough single fracture model ranges between 0.016 and 0.76 mm, the generated mesh is shown in
Figure 4.
To ensure the uniformity and adaptability of the mesh, we considered the geometric complexity of the model during the mesh generation process, particularly the morphology of the fractures and the distribution of the pore sizes. This ensured a sufficiently high mesh density in critical areas to capture fine flow characteristics. Therefore, it is necessary to conduct a mesh sensitivity analysis for the model to reduce the dependency of solution accuracy on the number of grids.
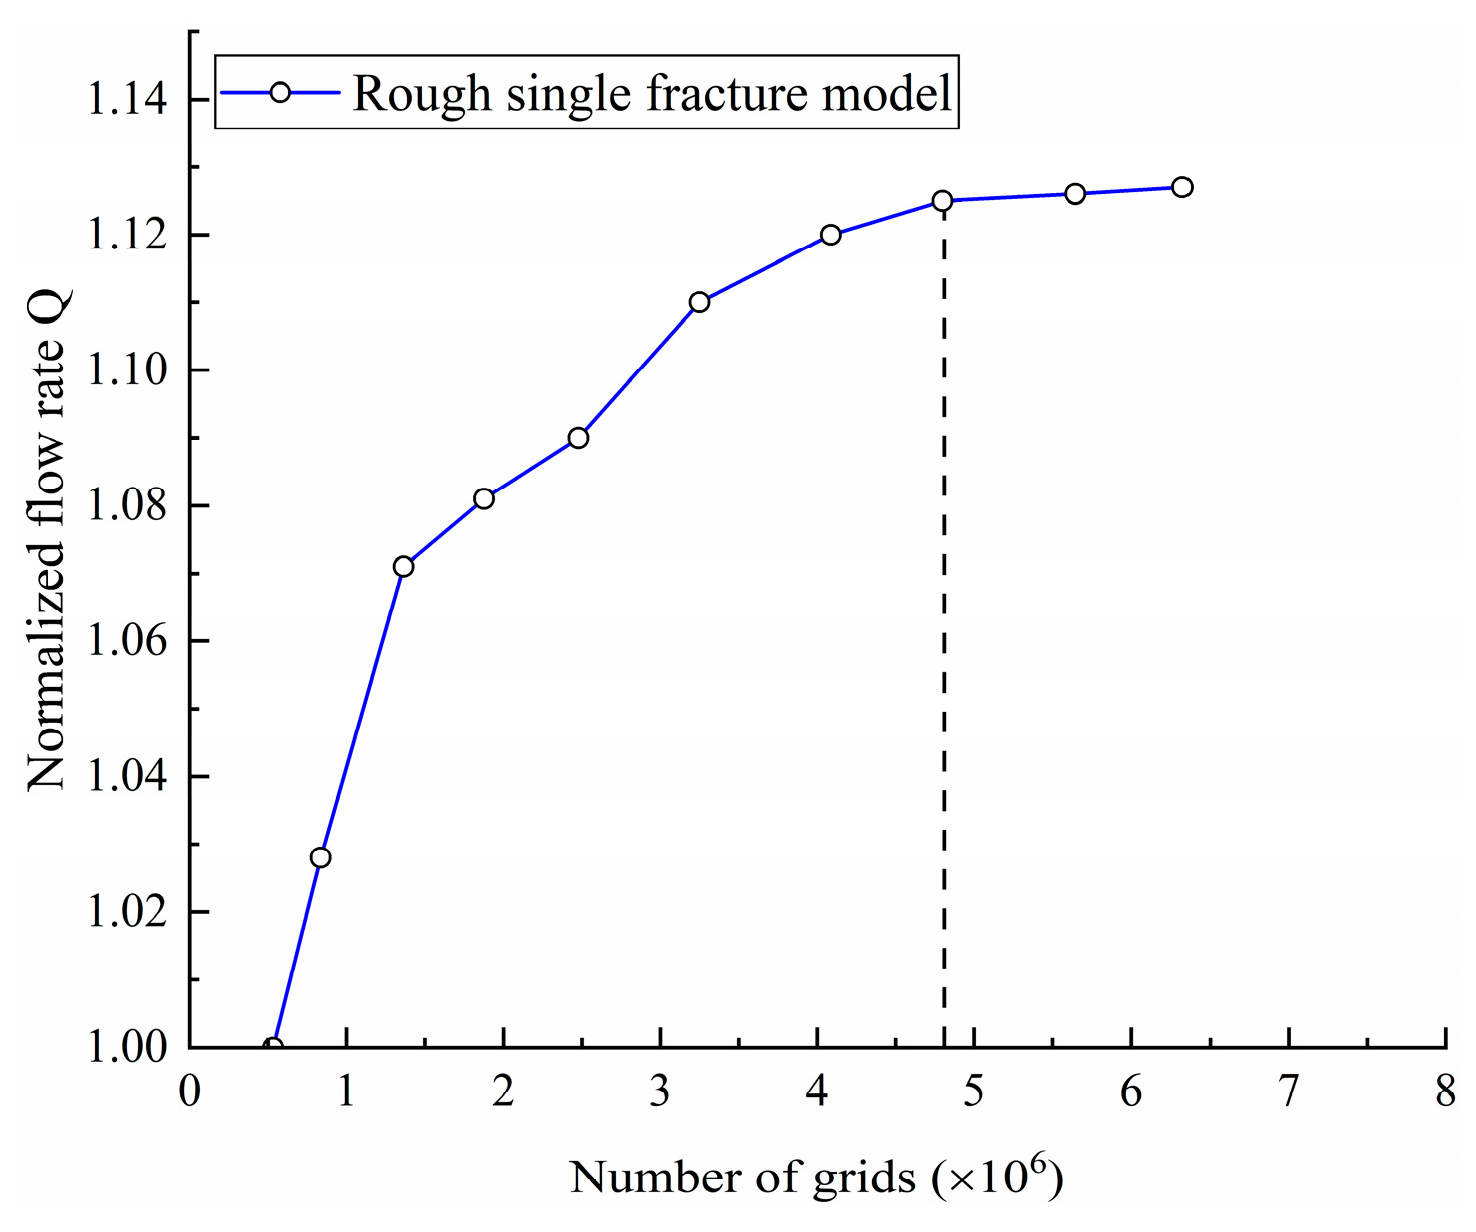
For this purpose, we selected a rough single fracture model with
as study subjects. We compared and analyzed the relationship between the normalized flow rate Q at the fracture outlet and the number of grids under 10 different grid quantities, as shown in
Figure 5. Through mesh sensitivity analysis, considering both the accuracy of the calculation results and the time cost, the rough single fracture model selects between 4.798 × 10
6 and 6.325 × 10
6.
In this research, the rough fracture has a side length of L = 100 mm and an average aperture of . The upper surface of the fracture is characterized by a fractal dimension of D = 2.2, whereas the lower surface is generated by adding random noise, resulting in surfaces with varying degrees of matching, encompassing a broad range of matches.
Fluid flow in rough fractures adheres to the fundamental principles of fluid dynamics, specifically, it satisfies the Navier-Stokes equations [
42].
In the equation, is the velocity vector, m/s; is the pressure, Pa; is the kinematic viscosity, Pa·s; is the fluid density, kg/m3.
Under steady-state conditions, the flow of an incompressible Newtonian fluid within a single rough fracture is described by the Navier-Stokes equations and the continuity equation. Together, these equations ensure accurate simulations of fluid dynamics under various flow conditions [
43].
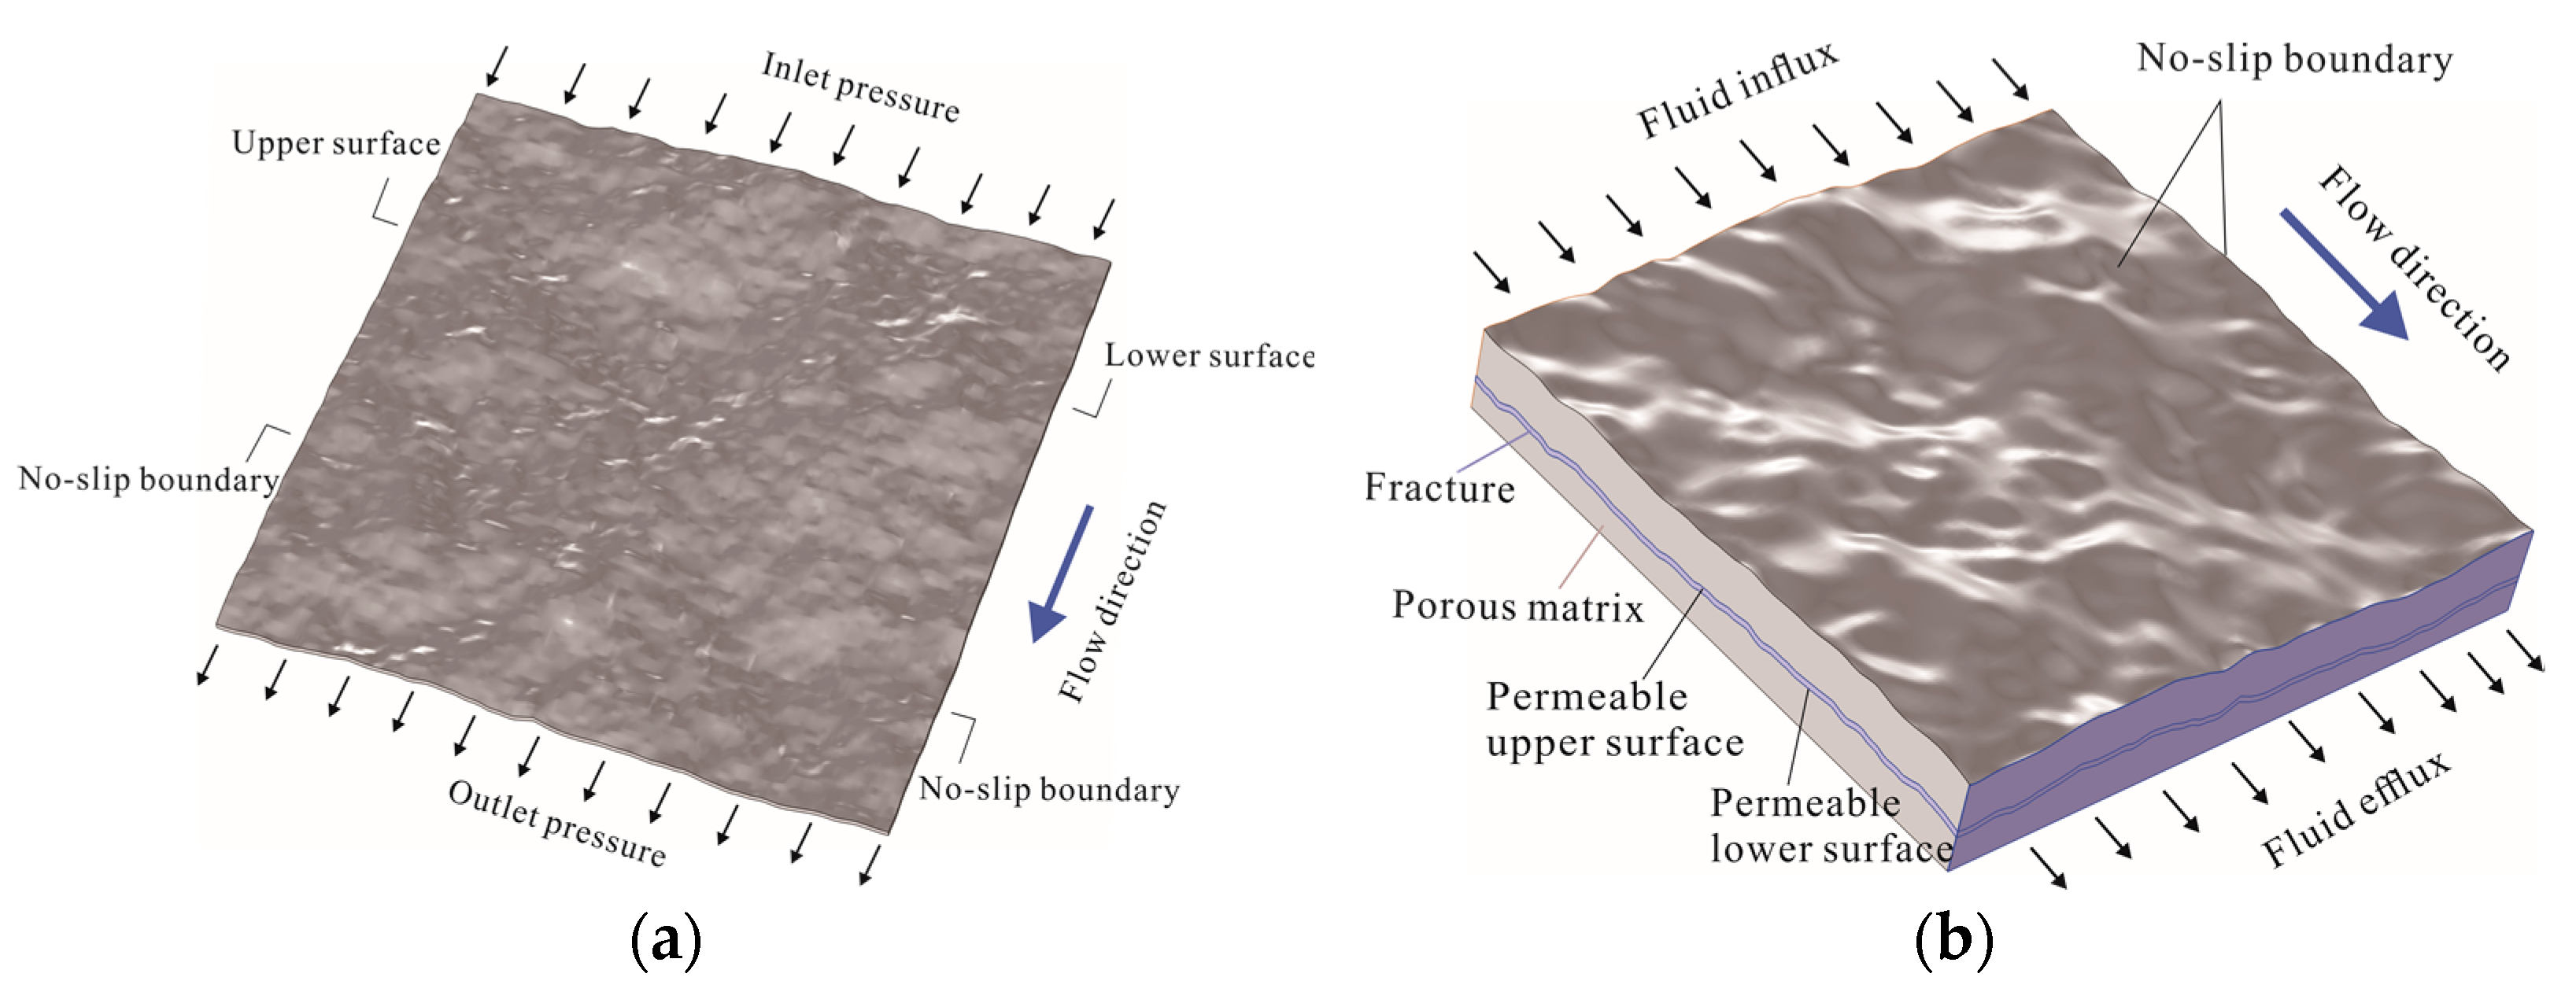
In the numerical simulations, several critical assumptions are set to ensure the model’s accuracy and reliability. Initially, the rock matrix is assumed to be a homogeneous and isotropic elastic medium that remains undeformed throughout the simulation. Secondly, the model assumes perfect alignment between the matrix and the fracture without any displacement. A model of a single rough fracture and an integrated matrix-fracture dual-porosity medium is illustrated in
Figure 6.
In the model, the study employs the finite element method (FEM) to solve the Navier-Stokes equations. The relative tolerance for the solvers is set to 10−6, ensuring accurate and stable solutions. The top and bottom sides are set as the inflow and outflow boundaries, respectively. A constant injection pressure of P = 100~1000 Pa and a flow rate of Q = 1.0 × 10⁻⁶~1.0 × 10⁻⁵ are applied at the inflow boundary, while the pressure at the fluid outflow boundary is set to 0 Pa. Setting no-slip boundaries, applied to all fracture walls to ensure that the fluid velocity at the boundaries is zero.
3. Results and Discussion
3.1. Flow Velocity Distribution
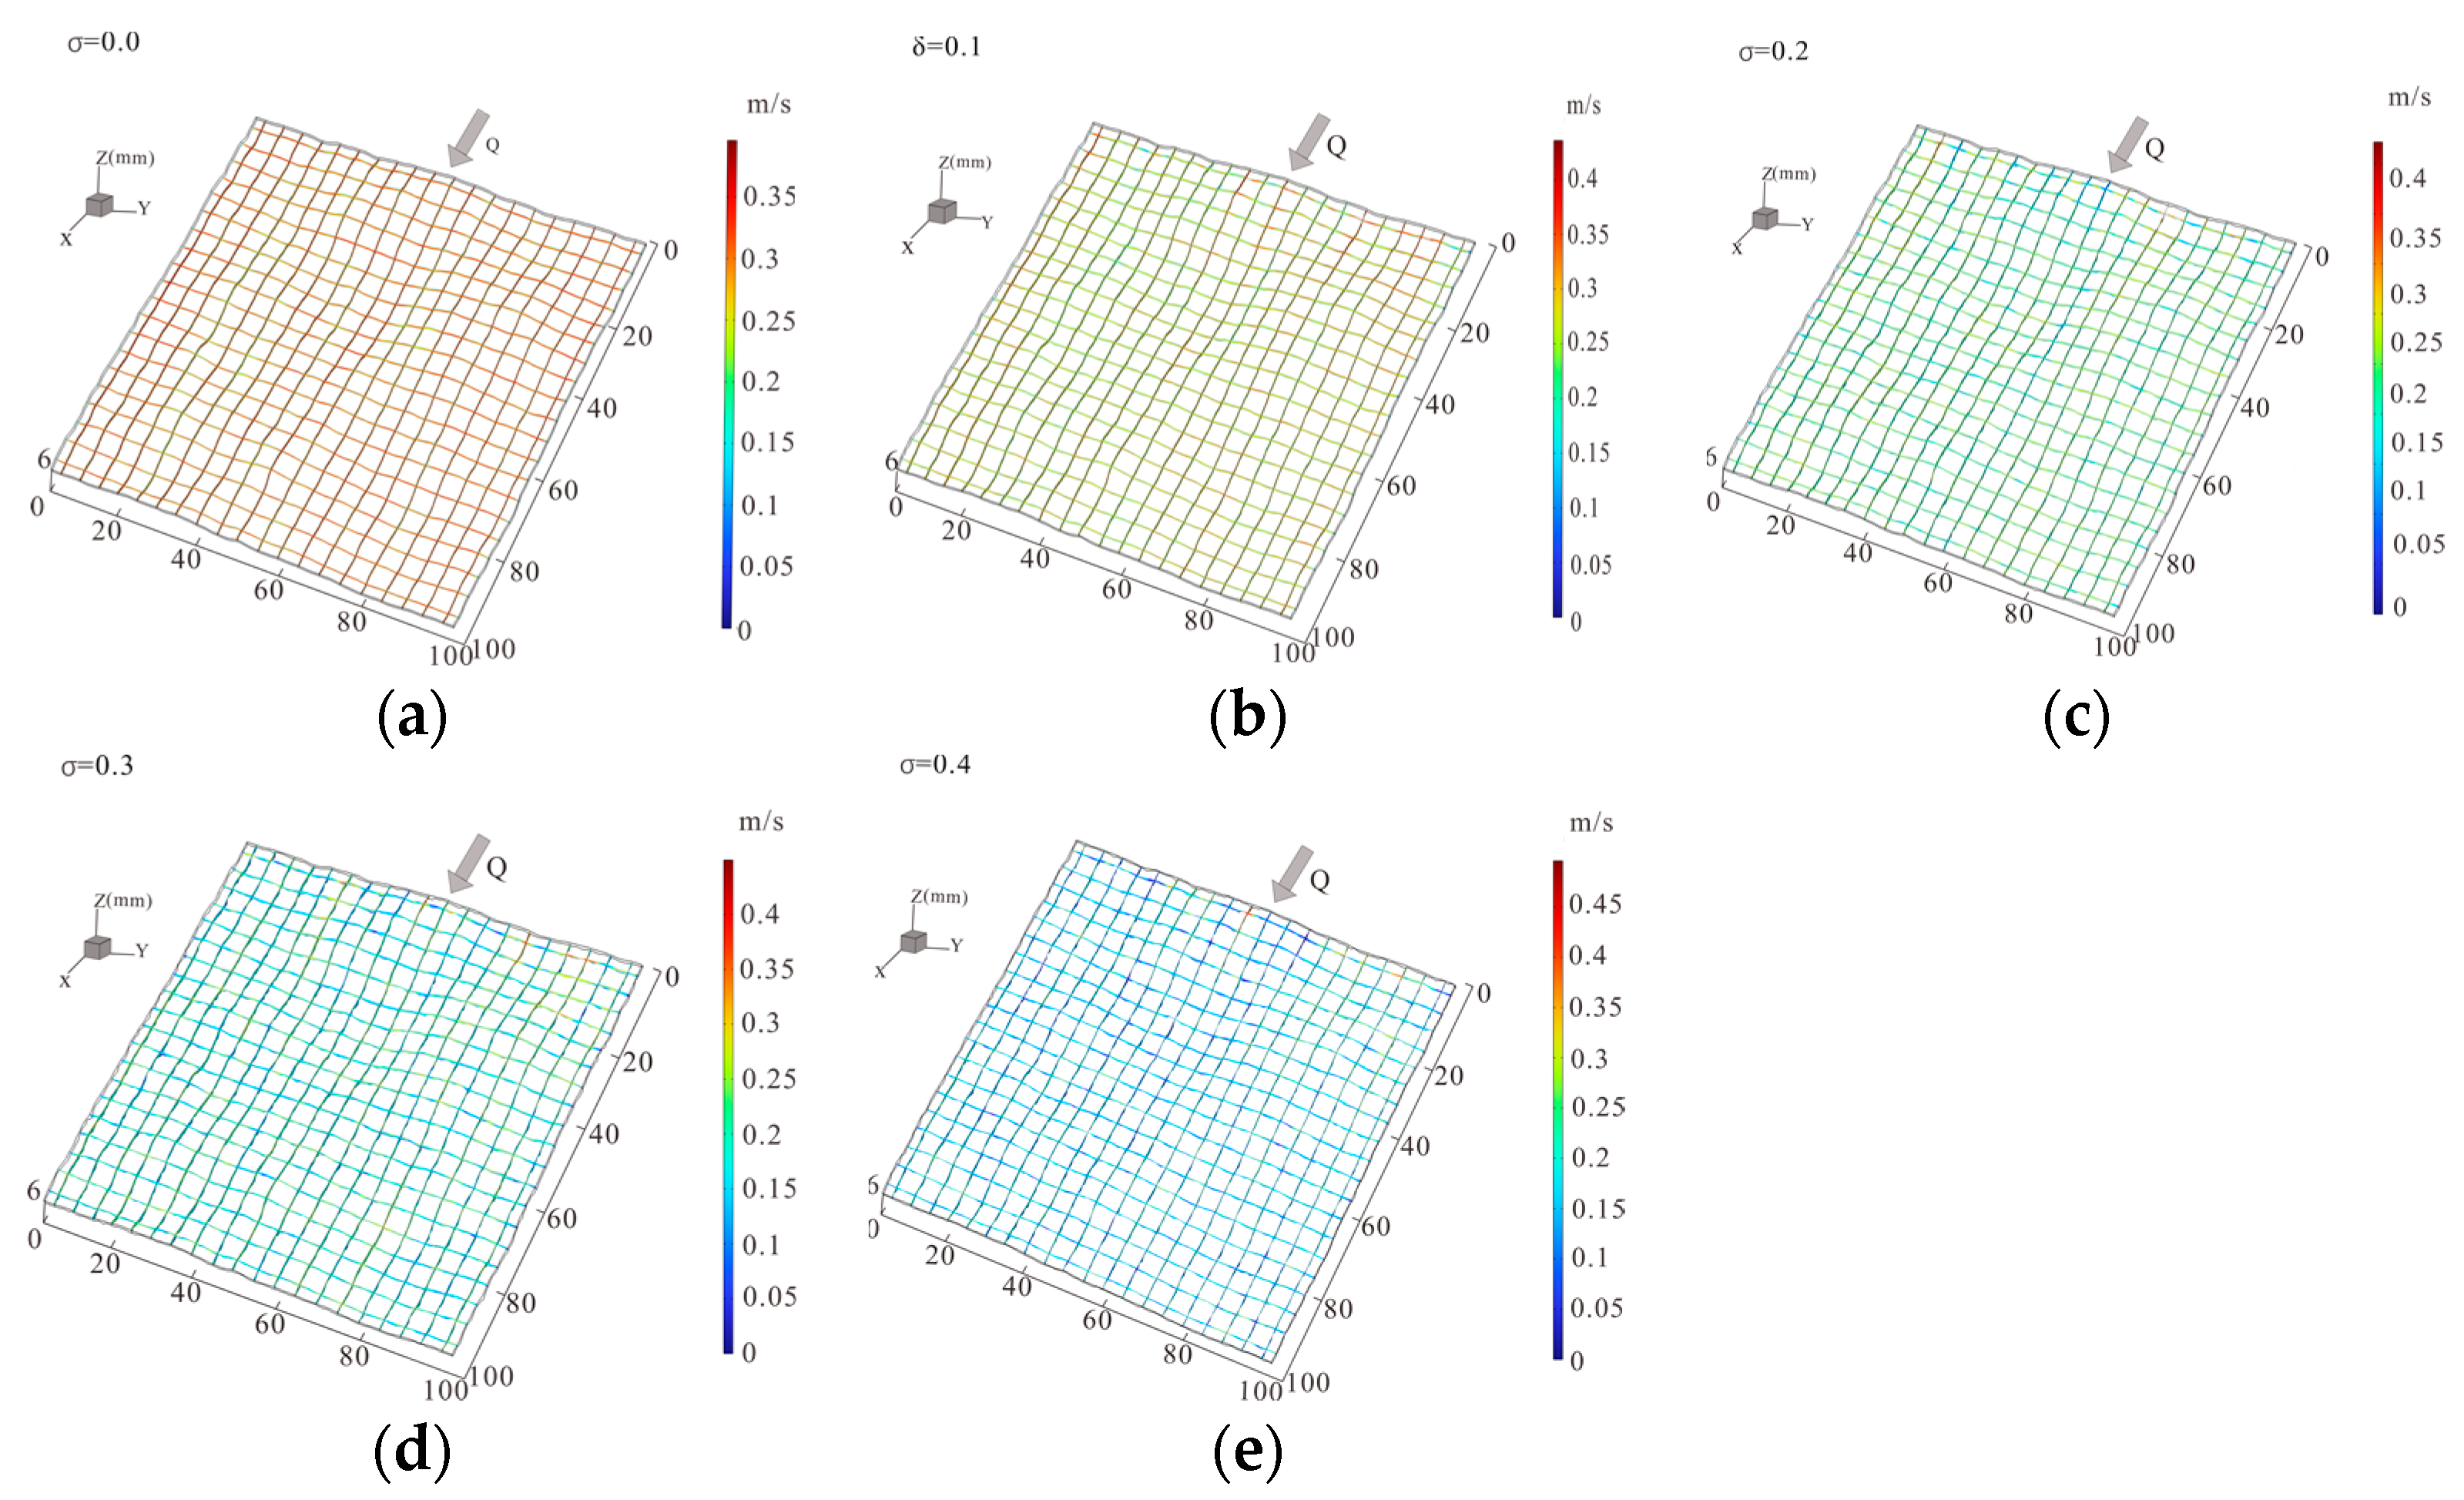
The results of the simulated velocity field are shown in
Figure 7, with a constant pressure gradient of −∇
P = 5 × 10
3 Pa/m. For the five fractures with different matching characteristics, the fluid flow states were observed, and through the use of a slicing function, 20 cross-sectional and 20 longitudinal sections were obtained.
With the average aperture held constant, in fractures with perfect matching, the flow velocity is uniformly distributed across the fracture, except at the walls where it is zero. In the channels between the upper and lower surfaces, the flow velocity is 0.32 m/s. As the mismatch increases, the distribution of the flow velocity becomes more dispersed and irregular and the maximum flow velocity gradually increases. At a mismatch of , the maximum flow velocity reaches 0.47 m/s. The enhancement of mismatch in the fracture leads to the formation of more “protrusions” and “depressions” on the upper and lower surfaces. This topographical variability results in localized velocity anomalies, where the velocity decreases at the protrusions and increases at the depressions.
The observed phenomena can be attributed to several microscopic mechanisms such as increased surface roughness due to mismatched fractures creating a more tortuous flow path. This tortuosity forces the fluid to navigate around protrusions and into depressions, leading to localized variations in velocity. The increase in flow velocity in certain regions is due to the fluid being funneled through narrower apertures, which accelerates the flow, while wider regions slow down the fluid due to decreased pressure gradients. As the mismatch increases, the pressure distribution within the fracture becomes more uneven. High-pressure zones form near the depressions, pushing the fluid faster through these regions, while low-pressure zones around protrusions slow down the fluid. Additionally, the inertial effects become more pronounced as the flow velocity increases in the depressions, contributing to the overall increase in velocity variability.
3.2. Streamline Distribution
Figure 8 displays the streamline distribution in a single rough fracture at perfect matching (
σ = 0.0) and under mismatched conditions of
σ = 0.2 and
σ = 0.4, with the model subjected to a pressure gradient of
P = 5000 Pa/m. The figure illustrates that as the mismatch increases, the unevenness of the streamline distribution intensifies. This occurs because the increasing mismatch leads to a more uneven distribution of apertures within the fracture. Consequently, more “protrusions” and “depressions” arise, similar to wave-like undulations, creating localized regions of high and low velocity. Additionally, as the pressure gradient increases, vortices may form.
To delve deeper into the variations in streamline distribution within fractures due to differences in matching characteristics, vertical mid-sections along the positive x-axis were captured under the conditions of
σ = 0.0 and
σ = 0.40. The streamline diagrams in these sections are presented in
Figure 8.
Figure 9a shows the streamline distribution and a localized magnified view in the middle section at y = 50 mm of the fracture under the completely matched condition of σ = 0.0. The color legend represents the flow velocity. The figure clearly shows that the velocity within the fracture is uniformly distributed along its length, conforming to Poiseuille flow patterns, and the streamlines are evenly distributed without any vortex zones. In
Figure 9b, corresponding to σ = 0.4 with a substantial mismatch, the flow velocity within the fracture is unevenly distributed along its course, and the streamline distribution is irregular, with several distinct vortex areas emerging along the length.
The streamline distribution can be explained by the following microscopic mechanisms: the presence of mismatches increases the tortuosity of the flow paths, forcing the fluid to take more convoluted routes through the fracture. This diversion results in a more complex streamline pattern and the formation of eddies and vortices. The increased roughness and mismatch lead to higher energy dissipation due to friction and inertial effects. This energy dissipation manifests as vorticity in the flow, creating vortices and recirculating zones that alter the streamline distribution.
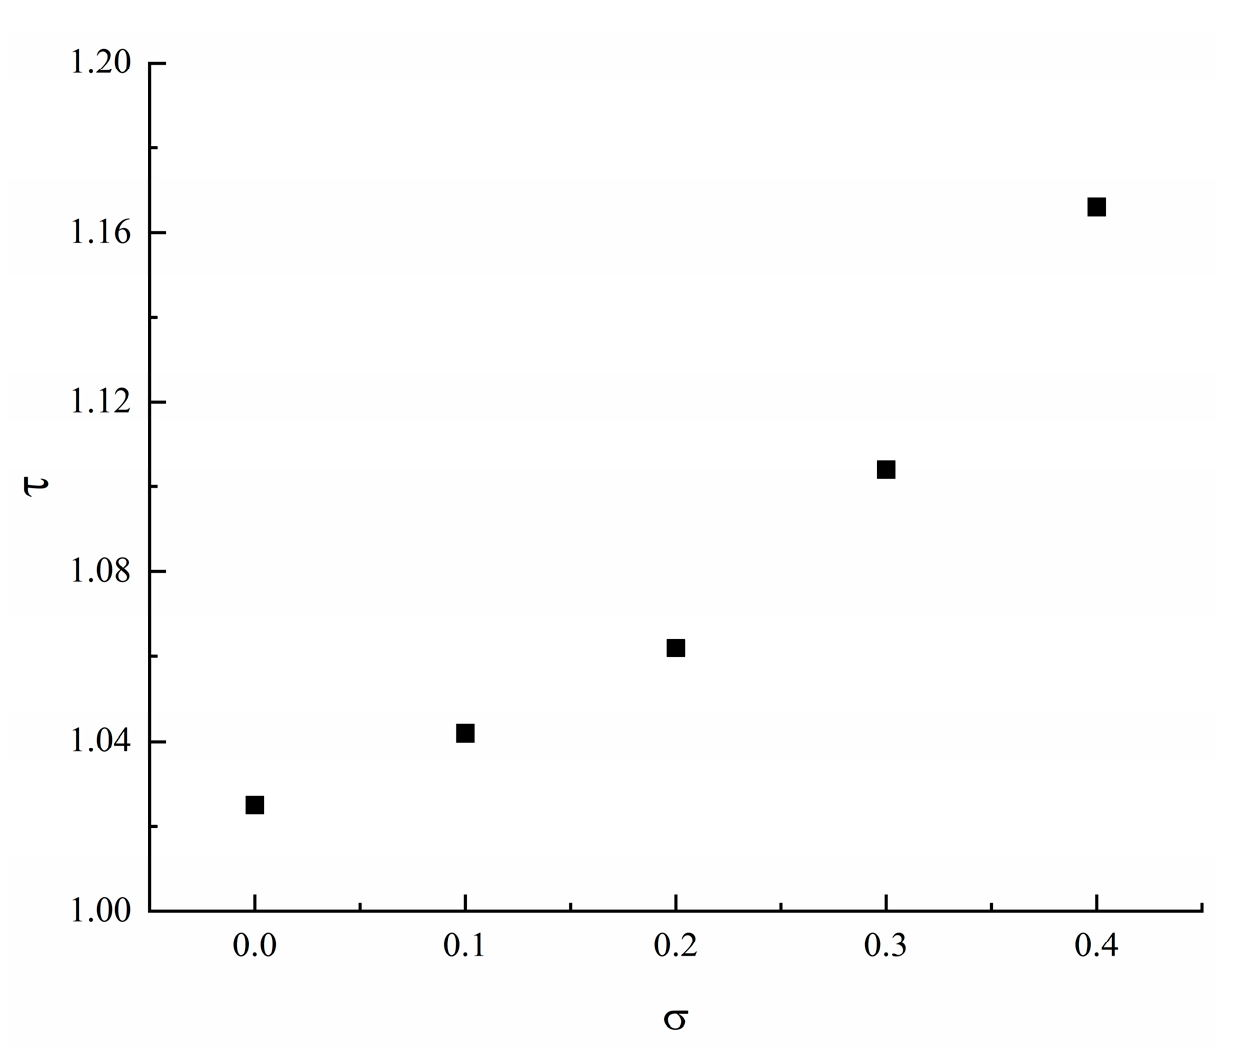
The tortuosity of three-dimensional fracture flow paths effectively reflects the complexity of the velocity fields caused by the non-matching characteristics of rough fractures. This paper has adopted a volume-averaged approach to calculate tortuosity. This involves integrating local velocity properties over the entire domain, ensuring a more accurate representation of the flow path tortuosity [
44]. The detailed steps and formulas are as follows:
The average velocity over the entire domain is given by:
At each point, calculate the magnitude of the velocity vector.
Integrate over the entire domain to calculate the total sum of the velocity magnitudes:
Divide the integral result by the total volume V to obtain the average velocity:
Tortuosity is defined as the ratio of the path length to the straight-line distance, represented by the volume-averaged value of the velocity field. The formula is as follows:
Using the above method, the tortuosity values under different degrees of matching were obtained, as shown in
Figure 10. As shown in the figure, tortuosity gradually increases with the degree of mismatch. For relatively simple and well-matched fractures, the fluid flow path is close to straight, resulting in lower tortuosity. In these cases, fluid flow is relatively uniform, and the velocity field is also relatively simple. In these cases, the fluid flow path winds around various obstacles, leading to an increase in the length of the fluid path. In poorly matched fractures, the fluid flow path becomes more tortuous and complex, resulting in higher tortuosity. The velocity field will exhibit more complex patterns, with potential occurrences of vortices and localized high-velocity regions.
3.3. Nonlinear Seepage Characteristics
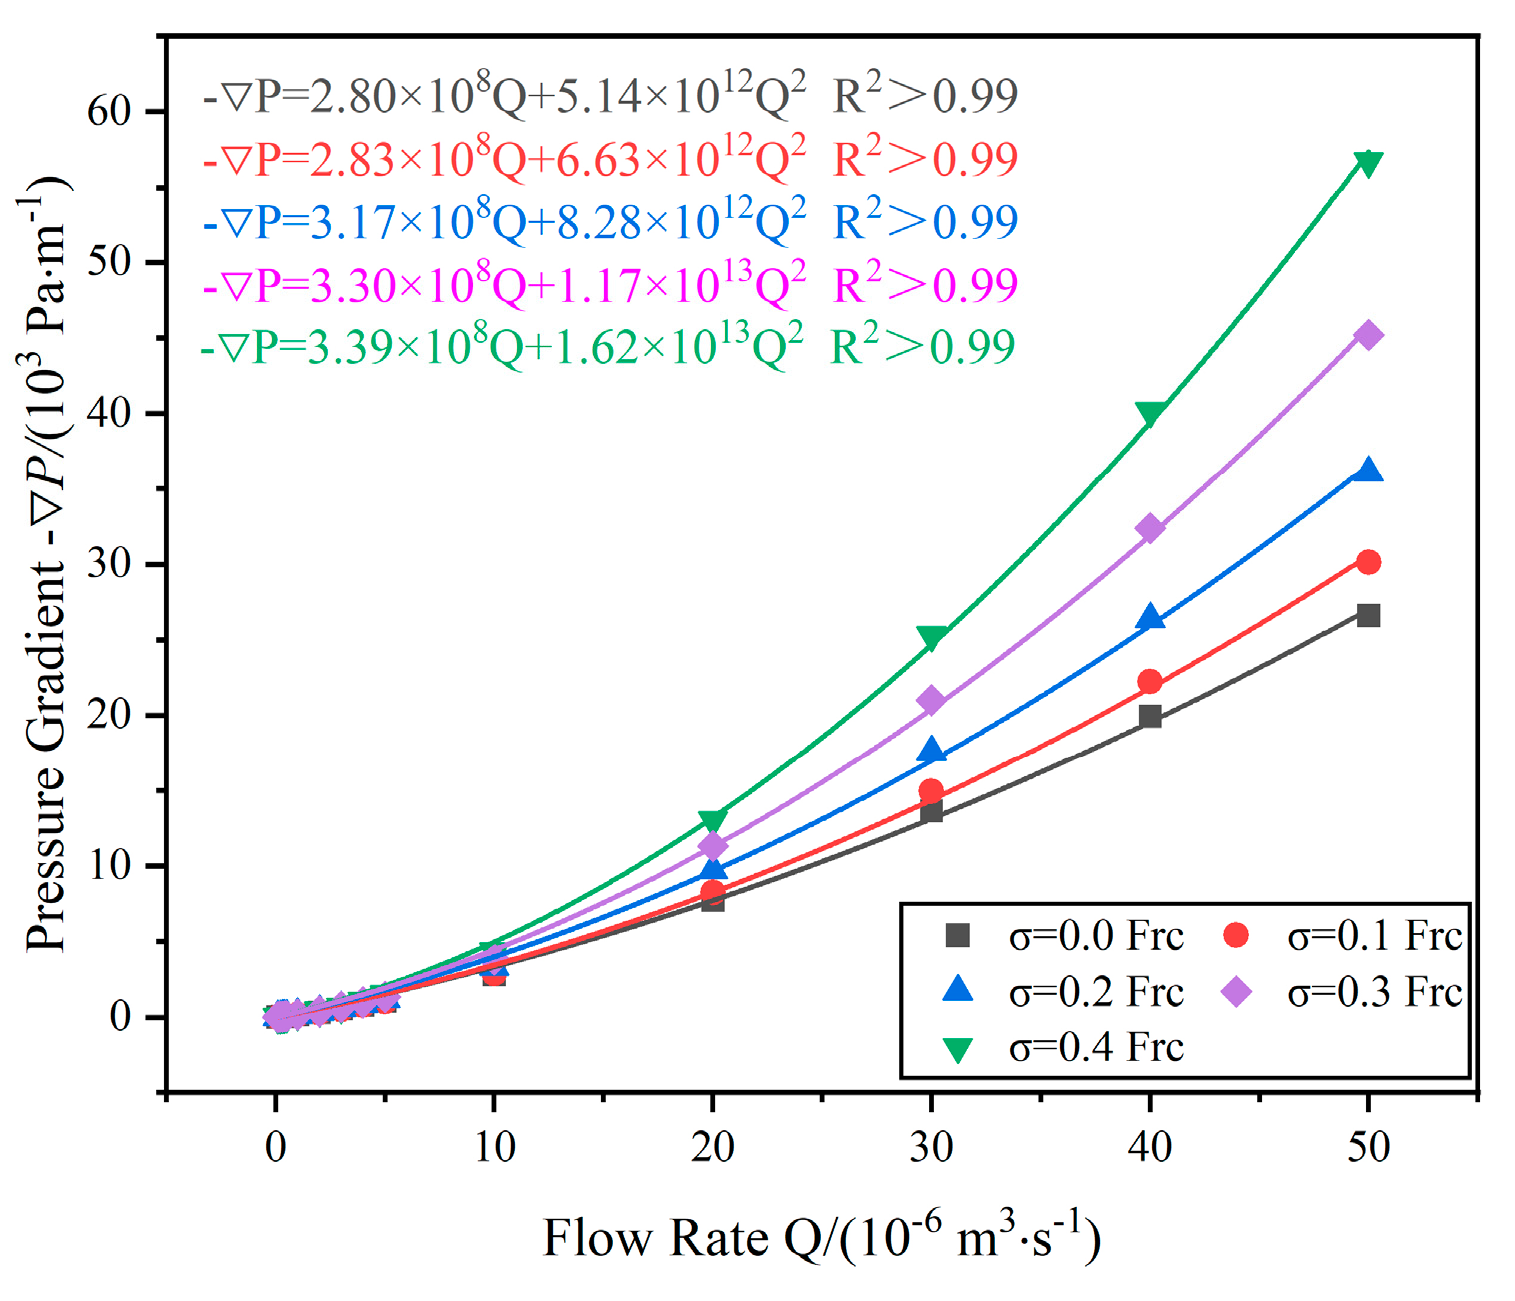
Seepage simulations were performed on five rough fractures with varying matching characteristics but identical average apertures, under different specified inlet flow conditions. The relationship between flow rate Q and the pressure gradient −∇
P is depicted in
Figure 11. Based on the Forchheimer formula, the relationship between the flow rate Q and the pressure gradient (−∇
P) was fitted, resulting in the Forchheimer coefficients A and B.
In each fracture, significant nonlinear seepage was observed and the seepage behavior conformed to the Forchheimer formula, where the flow rate (Q) and the pressure gradient (−∇P) exhibit a quadratic relationship. However, under average aperture conditions, the degree of nonlinearity varies significantly and systematically with different mismatch characteristics, showing the following: results show that a greater mismatch in fractures leads to more pronounced flow nonlinearity. Additionally, a larger nonlinear coefficient β results in more pronounced curvature of the curves on the graph. Furthermore, a smaller hydraulic aperture indicates weaker permeability of the fractures under the same conditions.
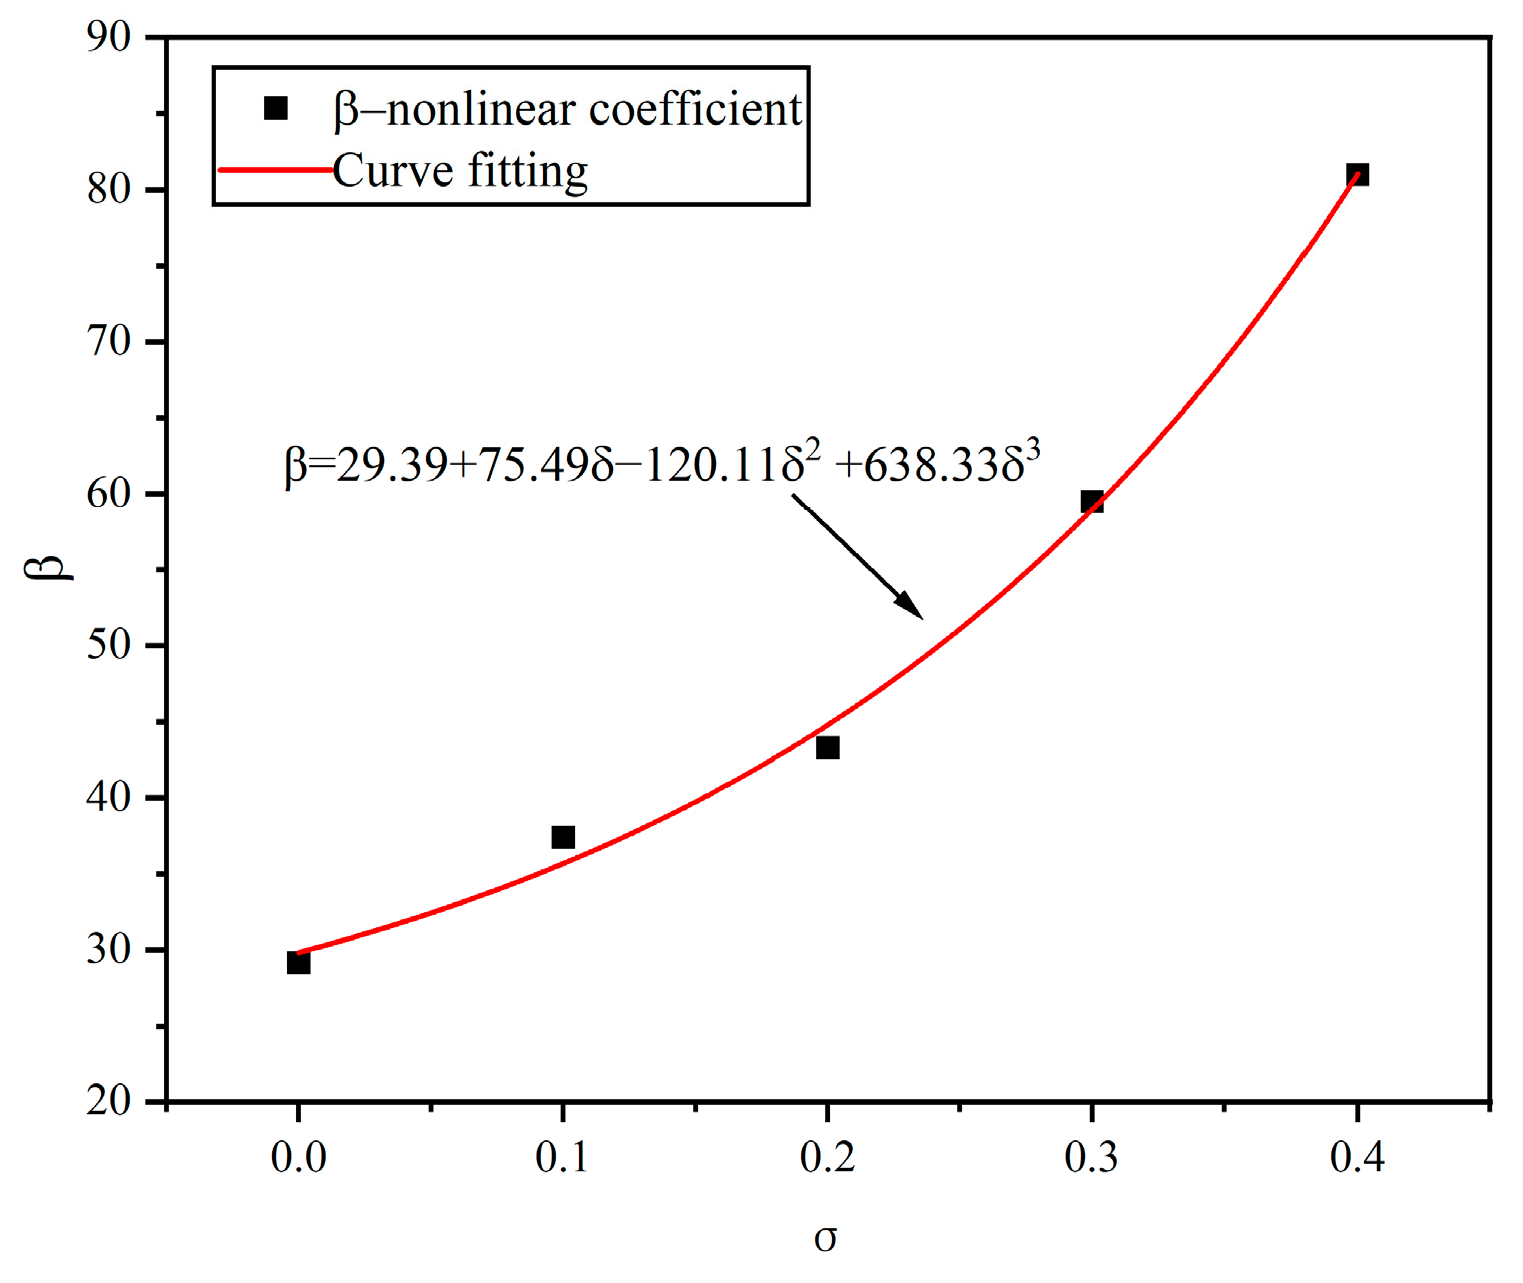
Figure 12 illustrates the relationship between
σ and β. The data indicate that as
σ increases, β significantly rises, showing a distinct nonlinear growth trend. The data have been fitted to an expression that reflects the impact of fracture surface mismatch on flow characteristics, particularly under conditions of higher mismatch, where the complexity of fluid dynamics markedly increases.
The nonlinear seepage characteristics can be attributed to the following: as flow rates increase, the inertial forces become more significant compared to viscous forces. In mismatched fractures, the increased roughness enhances inertial effects, leading to nonlinear flow behavior as described by the Forchheimer equation. Mismatched fractures create constrictions and expansions along the flow path, causing variations in velocity and pressure. These changes enhance the nonlinearity of the flow, as the fluid accelerates through narrow regions and decelerates in wider areas.
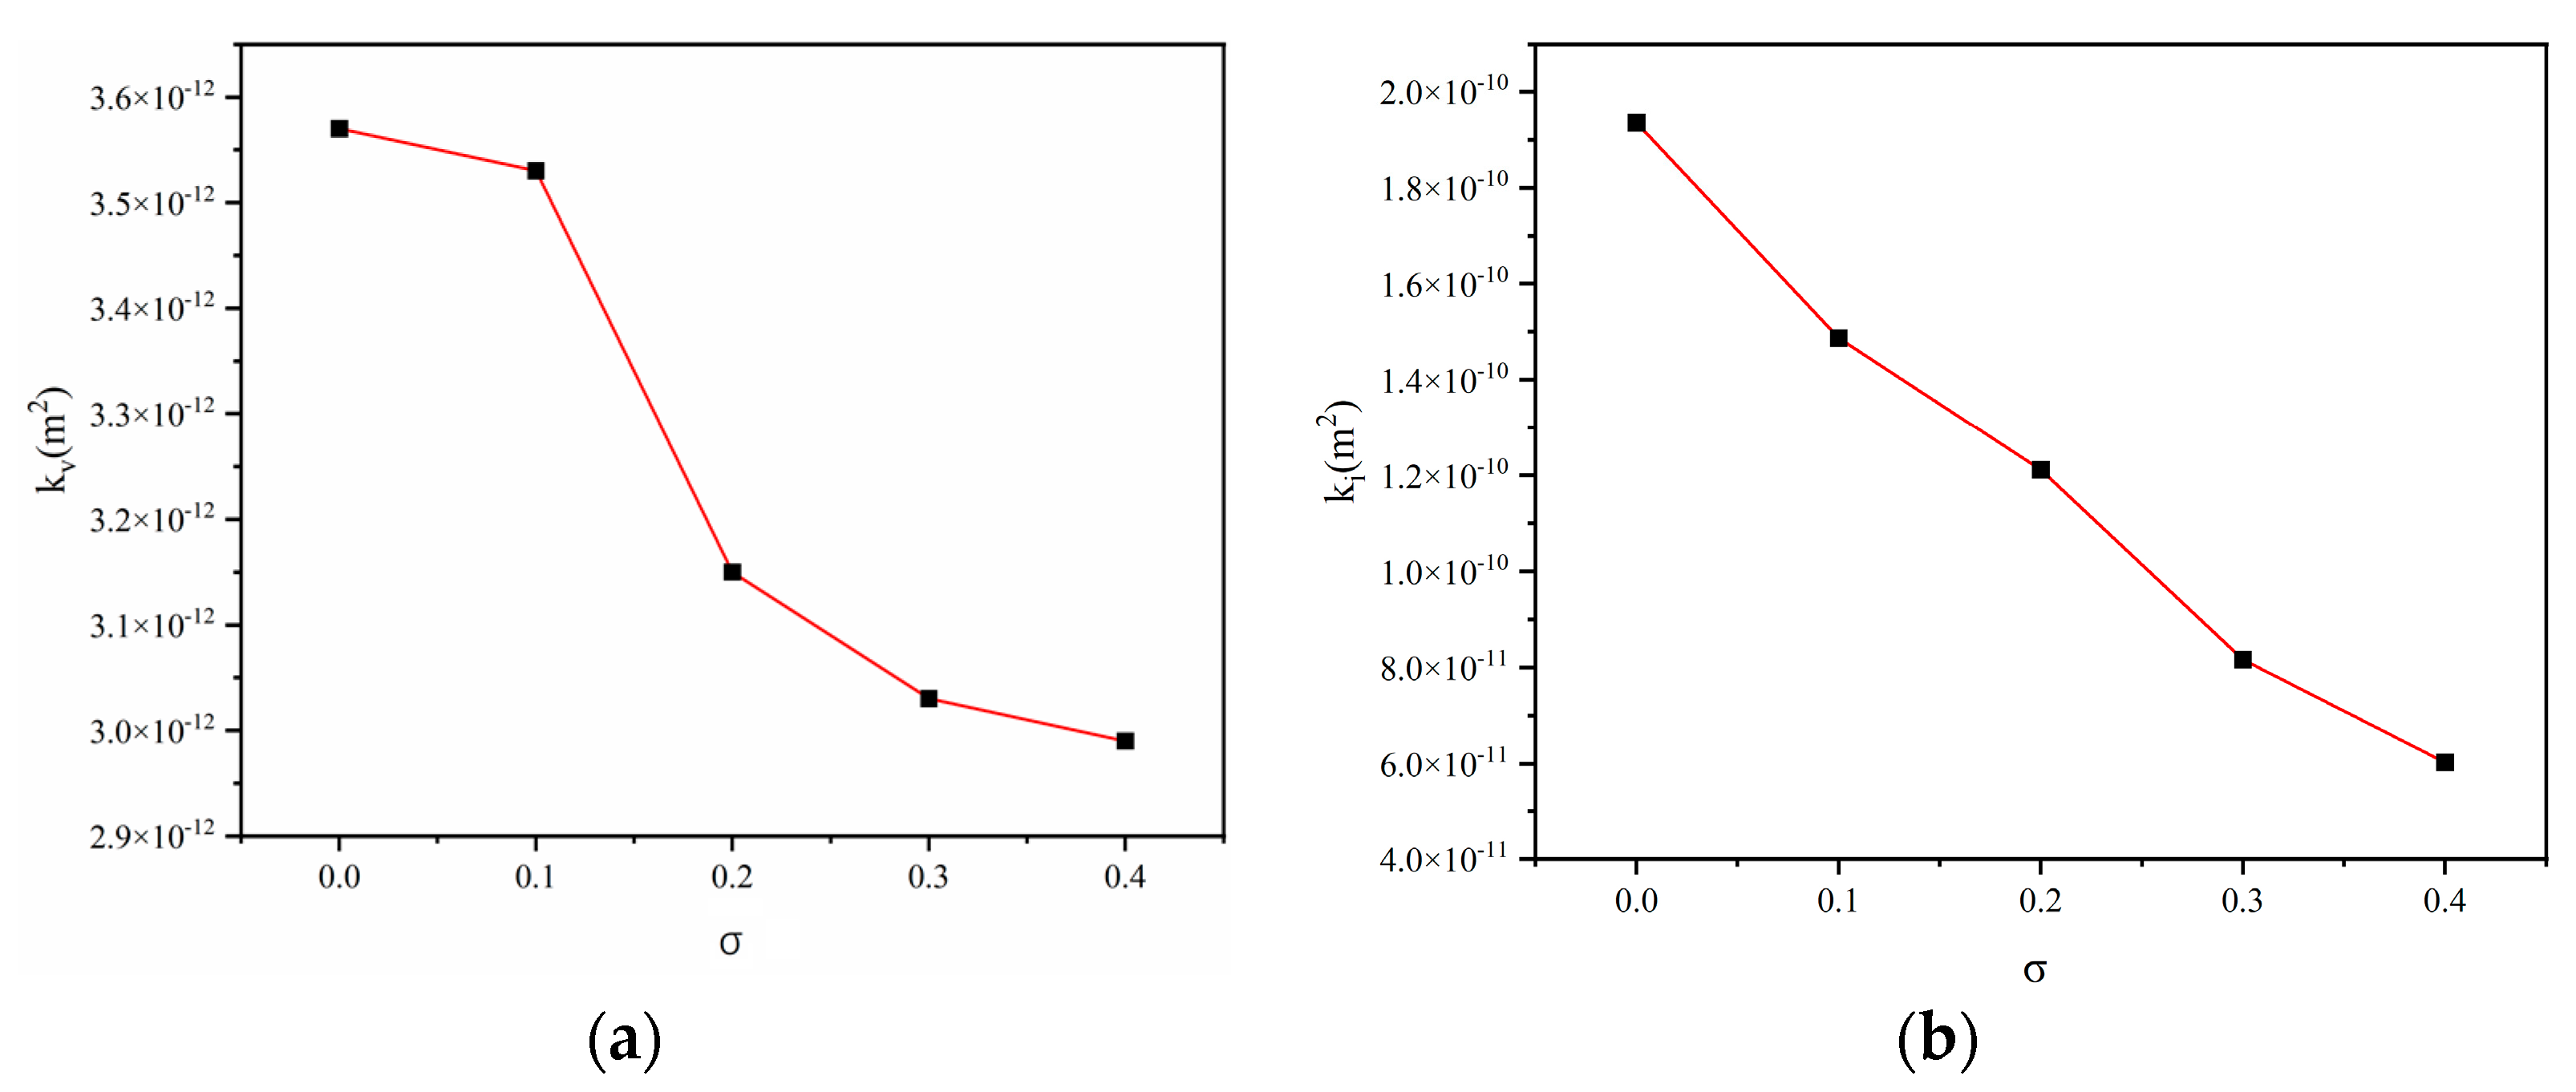
In fractured media, the viscous permeability (
) and inertial permeability (
) can be determined by solving a modified Forchheimer equation. As shown in
Figure 13a,b
decreases with an increase in
σ, suggesting that greater mismatch reduces the fracture aperture, potentially decreasing the effective flow cross-sectional area, thus reducing the space available for fluid flow, increasing flow resistance, and enhancing frictional losses.
also shows a notable decrease as
σ increases, indicating that the increasing mismatch and the resultant changes in the fracture’s geometric shape progressively weaken the fluid’s inertial effects. Fractures with a higher degree of mismatch may promote turbulence or uneven flow velocity distributions in localized areas, further enhancing the flow’s nonlinear characteristics while relatively diminishing the inertial effects.
Figure 14 illustrates that in three-dimensional rough fracture models with differing matching characteristics, a larger σ results in lower congruence between the upper and lower surfaces, necessitating a greater −∇
P to maintain the same flow rate, Q. Increasing mismatch escalates flow resistance, whereas increased permeability mitigates it. With rising σ values, the slope of the relationship curve between flow rate and pressure gradient diminishes. This effect is primarily due to enhanced inertial effects as fluid velocity increases, leading to the prominent non-Darcy flow behaviors in fractures [
45,
46,
47].
3.4. The Impact of Matrix Permeability on Fluid Flow
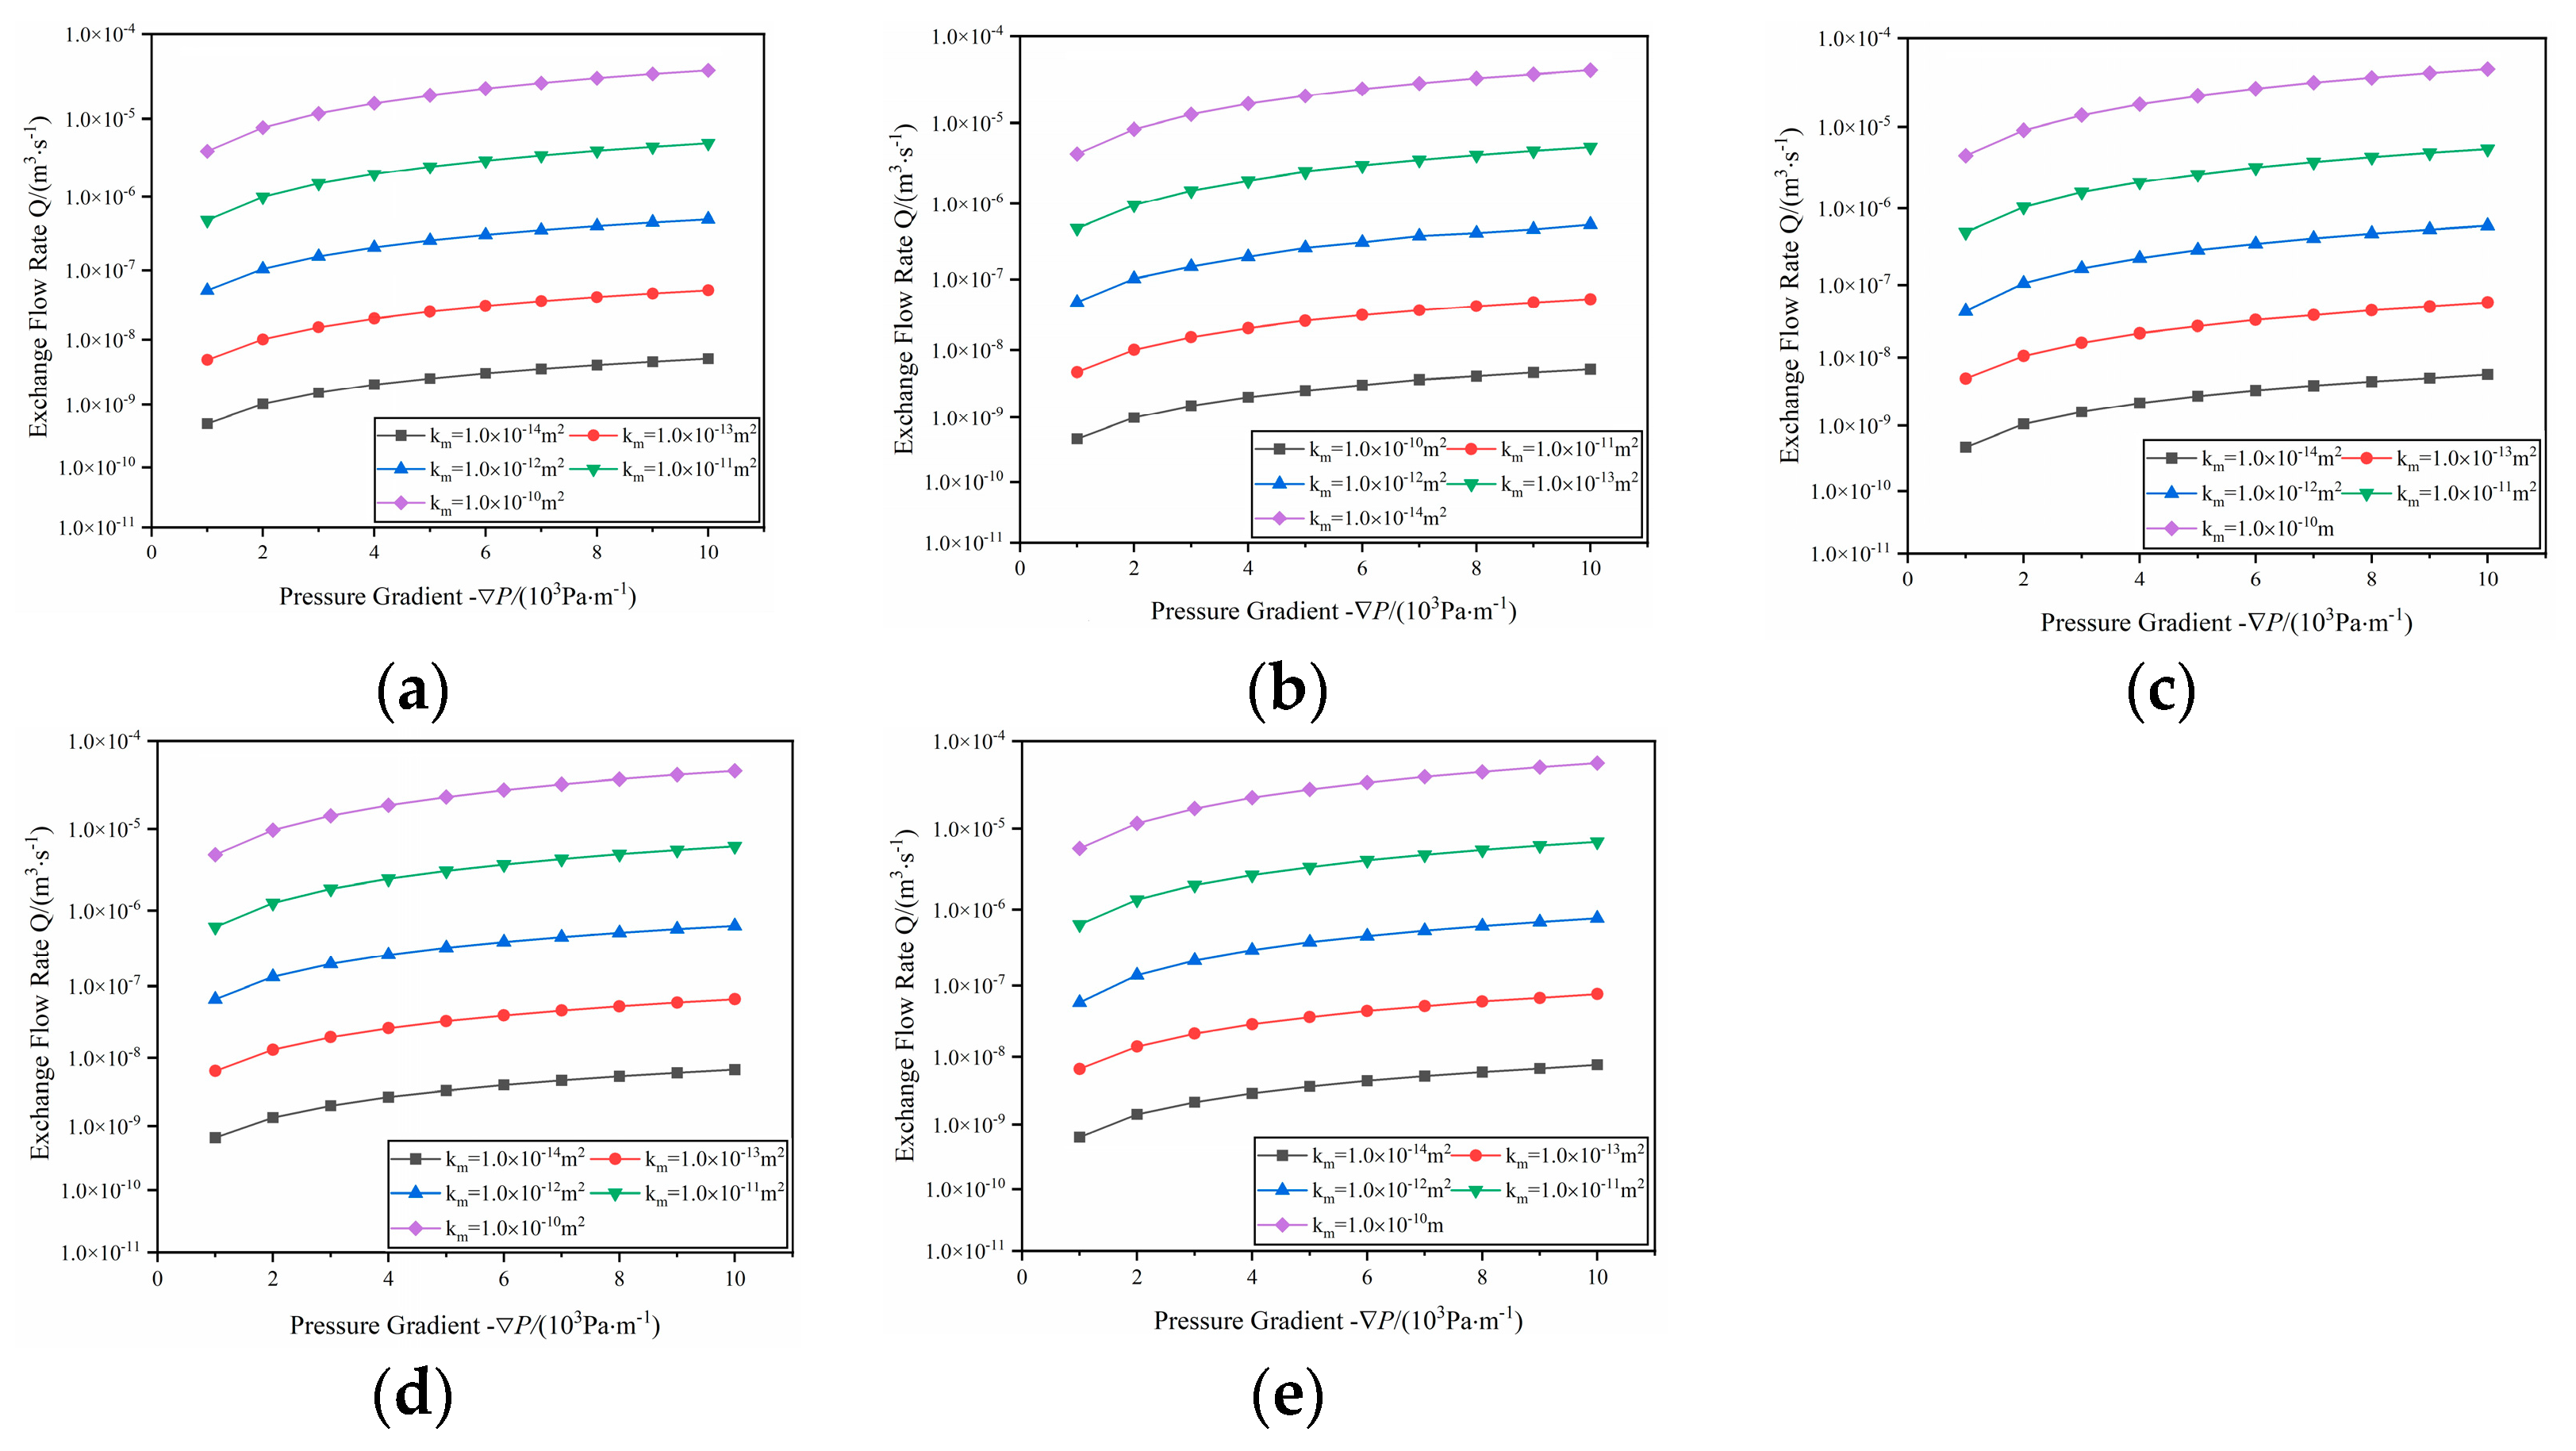
The study also explored the impact of matrix addition on fracture seepage, specifically considering scenarios where the matrix permeability is less than that of the fractures, with permeability magnitudes within five orders of magnitude, each simulated separately.
Figure 15 displays the relationship between the exchange flow rate (Q) and the pressure gradient (−∇
P) for different matrix permeabilities (
) conditions at
σ values of 0.0, 0.1, 0.2, 0.3, and 0.4. The exchange flow rate’s growth is substantial in the initial stages but levels off after a certain pressure difference is reached. When the fracture matching characteristics are the same, an increase in matrix permeability leads to more intense flow exchanges. An increase in matrix permeability suggests that fluids can more readily flow through the matrix’s pores or fractures. At the same pressure gradient, a matrix with higher permeability presents lower resistance to fluids, supports higher flow velocities, and increases the volume of water that flows through a particular area in a given time, thereby increasing the chances for interaction between the water and the matrix.
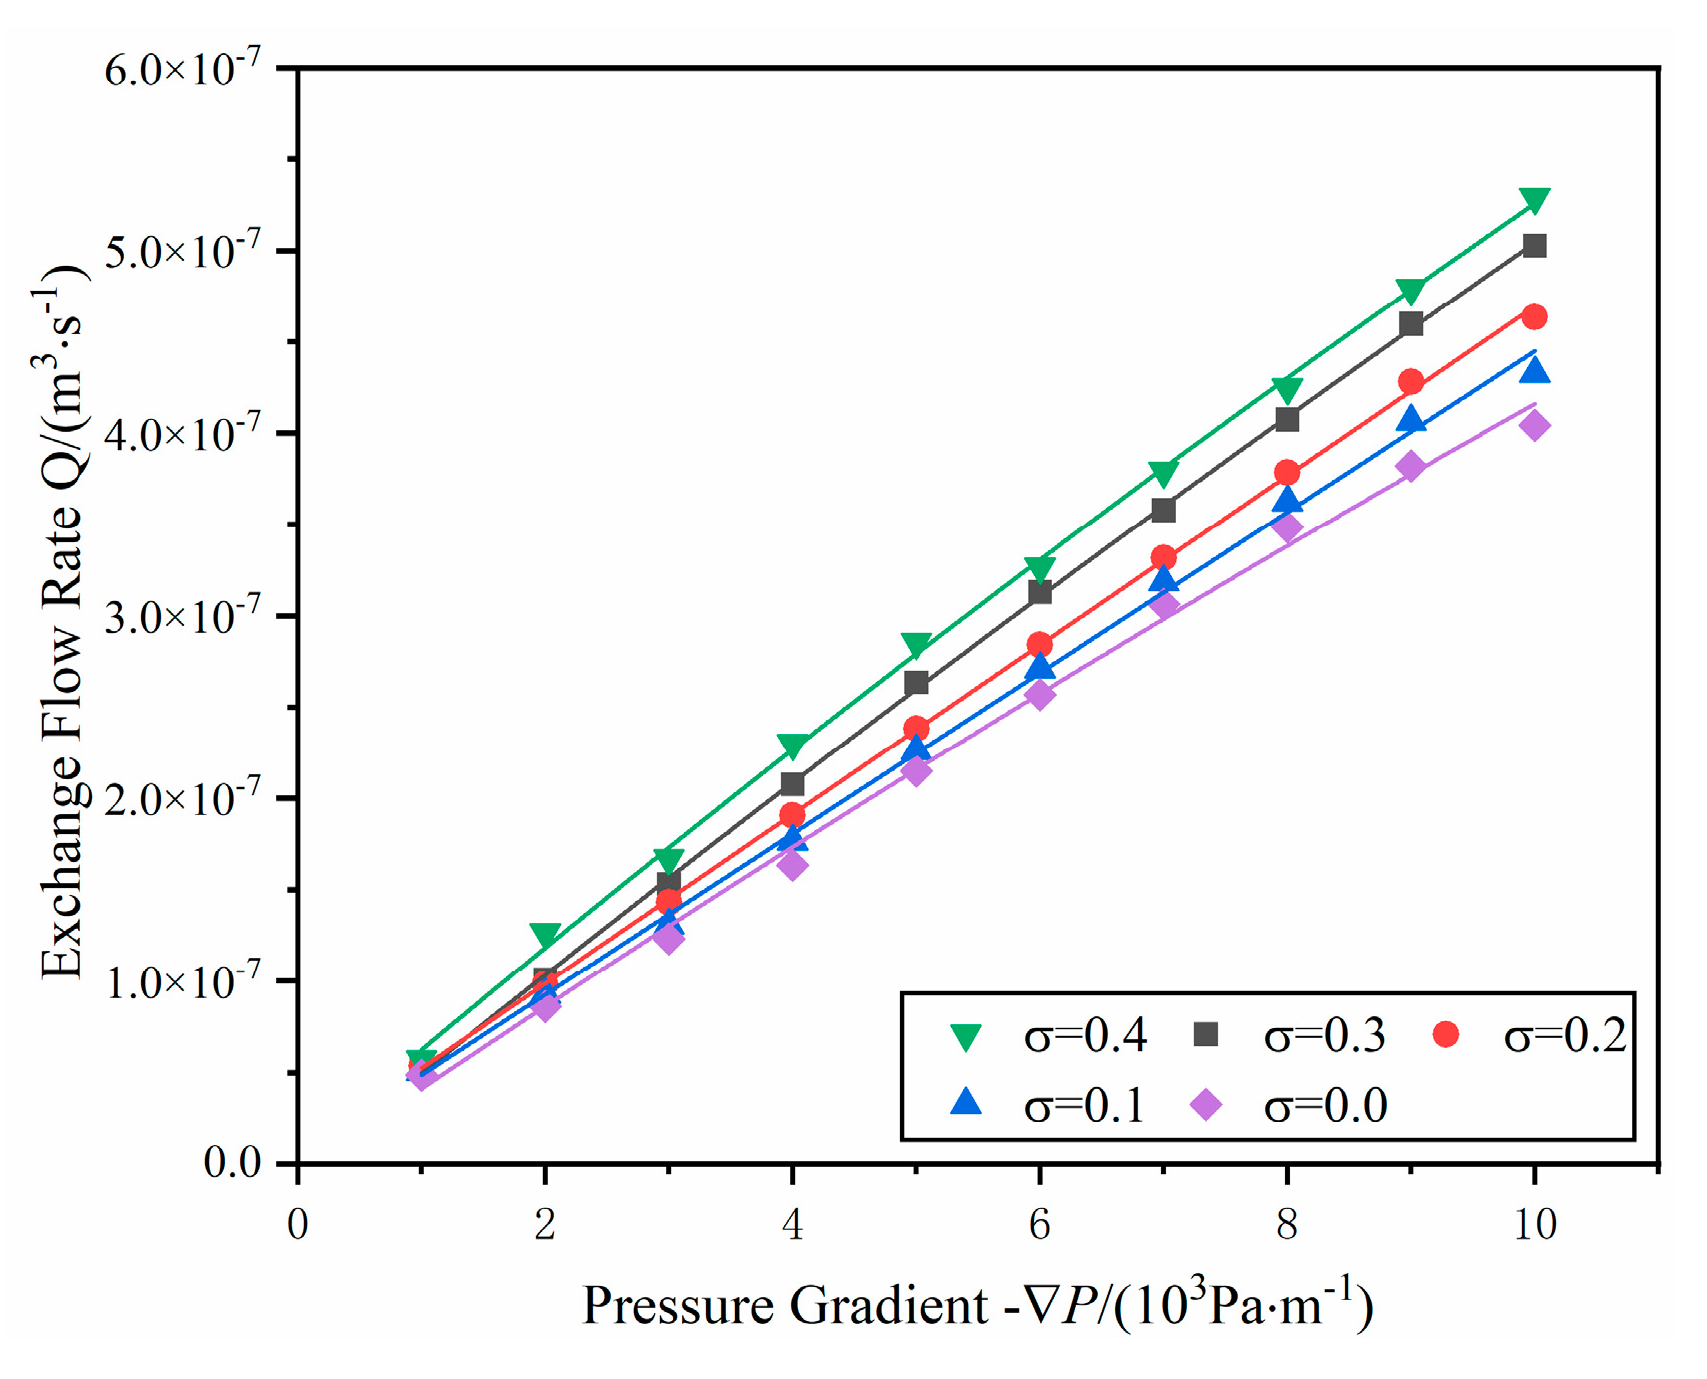
To delve deeper into the effects of matching characteristics on flow exchange, a graph illustrating the relationship between the pressure gradient and flow exchange under various
σ values was constructed, as shown in
Figure 16. Within a certain range of pressure gradients, flow exchange exhibits an increase as the pressure gradient rises. Under the same pressure gradient, an increase in mismatch intensity leads to a more pronounced flow exchange. This is due to the increased mismatch between the upper and lower surfaces of a fracture, resulting in a more complex and uneven internal geometry. This unevenness creates additional micro-obstacles and dead zones, which intensify the turbulence in the fluid flow. Increased turbulence enhances the contact area between the fluid and the fracture surfaces, thus strengthening the fluid-rock interaction.
