Abstract
Water is an essential resource for both rural and agricultural areas; it can be wisely distributed and used in the field to protect daily life, production, the natural environment, and the safety and stability of regional drainage and flood control systems. Our research selected a typical plains rural river network area with agriculture as the main industry to investigate the most effective method of farmland diversion and drainage. We comprehensively planned and transformed the water system flow, water conservation engineering, and the ecological environment in the irrigation area through the reutilization system. The reutilization system’s operation and scheduling design is implemented for four specific periods: the water replenishment cycle, agricultural irrigation, agricultural drainage and the rainy period of the flood season. The research period ranges from 2020 to 2023 after the completion of the system. We used monitoring, the recording of hydraulic equipment parameters and data collection to evaluate the balance of water supply and demand in the study area. At the same time, we have tracked and evaluated the four aspects of water quality enhancement, water conservation and flood control, and agricultural irrigation. The results show that the total agricultural water consumption decreased by 2.9%, and the amount of water saved increased by 9.6%. The current segment creates the rivers’ embankment standards. With a 92% irrigation guarantee rate, the current section forms and the embankment standards of the rivers satisfy the design storage volume and the flood level of one in twenty years. The water quality of all the rivers in the area has decreased by 5~10% compared to the average concentration prior to establishment. This study verifies the comprehensive effect and the suitability of the system by comparing the before and after effects, and provides a scientific basis for the method of efficient recycling and utilization of water resources in the rural plains river network area; we also propose the guidance of increasing the digital twin control and long-term operation mechanism to ensure the long-term stable operation of the technology.
1. Introduction
Reusing farmland drainage has been attempted in many nations, primarily as a means of addressing water scarcity and recycling [1]. For hundreds of years, China has also recycled the drainage water from farmlands. There is a Chinese proverb that states “fertile water does not flow into other people’s fields”, addressing the fact that the domestic wastewater and drainage are initially used for personal use. This activity not only solves the problem of water use in agriculture, but also meets the requirements of crop production. Agricultural drainage is the main form of non-point source pollution from agricultural land, but there are a number of environmental issues associated with this extensive use method, including an irreversible threat to farmland’s water and soil [2,3]. The water still contains heavy metals and salts, in addition to nitrogen, found in phosphorus and nutrients [4]. The inappropriate use of water for irrigation can harm plant growth, cause groundwater pollution, reduce crop yields and quality, and ultimately impact food safety [5,6]. The focus of research on farmland drainage has gradually shifted from the single promotion of agricultural production to the avoidance of negative impacts on the water environment. Through the testing of Murrumbidgee irrigation drainage in southeast Australia, it was found that controlling the depth of water level in the river channel could reduce the drainage volume and the salt in the drainage; the salt load was reduced by 49% compared with the uncontrolled conditions [7]. Wesstrom [8] conducted a trial in southwestern Sweden and found that controlled drainage reduced nitrogen loss from fields, increased crop nitrogen uptake by 3–14 kg/hm2, increased yields by 2–18%, and significantly improved nitrogen use efficiency compared with free drainage. The results of experimental research in Quebec, Canada [9] show that, like water-saving irrigation measures, controlled drainage can reduce irrigation water consumption, not only improving the efficiency of water use, but also incorporating the advantages of low investment and low cost. Borin [10] conducted a 5-year drainage test, focusing on the surface flow wetland treatment of farmland, and found that more than 50% of the total nitrogen of farmland drainage into the wetland was absorbed by plants, more than 20% of nitrogen was stored in the soil, and a small portion of the nitrogen created through the free drainage was also stored in the soil. More than 50% of the total nitrogen of the drainage water entering the wetland was absorbed by plants, more than 20% of the nitrogen was stored in the soil, and a small portion of the nitrogen was lost through denitrification.
At present, many domestic and foreign studies remain in small fields and indoor test plots; the control measures and control variables adopted are relatively singular, lacking large-scale engineering practice verification, so it is difficult to provide guidance for the adaptability of the technology. Farmland drainage in irrigation areas is a complete and complex system, and the success or failure of one or more technologies needs to be analyzed from various aspects. Therefore, only through the practice of specific projects and long-term observation can we scientifically master the regulation and use of farmland drainage methods to achieve the efficient of water resources.
China is a traditional agricultural country. In the southern region where rice is farmed as a staple crop, large amounts of water is pumped into the fields every year to irrigate them during the summer sowing season, which lasts from May to June. In order to facilitate cultivation and seedling planting, which enables the fields to extend to up to two thirds of the embankment. The rice fields are then drained and dried, starting in early July. The water quality significantly increases during the rainy season, when water that has accumulated in the fields is drained into the nearby rivers [11]. Many fertilizers and pesticides are applied during irrigation to promote healthy plant growth. Fertilizer absorption, especially nitrogen, phosphorus and potassium, is only 20~30% during the growing season of crops like rice [12,13]. While the remaining nitrogen and phosphorus seep into the nearby water bodies as the fields drain, the remaining portion stays in the shallow soil layer and eventually enters the deep water and subsurface through air and water migration [14,15]. However, depending on the soil conditions, this process typically takes several months, or even longer [16]. After the drainage phase, it is time to irrigate the rice and vegetables; we channel the water from the irrigation pumping station near the nearby river into ditches, and then disperse it over the cultivated areas. This repeated drainage and distribution process not only increases the rate of water loss during transportation, but also consumes energy [17]. In addition, farmland drainage affects the nearby water intake channel, and the irrigation of polluted water on farmland results in secondary damage to soil and crops.
Our research focuses on constructing an ecological river in Jiangsu Province. We select Rugao, a typical town with high sandy soil in the lower reaches of the Yangtze River, as the research and demonstration area, using a watershed and irrigation area within the town as a demonstration area to reshape the village water pattern and build a resource regulation system for farmland drainage. For the past three years, we have been conducting operations, testing, and monitoring on this system. We conducted tests and assessments to determine its appropriateness, durability, and efficiency in four different operational scenarios: the water replenishment cycle, agricultural irrigation, agricultural drainage, and the flood period. By monitoring the changes in water quantity and quality in the region, the degree of reduction in farmland surface source pollutants, and the growth of crops and drainage conditions in the field, the aim of our research is to scientifically evaluate the adaptability and the problems of this new system, integrate a complete set of technical systems for the utilization of farmland drainage resources, and solve the problems of water resources and pollution in similar irrigation areas.
This study focuses on a typical case of practice and research. The primary research material and novel elements of this study are outlined below:
Research content:
(i) Planning and redesign of the village water system.
(ii)Design and construction of hydraulic systems and ecological rehabilitation measures.
(iii) System operation and adjustment.
Among the three research topics mentioned above, we concentrate on the following innovative aspects:
(i) Considerations and strategies for the efficient and reasonable utilization of agricultural drainage water resources.
(ii) Adaptability of water pollution control methods and agricultural irrigation in areas with high sand content.
(iii) Regulation methods, replication, and a comprehensive evaluation of the new system.
2. Materials and Methods
2.1. Study Area
Our investigation took place in Banjing Town, Rugao City, China. Jiangsu Province serves as a significant hub for agriculture, encompassing crop production and animal husbandry. The research focuses on the Qunyang (QY) River Basin, located in Banjing Town at coordinates 120°24′933″ E, 32°17′448″ N. The basin has an area of 6.02 km2. The Rutai (RT) Canal is located to the north; the Zhangzhuang (ZZ) River is located to the south; the Juwang (JW) and Jiangdai (JD) Rivers are located to the west; and the Jiaogang (JG) River is located to the east (Figure 1). It is a conventional network basin. Based on the classification of river management levels set by the Ministry of Water Resources of the People’s Republic of China (MWR), the studied basin has one river channel classified as level Ⅲ, 22 river channels classified as level Ⅳ, and two unlicensed river channels, according to the MWR’s numbering system.
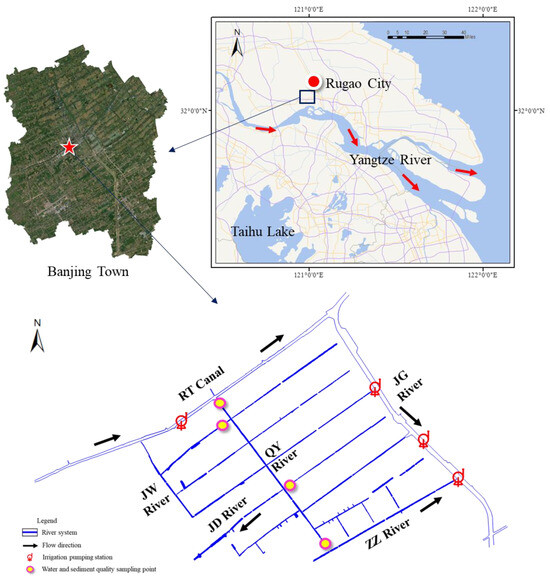
Figure 1.
Location of the study area.
2.1.1. Hydrology Characteristics and Water Resources
The climate in Banjing is mild, with an average annual temperature of 15.3 °C and four distinct seasons. The rainy season is mainly from June to September, with a maximum daily rainfall of 115.1 mm. In terms of water resource use structure, Rugao has 3.98 × 10⁸ m3 of surface water resources, and 5.13 × 10⁸ m3 of agricultural irrigation water, accounting for 47.10% of total water resource use. The actual irrigated area is 6.16 × 10⁴ acres with 349.2 m3/AC of agricultural irrigation water. The effective utilization coefficient of the irrigation water is 0.65, while the domestic water consumption of urban residents is 133.92 L/d.
2.1.2. Geology Condition
Banjing, located in the southwest corner of Rugao, occupies the central region of high sandy soil. To guarantee the safety and stability of the new system and gain a thorough understanding of the soil quality in the research area, we hired appropriate organizations to carry out geological studies in the region (Figure 2).
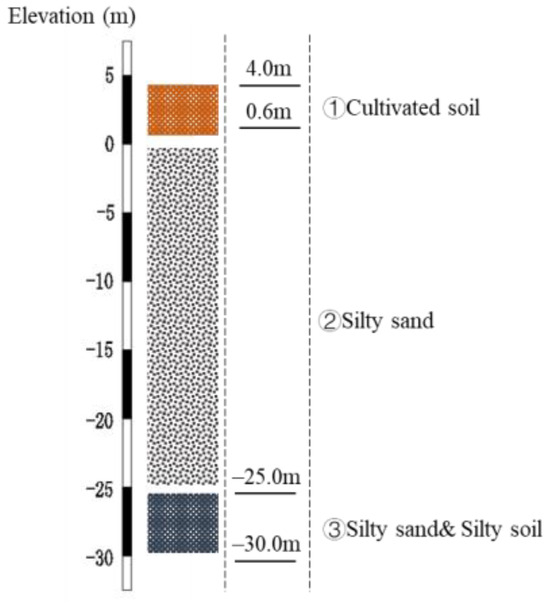
Figure 2.
Geostructural stratification of the study area.
2.1.3. Water Environmental Quality
Our objective is to evaluate the water quality conditions at the research location and develop a comprehensive system. In 2020, we gathered and examined samples of water quality and sediment. Owing to the vast number of rivers in the study area, we adhered to the regional and category control principle. We have chosen the north and south inlets of a class Ⅲ river and two level Ⅳ residential rivers and production rivers to be the monitoring points. At each point, we collected three samples of sediment and water quality near the control cross section using a socketed stainless steel column sampler for the sediment and a gravity-type transparent glass barrel sampler for the water quality. Under the direction of our on-site staff, our professional organization conducts all experiments, data recording, and sampling. Three sets of parallel tests were performed on the water quality samples, and one set of tests was carried out to determine the contaminant content of each layer, respectively, after the sediment samples had been separated into contaminated, over-contaminated, and normal layers based on their vertical distribution. The results show that we classified the average water quality of the rivers as category V. Additionally, several level Ⅱ rivers exhibited water quality that was even poorer than category V (Table 1).

Table 1.
Water quality and sediment testing data.
2.2. Methods
2.2.1. System Parameter Determination and Construction
Residents in our research area primarily excavate the water systems. The extended lifespan, inadequate building standards, and insufficient maintenance have led to weed overgrowth and bank collapses in numerous rivers and ditches, significantly impairing the system’s functionality.
Therefore, the new system must reshape the water pattern, primarily taking into account the four directions listed below (Table 2):
Table 2.
System parameter setting.
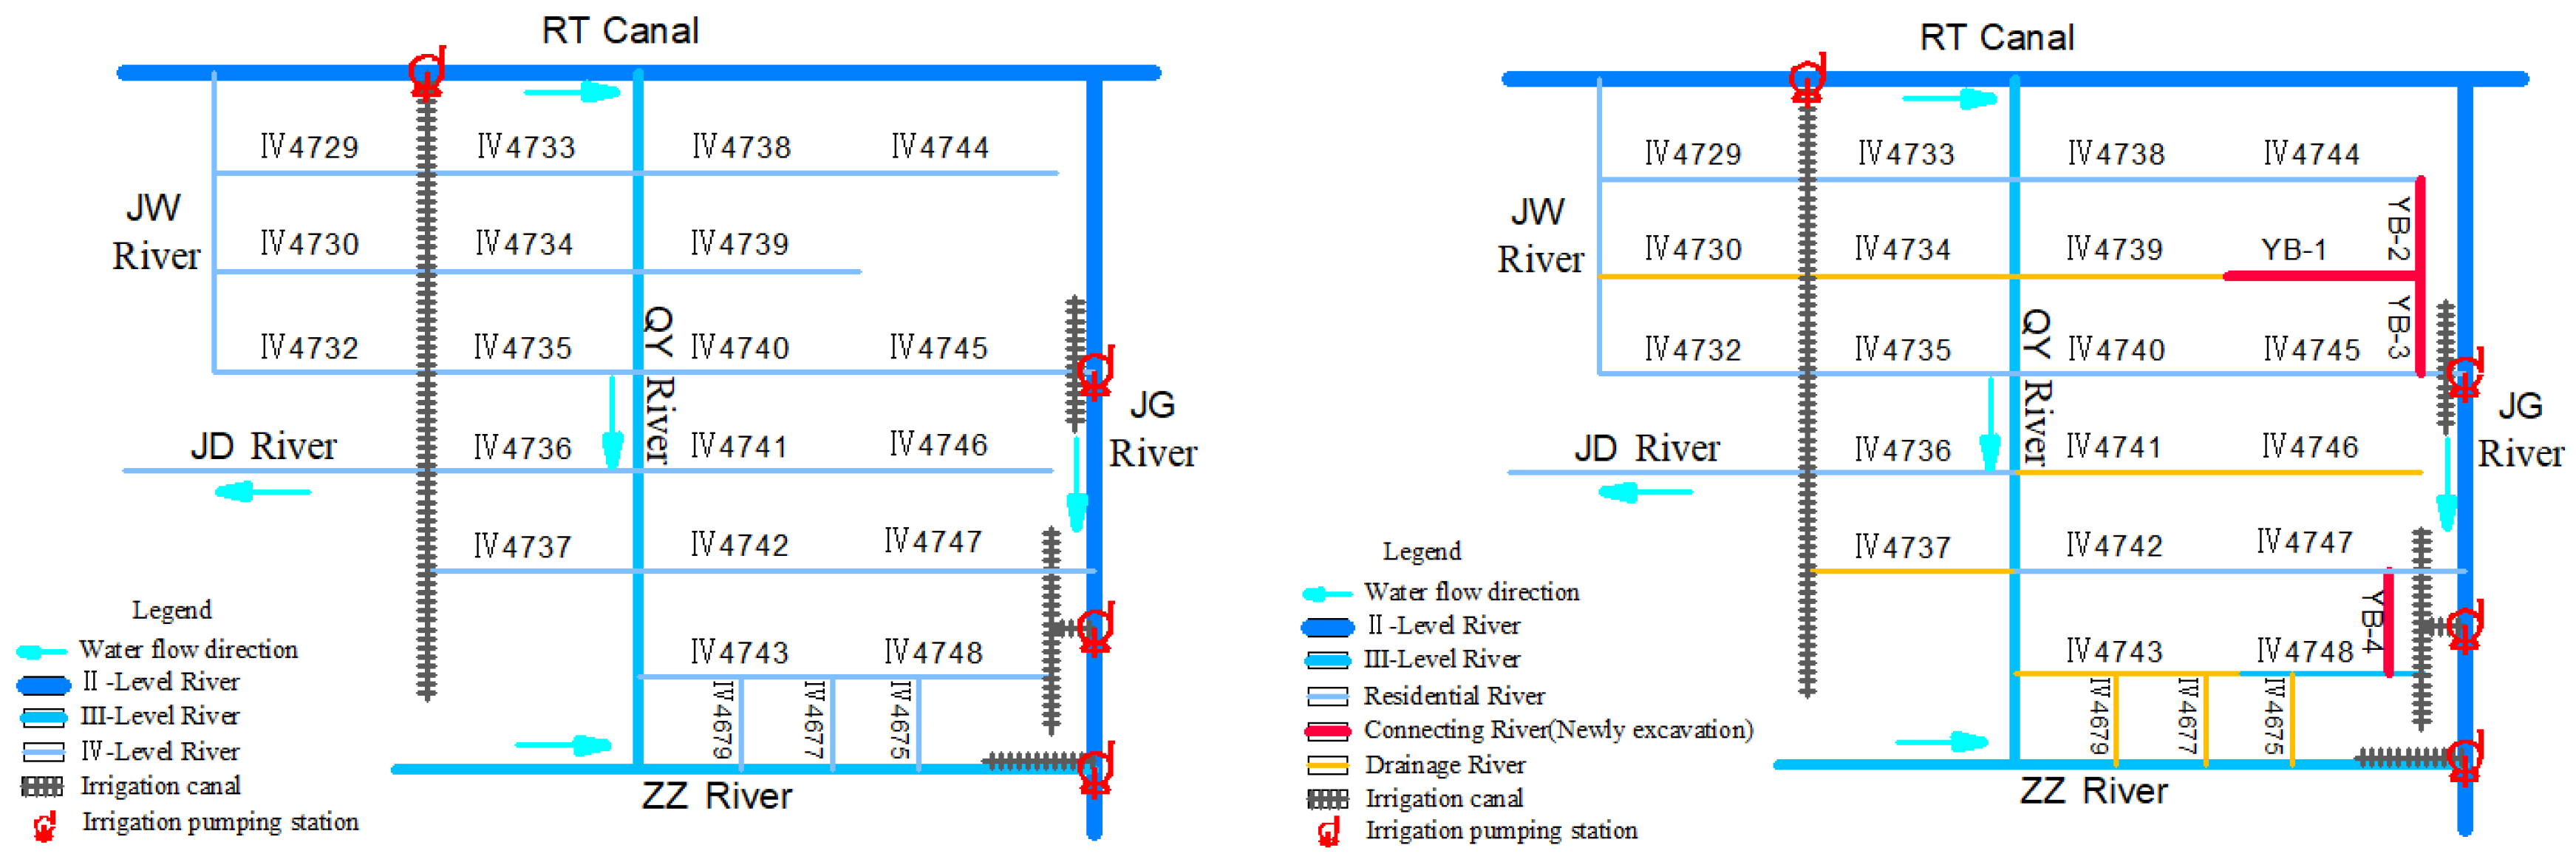
After analyzing the four features mentioned above and considering the local naming conventions, our research categorizes the 26 rivers in the study region into drainage rivers and residential rivers based on their respective functions. The drainage rivers serve the purpose of managing the drainage and rainwater from the neighboring agricultural area, fulfilling their role in the drainage process. The residential rivers supply water to the houses in the river communities and facilitate agricultural irrigation. Based on the above two categories of functional classification principles, the research area divides the rivers into 13 residential and 13 drainage rivers (Figure 3).
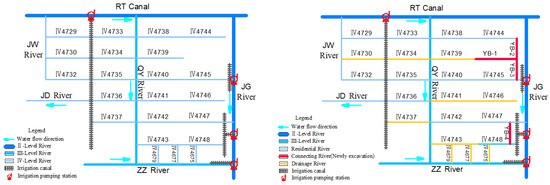
Figure 3.
Original water system (left), optimized water system (right).
2.2.2. Living Water Regulation
1. Irrigation and drainage canal system
We have implemented two modifications to the irrigation and drainage infrastructure inside the designated study area:
(i) Modifying the pumping and drainage techniques to enhance the irrigation flow in order to include larger regions and meet production requirements.
(ii) Realigning the location of the irrigation and drainage pumping station, which is crucial to optimize its capabilities in water replenishment, circulation, drainage, and purification.
To accomplish the aforementioned objectives, we have undertaken the following tasks (Figure 4):
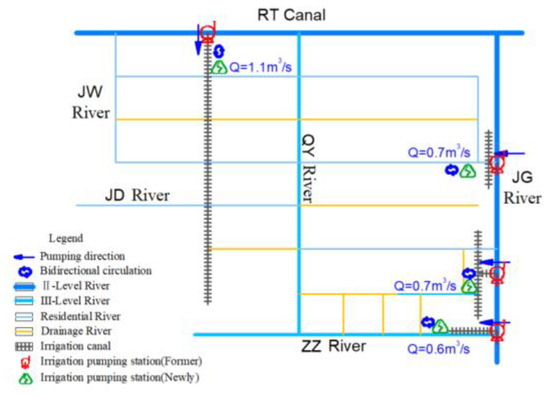
Figure 4.
Adjustment of irrigation pumping station.
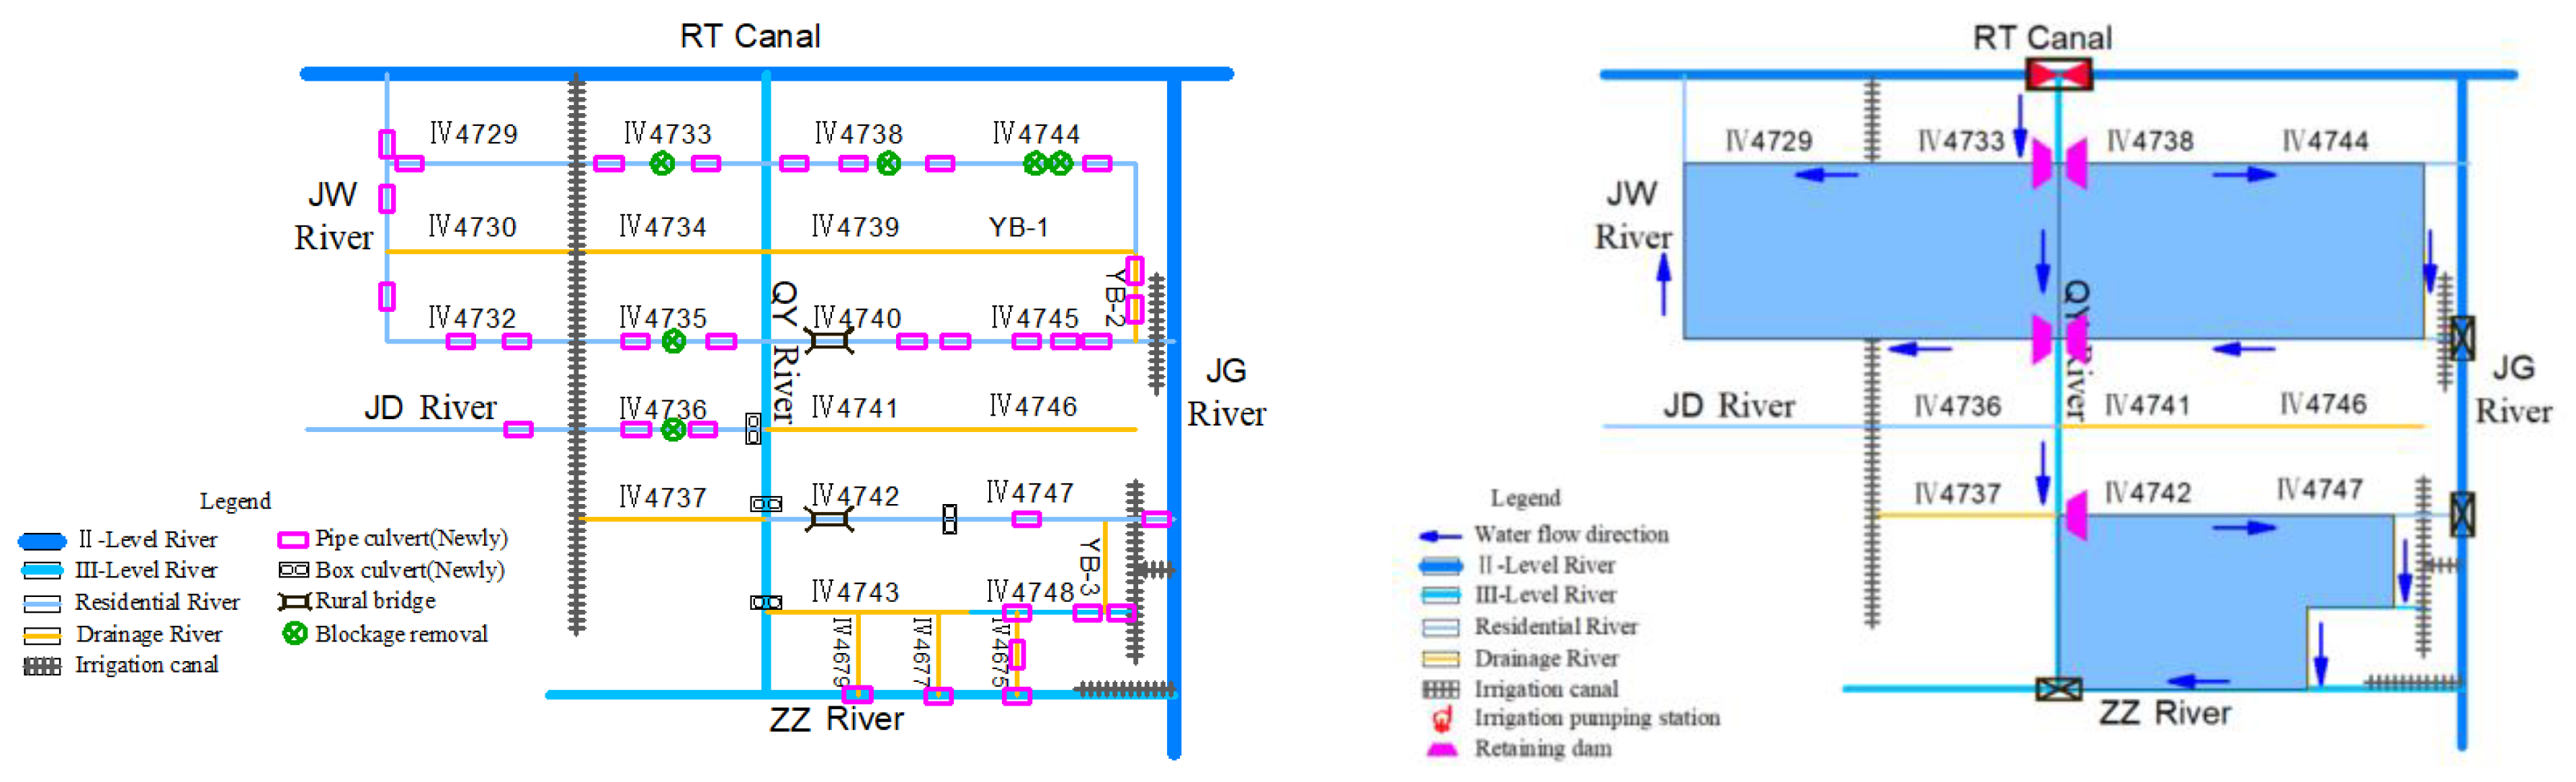
(i) Irrigation canals are categorized into main, branch, bucket, and agricultural canals based on their responsibility for irrigating specific areas. It is important to note that irrigation and drainage canals are distinct from each other. The pumping station’s discharge basin links the primary canals. The secondary canals are composed of trapezoidal concrete channels (1.0~1.2 m wide at the top, 0.3~1.0 m deep) with a minimum water transfer efficiency of 90%. The branch, bucket, and agricultural canals are in close proximity to each other. The choice of soil canals depends on the ridge’s characteristics. We have successfully conserved the original ancient canals, eradicated certain ditches that were created by local inhabitants, and reinstated the original agricultural land. Drainage canals employ a mixture of concrete and pipes, including a steeper side slope coefficient compared to irrigation canals. The design incorporates a specific gradient of 0.1 and necessitates a minimum flow rate of 50% of the main canals.
(ii) The initial three irrigation and drainage pumping stations were situated at the confluence of the Ⅱ and Ⅳ level rivers on the regional boundary, primarily utilizing the Ⅱ level river as a water source for irrigation. We have relocated the pumping station to the point where the neighboring irrigation main channel intersects with the river at the Ⅳ level. We also replaced the unidirectional water pump in the pumping station with a bidirectional one. The modified pipeline maintains the water intake capability while enhancing the water pump’s flow rate.
2. Internal and external water systems
Several issues exist, including inadequate connectivity and the lack of a fully functional water supply. Several rivers remain unconnected, with occasional obstructions between them. The area where the bridge connects is filled with a large amount of sediment, the culvert has a limited diameter, and the bottom of the pipe is too high, leading to inadequate transportation and drainage between the water systems. The water recharge pattern is undetermined, with certain rivers experiencing inadequate water volume and flow rate. The obstruction of numerous rivers, the sluggish replenishment of freshwater sources, and the inadequate capacity of water resources persist.
One of our primary objectives was to enhance the water system. First, we aimed to elevate the water level. Second, we focused on removing obstructions. Third, we sought to establish a cascading water level. Finally, we ensured the smooth circulation of running water.
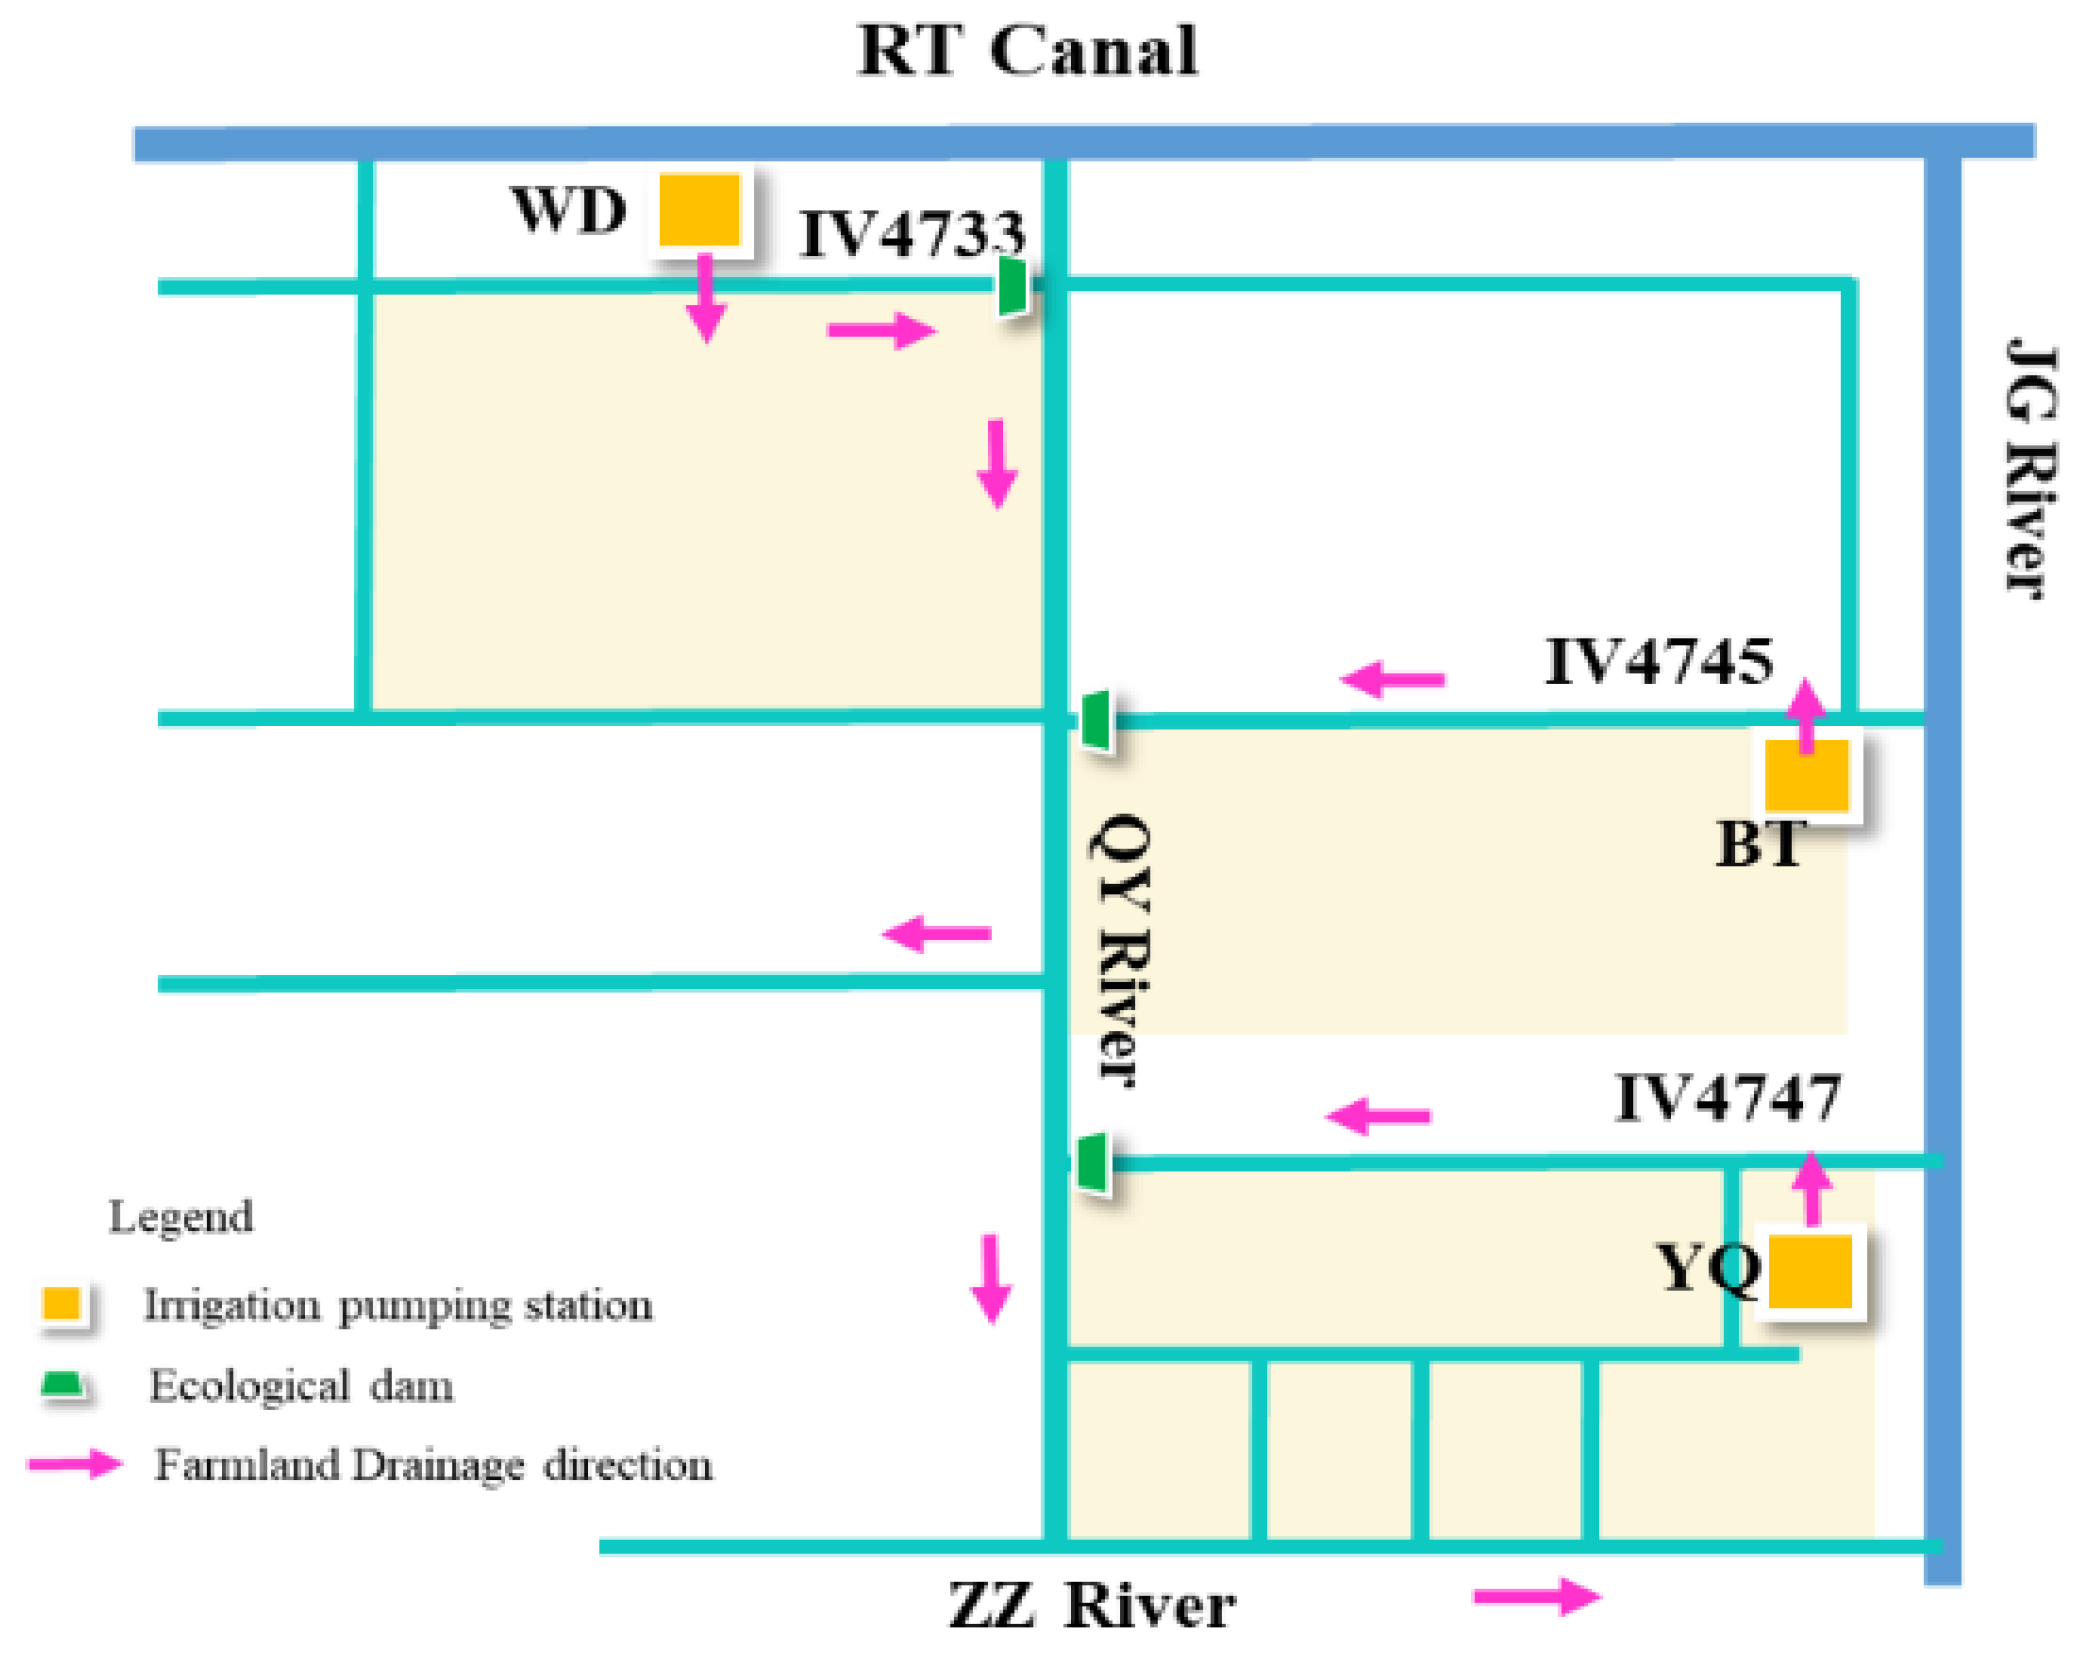
Pre-production work: (1) Excavate and remove sediment from all river channels, ensuring a specified depth of 2.0 m for drainage rivers and 1.0 m for residential rivers. (2) Revise any culvert pipes with a diameter less than 1.2 m. (3) To improve water flow capacity, local individuals must dismantle six illegally built dams in the river. Box culverts and bridges should replace these dams. (4) Construct a novel waterway by digging and linking Ⅳ4745 with YB-2 (Figure 5).
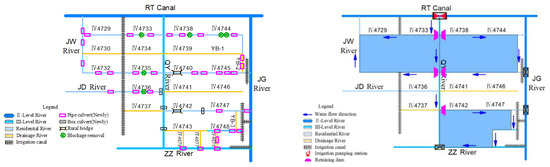
Figure 5.
Pre-production (left), New construction (right).
The flat geography of the research region hinders the utilization of natural elevation changes to create a state of natural water flow. Consequently, it is necessary to construct artificial hydraulic structures in order to control it.
New constructions: (1) One pump station: located at the estuary of the RT Canal and QY River. (2) Three sluice: these are situated where the JG River and ZZ River meet the level Ⅳ residential river. Between the internal and external water systems, these sluices create an adjustable water system that is mostly autonomous but connected, keeping the internal water system’s water level constant at 3.40 m. (3) Drop weir: with movable gates above, located at the mouth of the residential river (Figure 5).
3. Revetment Engineering
Revetment serves as the fundamental basis for ensuring the entire system’s secure and steady operation [18]. In accordance with the geological in the study area, we have chosen an advanced revetment technique called “insert plate” that is specifically suitable for places with heavy sand soil (Figure 6). This technology is particularly effective in countering the centrifugal forces exerted on the soil, which have a shape resembling the Chinese character “工”. For this technology to work, the minimum grade of concrete that can be poured is C60, the pre-compression stress is σPC = 10.21 N/mm2, the bending bearing capacity is M0 = 311 kN·m, the compressive bearing capacity is Rp = 2730 kN, and the shear bearing capacity is Q = 205 kN. This structure’s affordability allows it to adapt effectively to the hydrostatic pressure of water on the upstream surface, the tensile forces of the backfill soil, and the variations in these forces, thereby enhancing the overall stability of the shoreline [19,20].
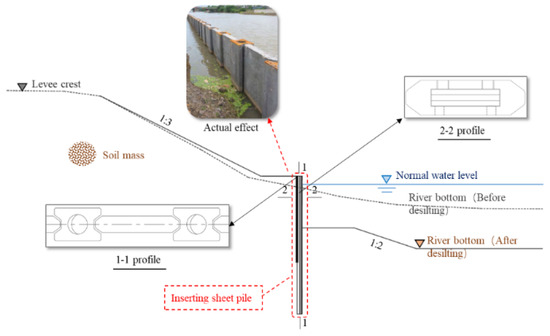
Figure 6.
Structural diagram of the revetment.
2.2.3. Ecological Recycling
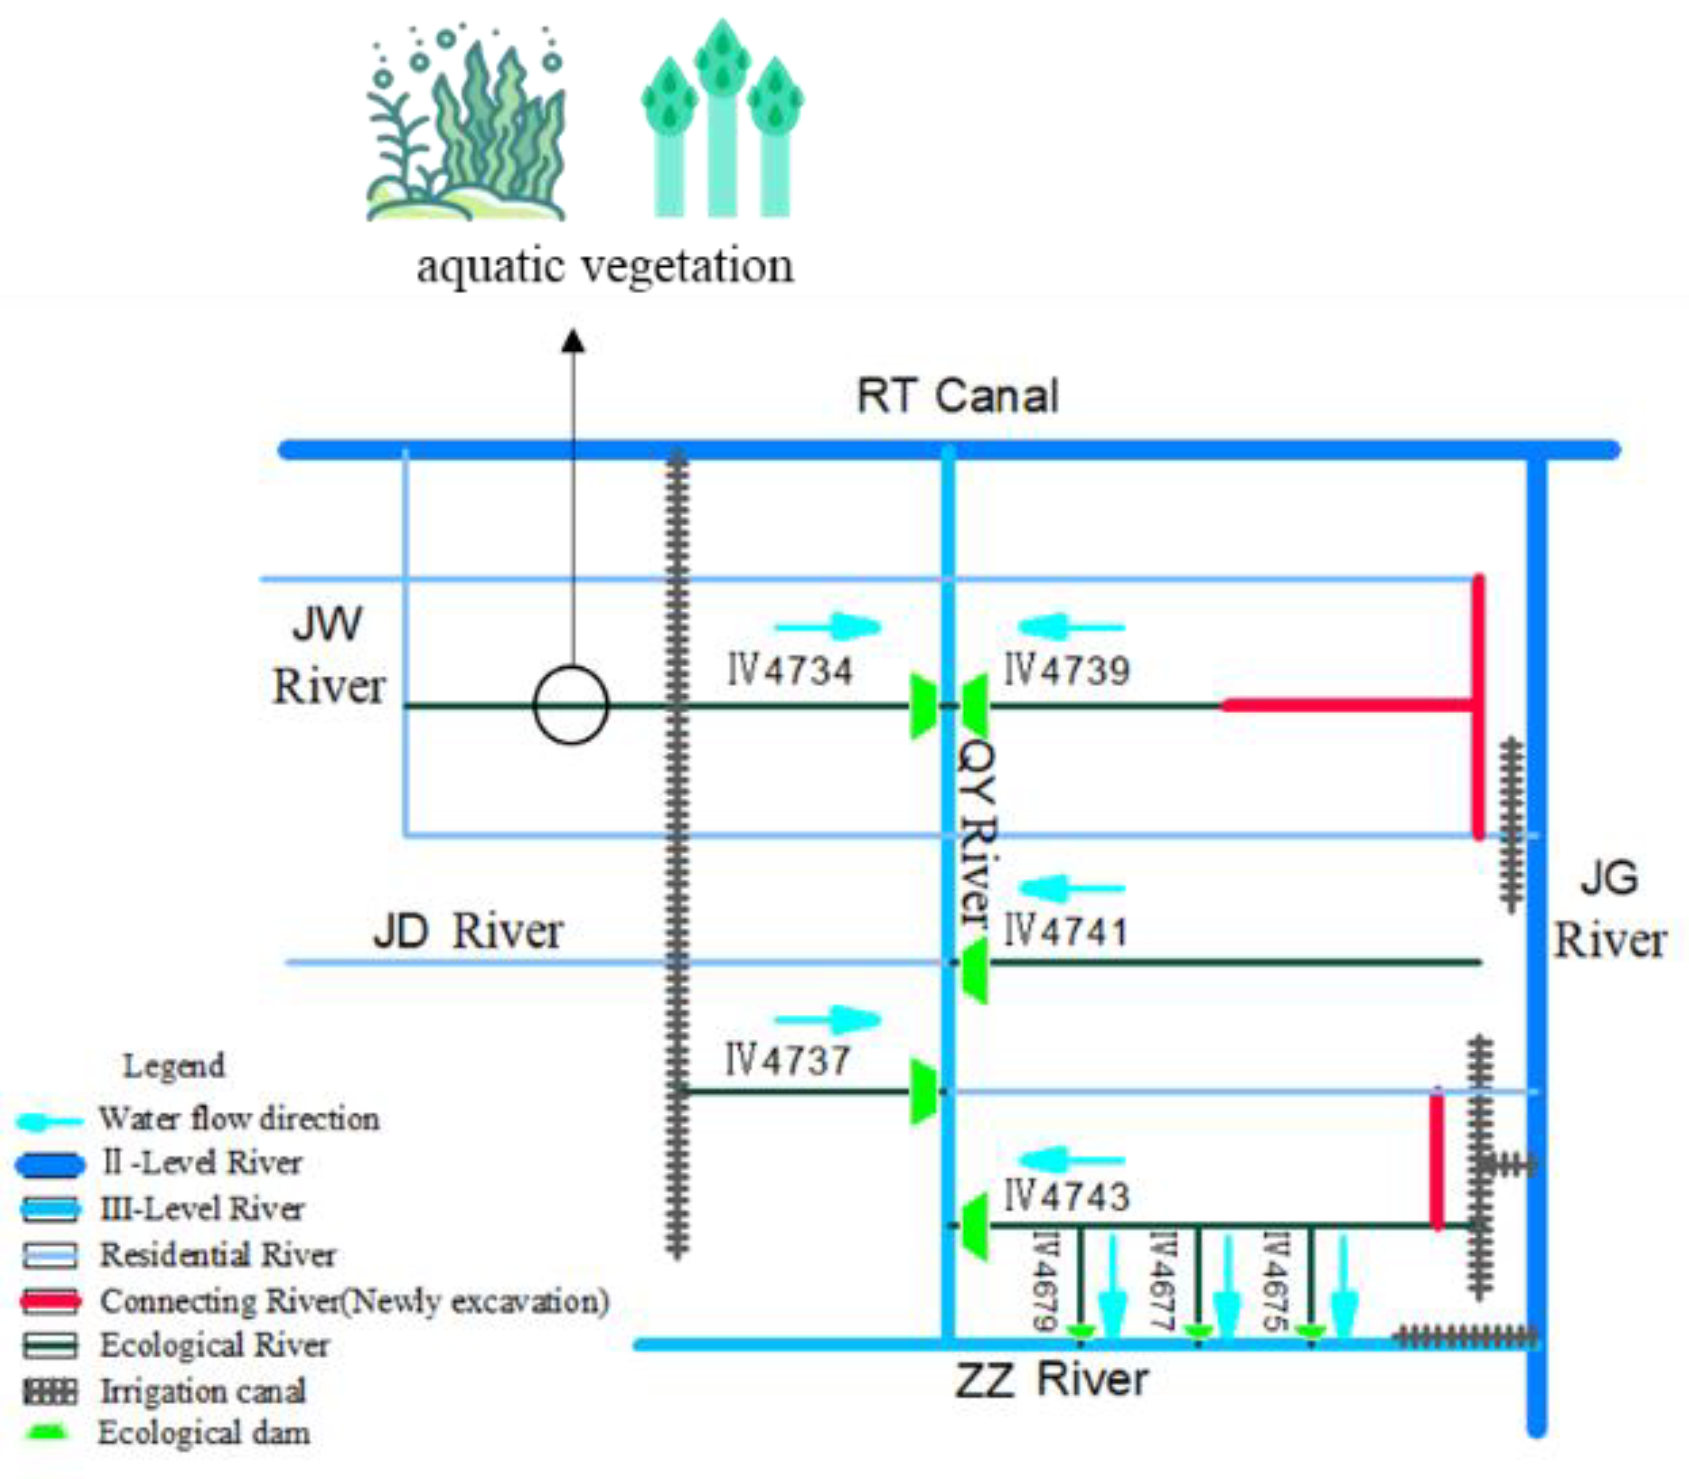
Agricultural drainage is a significant contributor to non-point-source pollution. The previous approach to reusing farmland drainage was to use traditional crops and fields, which had the ability to absorb and decompose pollutants [21]. However, the slow rate of pollutant degradation is a result of the low rate at which crops absorb pollutants, as well as the impact of soil permeability on agricultural practices. Therefore, to evenly allocate the expenses associated with pollution and soil degradation, it is necessary to implement a combination of ecological restoration methods. The drainage rivers functioned as the main conduit for ecological circulation and cleansing. To reduce the levels and amount of non-point-source pollutants during the rainy season, we will implement ecological purification methods [22]. These methods include restoring aquatic vegetation communities, creating buffer zones with plants along riversides, and constructing ecological filter dams at the meeting points of water systems [23,24]. We transformed the terminal portion of these into environmentally friendly ditches, measuring 5~10 m, designed for draining fields (Figure 7). These measures improve the quality of agricultural drainage resource reuse and help restore the natural environment along rivers [25].
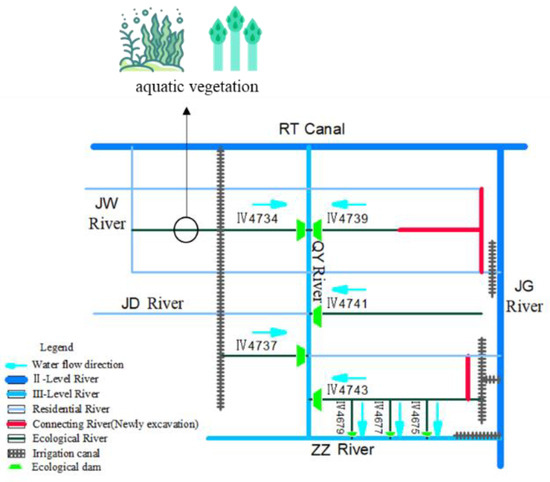
Figure 7.
Ecological recycling system.
2.3. Quality Assurance and Control
Regulations pertaining to quality control and assurance state that every 20 or batch of samples tested for water quality should include at least one laboratory blank and one parallel sample. The standard curve should be plotted with at least six concentration points, and the relative error between the point’s concentration and the standard curve should be within ±10% [26]. For every batch of sediment samples, at least two blank samples and one parallel sample must be examined, and the sample determination findings’ relative variance must not exceed ±25% [27].
The hydrological data testing was duly conducted in accordance with the specification for geodesic survey in hydrology [28]. The water resources data in the Discussion section were obtained from local water resource bulletins and water authorities.
3. Results
3.1. Operating Condition Testing
After building the system, we analyze the flow direction and allocate it based on the characteristics of the internal and external water systems. By implementing a variety of technical requirements, we can provide a range of operation scheduling techniques that cater to four distinct operating scenarios. The primary concept can be summarized as follows: The river’s general flow direction is from north to south. There are two recharge paths, and the water level follows a three-stage ladder pattern, including the river’s fourth level. The main river receives a recharge periodically, whereas the irrigation channel receives continuous replenishment. A drop weir is used to create the ladder water level, and a diversion sluice gate controls the amount of water. The working requirements for system debugging are outlined as follows:
- (1)
- Drought and normal period: To ensure an adequate water supply for domestic use in village households, the water amount will be increased. This will be achieved by utilizing newly constructed gate stations and renovated irrigation pumping stations to replenish water from the surrounding river into the internal main stream of the of the QY River and the level Ⅳ residential river. Additionally, this approach will also enhance the ecological flow of the drainage river.
- (2)
- Agricultural irrigation period: Utilizing the rearranged canal system and repositioned irrigation pumping stations to extract water to enter the acreage in order to ensure agricultural production.
- (3)
- Farmland drainage period: The drainage canal system routes stagnant field water through a series of collection and purification facilities, thereby reducing the initial pollution load into the drainage river. The drainage ditch then uses depth treatment technology to minimize pollutants entering the QY River.
- (4)
- Flood and rainy period: All gates should be open to ensure that internal waterlogging drains to the external river. Open the drainage pump station in case of an emergency.
3.2. Water Replenishing Cycle Period
Water replenishment is a practical method of raising a river’s water level, promoting biological flow, and enhancing water quality [29]. It not only provides the nearby population with the water they need, but it also widens and deepens the river, improving the comfort of the surrounding area [30]. Adequate water positively impacts both the stability of ecosystems and the transformation of contaminants in water [31,32].
As soon as the water level drops below 3.00 m, activate device A and then disable devices 1 to 6. Once the water level reaches the designated constant level, the cycle period commences. At this time, it is necessary to continuously keep gate A open, open the remaining gates, and establish three clockwise-cycle living water partitions in the region. These partitions should cover all residential rivers and facilitate both internal and exterior circulation. The water level should be gradually raised to 3.40 m and the water recharge should be maintained for approximately 72 h.
Under these circumstances, the dispatch procedure is outlined as follows: Initially, transfer water from the RT Canal, with a flow rate of 3.2 cubic meters per second, to the QY River. After being redirected, the water is split into two directions at point ①: the western side flows into Ⅳ4733 with a flow rate of 1.84 m3/s, while the eastern side flows into m4738 with a flow rate of 2.18 m3/s. The BZ River discharges the water in a circular manner through the new river road YB-1, ultimately reaching the JG River. Initially, the water moves in a southerly direction, following the primary channel. At point ②, the stream divides into two branches, flowing into IV4735 (with a flow rate of 1.66 m3/s) and IV4740 (with a flow rate of 1.91 m3/s) in the east and west directions, respectively. The water flows into section IV 4736 at a flow rate of 1.27 cubic meters per second from the west, and it eventually leaves through the JD River. The residual water at location ④ enters the eastern part of Ⅳ4742 (with a flow rate of Q = 1.74 m3/s) and thereafter leaves in a clockwise direction at the outside edge of the ZZ River. In addition, the water that stays in the QY River also merges with the ZZ River from the southern direction. In order to ensure the flow of water above the surface, it is necessary for the bottom elevation of the drainage river along the QY River to be higher than that of the main stream (Figure 8).
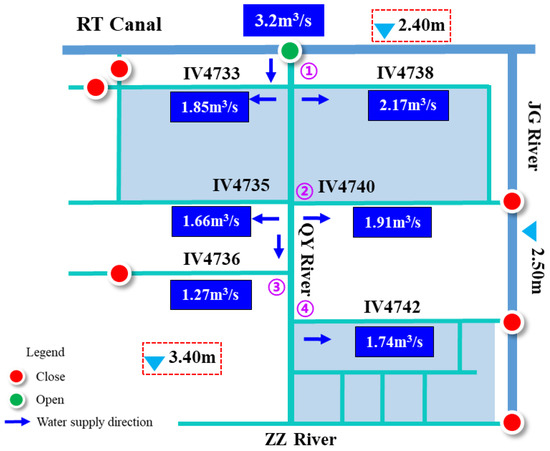
Figure 8.
Water replenishing cycle system scheduling.
3.3. Agricultural Irrigation Period
One of the key regions in Banjing town for agricultural output is the QY River Basin. Vegetables and rice are the most common crops grown, resulting in 606 kg of rice per acre. Irrigation is the cornerstone for guaranteeing grain productivity [33]. As such, our top priorities while building the system are to make sure that there are enough irrigation water sources and clear routes.
During the irrigation season, we simultaneously open three pumping stations and distribute the water to the branch canals through the main canal. To make it easier for water to flow from the branch canal into the adjacent level Ⅳ river, we have constructed a new canal gate. The agricultural canal’s control gate is opened, and the canal gate is closed when water is being diverted for irrigation, allowing water from the branch canal to easily access the fields. This modified irrigation can efficiently cover the farmland in the research area (Figure 9).
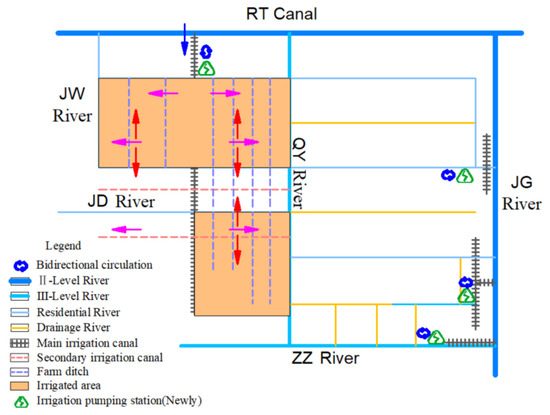
Figure 9.
Agricultural irrigation system scheduling (with the WD district taken as an example).
3.4. Farmland Drainage Period
To promote the growth and development of wet crops, it is necessary to inject water into the field due to its superior heat capacity and thermal conductivity compared to air [34,35]. Our study was conducted in China’s primary rice cultivation region. More than 70% of the area consists of paddy fields, with the rice fields’ water level ranging from 3~5 cm following transplantation. Prior to sowing in the subsequent stage, it is necessary to immerse it for a period of 48~72 h [36]. During this period, it is necessary to refill the water every 12~24 h for a total immersion duration of 8~10 days. The farmland demonstrates a cyclical process of water absorption and release. The field’s drainage efficiency is critical for uninterrupted crop growth.
Our refurbished irrigation pump station became operational in the summer of 2023. The newly remodeled irrigation pumping station is used when the farmland is drained. The new two-way pumps improve pumping efficiency, helping field drains remove water quickly. Additionally, they open the pump gates of WD, BT, and YQ, facilitating the pumping of flooded water from the three farms into the nearby drainage river. We installed an ecological dam at the end of the farmland drainage as a first step in reducing the amount of N and P in the water due to the temporary buildup of organic pollutants during the draining process. As a second step, we planted aquatic plants in the drainage river, leveraging the nutrients required for plant growth to further degrade pollutants. In the third phase, we constructed four ecological filtering dams at the confluence of the drainage river and the QY River. We filled these dams in stages, maintaining normal water levels during non-extreme periods, to effectively absorb pollutants. We also incorporated raised gates in the dam’s body to facilitate drainage during agricultural drainage and flood season crossings (Figure 10). During normal times, all the drainage streams serve as dry creeks and storm water storage areas.

Figure 10.
Farmland drainage system scheduling.
3.5. Flood and Rainy Period
In the event that the study area experiences heavy rainfall and the water level rises to an alert level of 3.8~4.0 m, the newly installed hydraulic structures in the system will be of paramount importance. In order to channel the arid water flow into the RT Canal, we initiated the opening of the self-discharge gates located in the QY River pumping station. Simultaneously, we open the gates in the drainage river’s ecological filtration dams to lower the water level. In order to redirect water from the eastern region into the JG River, operate the pair of gates. Activate the gate stations located on the BZ and JW rivers in order to divert water from the western area into the RT Canal through the JW River. Additionally, utilize the JD River to provide water to the southwestern part of the territory (Figure 11). The irrigation and drainage pumping station is operational to facilitate the flow of surplus water into the drainage river, thereby expediting the reduction in farmland water levels. Additionally, the drainage ditch is utilized to store water inside the field.
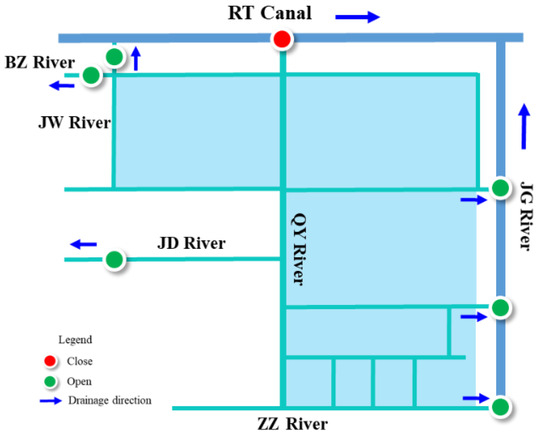
Figure 11.
Flood and rainy system scheduling.
4. Discussion
Following system completion, the study area will be impacted in three main ways: (1) the rational allocation and regulation of water resources; (2) the long-term guarantee and improvement of the water quality; (3) and the improvement and optimization of the drainage, irrigation and flood control functions. We have conducted the following study and analysis in relation to the aforementioned three points.
4.1. Water Resource Optimization
4.1.1. Water Demand
Domestic Water Demand
Domestic water demand is estimated using standard survey methods and parameters per person as follows:
where WD is the amount of domestic water demand of rural residents(104 m3), ni is the standard of per capita domestic water demand (L/(per person·d)), and mi is the number of people who need water. The standard of residential water demand is related to the conditions of water sources, water-consuming equipment and the living habits of each place. The per capita water use quota for urban and rural areas is 0.13 m3/(per person·d), and the total population of the study area is 10,900, using the per capita water demand standard measurement method.
Water Demand for Production
(1) Agricultural
The general estimation methods of agricultural irrigation water demand can be divided into a direct and an indirect estimation method. In this study, through researching the actual irrigation methods and crop types in the irrigation area, the direct method was chosen to calculate the current agricultural water demand; the irrigation quotas of various crops were directly selected.
where mi is the irrigation quota of a crop; wi is the irrigated area of a crop; n is the number of times a crop is irrigated; Wi is the net irrigation water quantity of a crop; W is the net irrigation water quantity of all crops in the whole irrigation area; η is the effective utilization coefficient of irrigation water on farmland; and W’ is the total gross irrigation water consumption of the whole irrigation area. The study area comprised an irrigated area of 10,384 acres. The rice irrigation quota was 518.8 m3/acre, the wheat irrigation quota was 75 m3/acre, the irrigation utilization coefficient was 0.65, and the irrigation design guarantee rate was 0.85.
(2) Forestry and fishery
The water requirements for forestry, cattle, and fisheries are assessed using the irrigation quota approach, which involves similar calculation processes as those used for farmland irrigation. The study area encompasses a forest land area of 32.47 × 10³ m2 and is home to a total of 3000 heads of livestock and poultry. The forest land has a watering quota of 90 m3 per acre. Each livestock animal has a water quota of 40 L.
Ecological Water Demand
The maintenance of various ecological functions considers the amount of water needed to maintain the stability of aquatic ecosystems, the ecosystems’ inherent capacity for self-purification, and the influence of factors such as landscape function and river navigation, while also accounting for the loss of evaporation and seepage.
where We is the ecological water demand in the river; WV is the evapotranspiration and seepage demand; Wes is the water required to maintain the stability of aquatic ecosystems; Wsa is the sand transport demand; Wpu is the self-purification demand; and Wna is the landscape navigation demand.
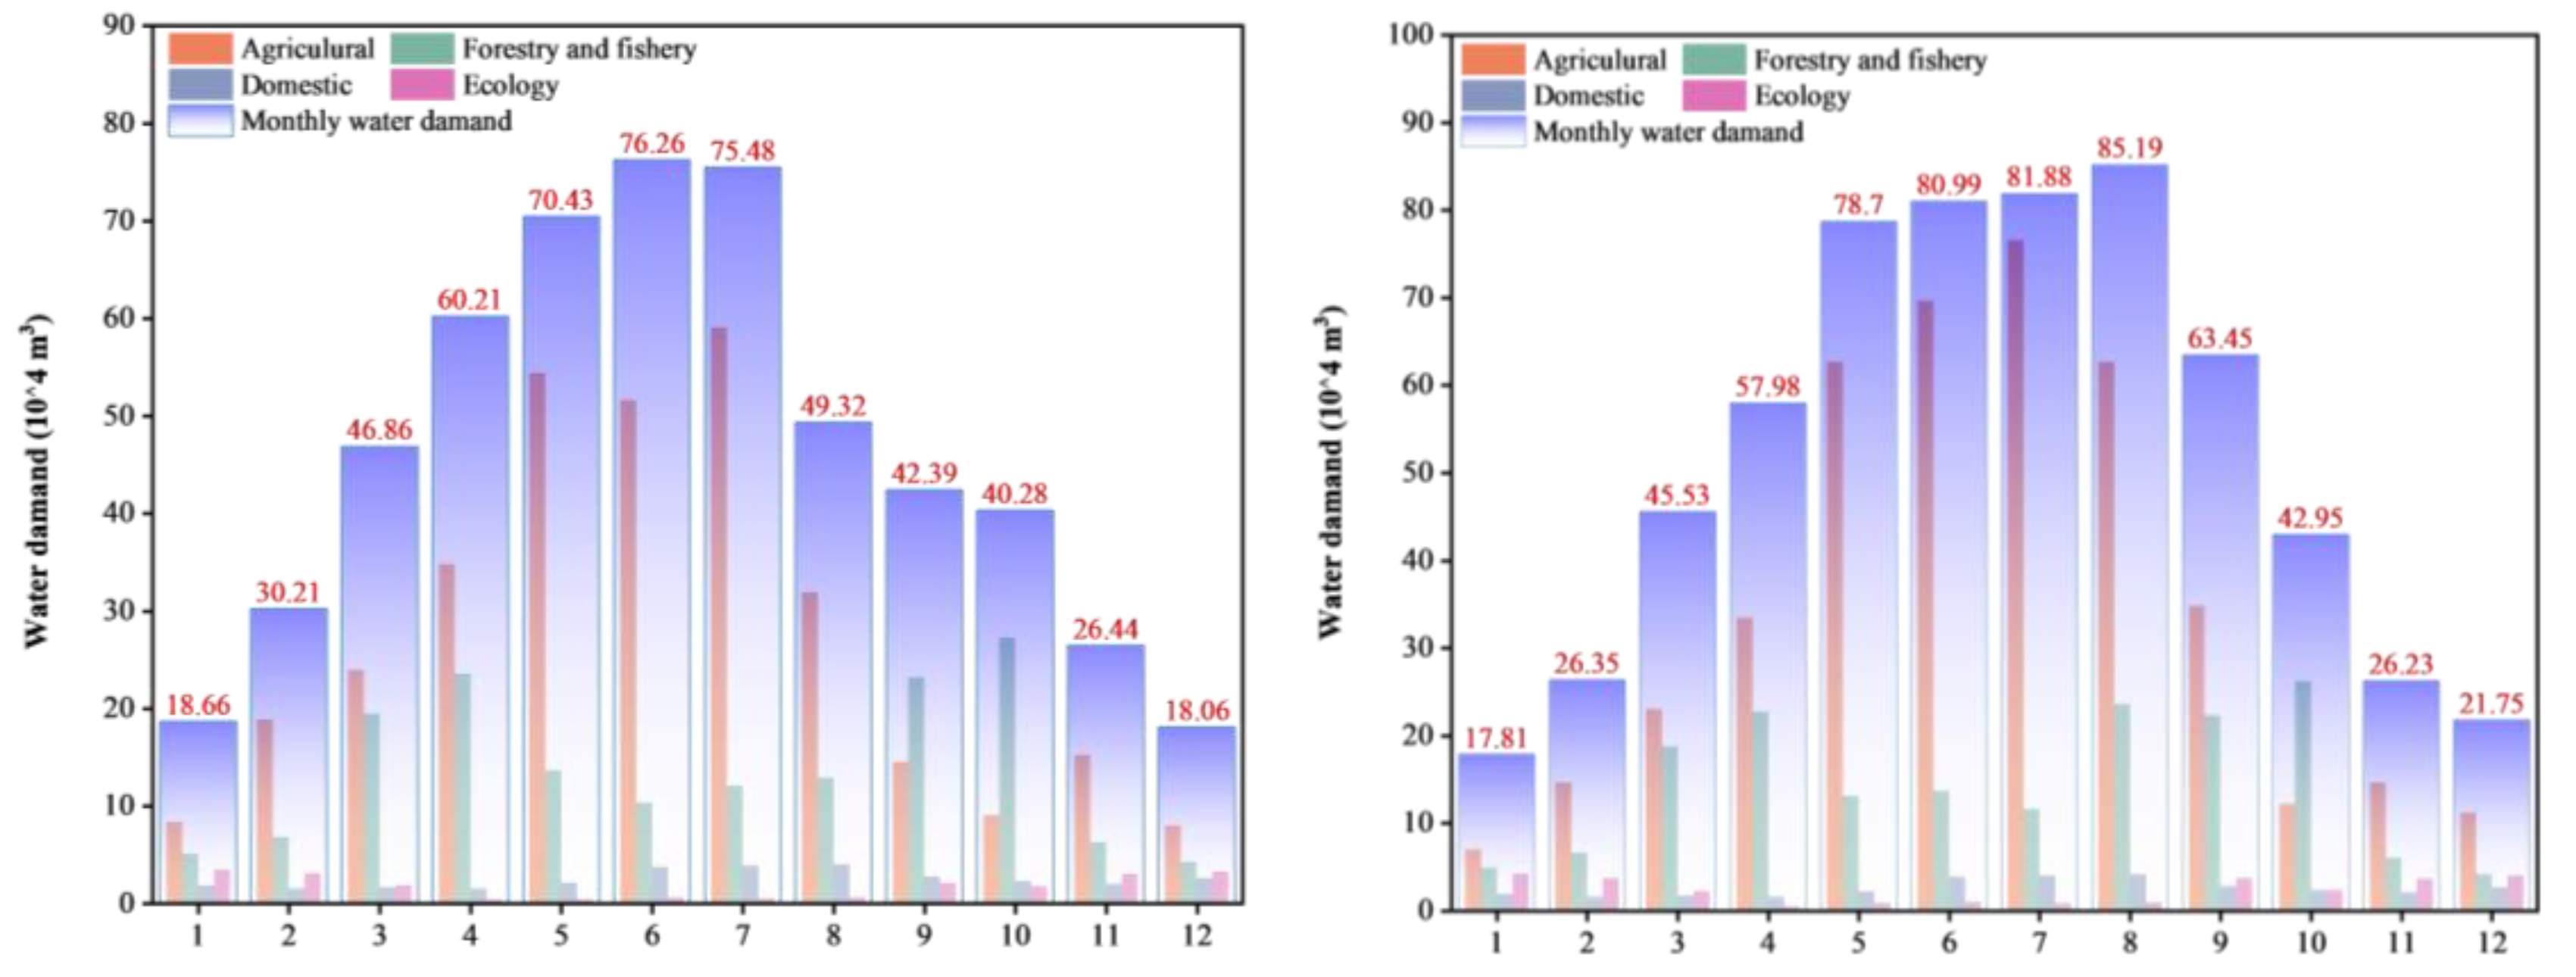
Regardless of the establishment of the system, agricultural water use consistently accounted for more than 59% of total water demand (Figure 12). In 2020, agricultural water use showed a monthly increase from April to July; in the same period of 2023, there was an increase of 10~12% in this type of water use, which was related to the drought in the summer of that year, but in comparison, the total annual agricultural water demand decreased by 4%. In forestry, water consumption increases significantly during the seedling growth period from March to April and August to October each year. Fisheries concentrate their water demand in the first half of the year, from March to May, when they need to supply fish ponds with water. Since this type of water use is not a primary economic activity in the study area and some small private fish ponds have closed, the total amount of water demand shows a decreasing trend [37]. Due to the migration of the rural population to cities, the inhabitants of the remaining villages are mainly elderly people who have changed their lifestyle in terms of water use, resulting in a 2% increase in domestic water demand [38]. Our system has ecologically changed the drainage flows in the region so that the rivers must have a certain ecological flow capacity. Ecological water demand has increased significantly, by more than 5%. The total water demand has decreased by 17.6 million m3, or 2.9%, since the system was completed in 2020, demonstrating that the system plays an obvious role in optimizing the use of water resources [39].
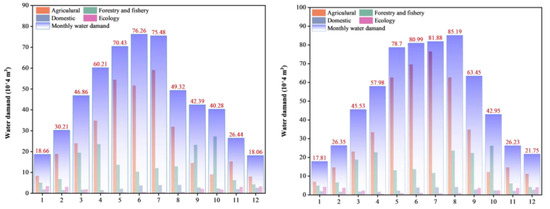
Figure 12.
Changes in water demand before and after construction of the system.
4.1.2. Water Supply
The total supplied water comprises both local surface water and external water transfers. Typically, water availability is calculated using the average annual approach; however, this time, it is assessed using the horizontal year method with an 80% guarantee rate.
River storage and diversion provide the total amount of surface water available in the area. Different types of projects in different areas classify the compound storage coefficient method, which computes the water supply quantity of the river storage project by subtracting the ecological base flow of the river from the calculated water storage quantity. The water diversion and lifting projects are computed based on the water intake’s diversion and lifting flow rate, the project’s capacity, and the users’ water demand requirements.
where Qi, Hi, Xi are the intake’s diversion flow rate, the project’s diversion capacity and the users’ water demand at time i; and t is the number of computation times.
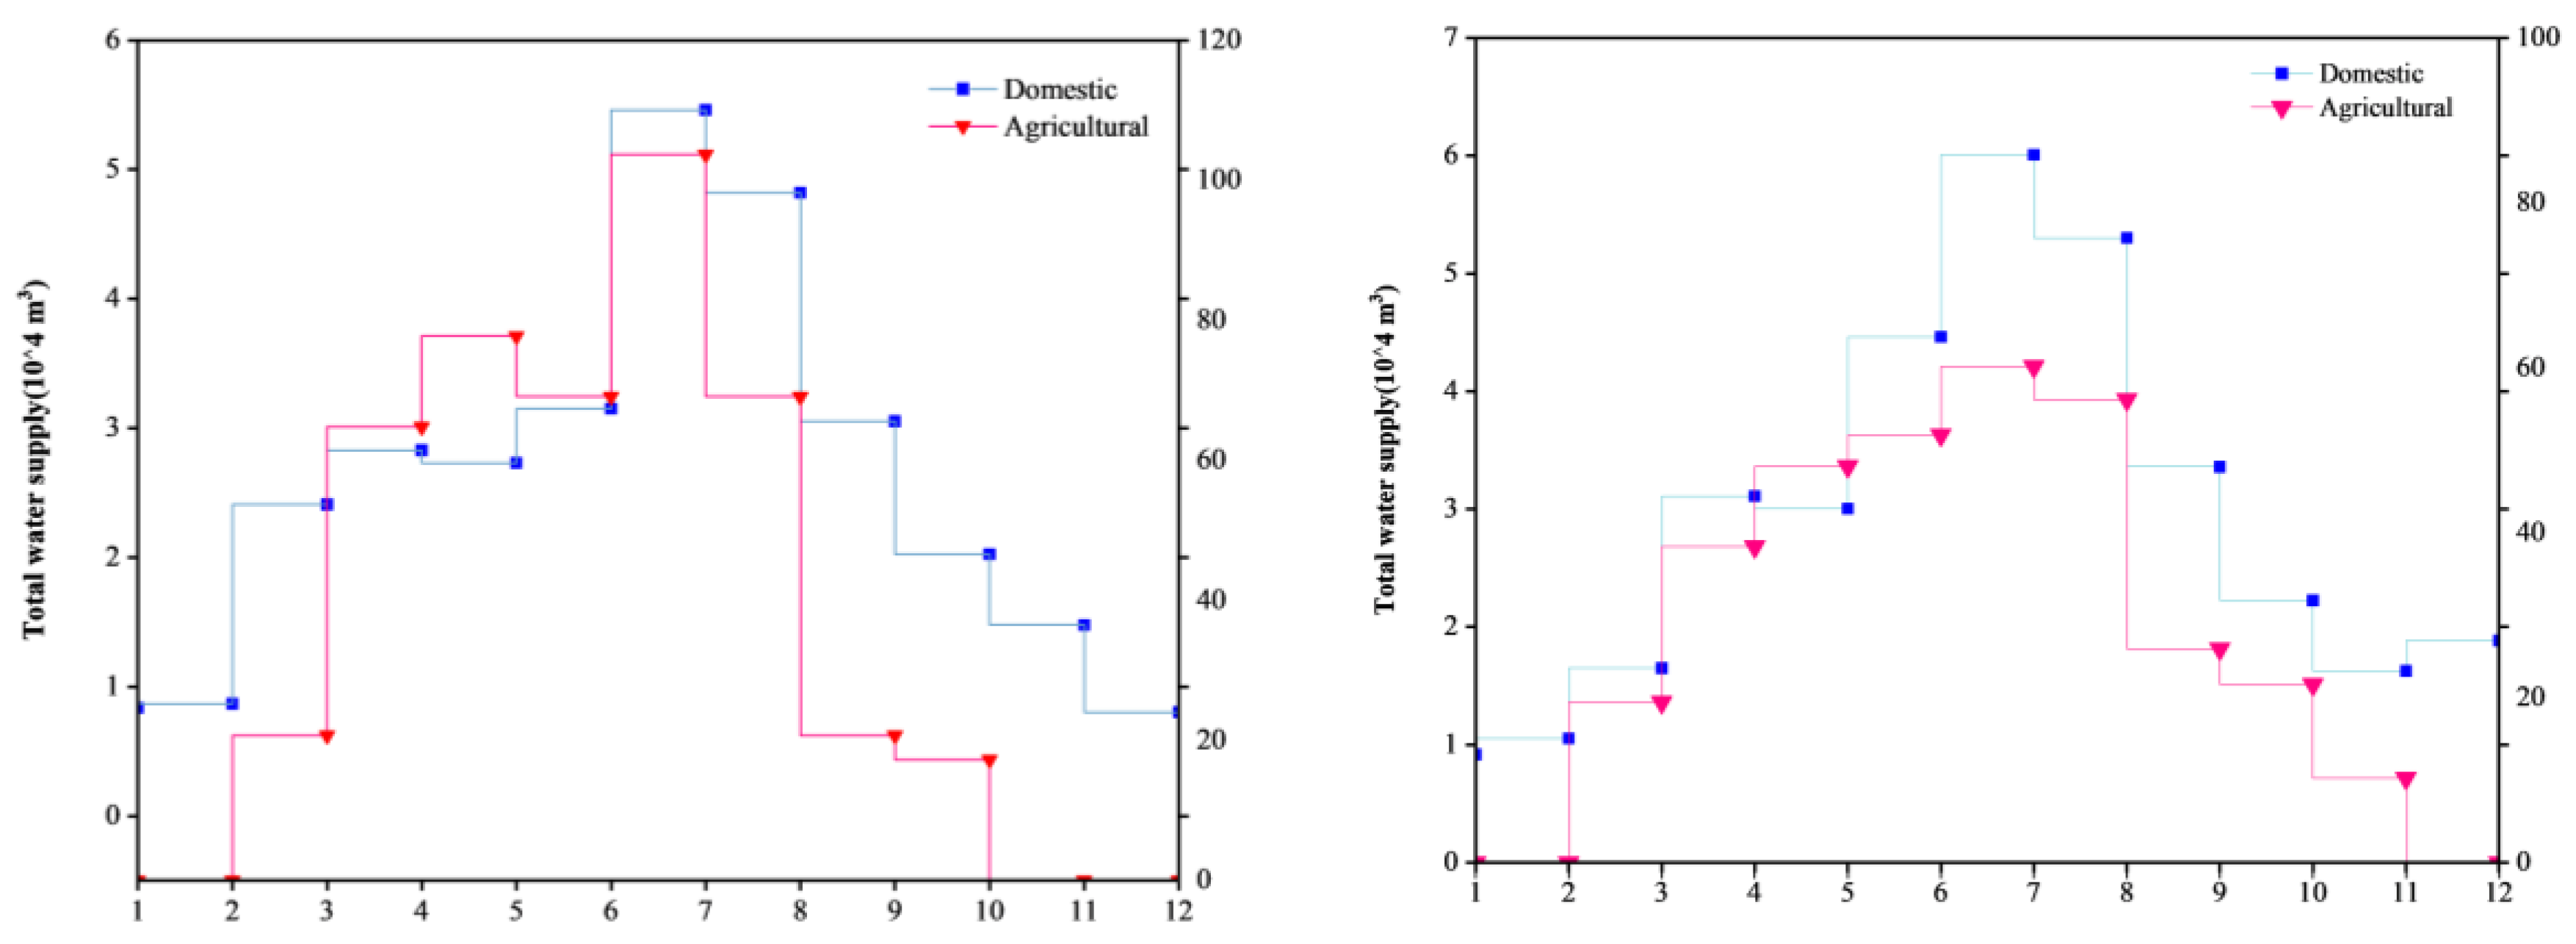
The local town water supply company uniformly deploys the domestic water supply in the study area; the agricultural water supply primarily relies on the irrigation pumping station to extract river water. The drought-induced rise in evaporation from the reservoir at the water supply source has led to a 32,100 m3 increase in the domestic water supply compared to 2020. The domestic water supply is distributed year-round, with a peak period in June to September. Approximately 90~95% of the water supply is used for agricultural production, with May to August being the peak period each year. This is also the busiest time for field cultivation. In 2023, an extreme drought significantly reduced the river’s water storage outside the area, making it difficult to pump water from irrigation pumping stations. As a result, the amount of water used for agricultural production decreased by 17% from May to August compared to the same period in 2020. November through August is the second half of the year. During this period, the irrigation pumping station stops and primarily functions as a drainage system, resulting in no agricultural water supply. In other words, the agricultural production activities are essentially complete. Generally, the area’s water supply grew by 5% in 2023 compared to 2020, which is not a significant rise (Figure 13). The water supply remains relatively constant.
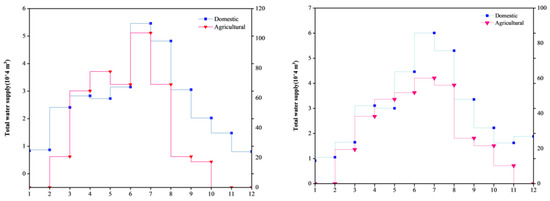
Figure 13.
Changes in water supply before and after construction of the system.
4.1.3. Water Conservation
The study of water supply and demand prioritizes water conservation due to its close connection to the processes of water supply, use, consumption, and drainage [40,41]. This section primarily considers the following two factors when calculating the water-saving potential.
Increasing the effective utilization coefficient of agricultural irrigation water and lowering the amount of agricultural irrigation needed are the main ways that agricultural water is saved. These include changing the structures of farms, stopping channel seepage, encouraging sprinkler and drip irrigation, low-pressure pipe irrigation, and other high-efficiency methods. In cities and villages, water saving primarily involves renovating the water supply pipeline network and replacing water-saving appliances.
Village Water Conservation
Reducing the water supply pipe network’s leakage rate to match the water supply process results in water savings for the village. The estimation of stock water savings based on varying the water supply network’s leakage rate while keeping water consumption at the current level is as follows:
where WV is water conservation potential of the village (104 m3), W0 is current village water consumption(104 m3), and L0, L1 are the leakage rate of the current and future water supply network (%).
Agricultural Water Conservation
Determine the irrigation water consumption reduction that corresponds to the actual irrigated area, or the corresponding agricultural water-saving potential following planting structure adjustment, by taking into account the decrease in the comprehensive net irrigation quota and the increase in the effective utilization coefficient of farmland irrigation water.
where WA is agricultural water conservation potential (104 m3), A0 is effective irrigated area (104 acres), I0, μ0 are the current and future irrigation quotas for farmland irrigation (m3/acres), and I1, μ1 are the current and future effective utilization coefficients of farmland irrigation water.
Water conservation for the two main water users, domestic and agricultural, depends on renovating the outdated water supply pipe network to reduce pipeline leakage to 10%. For agriculture, water conservation is achieved by increasing the irrigation water utilization coefficient from 0.65 to 0.66, raising the design irrigation guarantee rate from 90% to 92%, and conserving more than 90% of the land with water conservation techniques. Once our system is complete, we use the irrigation guarantee rate of 80% to estimate the potential water savings. This results in a water savings of 5.79 × 10⁴ m3 in 2023, which is 9.6% more than before. To preserve the local ecological ecosystem, the extra water might be put back into the river as ecological landscape water.
4.1.4. Water Supply and Demand Balance
In conjunction with the aforementioned examination of water demand, supply, and conservation in the research region, we approximated the equilibrium between water supply and demand (Table 3). Despite an increase in water supply in 2023 relative to demand, the region’s overall water resources remain scarce, based on the estimation of the 80% irrigation guarantee rate for water-saving potential. Following the completion of the water-saving renovation, the total volume of water shortages in the area will be 3.11 × 10⁵ m3, a 40% decrease from 2020, but the equilibrium between supply and demand remains unfulfilled. In spite of this, we will still be able to demonstrate how important a role the system plays in managing and allocating the region’s water resources. Addressing the issue of water scarcity may still necessitate modifying agricultural production practices, personal lifestyle choices, and external water supplies.
Table 3.
Water balance analysis and statistics.
4.2. Water Quality Enhancement
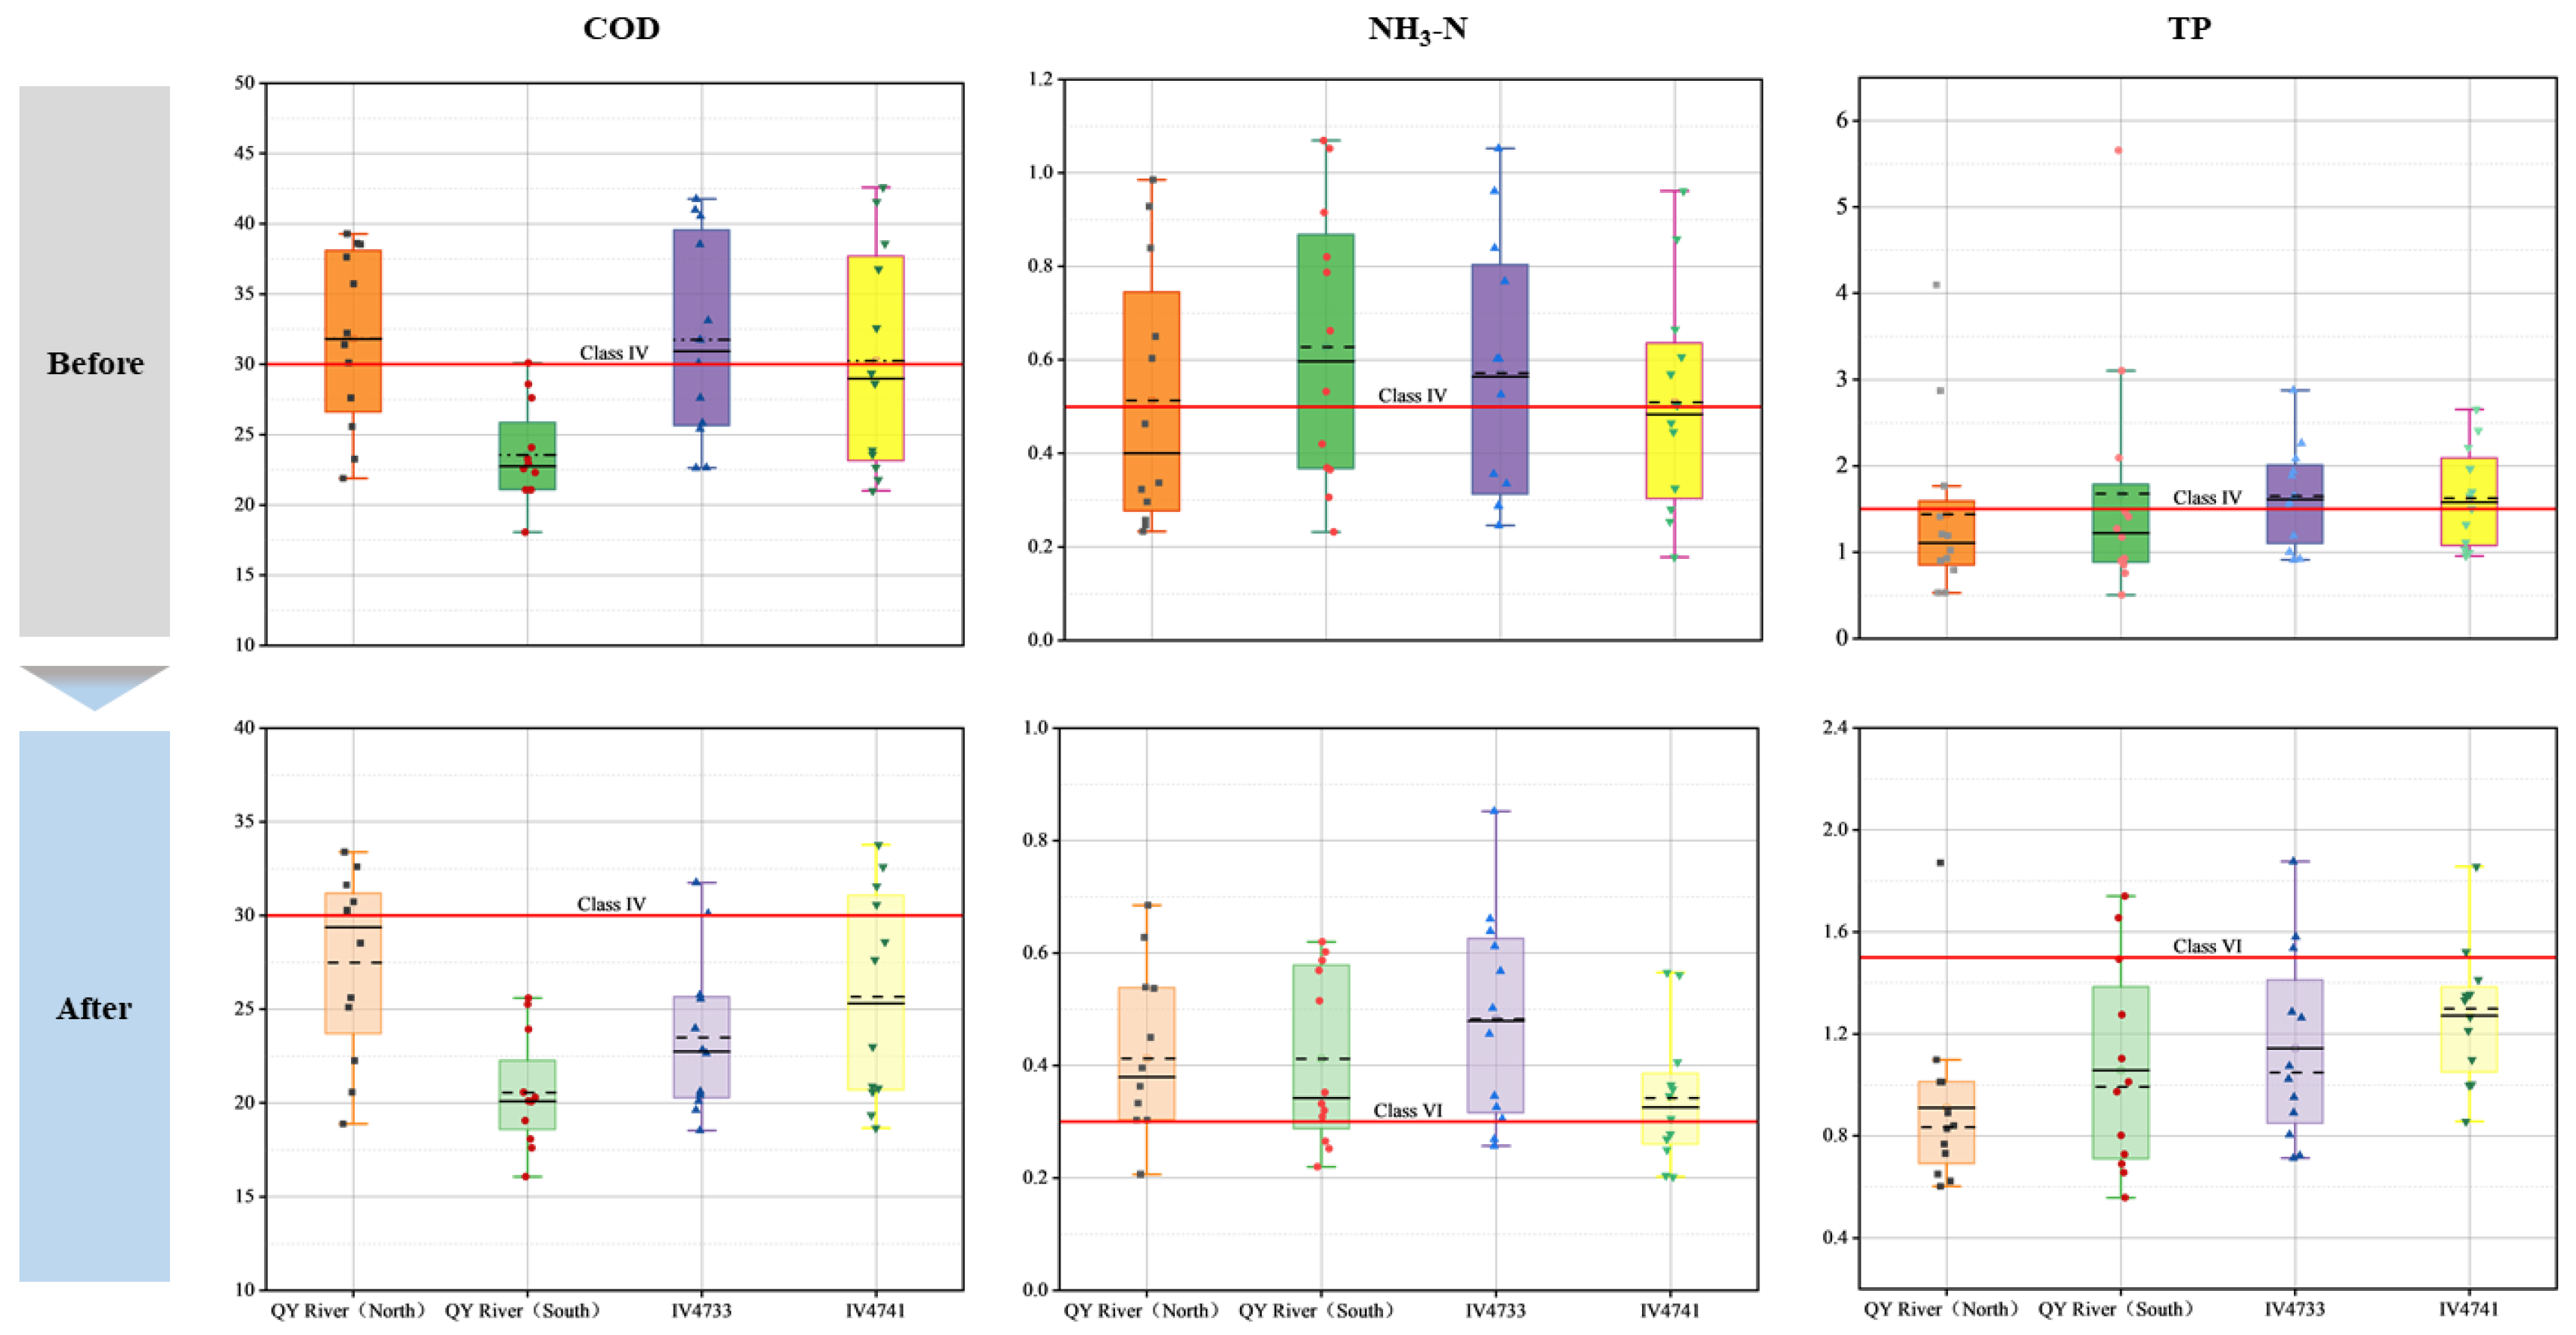
The 2020 water quality monitoring data show that the QY River is primarily responsible for the exceedance issues, with several severely contaminated streams remaining in the study region. The average annual COD concentration at the north entrance of the QY River in the area is 27.5 mg/L after the system has operated steadily for a while, which is 11.7% less than the previous one. The COD’s state has improved south of the QY River. In August and September, the concentration of NH3-N was 2 mg/L; in 2024, the average yearly concentration was just 1 mg/L (Figure 14).

Figure 14.
Changes in water quality before and after construction of the system.
Every year, from June to August, the concentration of NH3-N in the two severely contaminated level Ⅳ rivers clearly increases. The two severely contaminated class IV rivers’ NH3-N concentrations showed a clear upward trend. The completion of the system resulted in a drop of over 1 mg/L in the average concentration. The statistics directly represent the organic pollutants in the area. The two types of indicators mentioned above are the most significant indications that the rivers exceed the organic criteria [42]. A mixture of chemical and organic fertilizers, mixed with the drainage from nearby agriculture, forms the primary source [43]. After reaching the water, these fertilizers gradually deposit in the substrate and then continuously release themselves due to fluctuations in temperature and water flow [44].
The drainage of the peripheral RT Canal may have impacted the continuous TP exceeding the standard from June to October at the north QY river point. After building a gate at the river mouth, the average concentration of TP significantly decreased, averaging 0.4 mg/L. With the exception of the September through October agricultural drainage period, the level Ⅳ river’s TP concentration declined from 2021 to 2023 in every month. The TP concentration of all rivers experienced a decline between 10% and 15%. The annual average concentrations of the three pollutants dropped by 5–10%, except during special drainage periods in September and October or extreme weather like storms and droughts. This was after the damaged rivers in the area were dredged, fixed, and refilled with water purification plants and ecological filtration facilities. The system’s effect on improving the water quality is still relatively evident and stable.
4.3. Water Security and Agricultural Production Security
4.3.1. Flood Control and Drainage
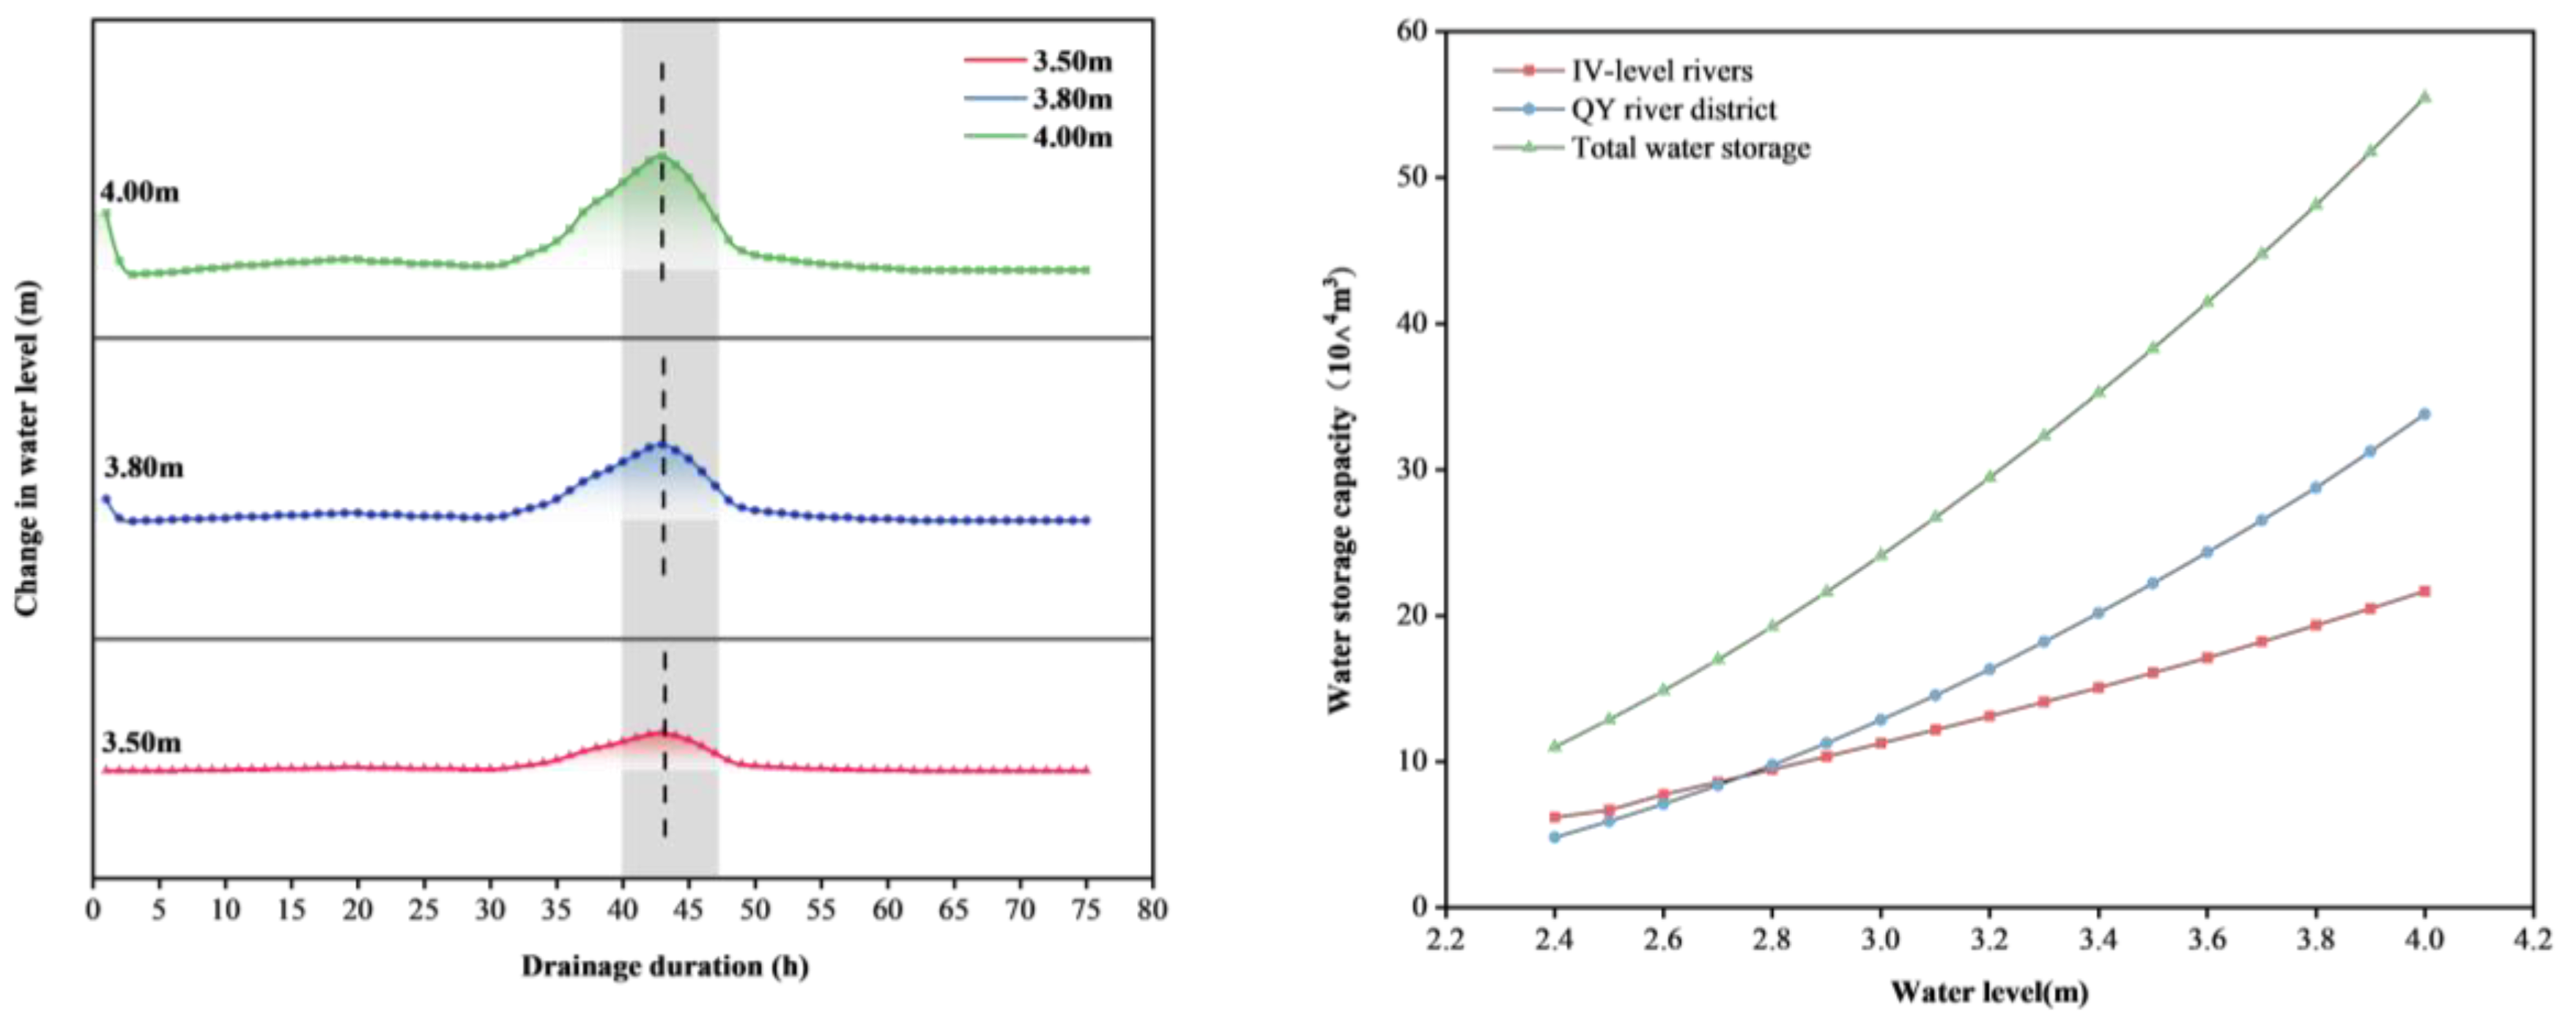
We redesigned the flood discharge standard in accordance with Nantong City’s planning, to which the study area belongs. It was based on the maximum 3-day rainstorm, the 20-year period, and the 1-day discharge following rainfall. In the QY River area, the design peak flow was 23 m3/s, and the design level flow was 14 m3/s. The design flow parameters of each fourth-level river channel were taken into consideration individually based on the catchment sub-districts (Table 4, Figure 15).
Table 4.
Flood and drainage analysis parameters.
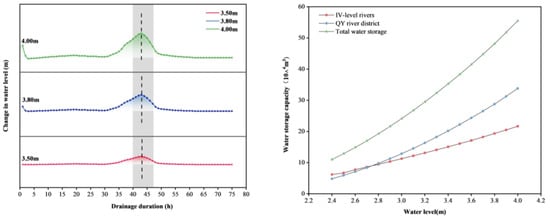
Figure 15.
Changes in drainage level (left) and water storage (right).
The design flood storage level in the area is 4.03 m, but the water level change process is different, and the drainage capacity all satisfies the criteria. To control flooding and manage drainage, we implemented the storage algorithm and set the QY river gate at 3.50 m, 3.80 m and 4.00 m. To increase its storage capacity, the regional river should store as much water as possible during periods of heavy rainfall [45]. It should also lessen the overall amount of agricultural surface pollution that enters the outer river during extreme weather conditions and lessen its influence on the outer river’s pollution load [46]. As a result, configure the regional perimeter to regulate gate opening in order to empty the 3.80~4.00 m. When there is heavy rain, open the gates to let the water out; the gates must close when the water level drops below 3.40 m. The embankment’s top rises to a height of 4.80 to 5.00 m.
The relationship curve between water level and storage shows that, starting from the typical water level of 3.40~4.00 m, an amount of water can be stored in an area of approximately 2.02 × 10⁴ m3. This situation occurs approximately 15 times a year, reflecting the frequency of gate openings.
4.3.2. Assurance of Irrigation
The primary crop, rice, experiences its annual peak water consumption between July and October. With a total irrigation flow rate of 2.5 m3/s and a total irrigated area of 6942 acres, our three recently renovated irrigation pumping stations are in charge of the three main production areas in the area. Additionally, they guarantee irrigation in more than 92% of the cases, a 2% increase over the previous system (Table 5).
Table 5.
Design irrigation parameters.
5. Conclusions
The system we built is still operating normally as of 2024, having withstood a double test consisting of the 2022 flood season and the 2023 drought. We created detailed designs of the system’s scheduling mode under each of the four simulated working circumstances in order to verify the system’s applicability. Raising the water level is the first step in the water replenishment cycle’s plan to boost the river’s volume and restore its natural flow. The network then distributes the refilled water at all levels, ensuring an abundance of water throughout the entire region. Pumping stations are used during the agricultural irrigation period to supply water for crop production. The agricultural drainage period effectively releases the water that has accumulated in the fields. The drainage path’s plants and filtration devices are used to absorb and filter the organic matter in the water, lowering the pollution load discharged into the outer river. During the rainy or flood season, all the water engineering facilities will open one at a time and be divided into areas of excess water that will be discharged into the nearby river to prevent flooding. The primary reason for this is to ensure resident safety, as it lowers the water level to 3.40 m in less than 24 h.
After the system was completed, we conducted a two-year monitoring period to evaluate its influence on three critical domains in the region: water resources, water environment and preservation, and flood mitigation. Although our system has played a role in allocating water resources, there is still a short-term water deficit in the area due to an imbalance between supply and demand. External sources of uncontaminated water and the use of vegetation and filtering materials to filter pollutants have accelerated the replenishment rate of the water body. The water quality of all rivers has experienced a substantial decline. Based on the assessment of flood control and water storage capacity, it is advisable to maximize the utilization of rivers’ flood control and water storage capabilities during periods of heavy rainfall. Reducing the duration of pumping station operations and minimizing agricultural surface pollution and its external impact can achieve this. The installation of three modified irrigation pumping stations ensured the region’s agricultural productivity.
In summary, our approach is an effective tool for managing water resources in rural areas, particularly in regions where agriculture is the predominant economic activity. The technical integration and operational scheduling of the system is based on the selection of background parameters; we take water resources, flood safety, water environment and water ecology as the main principles of the design. Nevertheless, it is important to recognize that there is a substantial expense associated with the system’s renewal. The system’s initial construction cost approximately 50 million CNY within a year, and it required ongoing problem-solving and fine-tuning over its initial two to three years of operation. During this period, the yearly management expenses totaled three hundred thousand CNY, primarily comprising labor and electricity expenses. In order to save operational expenses, we are presently implementing measurement instruments, such as flow and water level meters, at every hydraulic structure. This will establish a digital twins system and allow for online monitoring and operation via the software-integrated operational platform. To enhance the ecological condition of water and offer expertise and technology for the efficient use of water resources in rural regions, we will persist in researching in this field both presently and in the future. Once the system reaches a mature stage, we will replicate it in other similar cities and counties, ultimately leading to research and application.
Author Contributions
Q.G.: Writing—original draft, writing—review and editing, conceptualization, investigation; C.Z.: writing—review and editing; J.H.: writing—review and editing; G.F.: funding acquisition; X.C.: data curation, methodology, grammar correction; X.H.: data curation. All authors have read and agreed to the published version of the manuscript.
Funding
This research was supported by the National Natural Science Foundation of China [Grant No.52209051], Basic scientific research business of central level public welfare research institutes [Grant No. Y923015], and The Technology Demonstration Project of the Ministry of Water Resources [Grant No. SF-202408].
Data Availability Statement
Data is contained within the article.
Conflicts of Interest
Authors Jizhou Hu and Xue Cheng were employed by the company Nanjing Hydraulic Research Institute R&D Tech Group Co., Ltd. The remaining authors declare that the research was conducted in the absence of any commercial or financial relationships that could be construed as a potential conflict of interest.
References
- Volk, J.; Yerokun, O. Effect of Application of Increasing Concentrations of Contaminated Water on the Different Fractions of Cu and Co in Sandy Loam and Clay Loam Soils. Agriculture 2016, 6, 64. [Google Scholar] [CrossRef]
- Jaiswal, D.; Elliott, H.A. Long-term phosphorus fertility in wastewater-irrigated cropland. J. Environ. Qual. 2011, 40, 214–223. [Google Scholar] [CrossRef] [PubMed]
- Lixin, T.; Yu, Y.; Youhong, S.; Baili, F. Rehydration under extreme drought conditions affected rhizosphere microorganisms more than bulk soil in broomcorn millet farmland. Agric. Water Manag. 2024, 295, 108781. [Google Scholar]
- Lottermoser, B.G. Effect of long-term irrigation with sewage effluent on the metal content of soils, Berlin, Germany. Environ. Geochem. Health 2012, 34, 67–76. [Google Scholar] [CrossRef]
- Garcia-Vila, M.; Suzuki, H.; Ahmad, W.; Ali, A.; Pek, E.; Salman, M. Irrigation development as a booster of the multifunctional roles of paddy rice. Irrig. Drain. 2023, 72, 1317–1332. [Google Scholar] [CrossRef]
- Wesstrom, I.; Messing, I. Effects of controlled drainage on N and P losses and N dynamics in a loamy sand with spring crops. Agric. Water Manag. 2007, 87, 229–240. [Google Scholar] [CrossRef]
- Christen, E.W.; Skehan, D. Design and management of subsurface horizontal drainage to reduce salt loads. ASCE J. Irrig. Drain. Eng. 2001, 127, 148–155. [Google Scholar] [CrossRef]
- Xiaoyue Z, Lei C, Yu Y, Zhenyao S, Water quality variability affected by landscape patterns and the associated temporal observation scales in the rapidly urbanizing watershed. J. Environ. Manag. 2021, 298, 113523. [CrossRef]
- Usio, N.; Imada, M.; Nakagawa, M.; Akasaka, M.; Takamura, N. Effects of pond draining on biodiversity and water quality of farm ponds. Conserv. Biol. 2013, 27, 1429–1438. [Google Scholar] [CrossRef]
- Borin, M.; Tocchetto, D. Five year water and nitrogen balance for a constructed surface flow wetland treating agricultural drainage waters. Sci. Total Environ. 2007, 380, 38–47. [Google Scholar] [CrossRef]
- Hanrahan, B.R.; King, K.W.; Duncan, E.W.; Shedekar, V.S. Cover crops differentially influenced nitrogen and phosphorus loss in tile drainage and surface runoff from agricultural fields in Ohio, USA. J. Environ. Manag. 2021, 293, 112910. [Google Scholar] [CrossRef] [PubMed]
- Kęsicka, B.; Stasik, R.; Kozłowski, M. Effects of modelling studies on controlled drainage in agricultural land on reduction of outflow and nitrate losses-a meta-analysis. PLoS ONE 2022, 17, e0267736. [Google Scholar] [CrossRef] [PubMed]
- Sim, B.-R.; Kim, H.-C.; Kim, C.-S.; Kim, J.-H.; Park, K.-W.; Lim, W.-A.; Lee, W.-C. Seasonal Distributions of Phytoplankton and Environmental Factors Generate Algal Blooms in the Taehwa River, South Korea. Water 2020, 12, 3329. [Google Scholar] [CrossRef]
- Al-Hammad, B.A.; Abd El-Salam, M.M.; Ibrahim, S.Y. Quality of wastewater reuse in agricultural irrigation and its impact on public health. Environ. Monit. Assess. 2014, 186, 7709–7718. [Google Scholar] [CrossRef] [PubMed]
- Avci, H.; Deveci, T. Assessment of trace element concentrations in soil and plants from cropland irrigated with wastewater. Ecotoxicol. Environ. Saf. 2013, 98, 283–291. [Google Scholar] [CrossRef] [PubMed]
- Stańczuk-Gałwiaczek, M.; Sobolewska-Mikulska, K.; Ritzema, H.; van Loon-Steensma, J.M. Integration of water management and land consolidation in rural areas to adapt to climate change: Experiences from Poland and the Netherlands. Land Use Policy 2018, 77, 498–511. [Google Scholar] [CrossRef]
- Jamshed, A.; Birkmann, J.; Rana, I.A.; Feldmeyer, D. The effect of spatial proximity to cities on rural vulnerability against flooding: An indicator based approach—Sciencedirect. Ecol. Indic. 2020, 118, 106704. [Google Scholar] [CrossRef]
- Thompson, D.M.; Puklin, L.S.; Marshall, A.E. Marshall, The long-term impact of channel stabilization using gabion structures on Zealand River, New Hampshire. Ecol. Eng. 2016, 95, 779–792. [Google Scholar] [CrossRef]
- Geng, H.; Ding, X.; Du, H.; Shi, J.; Li, C.; Li, X. Application of Self-Compacting Steel Fiber Reinforced Concrete for Pervious Frames Used for River Revetment. Appl. Sci. 2022, 12, 10457. [Google Scholar] [CrossRef]
- Kiss, T.; Amissah, G.J.; Fiala, K. Bank Processes and Revetment Erosion of a Large Lowland River: Case Study of the Lower Tisza River, Hungary. Water 2019, 11, 1313. [Google Scholar] [CrossRef]
- Feng, K.; Hubacek, K.; Pfister, S.; Yu, Y.; Sun, L. Virtual scarce water in China. Environ. Sci. Technol. 2014, 48, 7704–7713. [Google Scholar] [CrossRef] [PubMed]
- Badrzadeh, N.; Samani, J.M.V.; Mazaheri, M.; Kuriqi, A. Evaluation of management practices on agricultural nonpoint source pollution discharges into the rivers under climate change effects. Sci. Total Environ. 2022, 838, 156643. [Google Scholar] [CrossRef] [PubMed]
- Raudina, T.V.; Smirnov, S.V.; Lushchaeva, I.V.; Istigechev, G.I.; Kulizhskiy, S.P.; Golovatskaya, E.A.; Shirokova, L.S.; Pokrovsky, O.S. Seasonal and Spatial Variations of Dissolved Organic Matter Biodegradation along the Aquatic Continuum in the Southern Taiga Bog Complex, Western Siberia. Water 2022, 14, 3969. [Google Scholar] [CrossRef]
- Wang, H.; He, P.; Shen, C.; Wu, Z. Effect of irrigation amount and fertilization on agriculture non-point source pollution in the paddy field. Environ. Sci. Pollut. Res. 2019, 26, 10363–10373. [Google Scholar] [CrossRef] [PubMed]
- Stampfli, N.; Madramootoo, C.A. Water table management: A technology for achieving more crop per crop. Paper submitted for the nineth international drainage workshop (ICID). Irrig. Drain. Sys. 2006, 20, 267–282. [Google Scholar] [CrossRef]
- The State Environmental Protection Administration of China. Water and Wastewater Monitoring and Analysis Methods, 4th ed.; China Environmental Science Press: Beijing, China, 2002. [Google Scholar]
- The State Environmental Protection Administration of China. The Technical Specification for Soil Environmental Monitoring; China Environmental Science Press: Beijing, China, 2004. [Google Scholar]
- The Ministry of Water Resources of China. The Hydrological Data Testing Was Duly Conducted in Accordance with the Specification for Geodesic Survey in Hydrology; The Ministry of Water Resources of China: Beijing, China, 2014. [Google Scholar]
- Tokuda, D.; Kim, H.; Yamazaki, D.; Oki, T. Development of a global river water temperature model considering fluvial dynamics and seasonal freeze-thaw cycle. Water Resour. Res. 2019, 55, 1366–1383. [Google Scholar] [CrossRef]
- Turnipseed, C.; Konsoer, K.; Richards, D.; Willson, C. Numerical modeling of two-dimensional hydrodynamics in a highly curving and actively evolving neck cutoff under different hydrologic conditions. Water Resour. Res. 2021, 57, e2020WR027329. [Google Scholar] [CrossRef]
- Glas, M.; Glock, K.; Tritthart, M.; Liedermann, M.; Habersack, H. Hydrodynamic and morph dynamic sensitivity of a river’s main channel to groyne geometry. J. Hydraul. Res. 2018, 56, 714–726. [Google Scholar] [CrossRef]
- Sauvé, S.; Lamontagne, S.; Dupras, J.; Stahel, W. Circular economy of water: Tackling quantity, quality and footprint of water. Environ. Dev. 2021, 39, 100651. [Google Scholar] [CrossRef]
- Gao, C.; Lin, M.; He, L.; Tang, M.; Ma, J.; Sun, W. The Impact of Water-Saving Irrigation on Rice Growth and Comprehensive Evaluation of Irrigation Strategies. Agronomy 2024, 14, 1363. [Google Scholar] [CrossRef]
- Atwill, R.L.; Spencer, G.D.; Bond, J.A.; Walker, T.W.; Phillips, J.M.; Mills, B.E.; Krutz, L.J. Establishment of thresholds for alternate wetting and drying irrigation management in rice. Agron. J. 2023, 115, 1735–1745. [Google Scholar] [CrossRef]
- Graham-Acquaah, S.; Siebenmorgen, T.J.; Reba, M.L.; Massey, J.H.; Mauromoustakos, A.; Adviento-Borbe, A.; January, R.; Burgos, R.; Baltz-Gray, J. Impact of alternative irrigation practices on rice quality. Cereal Chem. 2019, 96, 815–823. [Google Scholar] [CrossRef]
- Dos Santos, M.P.; Heinemann, A.B.; Stone, L.F.; da Silva, M.A.S.; Lanna, A.C.; dos Santos, A.B. Phenology, gas exchange, biomass accumulation, and irrigated rice yield under alternative irrigation managements. Agron. J. 2024, 116, 542–562. [Google Scholar] [CrossRef]
- Zubaidi, S.L.; Gharghan, S.K.; Jayne, D.; Alkhaddar, R.M.; Mawada, A. Short-term urban water demand prediction considering weather factors. Water Resour. Manag. 2018, 32, 4527–4542. [Google Scholar] [CrossRef]
- Lihong, Z. Prediction model of ecological environmental water demand based on big data analysis. Environ. Technol. Innov. 2021, 21, 101196. [Google Scholar]
- Lu, S.; Cai, W.; Shao, W.; Taghizadeh-Hesary, F.; Faisal, M.; Zhang, H.; Xue, Y. Ecological Water Requirement in Upper and Middle Reaches of the Yellow River Based on Flow Components and Hydraulic Index. Int. J. Environ. Res. Public Health 2021, 18, 10956. [Google Scholar] [CrossRef] [PubMed]
- Davis, K.F.; Seveso, A.; Rulli, M.C.; D’Odorico, P. Water Savings of Crop Redistribution in the United States. Water 2017, 9, 83. [Google Scholar] [CrossRef]
- Thiam, D.R.; Dinar, A.; Ntuli, H. Promotion of residential water conservation measures in South Africa: The role of water-saving equipment. Environ. Econ. Policy Stud. 2021, 23, 173–210. [Google Scholar] [CrossRef]
- Canfield, D.E.; Hoyer, M.V.; Bachmann, R.W.; Bigham Stephens, D.; Ruiz-Bernard, I. Water quality changes at an Outstanding Florida Water: Influence of stochastic events and climate variability. Lake Reserv. Manag. 2016, 32, 297–313. [Google Scholar] [CrossRef]
- Cloern, J.E. Patterns, pace, and processes of water-quality variability in a long-studied estuary. Limnol Ocean. 2019, 64, S192–S208. [Google Scholar] [CrossRef]
- Zhang, L.; Ma, Q.; Zhao, Y.; Chen, H.; Hu, Y.; Ma, H. China’s strictest water policy: Reversing water use trends and alleviating water stress. J. Environ. Manag. 2023, 345, 118867. [Google Scholar] [CrossRef] [PubMed]
- Van Loon-Steensma, J.M.; Vellinga, P. Robust, multifunctional flood defenses in the dutch rural riverine area. Nat. Hazards Earth Syst. Sci. 2014, 14, 1085–1098. [Google Scholar] [CrossRef]
- Obayomi, O.; Bernstein, N.; Edelstein, M.; Vonshak, A.; Ghazayarn, L.; Ben-Hur, M.; Tebbe, C.C.; Gillor, O. Importance of soil texture to the fate of pathogens introduced by irrigation with treated wastewater. Sci. Total Environ. 2019, 653, 886–896. [Google Scholar] [CrossRef] [PubMed]


Disclaimer/Publisher’s Note: The statements, opinions and data contained in all publications are solely those of the individual author(s) and contributor(s) and not of MDPI and/or the editor(s). MDPI and/or the editor(s) disclaim responsibility for any injury to people or property resulting from any ideas, methods, instructions or products referred to in the content. |
© 2024 by the authors. Licensee MDPI, Basel, Switzerland. This article is an open access article distributed under the terms and conditions of the Creative Commons Attribution (CC BY) license (https://creativecommons.org/licenses/by/4.0/).