Article

Assessing the Impact of Anthropogenically Modified Land Uses on Wetland Health: Case of Witbank Dam Catchment in South Africa

by
Sylvester Mpandeli
1,2,3,
Stanley Liphadzi
1,3,
Chengetanai Mabhaudhi
4,
Tafadzwanashe Mabhaudhi
4,5,6 and
Luxon Nhamo
1,4,*
1
Water Research Commission of South Africa, Lynwood Manor, Pretoria 0081, South Africa
2
Department of Environmental, Water and Earth Sciences, Tshwane University of Technology (TUT), Pretoria 0029, South Africa
3
Faculty of Science, Engineering and Agriculture, University of Venda, Thohoyandou 0950, South Africa
4
Centre for Transformative Agricultural and Food Systems (CTAFS), School of Agricultural, Earth and Environmental Sciences, University of KwaZulu-Natal, Pietermaritzburg 3209, South Africa
5
Centre on Climate Change and Planetary Health, London School of Hygiene and Tropical Medicine (LSHTM), London WC1E 7HT, UK
6
United Nations University Institute for Water, Environment and Health, Richmond Hill, ON L4B 3P4, Canada
*
Author to whom correspondence should be addressed.
Water 2024, 16(16), 2287; https://doi.org/10.3390/w16162287
Submission received: 22 July 2024 / Revised: 11 August 2024 / Accepted: 12 August 2024 / Published: 13 August 2024

Abstract

:
Wetlands are critical ecological infrastructures that improve water quality, serve as habitat for fish and other aquatic life, accumulate floodwaters, and maintain surface water flow during dry periods. However, the health of wetlands has been compromised by anthropogenic activities that affect the constant supply of ecosystem services. This study assessed the impact of anthropogenically modified land use on wetland health in the Witbank Dam Catchment in South Africa, whose land use has been severely modified for agriculture and mining purposes. The study developed a model linking surface runoff generated in the catchment with land use and wetland typology to comprehend diffuse pollution from pollution-source land uses. Runoff data and related wetland spatial information were processed and analysed in a Geographic Information System (GIS) to estimate pollutants (agricultural nutrients and acid mine drainage) from runoff detained and released by wetlands. The analysis facilitated the assessment of the value of wetlands in enhancing water quality, as well as human and environmental health. The runoff volume from pollution-source land uses (urban areas, farmlands, and mining) was used to evaluate annual pollution levels. Wetland types are ranked according to their efficiency levels to filter pollutants. The assumption is that the difference between filtered and unfiltered runoff is the quantity of polluted runoff water discharged into the river system. The analysis has shown that 85% of polluted runoff generated in the catchment ends up in the river system. An important observation is that although wetlands have a substantial ability to absorb excess pollutants, they have finite boundaries. Once they reach their full holding capacity, they can no longer absorb any further pollutants. The excess is discharged into the river system, risking human and environmental health. This explains why the Limpopo River is heavily polluted resulting in the death of fish, crocodiles and other aquatic life.

1. Introduction

Wetlands, both natural and constructed, provide a variety of ecological and economic functions that include water quality improvement, flood protection, climate regulation, nutrient processing, carbon sequestration, groundwater recharge, shoreline stabilisation, habitat for aquatic life, aesthetics, and biological productivity, among other functions [1,2,3]. The importance and value of a wetland are determined by the worth of one or all of its functions to society and the environment [4]. Thus, wetlands provide worthy services to society and the environment that humankind may not appreciate, as 35% of the world’s wetlands were severely degraded between 1970 and 2015 [5,6]. Different types of wetlands provide distinct functions at different efficiency levels [7,8]. The recognition of the value of wetlands has witnessed an exponential increase in wetland research in recent years, particularly their effectiveness in providing nature-based solutions against the threats posed by climate change [7,9,10]. Research has developed various wetland-based water treatment smart technologies that are being used as green eco-technologies to treat water pollution [11,12,13]. Technological advances have made wetlands more valuable resource-recovery and crop production amenities [14,15].
The ability of wetlands to detain runoff and store water reduces the flow momentum and erosive potential of runoff, thereby reducing floods and land degradation [16]. This allows groundwater recharge, which in turn contributes to base flow and surface water availability during dry seasons [17]. During the period when a wetland detains runoff before its release, the water is purified by trapping sediments and retaining excess nutrients and other pollutants that are part of the runoff load [1,7]. During the storage period, the runoff load is dropped and settles on the wetland floor where these substances are often absorbed by plants and microorganisms in the soil or are transformed through denitrification and injected back into the atmosphere [18,19]. Wetlands are, therefore, rich in plant nutrients. By the time the water leaves the wetland, the filtration of nutrients and other chemical transformation processes would have removed much of the runoff pollutants, enhancing water quality and river health in the process [14]. Thus, healthy wetlands are biodiversity areas that enhance resilience to climate change and promote healthy environments [20]. This is supported by previous studies that have established that wetlands can store about 35% of terrestrial carbon dioxide, yet they cover only 9% of the planet’s surface [21,22]. Continued degradation of wetlands is, therefore, resulting in significant carbon dioxide and methane emissions that contribute to extreme weather events experienced today [23].
Therefore, understanding the interlinkages between human well-being and environmental health is at the centre of wetland management and their contribution to public health [24]. The human–wetlands–ecosystems nexus has attracted global attention in recent years due to the severity of wetland degradation which has undermined ecosystem services and exacerbated climate extremes like floods [25,26]. As a result, a wider recognition of the existing interlinkages between human well-being and environmental quality has been a topical subject of discussion in international environmental and climate change discourses [27,28]. This is based on the reality that wetlands are critical in enhancing human and environmental health and catalysing the realisation of Sustainable Development Goals (SDGs) [29,30], yet they have been extremely overexploited for food production and extraction of water resources to meet the requirements of a growing human population [31].
The sustainability of wetlands and their ability to continue providing essential services is diminishing at alarming rates [26,32]. These challenges have also seen a decline in public health and livelihoods, as access to water and sanitation remains a far cry for many [33]. Wetlands contribute immensely to the sustenance of life on earth, yet they have been perceived as the source of waterborne and other infectious diseases and a threat to sanitation [26,34,35]. This claim of unhealthy wetlands originates from poor upstream agricultural and mining activities that have degraded the wetlands [36]. This calls for the formulation of integrated and holistic environmental management strategies that simultaneously support the restoration and maintenance of the ecological attributes of wetlands and their benefits to people and the planet [26,37]. In the case of South Africa, over 65% of the country’s wetlands are classified as under threat and 48% of them are critically endangered [34]. This presents a critical outlook for a water-scarce country like South Africa. The country has enacted various governance structures to protect wetlands, but enforcement has been lacking, exposing wetlands to further degradation [37].
Considering the importance of wetlands and the rate at which they have degraded, several models and approaches have been developed to assess their economic and ecological value and the impact on human and environmental health as a result of their degradation [24,26,38]. Existing models tend to focus on nutrient and sediment retention [39,40,41], climate regulation and carbon sequestration [42,43], flood attenuation [44], groundwater recharge and shoreline stabilisation [45,46], among others. This study enhances the existing body of knowledge by developing a model that assesses wetland capacity, by type, to retain particulate and dissolved pollutants that form part of runoff load derived from anthropogenically modified landscapes. The model supports policy and decision-makers to understand the value of wetlands in regulating pollutants from cultivated lands and mines from being deposited into water courses. The model was piloted in the Witbank Dam Catchment (WDC), where water quality has significantly degraded due to massive land use changes that have been taking place in the catchment, including coal mining, extensive agriculture and rapid urbanisation [47]. The motivation is rooted in the understanding that the land use of a catchment determines the amount and quality of runoff water entering its water system [48,49]. The heavily polluted runoff load from the WDC has contributed to the Olifants River becoming one of the most polluted rivers in southern Africa [50], as several incidents of fish mortality have been recorded in the past years [51]. The study refers to runoff toxicants and nutrients to heavy metals and biocides from mines and urban areas and phosphates and nitrates from cultivated lands that form part of the runoff load [52]. These are also referred to as particulate and dissolved pollutants that form part of the runoff load [53].
Given the benefits of wetlands to people and the planet amidst overexploitation and degradation, this study developed a simplified model to guide the formulation of coherent strategies to protect and conserve the remaining healthy wetlands and revive the ones that have been degraded. This model was piloted in the WDC in the Upper Olifants Basin in South Africa. The catchment landscape is heavily modified for its rich and abundant agriculture and mineral resources [50]. The study determined the effectiveness of wetlands in removing pollutants from runoff water passing through anthropogenically modified land uses. Surface runoff is linked with land use area and wetland typology to estimate pollutant runoff generated in the catchment and discharged into the water system.

2. Materials and Methods

2.1. Description of the Study Area

The WDC covers an area of about 3500 km2 in the headwaters of the Olifants River, a major tributary of the Limpopo River Basin. The catchment has seven sub-basins (also known as quaternary basins (QB) in South Africa) as shown in Figure 1. The map (Figure 1) also shows the elevation of the WDC and its location in South Africa. The catchment is located upstream of the Witbank Dam in Mpumalanga Province. It has an average altitude of 1588 m above sea level, a mean annual precipitation of 689 mm, and a mean annual runoff of 125 × 106 m3 a−1. There are over 2900 wetlands of different types in the catchment (Figure 1) [54]. There are abundant groundwater resources found in shallow weathered aquifers which serve as an important source of water in the catchment [55,56]. The geology consists of igneous and metamorphosed rocks. Granite is the dominant rock type, with common occurrences of dolerite intrusions, in the form of dykes and sills, and silicified sedimentary formations [57]. These rock formations favour the vast coal deposits in the catchment. Coal mining and associated industries are a major threat to water quality in Mpumalanga Province [57]. The Witbank coalfields are the largest conterminous coal mining area in South Africa [56].
The dominant soil types are moderately deep sandy to sandy clay loams [56]. The basin’s geology contributed to the formation of the catchment’s five major soil types, including cambic arenosols, chromic luvisols, chromic vertisols, orthic acrisols and rhodic ferrosols [58]. The land use in the catchment is predominantly agriculture (both irrigated and rainfed), improved and unimproved grassland, coal mining and mineral processing, bushland, urban and scattered rural settlements, and power generation (Figure 1). The catchment is densely populated, and the main source of livelihood is agriculture, which contributes to the high diffuse pollution. Therefore, the land area of the catchment has been heavily altered for agricultural and mining purposes [56,59]. About 38% of the catchment area is used for agriculture, placing its water resources at high risk of phosphate and nitrate contamination. The wetlands (Figure 1) are essential for water filtration and nutrient and sediment retention services at different efficiency capacities [59].

2.2. Land Use/Cover and Related Statistics

The land use/cover map was extracted from the 2020 landcover map of South Africa obtained from the Department of Forestry, Fisheries, and Environment (DFFE), available at https://egis.environment.gov.za/sa_national_land_cover_datasets (accessed on 10 August 2024). We assumed that the more the natural land cover is altered for human activities, the greater the risk of generating pollutants and the potential for transporting nutrients and toxicants [60]. The land use of the study area has been severely altered for human activities, particularly for agriculture (Figure 2), exposing its water resources to runoff pollution, which in turn impacts human and environmental health. The dominant land use type, unimproved grassland, occupies 53% of the total catchment area. Unimproved grassland contributes significantly to controlling soil erosion and sediment trapping, but it is not as effective as thickets and bushlands, which are almost non-existent. Thickets and bushlands occupy less than 0.2% of the total catchment area. Cultivated land (rainfed and irrigated), forest plantations and improved grassland (sources of nitrates and phosphates) occupy 39% of the catchment area. Mining and urban areas (sources of toxicants) occupy 6%. Acid mine drainage from coal mining in the province is a major source of environmental damage in Mpumalanga Province [61,62]. The province has the biggest coal deposits in southern Africa. The land use types that have been modified are considered pollution source areas [63]. In most cases, the wetlands have also been modified, mainly for agriculture, reducing their effectiveness in enhancing water quality and providing essential ecosystem services [54,64].

2.3. Calculating Polluted Runoff Load

The study developed a simplified model that links runoff generated in the sub-basins with land use areas subjected to anthropogenic changes. The assumption is that these land uses generate pollutants (Equation (1)). The runoff is assumed to collect pollutants from these modified land uses (built-up areas, cultivated lands, mining areas, and modified grasslands). The runoff load transporting the pollutants (soil particulates and dissolved nutrients from agricultural fields) was estimated by calculating the area of each land use type and then multiplying it by runoff generated in each basin coming from the land use type and expressed as:
L r = ( A l × B r ) F c
where Lr is polluted runoff (m3/year), Al is the area of the land use type that has been altered for human activity and is thus considered a pollutant source land use type (km2), Br is the basin runoff per km2 (m3/km2/year), and Fc is the flow accumulation constraint dataset that determines the exact runoff that discharges into a wetland.
The runoff load, mainly nutrients and toxicants, passes through a wetland as throughflow or is stored for varying periods in wetland storage compartments [65]. Although wetland storage compartments can substantially absorb excess nutrients and toxicants, they have finite boundaries. Once they are full, there will no longer be transfers into these storage facilities. We then developed another equation to calculate the total polluted runoff a wetland can detain (Equation (2)), where the quantity of the runoff load each wetland can detain is calculated as an area percentage of the concentration per volume of the basin and is expressed as:
R w = W p 100 × P t
where Rw is the total polluted runoff that a wetland can detain (m3), Wp is the proportion of a wetland type in relation to the total wetland area of a catchment, and Pt is the total polluted runoff generated in a catchment (m3). The Rw also considers the spatial extent of a wetland to process the polluted runoff relative to the amount of polluted runoff and is processed in ArcGIS Pro 3.3.
The two equations (Equations (1) and (2)) can be combined as follows to have a single model to assess wetland capacity to detain polluted runoff. The complete model is presented as follows:
R w = ( W p 100 × P t ) ( ( A l × B r ) F c )

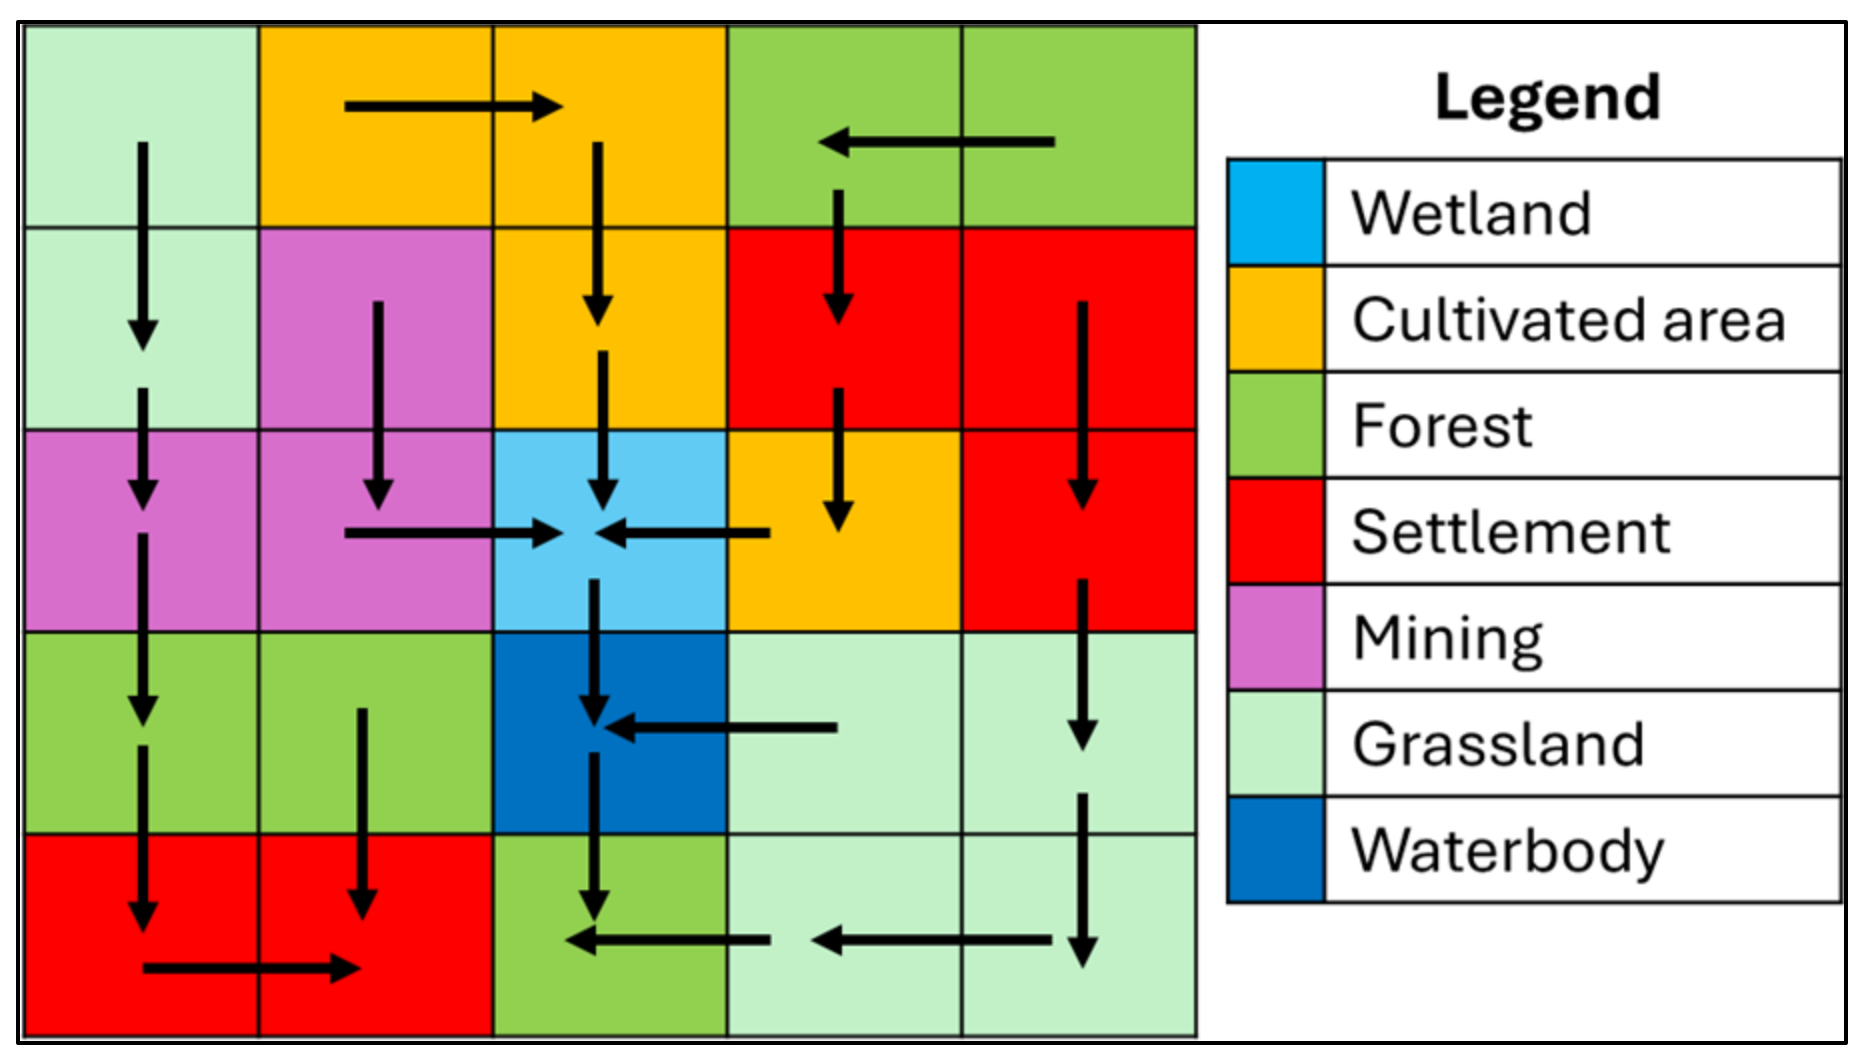
2.4. Runoff Flow Direction and the Upslope Contributing Area

Runoff flows systematically in a basin, and it follows a defined flow pattern [66]. The Flow Accumulation Tool in ArcGIS Pro 3.3. was used to develop a runoff flow control to determine the quantity of runoff water that flows into each wetland (Figure 3). Thus, the Flow Accumulation dataset was used as a constraint, indicating the runoff discharging into a wetland. This facilitated an understanding of the flow of water into each wetland in sub-basins and the upslope contributing area with polluted runoff. A flow-accumulation dataset (map) indicates areas where runoff will accumulate and, therefore, shows landscapes with the highest inflow of water from an upslope contributing area [67].
The Flow Accumulation Tool generates a spatial model showing densities of runoff flow lines that pass through each pixel (wetland areas), which represents a uniform land unit (which is equal to the upslope contributing area of the slope if multiplied by the map resolution). Figure 3 is an illustration of the results that the Flow Accumulation Tool can produce, where land areas (a) with high flow accumulation are zones of concentrated flow (most likely wetlands) and (b) with a flow accumulation of zero are local topographic highs or ridges which are the sources of runoff.

2.5. Ranking of Wetlands According to Filtration Capacity

The wetland types were ranked according to their potential to filter phosphates, nitrates, and toxicants from the runoff load as shown in Table 1. The ranking criteria are derived from the hydrologic benefits rating of wetlands proposed by Kotze et al. [64]. A wetland is ranked 1 (poor) when regarded to have minimal capacity to filter a pollutant type. This means that pollutants will eventually reach waterbodies even if it is temporarily detained for a short time. A rank of 2 (good) means that the wetland is assumed to be able to filter 50% of the pollutants that pass through it, and a rank of 3 (very good) is when a wetland is assumed to have 100% efficiency in filtering pollutants. The authors proposed the filtering percentages by wetland type based on the work of Kotze et al. [64] and from other previous studies that undertook similar work [41,68,69,70].

2.6. Data Sources

The wetland map was obtained from the National Wetland Map 5, which is an improved spatial extent and representation of wetlands of South Africa [54], which can be downloaded at http://opus.sanbi.org/handle/20.500.12143/6917 (accessed on 12 August 2024). The 2020 landcover map was obtained from the Department of Forestry, Fisheries, and Environment (DFFE), available at https://egis.environment.gov.za/sa_national_land_cover_datasets (accessed on 12 August 2024). The mean annual runoff (MAR) dataset was downloaded from the Water Resources dataset (WR90) obtainable at https://www.dws.gov.za/iwqs/wmrq/manual/titles.html (accessed on 12 August 2024). A 30 m resolution Aster Global Digital Elevation Model (Aster GDEM) downloaded from the Earthdata Search at https://search.earthdata.nasa.gov/search (accessed on 12 August 2024) was used to create the flow accumulation dataset that was used to indicate the flow direction and the quantity of runoff that reaches each wetland. All the datasets were processed and analysed in ArcGIS Pro 3.3, a Geographic Information System.

3. Results and Discussion

3.1. Wetland Typology and Statistics of the Study Area

The distribution of wetland types in each quaternary basin within the catchment is shown in Figure 4. The pie chart size represents the relative share of wetlands in each basin in relation to all the wetlands in the whole catchment, and the chart segments indicate the proportion of the area covered by each wetland type in the respective basin. The percentage value in each basin is the proportion of the wetland area relative to the total wetland area of the whole catchment (also indicated by the colour ramp of each basin). Wetlands occupy 13% of the total surface area of the Witbank Dam Catchment.

3.2. Estimating Polluted Runoff Load

The focus was mainly on artificially introduced nitrates and phosphates found in waterbodies originating from agricultural fields and toxicants from mining and urban areas. This study considers these land use types as pollution sources, as they have been modified for human activity. These modified land uses include cultivated land, forest plantations, improved grasslands, mining, and urban areas. Equation (1) was then applied to estimate the annual polluted runoff load in each sub-basin of the catchment (Table 2). The annual runoff from the sub-basin is presented in Table 2.
Polluted runoff originating from each sub-basin is assumed to degrade the waterbodies in that specific sub-basin if the wetland is oversaturated by pollutants beyond its capacity. This implies that water quality enhancement by wetlands occurs within the basin, and once it enters the river network there will be no further sinking of wetlands.

3.3. Estimating Polluted Runoff Load Detained by Wetlands

As already alluded to, particulate and dissolved pollutants pass through a wetland as throughflow or are stored for varying periods in wetland storage compartments [65]. Although wetland storage compartments have a substantial ability to absorb excess particulate and dissolved pollutants, they have finite boundaries, and once they are full, there will no longer be transfers into these storage compartments [71,72]. Using Equation (2), the polluted runoff load was estimated as shown in Table 3.
The proportion of a wetland type relative to the total wetland area within the catchment (Wp) is shown in the charts in Figure 4. The total polluted runoff generated in a catchment (Pt) is given in Table 2. Applying Equation (2), the total polluted runoff (Rw) for each wetland type in each basin is calculated and the results are shown in Table 3 and Table 4. The whole procedure can also be achieved by using Equation (3). Nitrates and phosphate polluted runoff land use sources are the same (as they result from agricultural activity), unlike toxicants from mining and urban areas. Table 1 shows nitrate and phosphate polluted runoff detained by wetlands, whereas Table 4 shows toxicant runoff detained by wetlands. The sum of polluted runoff for the whole catchment in Table 3 and Table 4 gives the same total given in Table 2.
It is assumed that all polluted runoff generated in a catchment is detained by wetlands within that catchment for a certain period, but not all is filtered. Wetland types have different pollutant filtration capacities. Some wetlands are not even capable of filtering certain types of pollutants [64,72]. If a wetland can filter a particular pollutant, it is described as a sink, but if it has no such functions, it becomes a pollutant source [73]. In this study a wetland is regarded as a sink if it has a rank of 2 or 3 (Table 1); that is, it has pollutant-filtering ability. Wetlands ranked 2 or 3 are classified as capable of filtering 50% or 100% of pollutants. Conversely, a wetland is regarded as a pollutant source if it has a rank of 1; it has no pollutant filtration capabilities, thus providing 0% of water quality service. A wetland is considered a sink or filter if the input pollutant is greater than the output, but if the output pollutant is greater than the input, the wetland is considered a pollutant source [64]. Applying the wetland filtration capacity ranking (Table 1) and the data on polluted runoff detained by wetlands (Table 3 and Table 4), the quantity of polluted runoff that is not filtered and is eventually discharged into waterbodies is calculated as given in Table 5 using Equations (1) and (2).

3.4. Level and Impact of Pollution in the Witbank Dam Catchment

The quantity of polluted runoff that eventually drains into the river system of the Witbank Dam Catchment from quaternary basin B11A was estimated and given in Table 5. The process can be replicated for the other basins. However, the totals for each pollutant type from each basin of the whole catchment are given in Table 6. According to the results shown in Table 2, about 57 million m3 of runoff generated in the Witbank Dam Catchment annually are polluted. Of the polluted runoff, 84% originates from cultivated land (irrigated and rainfed) and mines contribute 11%. The rest, 5%, comes from other pollutant sources like urban areas, forest plantations and improved grassland. Runoff from unaltered land use types (unimproved grassland, thicket, and bushland) is excluded, as these land uses enhance water quality by controlling erosion and trapping sediments from reaching the water systems. The totals of polluted runoff from each pollutant type discharged into the river system from each basin are given in Table 5. Table 6 also gives the potential total quantity of polluted runoff water per pollutant type discharged into the river system within the catchment.
The totals for each pollutant type in each sub-basin were used to calculate the total pollutant type and the percentages that are discharged into the whole WDC per annum. A sum of the percentage of the totals of polluted runoff per pollutant type gives a percentage total of 85%. This means a total of 85% of polluted runoff generated in the catchment is discharged into the river system of the catchment annually. The remaining 15% is the only polluted runoff that the wetlands can filter. This may explain why the Witbank Dam (located on the catchment outlet) and the downstream water resources are heavily polluted, risking water use and aquatic life downstream. Several incidents of fish mortality have been recorded in the past years, and most recently the rate of crocodile mortality has been very alarming [36,74].

3.5. Validation of the Results

The model results were validated by assessing the contamination levels of As, Cr, Cu, Fe, Mn, Ni, Pb, and Zn taken from samples collected from upstream, midstream and downstream of four tributaries of the Olifants River Basin during a previous study [75] (Table 7). The observed contamination levels of the trace metals were compared with the permissible international levels for waterbodies as per the sediment quality guidelines [76,77]. The overall assessment indicated extremely elevated levels of As, Cr, Mn, and Ni, and some samples were severely enriched and extremely contaminated with As, Cr, and Ni [75]. This is evidence of the predominantly mining and agricultural land uses in the catchment as reported in this study.
Overall, the midstream and downstream sampling points had higher levels of pollutants than upstream sites due to the concentration of pollutants downstream which has endangered aquatic life. This is also evidence of increased anthropogenic activities in the whole basin. The concentrations were even higher in sampling points that were closer to mining, urban and agriculture areas, but steadily decreased with distance from these point sources [75]. Pollutant concentration levels in the Olifants River were also found to be worse than in other rivers in South Africa and other countries [75], except from other known highly polluted water courses that include the Strzyza River in Poland [78], Calore River in Italy [79], Nile River in Egypt [80] and Ipojuca in Brazil [81].
The present study’s results support the findings of previous studies that confirmed the high contamination levels in the Olifants River. The heavily polluted runoff load from the severely altered land use in Olifants Basin has contributed to the Olifants River becoming one of the most degraded rivers in southern Africa, as results from the current study have indicated that over 85% of nutrients and toxicants from coal mines end up in river systems.

3.6. Limitations of the Model

The results are only indicative, as other factors like evaporation and export coefficients, among other factors, were not included in this current model. The developed approach only assessed runoff load from anthropogenically modified land covers. It did not consider unmodified natural land cover, as we assumed that unaltered land covers do not generate pollutants. It is also important to note that the effectiveness of wetlands in runoff flow regulation and detention of pollutants depends on their size, placement, and local conditions. Future research can refine the model by considering distinctions between the pollutant loading of different non-natural land cover types. The current model provides the initial phase to develop a more robust approach capable of assessing the capability of wetland types to filter pollutants and guide strategic policy decisions to reduce pollutant loads from anthropogenically modified land covers. One such policy decision would be to indicate spatial areas in the catchment where wetlands would benefit more in enhancing water quality due to high pollution levels. Also, we assumed that all the wetlands in the catchment are in good condition to enhance water quality, yet this may not be what is on the ground, as some wetlands could have been severely degraded by mining and other anthropogenic activities and no longer offer the ecosystem services at the same level as when they were healthy. A comprehensive fieldwork may be required to assess the clear state of the wetlands. The wetland state is another factor that needs to be included in the refined model. Areas for future research include the role of denitrification in pollutant removal and the uptake of pollutants by plants as nutrients. This current study only focused on the capability of wetlands to detain runoff pollutants.

4. Conclusions

This study developed a simplified approach to assess the impact of polluted runoff load on wetland health to continue offering optimum ecosystem services. The approach facilitated the assessment of wetland value in enhancing water quality and ensuring human and environmental health. Surface runoff has been considered a standard to quantify nonpoint source pollution, as it is responsible for transporting nutrients and toxicants into river systems. The method enabled estimating the polluted runoff discharged into the river system, giving results that are consistent with the water quality challenges in the Witbank Dam Catchment and the downstream Limpopo River basin which has seen a rise in crocodile and fish mortality. The heavily polluted runoff load from the severely altered land use in the catchment has contributed to the Olifants River becoming one of the most degraded rivers in southern Africa. Over 85% of nutrients and toxicants from coal mines end up in river systems, risking human and environmental health. The applied method allowed identifying pollutant source areas, making it a valuable tool for decision-makers, especially for remedial intervention. Although wetlands in the Witbank Dam Catchment are playing a key role in enhancing water quality, huge quantities of polluted runoff are still discharged into the river system of the catchment, as the wetlands are unable to cope with the heavily polluted runoff load. Although wetlands have a substantial ability to absorb excess pollutants, they have finite boundaries, and once they are full, they will no longer be able to absorb any further pollutants. The excess is discharged into the river system.

Author Contributions

Conceptualization, S.M. and L.N.; methodology, S.M., L.N., S.L., C.M. and T.M.; validation, S.L., C.M. and T.M.; formal analysis, S.M. and L.N.; investigation, L.N., S.M., C.M. and T.M.; resources, S.M. and L.N.; data curation, S.M., L.N. and C.M.; writing—original draft preparation, S.M. and L.N.; writing—review and editing, S.L., C.M. and T.M.; visualization, S.L. and L.N.; supervision, S.L.; project administration, S.M.; funding acquisition, S.L. and T.M. All authors have read and agreed to the published version of the manuscript.

Funding

This research was funded by The Water Research Commission (WRC) through the Research, Development, and Innovation (RDI) Branch, grant number WRC_RDI/2024 and the Sustainable and Health Food Systems—Southern Africa (SHEFS-SA) Programme, supported by the Welcome Trust [Grant No 227749/Z/23/Z]. The APC was funded by WRC and SHEFS-SA.

Data Availability Statement

All data that support the findings of this study are included within the article.

Conflicts of Interest

The authors declare no conflicts of interest.

References

  1. Nhamo, L.; Magidi, J.; Dickens, C. Determining wetland spatial extent and seasonal variations of the inundated area using multispectral remote sensing. Water 2017, 43, 543–552. [Google Scholar] [CrossRef]
  2. Ashok, A.; Rani, H.P.; Jayakumar, K. Monitoring of dynamic wetland changes using NDVI and NDWI based Landsat imagery. Remote Sens. Appl. Soc. Environ. 2021, 23, 100547. [Google Scholar] [CrossRef]
  3. Steven, D.D.; Lowrance, R. Agricultural conservation practices and wetland ecosystem services in the wetland-rich Piedmont-Coastal Plain region. Ecol. Appl. 2011, 21, S3–S17. [Google Scholar] [CrossRef]
  4. Xu, X.; Jiang, B.; Tan, Y.; Costanza, R.; Yang, G. Lake-wetland ecosystem services modeling and valuation: Progress, gaps and future directions. Ecosyst. Serv. 2018, 33, 19–28. [Google Scholar] [CrossRef]
  5. Mitsch, W.J.; Bernal, B.; Hernandez, M.E. Ecosystem services of wetlands. Int. J. Biodivers. Sci. Ecosyst. Serv. Manag. 2015, 11, 1–4. [Google Scholar] [CrossRef]
  6. Singha, P.; Pal, S. Wetland transformation and its impact on the livelihood of the fishing community in a flood plain river basin of India. Sci. Total Environ. 2023, 858, 159547. [Google Scholar] [CrossRef] [PubMed]
  7. Eller, F.; Arias, C.A.; Sorrell, B.K.; Brix, H. Preface: Wetland ecosystems—Functions and use in a changing climate. Hydrobiologia 2021, 848, 3255–3258. [Google Scholar] [CrossRef]
  8. Ferreira, C.S.; Kašanin-Grubin, M.; Solomun, M.K.; Sushkova, S.; Minkina, T.; Zhao, W.; Kalantari, Z. Wetlands as nature-based solutions for water management in different environments. Curr. Opin. Environ. Sci. Health 2023, 33, 100476. [Google Scholar] [CrossRef]
  9. Boretti, A.; Rosa, L. Reassessing the projections of the World Water Development Report. NPJ Clean Water 2019, 2, 15. [Google Scholar] [CrossRef]
  10. Maltby, E. The wetlands paradigm shift in response to changing societal priorities: A reflective review. Land 2022, 11, 1526. [Google Scholar] [CrossRef]
  11. Carvalho, P.N.; Arias, C.A.; Brix, H. Constructed wetlands for water treatment: New developments. Water 2017, 9, 397. [Google Scholar] [CrossRef]
  12. Simon, M.; Joshi, H. A review on green technologies for the rejuvenation of polluted surface water bodies: Field-scale feasibility, challenges, and future perspectives. J. Environ. Chem. Eng. 2021, 9, 105763. [Google Scholar] [CrossRef]
  13. Waly, M.M.; Ahmed, T.; Abunada, Z.; Mickovski, S.B.; Thomson, C. Constructed wetland for sustainable and low-cost wastewater treatment. Land 2022, 11, 1388. [Google Scholar] [CrossRef]
  14. Stefanakis, A.I. The role of constructed wetlands as green infrastructure for sustainable urban water management. Sustainability 2019, 11, 6981. [Google Scholar] [CrossRef]
  15. Hota, A.; Patro, S.G.K.; Obaid, A.J.; Khatak, S.; Kumar, R. Constructed wetland challenges for the treatment of industrial wastewater in smart cities: A sensitive solution. Sustain. Energy Technol. Assess. 2023, 55, 102967. [Google Scholar] [CrossRef]
  16. Roberts, M.T.; Geris, J.; Hallett, P.D.; Wilkinson, M.E. Mitigating floods and attenuating surface runoff with temporary storage areas in headwaters. Wiley Interdiscip. Rev. Water 2023, 10, e1634. [Google Scholar] [CrossRef]
  17. Norman, L.M.; Lal, R.; Wohl, E.; Fairfax, E.; Gellis, A.C.; Pollock, M.M. Natural infrastructure in dryland streams (NIDS) can establish regenerative wetland sinks that reverse desertification and strengthen climate resilience. Sci. Total Environ. 2022, 849, 157738. [Google Scholar] [CrossRef] [PubMed]
  18. Lundholm, J.T. The ecology and evolution of constructed ecosystems as green infrastructure. Front. Ecol. Evol. 2015, 3, 106. [Google Scholar] [CrossRef]
  19. Martínez-Espinosa, C.; Sauvage, S.; Al Bitar, A.; Green, P.A.; Vörösmarty, C.J.; Sánchez-Pérez, J.M. Denitrification in wetlands: A review towards a quantification at global scale. Sci. Total Environ. 2021, 754, 142398. [Google Scholar] [CrossRef] [PubMed]
  20. Janse, J.H.; Van Dam, A.A.; Hes, E.M.; de Klein, J.J.; Finlayson, C.M.; Janssen, A.B.; van Wijk, D.; Mooij, W.M.; Verhoeven, J.T. Towards a global model for wetlands ecosystem services. Curr. Opin. Environ. Sustain. 2019, 36, 11–19. [Google Scholar] [CrossRef]
  21. Mitsch, W.J.; Bernal, B.; Nahlik, A.M.; Mander, Ü.; Zhang, L.; Anderson, C.J.; Jørgensen, S.E.; Brix, H. Wetlands, carbon, and climate change. Landsc. Ecol. 2013, 28, 583–597. [Google Scholar] [CrossRef]
  22. Were, D.; Kansiime, F.; Fetahi, T.; Cooper, A.; Jjuuko, C. Carbon sequestration by wetlands: A critical review of enhancement measures for climate change mitigation. Earth Syst. Environ. 2019, 3, 327–340. [Google Scholar] [CrossRef]
  23. Salimi, S.; Almuktar, S.A.; Scholz, M. Impact of climate change on wetland ecosystems: A critical review of experimental wetlands. J. Environ. Manag. 2021, 286, 112160. [Google Scholar] [CrossRef] [PubMed]
  24. Duku, E.; Mattah, P.A.D.; Angnuureng, D.B. Assessment of wetland ecosystem services and human wellbeing nexus in sub-Saharan Africa: Empirical evidence from a socio-ecological landscape of Ghana. Environ. Sustain. Indic. 2022, 15, 100186. [Google Scholar] [CrossRef]
  25. Owethu Pantshwa, A.; Buschke, F.T. Ecosystem services and ecological degradation of communal wetlands in a South African biodiversity hotspot. R. Soc. Open Sci. 2019, 6, 181770. [Google Scholar] [CrossRef] [PubMed]
  26. Alikhani, S.; Nummi, P.; Ojala, A. Urban wetlands: A review on ecological and cultural values. Water 2021, 13, 3301. [Google Scholar] [CrossRef]
  27. Sandifer, P.A.; Sutton-Grier, A.E.; Ward, B.P. Exploring connections among nature, biodiversity, ecosystem services, and human health and well-being: Opportunities to enhance health and biodiversity conservation. Ecosyst. Serv. 2015, 12, 1–15. [Google Scholar] [CrossRef]
  28. Manisalidis, I.; Stavropoulou, E.; Stavropoulos, A.; Bezirtzoglou, E. Environmental and health impacts of air pollution: A review. Front. Public Health 2020, 8, 14. [Google Scholar] [CrossRef] [PubMed]
  29. Langensiepen, M.; Opiyo, E.O.; Kaudia, A.A.; Rugege, D.; Richard, K.; Akotsi, E.; Ashitiva, D.; Ningu, J.K.; Munyazikwiye, F.; Ngaboyamahina, T. Reconciling East-African Wetland Conservation with Human Needs: Managing Uncertainties in Environmental Policy Design. Wetlands 2023, 43, 36. [Google Scholar] [CrossRef]
  30. Zsuffa, I.; Van Dam, A.; Kaggwa, R.; Namaalwa, S.; Mahieu, M.; Cools, J.; Johnston, R. Towards decision support-based integrated management planning of papyrus wetlands: A case study from Uganda. Wetl. Ecol. Manag. 2014, 22, 199–213. [Google Scholar] [CrossRef]
  31. Zou, Y.; Duan, X.; Xue, Z.; Mingju, E.; Sun, M.; Lu, X.; Jiang, M.; Yu, X. Water use conflict between wetland and agriculture. J. Environ. Manag. 2018, 224, 140–146. [Google Scholar] [CrossRef] [PubMed]
  32. Seifollahi-Aghmiuni, S.; Nockrach, M.; Kalantari, Z. The potential of wetlands in achieving the sustainable development goals of the 2030 Agenda. Water 2019, 11, 609. [Google Scholar] [CrossRef]
  33. UN. The Sustainable Development Goals Report 2023: Special Edition. Towards a Rescue Plan for People and Planet; UN: New York, NY, USA, 2023; 80p. [Google Scholar]
  34. Sinthumule, N.I. An analysis of communities’ attitudes towards wetlands and implications for sustainability. Glob. Ecol. Conserv. 2021, 27, e01604. [Google Scholar] [CrossRef]
  35. Anthonj, C.; Rechenburg, A.; Kistemann, T. Water, sanitation and hygiene in wetlands. A case study from the Ewaso Narok Swamp, Kenya. Int. J. Hyg. Environ. Health 2016, 219, 606–616. [Google Scholar] [CrossRef] [PubMed]
  36. Riddell, E.S.; Govender, D.; Botha, J.; Sithole, H.; Petersen, R.M.; Shikwambana, P. Pollution impacts on the aquatic ecosystems of the Kruger National Park, South Africa. Science 2019, 6, e00195. [Google Scholar] [CrossRef]
  37. Lemine, B.J. Developing a strategy for efficient environmental authorisation of activities affecting wetlands in South Africa: Towards a wise-use approach. Obiter 2020, 41, 154–167. [Google Scholar] [CrossRef]
  38. Joorabian Shooshtari, S.; Jahanishakib, F. Estimating the severity of landscape degradation in future management scenarios based on modeling the dynamics of Hoor Al-Azim International Wetland in Iran-Iraq border. Sci. Rep. 2024, 14, 11877. [Google Scholar] [CrossRef] [PubMed]
  39. Johnes, P.J.; Gooddy, D.C.; Heaton, T.H.; Binley, A.; Kennedy, M.P.; Shand, P.; Prior, H. Determining the impact of riparian wetlands on nutrient cycling, storage and export in permeable agricultural catchments. Water 2020, 12, 167. [Google Scholar] [CrossRef]
  40. Piñeyro, M.; Chalar, G.; Quintans, F. Constructed wetland scale model: Organic matter and nutrients removal from the effluent of a fish processing plant. Int. J. Environ. Sci. Technol. 2019, 16, 4181–4192. [Google Scholar] [CrossRef]
  41. Mereta, S.T.; De Meester, L.; Lemmens, P.; Legesse, W.; Goethals, P.L.; Boets, P. Sediment and nutrient retention capacity of natural riverine wetlands in Southwest Ethiopia. Front. Environ. Sci. 2020, 8, 122. [Google Scholar] [CrossRef]
  42. Zhang, Z.; Jiang, W.; Peng, K.; Wu, Z.; Ling, Z.; Li, Z. Assessment of the impact of wetland changes on carbon storage in coastal urban agglomerations from 1990 to 2035 in support of SDG15. 1. Sci. Total Environ. 2023, 877, 162824. [Google Scholar] [CrossRef]
  43. Silan, G.; Buosi, A.; Bertolini, C.; Sfriso, A. Dynamics and drivers of carbon sequestration and storage capacity in Phragmites australis-dominated wetlands. Estuar. Coast. Shelf Sci. 2024, 298, 108640. [Google Scholar] [CrossRef]
  44. Wu, Y.; Zhang, G.; Rousseau, A.N.; Xu, Y.J.; Foulon, É. On how wetlands can provide flood resilience in a large river basin: A case study in Nenjiang River Basin, China. J. Hydrol. 2020, 587, 125012. [Google Scholar] [CrossRef]
  45. Kadykalo, A.N.; Findlay, C.S. The flow regulation services of wetlands. Ecosyst. Serv. 2016, 20, 91–103. [Google Scholar] [CrossRef]
  46. Abraham, T.; Muluneh, A.; Girma, R.; Hartmann, A.; Tekleab, S. Quantifying sensitivity of groundwater recharge to land use and land cover changes by improving model performance on the wetland dominated Tikur Wuha watershed, Ethiopia. Water Cycle 2022, 3, 112–125. [Google Scholar] [CrossRef]
  47. Mativenga, P.T.; Marnewick, A. Water quality in a mining and water-stressed region. J. Clean. Prod. 2018, 171, 446–456. [Google Scholar]
  48. Nkosi, M.; Mathivha, F.I.; Odiyo, J.O. Impact of Land Management on Water Resources, a South African Context. Sustainability 2021, 13, 701. [Google Scholar] [CrossRef]
  49. Walsh, G.W.; Wepener, V. The influence of land use on water quality and diatom community structures in urban and agriculturally stressed rivers. Water 2009, 35, 579–594. [Google Scholar] [CrossRef]
  50. Dabrowski, J.M.; De Klerk, L. An assessment of the impact of different land use activities on water quality in the upper Olifants River catchment. Water 2013, 39, 231–244. [Google Scholar] [CrossRef]
  51. Genthe, B.; Kapwata, T.; Le Roux, W.; Chamier, J.; Wright, C.Y. The reach of human health risks associated with metals/metalloids in water and vegetables along a contaminated river catchment: South Africa and Mozambique. Chemosphere 2018, 199, 1–9. [Google Scholar] [CrossRef]
  52. Göbel, P.; Dierkes, C.; Coldewey, W. Storm water runoff concentration matrix for urban areas. J. Contam. Hydrol. 2007, 91, 26–42. [Google Scholar] [CrossRef] [PubMed]
  53. Zhang, T.; Xiao, Y.; Liang, D.; Tang, H.; Yuan, S.; Luan, B. Rainfall runoff and dissolved pollutant transport processes over idealized urban catchments. Front. Earth Sci. 2020, 8, 305. [Google Scholar] [CrossRef]
  54. van Deventer, H.; van Niekerk, L.; Adams, J.; Dinala, M.K.; Gangat, R.; Lamberth, S.J.; Lötter, M.; Mbona, N.; MacKay, F.; Nel, J.L. National Wetland Map 5: An improved spatial extent and representation of inland aquatic and estuarine ecosystems in South Africa. Water 2020, 46, 66–79. [Google Scholar] [CrossRef]
  55. Magidi, J.; Nhamo, L.; Mpandeli, S.; Mabhaudhi, T. Application of the random forest classifier to map irrigated areas using Google Earth Engine. Remote Sens. 2021, 13, 876. [Google Scholar] [CrossRef] [PubMed]
  56. Hobbs, P.; Oelofse, S.H.; Rascher, J. Management of environmental impacts from coal mining in the upper Olifants River catchment as a function of age and scale. Int. J. Water Resour. Dev. 2008, 24, 417–431. [Google Scholar] [CrossRef]
  57. Barnes, M.; Vermeulen, P. Guide to groundwater monitoring for the coal industry. Water 2012, 38, 831–836. [Google Scholar] [CrossRef]
  58. Sanchez, P.A.; Ahamed, S.; Carré, F.; Hartemink, A.E.; Hempel, J.; Huising, J.; Lagacherie, P.; McBratney, A.B.; McKenzie, N.J.; Mendonça-Santos, M.D.L. Digital soil map of the world. Science 2009, 325, 680–681. [Google Scholar] [CrossRef] [PubMed]
  59. Magidi, J.; van Koppen, B.; Nhamo, L.; Mpandeli, S.; Slotow, R.; Mabhaudhi, T. Informing Equitable Water and Food Policies through Accurate Spatial Information on Irrigated Areas in Smallholder Farming Systems. Water 2021, 13, 3627. [Google Scholar] [CrossRef] [PubMed]
  60. Cheng, C.; Zhang, F.; Shi, J.; Kung, H.-T. What is the relationship between land use and surface water quality? A review and prospects from remote sensing perspective. Environ. Sci. Pollut. Res. 2022, 29, 56887–56907. [Google Scholar] [CrossRef] [PubMed]
  61. Feris, L.; Kotze, L.J. The regulation of acid mine drainage in South Africa: Law and governance perspectives. Potchefstroom Electron. Law J. 2014, 17, 2105–2163. [Google Scholar]
  62. Atangana, E. An indices-based water quality model to evaluate surface water quality: A case study in Vaalwaterspruit, Mpumalanga, South Africa. J. Afr. Earth Sci. 2023, 205, 105001. [Google Scholar] [CrossRef]
  63. Camara, M.; Jamil, N.R.; Abdullah, A.F.B. Impact of land uses on water quality in Malaysia: A review. Ecol. Process. 2019, 8, 10. [Google Scholar] [CrossRef]
  64. Kotze, D.; Marneweck, G.; Batchelor, A.; Lindley, D.; Collins, N. WET-EcoServices: A Technique for Rapidly Assessing Ecosystem Services Supplied by Wetlands; Water Research Commission (WRC): Pretoria, South Africa, 2009; 80p. [Google Scholar]
  65. Lloyd, C.; Johnes, P.; Freer, J.; Carswell, A.; Jones, J.; Stirling, M.; Hodgkinson, R.; Richmond, C.; Collins, A. Determining the sources of nutrient flux to water in headwater catchments: Examining the speciation balance to inform the targeting of mitigation measures. Sci. Total Environ. 2019, 648, 1179–1200. [Google Scholar] [CrossRef] [PubMed]
  66. Ran, G.; Jian, S.; Wu, Q.; Zhang, L.; Hu, C. Exploring the dominant runoff processes in two typical basins of the Yellow River, china. Water 2020, 12, 3055. [Google Scholar] [CrossRef]
  67. de Jong, K.; Panja, D.; Karssenberg, D.; van Kreveld, M. Scalability and composability of flow accumulation algorithms based on asynchronous many-tasks. Comput. Geosci. 2022, 162, 105083. [Google Scholar] [CrossRef]
  68. Sileshi, A.; Awoke, A.; Beyene, A.; Stiers, I.; Triest, L. Water purifying capacity of natural riverine wetlands in relation to their ecological quality. Front. Environ. Sci. 2020, 8, 39. [Google Scholar] [CrossRef]
  69. Wu, Y.; Zhang, G.; Rousseau, A.N. Quantitative assessment on basin-scale hydrological services of wetlands. Sci. China Earth Sci. 2020, 63, 279–291. [Google Scholar] [CrossRef]
  70. Schück, M.; Greger, M. Chloride removal capacity and salinity tolerance in wetland plants. J. Environ. Manag. 2022, 308, 114553. [Google Scholar] [CrossRef] [PubMed]
  71. Zhang, Y.; Ji, Z.; Pei, Y. Nutrient removal and microbial community structure in an artificial-natural coupled wetland system. Process Saf. Environ. Prot. 2021, 147, 1160–1170. [Google Scholar] [CrossRef]
  72. Vymazal, J. Removal of nutrients in constructed wetlands for wastewater treatment through plant harvesting–Biomass and load matter the most. Ecol. Eng. 2020, 155, 105962. [Google Scholar] [CrossRef]
  73. Díaz, F.J.; Anthony, T.; Dahlgren, R.A. Agricultural pollutant removal by constructed wetlands: Implications for water management and design. Agric. Water Manag. 2012, 104, 171–183. [Google Scholar] [CrossRef]
  74. Oberholster, P.J.; Myburgh, J.; Ashton, P.; Botha, A.-M. Responses of phytoplankton upon exposure to a mixture of acid mine drainage and high levels of nutrient pollution in Lake Loskop, South Africa. Ecotoxicol. Environ. Saf. 2010, 73, 326–335. [Google Scholar] [CrossRef]
  75. Addo-Bediako, A. Comparative spatial assessment of trace metal (loid) pollution in the sediments of the lower Olifants River Basin in South Africa. Front. Environ. Sci. 2022, 10, 882393. [Google Scholar] [CrossRef]
  76. Wenning, R.J.; Ingersoll, C.G. (Eds.) Use of Sediment Quality Guidelines and Related Tools for the Assessment of Contaminated Sediments; SETAC: Lake Arrowhead, CA, USA, 2005; 48p. [Google Scholar]
  77. Turekian, K.K.; Wedepohl, K.H. Distribution of the elements in some major units of the earth’s crust. Geol. Soc. Am. Bull. 1961, 72, 175–192. [Google Scholar] [CrossRef]
  78. Nawrot, N.; Wojciechowska, E.; Matej-Łukowicz, K.; Walkusz-Miotk, J.; Pazdro, K. Spatial and vertical distribution analysis of heavy metals in urban retention tanks sediments: A case study of Strzyza Stream. Environ. Geochem. Health 2020, 42, 1469–1485. [Google Scholar] [CrossRef] [PubMed]
  79. Zuzolo, D.; Cicchella, D.; Catani, V.; Giaccio, L.; Guagliardi, I.; Esposito, L.; De Vivo, B. Assessment of potentially harmful elements pollution in the Calore River basin (Southern Italy). Environ. Geochem. Health 2017, 39, 531–548. [Google Scholar] [CrossRef] [PubMed]
  80. Abdel-Satar, A.M.; Ali, M.H.; Goher, M.E. Indices of water quality and metal pollution of Nile River, Egypt. Egypt. J. Aquat. Res. 2017, 43, 21–29. [Google Scholar] [CrossRef]
  81. Silva, Y.J.A.B.d.; Cantalice, J.R.B.; Singh, V.P.; Nascimento, C.W.A.d.; Wilcox, B.P.; Silva, Y.J.A.B.d. Heavy metal concentrations and ecological risk assessment of the suspended sediments of a multi-contaminated Brazilian watershed. Acta Sci. Agron. 2019, 41, e42620. [Google Scholar] [CrossRef]
Figure 1. Location, elevation, and wetland types of the Witbank Dam Catchment. Source: Van Devente et al., 2020 [54].
Water 16 02287 g001
Figure 2. Land use/cover of the Witbank Dam Catchment.
Water 16 02287 g002
Figure 3. An illustration of how the flow accumulation tool works. The tool was used to constrain and determine the exact runoff that discharges into a wetland.
Water 16 02287 g003
Figure 4. Abundance and typology of wetlands in the Quaternary Basins of the Witbank Dam Catchment.
Water 16 02287 g004
Table 1. Nutrient and toxicant regulatory services provided by wetlands.
Wetland TypePhosphatesNitratesToxicants
Channelled valley bottom222
Flat122
Seep132
Valley-head seep133
Depression122
Floodplain322
Unchannelled valley bottom222
Note(s): 1—Poor, 2—Good, 3—Very good.
Table 2. Contaminated runoff produced in each quaternary basin per land use type in the Witbank Dam Catchment.
Quaternary BasinArea (km2)Runoff
(103 m3/km2/Year)
Polluted Runoff Volume from Each Land Use/Cover
(103 m3/Year)
Total Polluted Runoff
(103 m3/Year)
Cultivated LandForestImproved GrasslandMiningUrban
B11A946.0538.8915,410.62177.76117.920.0023.8615,730.2
B11B435.4336.167218.4171.938.96927.66195.138422.1
B11C387.0733.115340.349.770.000.000.045350.2
B11D551.2030.085823.6335.7843.14872.24320.377095.2
B11E466.0332.246221.80102.9869.701125.5365.887585.9
B11F430.3434.265340.15248.98134.021486.0794.107303.3
B11G367.7735.842655.54350.31194.111763.38615.175578.5
Total3583.9 48,010.5997.5567.86174.91314.657,065.3
Table 3. Total nitrate- and phosphate-polluted runoff detained by wetland types in each basin.
Wetland TypeN- and P-Polluted Runoff Detained by Wetland Types (103 m3/Year)Total (WDC)
B11AB11BB11CB11DB11EB11FB11G
Channelled valley bottom 5267.011395.06251.051087.363527.453194.71418.1315,140.77
Depression677.05391.5250.74157.20333.77450.05550.752611.08
Flat1515.88805.06606.41563.47554.15686.10360.165091.25
Floodplain wetland5221.653427.143727.963052.29401.37599.571475.5717,905.55
Seep2915.111054.23667.15888.991399.28660.56318.927904.24
Unchanneled valley bottom 49.13213.0112.6590.84166.13108.2574.73714.74
Valleyhead seep60.4212.8234.0362.1512.4823.851.96207.72
Total15,706.267298.845350.005902.316394.635723.093200.2249,575.35
Table 4. Total toxicant-polluted runoff detained by wetland types in each basin.
Wetland TypeToxicant-Polluted Runoff Detained by Wetland Types (103 m3/Year)Total (WDC)
B11AB11BB11CB11DB11EB11FB11G
Channelled valley bottom8.00214.590.00219.70657.23882.06310.802292.39
Depression1.0360.220.0031.7662.19124.26409.37688.84
Flat2.30123.840.00113.85103.25189.43267.71800.39
Floodplain wetland7.93527.170.03616.7274.78165.541096.802488.97
Seep4.43162.160.00179.62260.71182.38237.051026.36
Unchanneled valley bottom0.0732.770.0018.3530.9529.8955.55167.58
Valleyhead seep0.091.970.0012.562.336.591.4624.99
Total23.861122.720.041192.561191.441580.152378.747489.52
Table 5. Nutrient and toxicant runoff that eventually enters the river system in B11A (103 m3/year).
PhosphatesNitratesToxicants
Wetland TypeTotal P and N RunoffRankPolluted OutflowRankPolluted OutflowTotal Tox RunoffRankPolluted Outflow
Channelled valley bottom5275.0122637.5122637.518.0024
Depression678.081678.082339.041.0320.51
Flat1518.1911518.192759.102.3021.15
Floodplain wetland5229.5930.0022614.807.9323.97
Seep2919.5412919.5430.004.4322.22
Unchanneled valley bottom49.21224.61224.610.0720.04
Valleyhead seep60.51160.5130.000.0930
Total polluted outflow15,730.12 7838.44 6375.0623.86 11.89
Table 6. Polluted runoff discharged into the river network of the Witbank Dam Catchment.
Quaternary BasinType of Pollutant Runoff (103 m3/Year)
Phosphate RunoffNitrate RunoffToxicant Runoff
B11A7838.446375.0611.89
B11B3068.673115.9560.39
B11C1490.192324.470.02
B11D2260.912455.59584.81
B11E4146.482491.46594.62
B11F3472.12518.91786.79
B11G1478.231439.691288.66
Total (WDC)23,755.0220,721.083827.18
Percentage (%) of total polluted runoff42%36%7%
Table 7. Average pollutant concentrations in the Olifants River and the average shale values and sediment quality guidelines (SQG) values.
Sampling PointASCrCuFeMnNiPbZn
BL150.841.563.625,333.0685.3109.97.542.8
BL251.080.474.028,108.8949.8115.17.248.3
BL345.0108.063.446,210.01299.0281.77.438.6
MH16.6260.521.712,001.5567.864.75.916.2
MH28.0245.016.474,664.52581.549.28.520.3
MH3 4.8416.320.334,761.0682.372.010.054.5
SL13.861.80.014,400.0254.579.50.011.0
SL22.052.50.015,000.0270.5144.70.029.5
SL31.746.80.012,700.0209.088.30.029.0
ST10.9106.325.3177,173.81167.816.65.489.1
ST20.42252.813.7133,291.81560.892.04.147.5
ST31.91096.321.2135,981.51783.8119.517.092.0
Av. Shale value *13.090.045.047,200.0850.068.020.095.0
SQG *5.9 37.335.7
Note(s): * Turekian and Wedepohl [77]; SQG, Sediment Quality Guideline [76]. Source: Addo-Bediako [75].
Disclaimer/Publisher’s Note: The statements, opinions and data contained in all publications are solely those of the individual author(s) and contributor(s) and not of MDPI and/or the editor(s). MDPI and/or the editor(s) disclaim responsibility for any injury to people or property resulting from any ideas, methods, instructions or products referred to in the content.

