Article

Numerical Simulation Study on Three-Dimensional Flow Characteristics and Probability Density Distribution of Water-Permeable Gabion Backflow Zone in Different Curvature Bends

1
College of Civil Engineering, North Minzu University, Yinchuan 750021, China
2
College of Mathematics and Information Science, North Minzu University, Yinchuan 750021, China
*
Author to whom correspondence should be addressed.
Water 2024, 16(16), 2247; https://doi.org/10.3390/w16162247
Submission received: 27 June 2024 / Revised: 24 July 2024 / Accepted: 7 August 2024 / Published: 9 August 2024
(This article belongs to the Special Issue Mathematical Models of Fluid Dynamics)

Abstract

:
This study explored the three-dimensional flow characteristics in a recirculation zone near a permeable buttress in curved channels with varying curvatures. Understanding these characteristics is crucial for managing natural river bends, as rivers often meander, with backwater zones formed behind obstructions, such as mountains in the riverbed. The direct comparison of the recirculation zones across different bend types revealed the correlation between the flow characteristics and bend curvature. However, previous studies have focused on flow velocities and turbulent kinetic energy without a probability density analysis. This analysis provided a more comprehensive understanding of the flow characteristics. Gaussian kernel density estimation was applied in this study to observe the distribution of the flow velocities, turbulent kinetic energy, and turbulent kinetic energy dissipation rate. The results indicated that the longitudinal time-averaged flow velocity in the recirculation zone typically ranged from −0.2 m/s to −0.8 m/s, with all the skewness coefficients exceeding 0. The horizontal time-averaged flow velocity in the recirculation zone fell between −0.175 m/s and −0.1 m/s. The skewness coefficients were negative at water depths of 16%, 33%, and 50% within the 90° and 180° bends, indicating a non-normal distribution. The probability density distribution of turbulent kinetic energy in the recirculation zone was skewed, ranging from 0 to 0.02 m2·s−2, with the skewness coefficient almost always greater than 0. The plot demonstrated multiple peaks, indicating a broad distribution of turbulent kinetic energy rather than a concentration within a specific interval. This distribution included both the high and low regions of turbulent kinetic energy. Although the overall rate of turbulent kinetic energy dissipation in the recirculation zone was relatively low, there were multiple peaks, suggesting the localized areas with higher dissipation rates alongside the regions with lower rates. These findings were significant for managing the meandering river channels, restoring the subaqueous ecosystems, understanding the pollutant diffusion mechanisms in backwater areas, the sedimentation of nutrient-laden sediments, and optimizing the parameters for spur dike design.

1. Introduction

In natural environments, rivers exhibit meandering and twisting patterns, where hydraulic factors and sediment content in different bends gradually shape canals over time [1]. To protect riverbanks, restore underwater ecosystems, and mitigate unpredictable river migration, engineers have implemented permeable spur dike hydraulic structures within riverbeds [2,3,4]. A permeable spur dike is a straightforward and effective structure that connects to the riverbank and extends towards the center of the river [5]. Spur dikes are classified as submerged or non-submerged based on the changes in river flow [6] and are further categorized as permeable or impermeable depending on the water flow through them [7]. Moreover, the permeable spur dikes have been utilized for river ecological restoration and aquatic biodiversity engineering [8,9,10]. Due to their impacts on altering the natural flow patterns, spur dikes may induce a downstream recirculation zone. This recirculation zone results from the modifications in the flow field environment caused by these obstacles and is commonly observed in both river engineering and aviation engine fields [11,12]. Investigating the probability density distribution of the flow velocity, turbulent kinetic energy, and turbulent kinetic energy dissipation rate within the downstream recirculation zone of the permeable spur dikes holds significance. Previous studies have examined the water flow structures and recirculation zones in bends using physical experiments and numerical simulation methods.
Teraguchi et al. [4] studied the flow patterns near the impermeable and permeable spur dike structures, discovering a low-velocity zone downstream of the permeable spur dike without observable backflow. Rajaratnam and Nwachukwu [13] conducted experiments to establish a positive correlation between the scour depth and scour duration. Ikeda and Sugimoto et al. [14] experimentally determined that a high mass exchange rate between the mainstream and obstruction corresponded to the spur dike spacing-to-length ratio from 2 to 3. Fazli [15] and Haghnazar et al. [16] examined the relationship between the flow characteristics and spur dike geometry and demonstrated that the permeable openings effectively reduced the sediment accumulation in backflow areas. Fukuoka [17] and Li et al. [18] suggested a significant reduction in the bed shear stress within the permeable spur dike structures in the backflow areas. Through experiments and numerical simulations, Han et al. [19] analyzed the length of the backflow areas resulting from sudden clear water channel expansions and suggested that this length was affected by both the bed friction coefficient and the upstream-to-downstream width ratio. Specifically, lower bed friction coefficients and larger water depths can result in dominant vortex-driven energy exchange in these regions.
CFD is extensively adopted to investigate the flow fields in recirculation zones, facilitating the assessment of fluid erosion effects on obstacles and pollutant dispersion [20,21,22]. Direct numerical simulation (DNS) [23] computationally solves the N-S equation at a turbulent scale without implementing turbulence models. However, due to its large turbulent scale, this method is suitable only for relatively simple numerical simulation problems [24]. The Reynolds-averaged Navier–Stokes (RANS) model [25,26] was developed to simulate large-scale turbulent fields. Subsequently, several turbulence models have been derived, including the Standard k–ε Turbulence Model [27], RNG k–ε Turbulence Model [28], Realizable k–ε Turbulence Model [29], and Reynolds stress model (RSM) [30,31,32]. These models have been widely utilized to study water flow structures and turbulent mechanisms in recirculation zones. Previous studies have focused on vortex structure and size within recirculation zones, with numerical simulations indicating that the size of the recirculation zone is related to the sink length [33,34,35,36]. Giglou et al. [37] applied the RNG k–ε Turbulence Model to investigate spur dikes with different skew angles, revealing that the recirculation zone length is approximately four times longer than the spur dike length, with gradual sediment accumulated. Zhang et al. [38] studied the erosion pits near impermeable spur dikes using the Standard k–ε Turbulence Model, discovering that these pits compromised the stability of the spur dikes. Iqbal et al. [5] employed the Reynolds stress turbulent flow model to examine spur dikes with varying permeability levels and observed a decrease in downstream recirculation zones as permeability increased. Shin et al. [39] conducted numerical simulations to explore the dispersion of the pollutants in a bifurcated river backwater area, revealing that the pollutants accumulated within the backwater region, exacerbated by the presence of secondary flows in the open channel. Large eddy simulation (LES) [40,41] combined direct numerical simulation with Reynolds-averaged methods, using a filtering technique on the Navier–Stokes equations to explicitly compute the turbulent flows’ large-scale eddies while numerically simulating small-scale eddies using the RANS method. McCoy et al. [42] employed the LES method to investigate the scour pits, observing their occurrence near the spur dike head and their tendency for continuous expansion.
The probability density distribution can be used to further analyze the distribution characteristics of flow velocity; the previous studies carried out probability density statistics on fluctuating flow velocity at some spatial points in the flow field, and Zhu et al. [43] analyzed the fluctuating flow velocity at some points in the trash rack section and found that the fluctuating flow velocity was basically normally distributed. Fu et al. [44] studied the flow of open channel water with obstacles and measured the flow velocity with PIV, and their study showed that the probability density of the fluctuating flow velocity of the open channel flow was basically normally distributed. Yang [45] studied the probability density distribution of the fluctuating pressure of water flow, and the study showed that the fluctuating pressure distribution was basically normal. Cheng et al. [46] obtained the probability density distribution formula of the step size between sediment particles by measuring the step size data between sediment particles and utilizing wave theory. In summary, they did not perform mathematical statistics on the hydraulic elements on a critical plane within the flow field. This paper focuses on the distribution of hydraulic elements on the horizontal plane of the reflux area and conducts probability density statistics on the hydraulic elements at different water depth planes in the reflux area, which is the biggest difference between this paper and previous studies.
Previous research on the return flow area has focused on pollutant diffusion in channels, building ventilation evaluation, and optimizing resistance parameters. However, studies on permeable spur dikes have concentrated on water flow structure, sediment transport, and vortex structures and sizes around them, overlooking the probability density distribution of the flow velocity, turbulent kinetic energy, and turbulent kinetic energy dissipation rate in the return flow area behind the permeable spur dikes. This can be critical for optimizing the spur dike resistance parameters and understanding the pollutant diffusion mechanisms and sediment settling processes in return flow areas. In this study, we reconstructed the reflux zone at different bends of a naturally curved river channel densely packed with sandbars, staggered shallows, and various hydraulic structures similar to those of spur dikes. This was achieved by using a combination of sink experiments and numerical simulations. We analyzed the flow velocity, turbulent kinetic energy, and turbulent energy dissipation rate of the reflux zone by adopting the Gaussian kernel density. This could provide a foundational reference for exploring pollutant diffusion mechanisms and sediment-carrying nutrients, as well as optimizing the body shape parameters of spur dikes in the reflux zone.

2. Methods

2.1. Physical Model

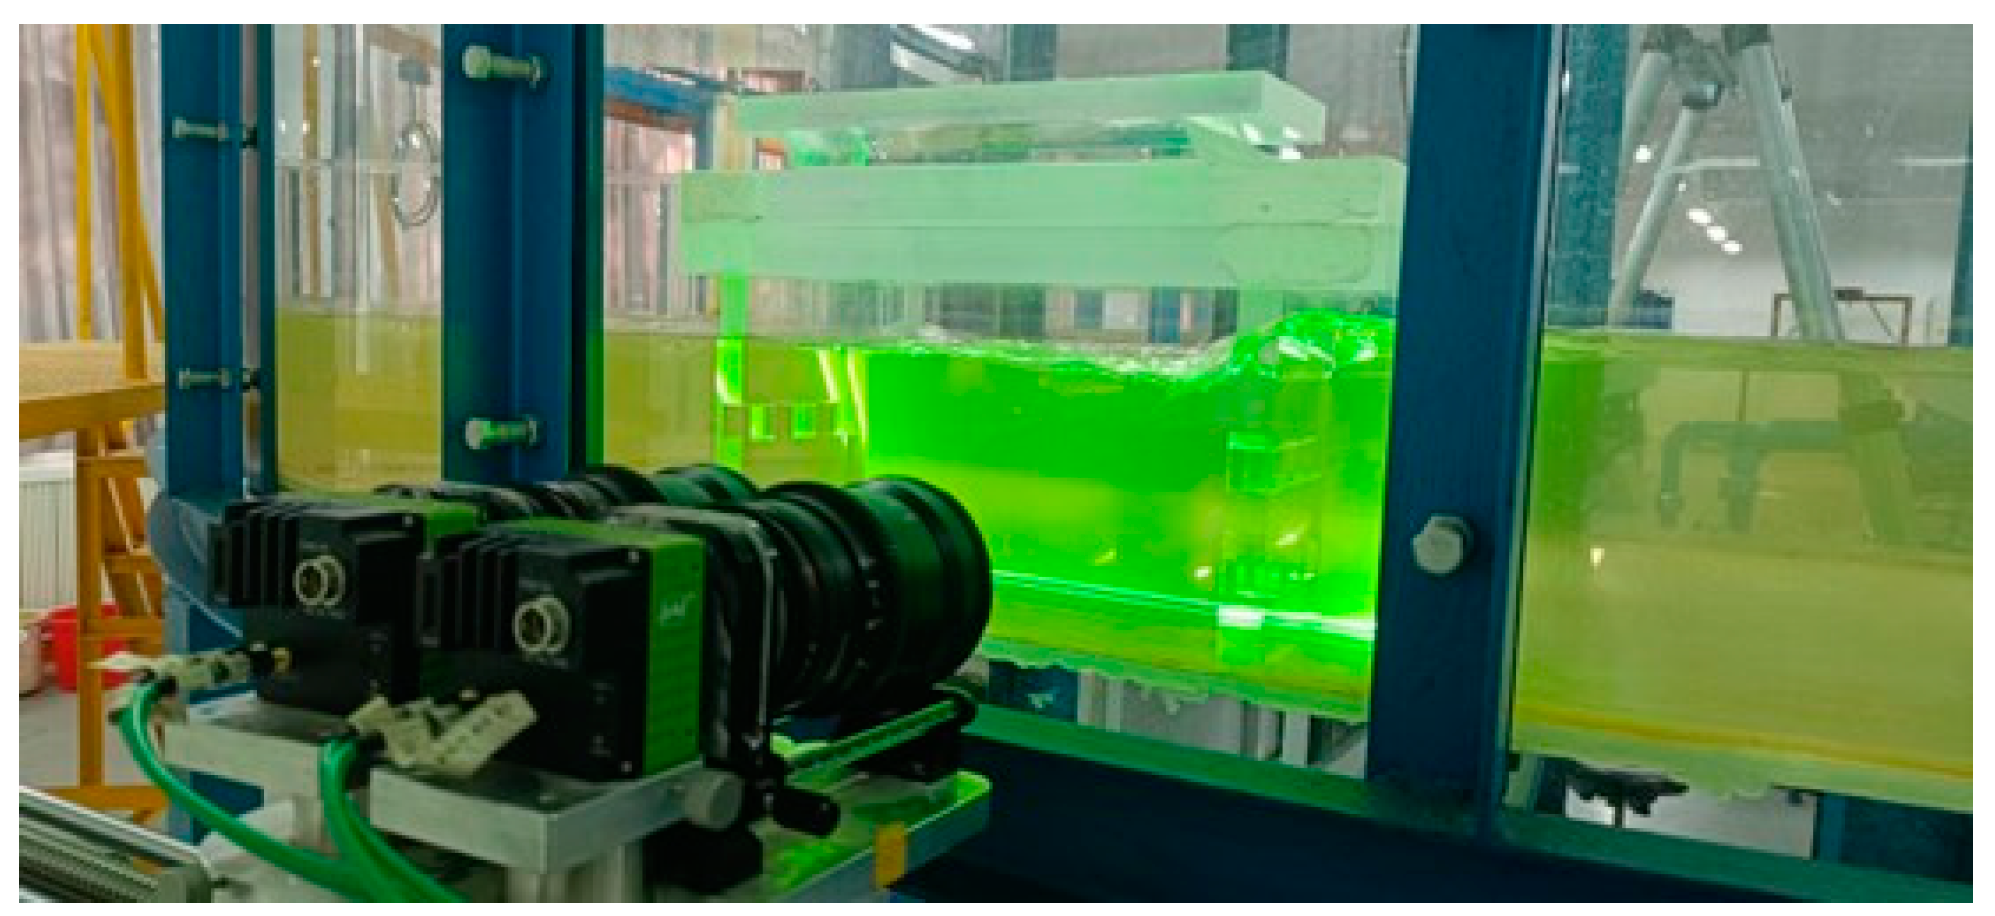
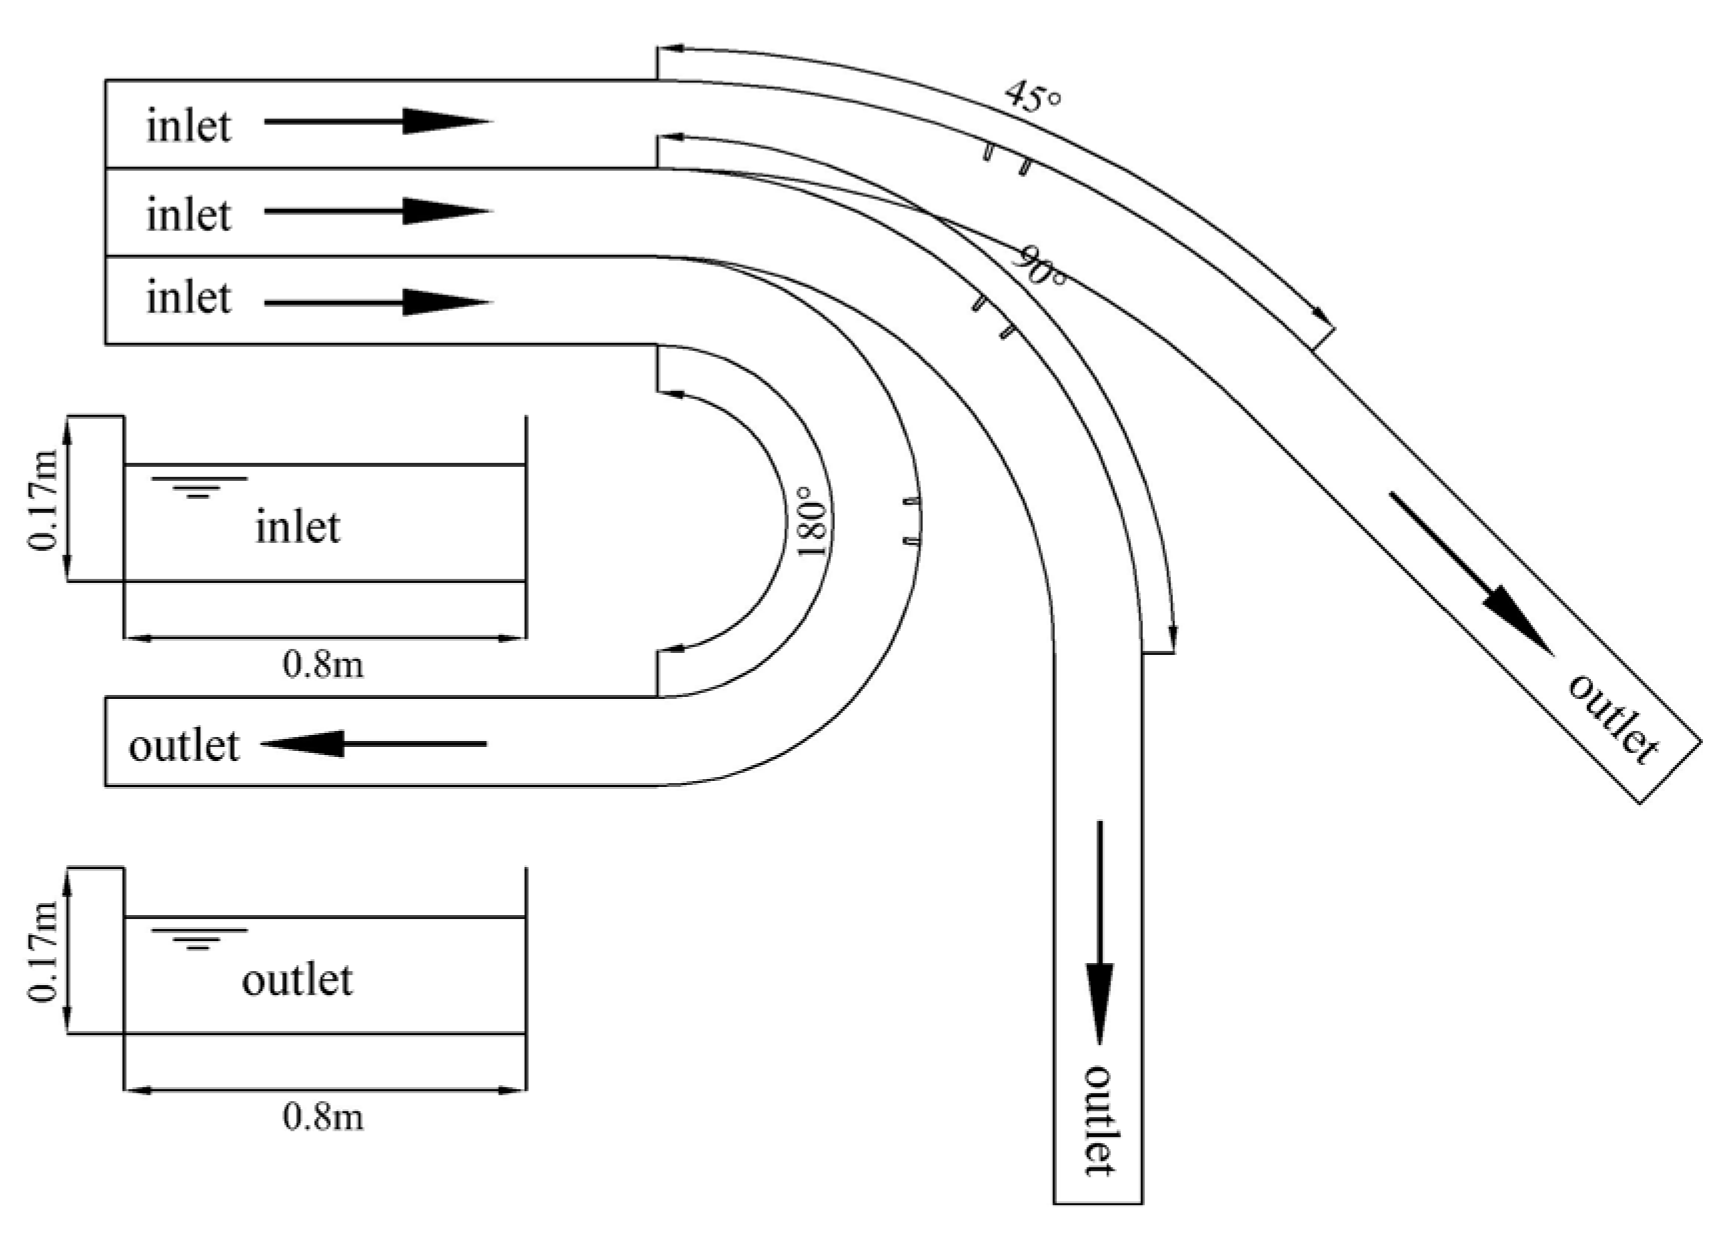
The physical experiment was conducted in a U-shaped curved slope flume at Northern Minzu University, as shown in Figure 1. This flume, developed by Tsinghua University, was constructed with tempered glass and featured a 180° bend in the middle, with straight river channels at both ends. The sediment filtration nets, honeycomb-type rectifiers, and water surface rectifiers were installed in the upstream section to reduce the upstream water surface fluctuations. The flume exhibited cross-sectional dimensions of 0.8 m × 0.8 m and consisted of a 16 m long upstream section followed by an equal-length downstream section. The radius of the 180° bend was 2.0 m, maintaining a slope of 0.001. To accurately collect the water level data within the bend, eight high-precision ultrasonic sensors were strategically placed. The flow velocity was recorded using Tsinghua University’s advanced high-speed particle image velocimetry (TR-PIV) technology, as shown in Figure 2. The flow rate, set at a constant value of 50 L/s for this experiment, can be adjusted by manipulating the operating frequency of the water pump, while the global water depth control was achieved by adjusting the tailgate size, maintained at a depth of 0.12 m during this experiment.
In this experiment, a rectangular spur dike was positioned centrally on a concave bank. It measured 0.15 m horizontally, 0.02 m longitudinally in the flow direction, and 0.17 m vertically, exceeding the water depth to ensure the non-submerged conditions. Figure 3 illustrates the permeable spur dike model, and Table 1 summarizes the physical experimental parameters. The stress concentration effect on the spur dike body was directly affected by the presence of permeable or percolation holes, which also created a suitable habitat for fish and other benthic organisms. El-Raheem et al. [47] conducted the flume tests comparing the impact of the permeable and solid spur dikes on the water depth variations in the main channel. They suggested that the range of water depth fluctuations along the centerline of the main channel is smaller with a permeable spur dike than with a solid spur dike. Yun et al. [48] investigated permeable butt joints with varying permeability rates of 6.8%, 10.4%, 14.1%, 17.5%, and 22.5%. They revealed a negative correlation between the upstream potential energy of the butt joints and void ratio under identical conditions of permeability hole size. Similarly, they observed a negative correlation between the downstream potential energy of the butt joints and void size at a greater distance from the butt joints under equivalent permeability conditions. Fan et al. [49] observed a gradual decrease in the intensity of backflow behind the weir as permeability increased. At a permeability of 20%, the backflow intensity was weak, and increasing the permeability to 30% resulted in no significant change in the length of the backflow area but a gradual decrease in width. At 40% permeability, the backflow disappeared. Our study employed permeable openings similar to those investigated by Iqbal et al. [5] who discovered the turbulent effects and backflow zones near the weir with permeabilities of 0%, 25%, and 37%. To clearly observe the backflow zone, we selected a moderate permeability of 20% based on previous research. The permeable holes in this study were represented by the rectangular apertures measuring 0.03 m × 0.02 m, with horizontal and vertical spacings of 0.02 m. Fukuoka et al. [50] applied the breakwater length to describe the spacing between breakwaters, while Futian et al. [51] suggested that the spacing should be approximately twice the length of each breakwater unit. In a flume experiment, Karami et al. [52] observed erosion pits near breakwaters and suggested that minimizing the pit size required the spacing between breakwaters ranging from 1.5–2 times their lengths as a crucial factor for stability. Jian et al. [53], in another flume experiment, proposed a spacing of 2–3 times the length of each breakwater unit. However, common practice dictates a range from 1.5 to 3 times the length of each unit, with the optimal spacing set at twice their lengths.

2.2. Mathematical Model

This study applied the FLUENT 2019R3 software, based on the finite volume method, to simulate the curved water flow. FLUENT, the widely used computational fluid dynamics tool, provided various turbulence models and numerical solution schemes.

2.2.1. Continuity Equation and Momentum Equation

The fluid flow in the x, y, and z directions can be described by the continuity and the Navier–Stokes equations.
The continuity equation is as follows:
x ρ u + y ρ v + z ρ w = 0 .
The equation of momentum in the x-direction is
t ρ u + x ρ u u + y ρ v u + z ρ w u = P x + μ 2 u x 2 + 2 u y 2 + 2 u z 2 + ρ g x .
The equation of momentum in the y-direction is
t ρ v + x ρ u v + y ρ v v + z ρ w v = P y + μ 2 v x 2 + 2 v y 2 + 2 v z 2 + ρ g y .
The equation of momentum in the z-direction is
t ρ w + x ρ u w + y ρ v w + z ρ w w = P z + μ 2 w x 2 + 2 w y 2 + 2 w z 2 + ρ g z .
where the positive direction of the y-axis in the Cartesian coordinate system is opposite to that of gravity; u, v, and w represent the velocity components along the x-, y-, and z-axes, respectively; ρ denotes the mass density; μ represents the viscosity; t represents the time; and P denotes the pressure.

2.2.2. Turbulence Model

Turbulence exhibits high nonlinearity with many degrees of freedom, rendering analytical solutions to flow field equations impractical. Consequently, addressing the turbulence has always been a significant challenge [54]. Therefore, it is crucial to select the optimal turbulence model based on the actual physical characteristics of the flow field, numerical simulation accuracy, and available computational resources [55].
Compared with DNS [23] and LES [40,41] methods for solving turbulence, RANS methods can be more efficient and have a broader range of applications. This study adopted the standard k–ε Turbulence Model, RNG k–ε Turbulence Model, and Realizable k–ε Turbulence Model to numerically simulate water flow in 180° bends. The three turbulence models were compared and validated before selecting the optimal model for simulating the water flow at 45°, 90°, and 180° bends.
The mathematical formulations of the three turbulence models are as follows:
(1) Standard k–ε Turbulence Model
Based on eddy viscosity, the Standard k–ε Turbulence Model can solve the independent transport equations for turbulent kinetic energy (k) and turbulent dissipation rate (ε) to provide turbulence information [27]. This model is commonly used for high-Reynolds-number flows, assuming fully developed turbulence and neglecting molecular viscosity. However, it may not be suitable for scenarios such as (1) unconfined flow, (2) flow with large extra strains, (3) rotating flows, or (4) flow driven by the anisotropy of normal Reynolds stresses [56]. The turbulent kinetic energy and dissipation rate in this model were computed using a formula [55].
k t + k u i x i = x i D k e f f k x i + G k ε .
ε t + ε u i x i = x i D ε e f f ε x i + C 1 ε ε k G K C 2 ε ε 2 k .
The formula includes G k as the turbulent kinetic energy generated by the average velocity gradient, while D k e f f and D ε e f f represent the effective diffusion coefficients of k and ε, respectively. These coefficients were determined using the following equation:
D k e f f = v + v t .
D ε e f f = v + v t σ ε .
The equation for determining the turbulent kinetic viscosity is as follows:
v t = C μ k 2 ε .
The turbulent Prandtl number of ε , denoted as σ ε in the formula, was assumed to be 1.3. Constants C, C2ε, and Cμ are defined as follows:
C 1 ε = 1.44 .   C 2 ε = 1.92 .   C μ = 0.09 .
The turbulent kinetic energy G k , generated by the average flow velocity gradient, can be computed using the following formula:
G k = 2 v t S i j 2 .
S i j = 0.5 u j x i + u i x j .
The components of velocity in different directions are denoted by u i and u j , while the strain rate tensor is represented by S i j in the formula.
(2) RNG k–ε Turbulence Model
The RNG k–ε Turbulence Model, compared to the standard k–ε Turbulence Model, is based on the renormalization group theory in statistical physics [28]. It incorporates additional terms into the transport equation to account for rotational flow, aiming to improve the applicability and accuracy of the model across various flow conditions. The RNG model can provide an analytical formulation for the turbulent Prandtl number, eliminating the need for user-defined constants. Moreover, it is more effective for calculating the turbulent viscosity at low Reynolds numbers. In this model, the turbulent kinetic energy and dissipation rate were computed using the following formula:
k t + k u i x i = x i D k e f f k x i + G k ε .
ε t + ε u i x i = x i D ε e f f ε x i + C 1 ε R ε k G K C 2 ε ε 2 k .
The calculation method of the effective diffusion coefficient D k e f f deviates from the standard model. The methodology is outlined as follows:
D k e f f = υ + υ t σ k .
The renormalization factor R was calculated using the following equation:
R = η 1 η η 0 1 + β η 3 .
η = S i j k ε .
The constant terms in the turbulence model were assigned the following values:
C μ = 0.0845 .   C 1 ε = 1.42 .   C 2 ε = 1.68 .   σ k = 0.719 .   σ ε = 0.719 .   η 0 = 4.38 .   β = 0.012 .
(3) Realizable k–ε Turbulence Model
The realizable k–ε turbulence model improves upon the standard k–ε model by employing an enhanced approach for calculating the turbulent viscosity and formulating the dissipation rate equation through precise transport equations to generate the component vorticity. This refinement aims to address the limitations of the standard k–ε model in scenarios, such as wall boundary layers and rotating flows [29].
In this model, the turbulent kinetic energy and dissipation rate were computed using the following equations:
k t + k u i x i = x i D k e f f k x i + G k ε .
ε t + ε u i x i = x i D ε e f f ε x i + 2 C 1 ε S i j ε C 2 ε ε 2 k + υ ε .
The turbulent viscosity in the above equation can be calculated using the following formula:
υ t = C μ k 2 ε .
The value of C μ is determined by the following equation in the given formula:
C μ = 1 A 0 + A s k U ε .
U = S i j 2 + Ω ˜ i j 2 .
Ω ˜ i j = Ω ¯ i j ε i j k ω k 2 ε i j k ω k .
The formula incorporates Ω ¯ i j as a symbol denoting the mean flow velocity of the rotational tensor, while ω k represents the angular velocity.
The constants A 0 and A s are determined by the following formula:
A 0 = 4 .   A s = 6 cos φ .
φ = 1 3 arccos min max 6 W , 1 , 1 .
W = S i j S j k S k i S ˜ 2 .
The value of C 1 ε is determined by the following formula:
C 1 ε = max η 5 + η ,   0.43 .
The constants C 2 , σ k , and σ ε were determined by Shih [57] and are provided as follows in accordance with the findings of Shih’s research:
C 2 = 1.9 .   σ k = 1.0 .   σ ε = 1.2 .

2.3. Boundary Conditions and Solution Setup

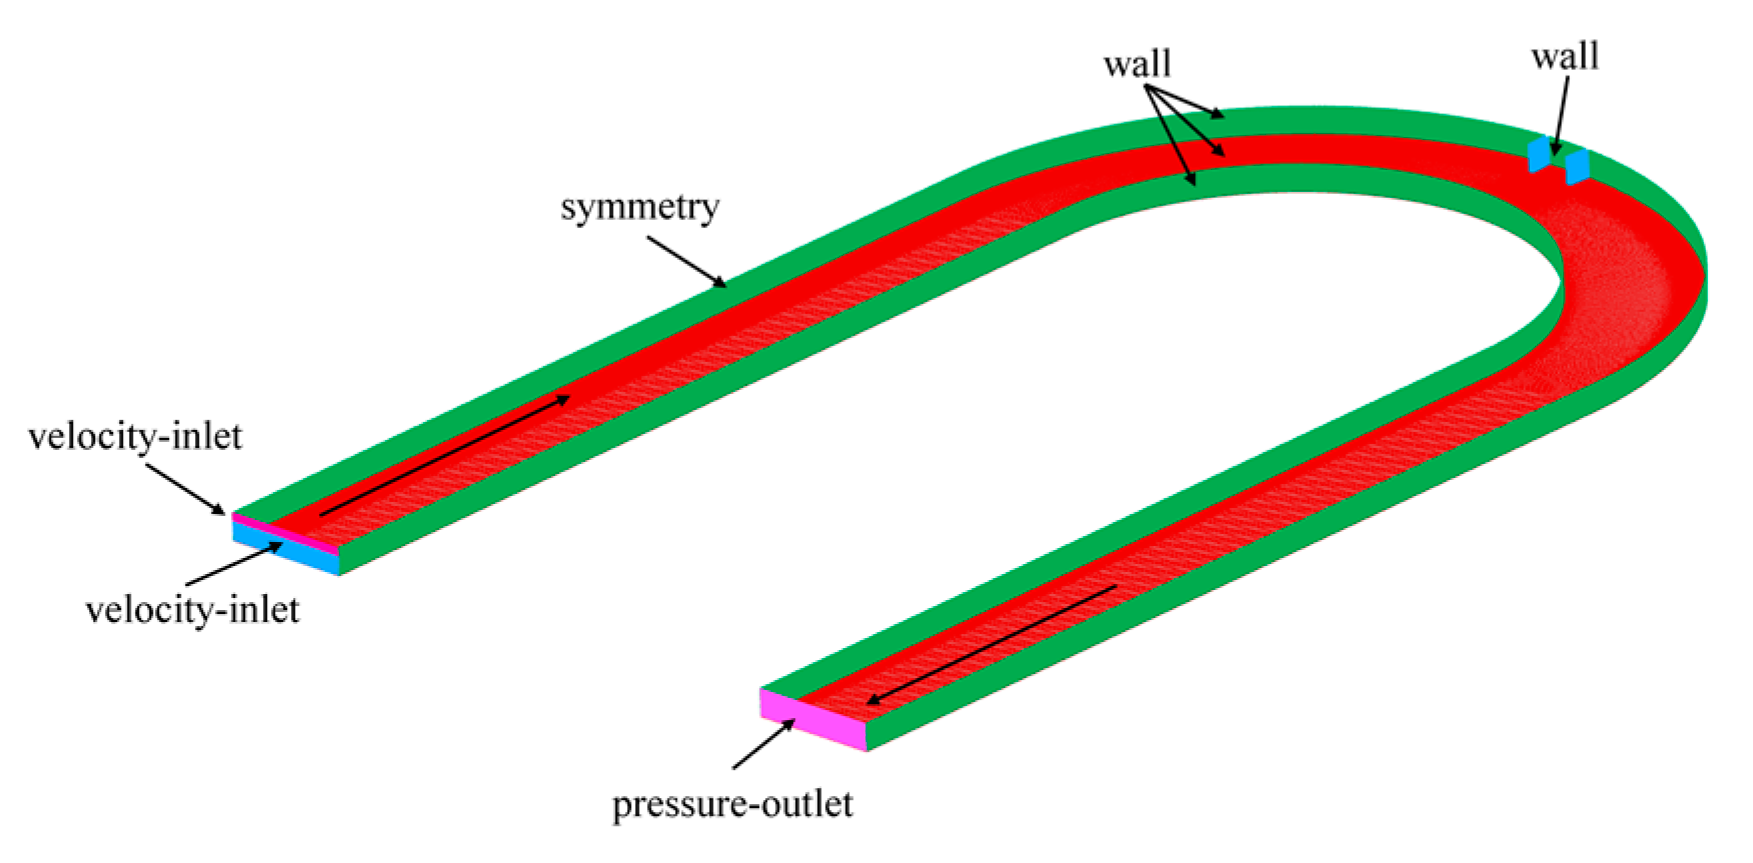
The water flow inlet in the ANSYS FLUENT 2019R3 software was defined as a velocity inlet with a flow velocity of 0.52 m/s. The turbulence intensity was set to 5%, the turbulence viscosity ratio was set to 10, and the top boundary of the numerical model was specified as a symmetric wall boundary. Solid wall surfaces, such as the riverbed and groin, were considered, with the enhanced wall treatment selected for the near-wall treatment. The outlet was configured as a pressure outlet using the open channel option while maintaining a free liquid surface height of 0.12 m at the outlet position. The boundary conditions for the model are shown in Figure 4. The software offered two pressure-based solver algorithms, including the Pressure-Based Segregated Algorithm and the Pressure-Based Coupled Algorithm. This study employed the SIMPLEC algorithm, which was a pressure-velocity coupling technique. The gradient formulation applied the cell-based least-squares method by selecting the cells as the basis. The pressure term was discretized using the PRESTO implicit upwind scheme, whereas the momentum equation, turbulent kinetic energy, and turbulent dissipation rate were discretized using the QUICK scheme. The Transient Formulation was selected with second-order implicit discretization. The residual converged to 0.0001. There were 48,000 time steps with a step size of 0.005 s, simulating 180 s until the inlet and outlet flow were balanced. The data sampling was performed at this point, with a sample interval of 120 s. To ensure accurate computational results and a stable solution process, the global maximum mesh size was set as 0.03 m. The boundary layers were strategically placed near the curved wall surface and permeable spur dike, with local mesh refinement implemented. Fifteen boundary layers were established, starting with a height of 0.003 m and a growth rate of 1.1. The calculation domain employed a comprehensive mesh of approximately 2.05 million elements. The consistency in the mesh parameters was maintained across all three types of curved sections, as shown in Figure 5.

2.4. Model Validation

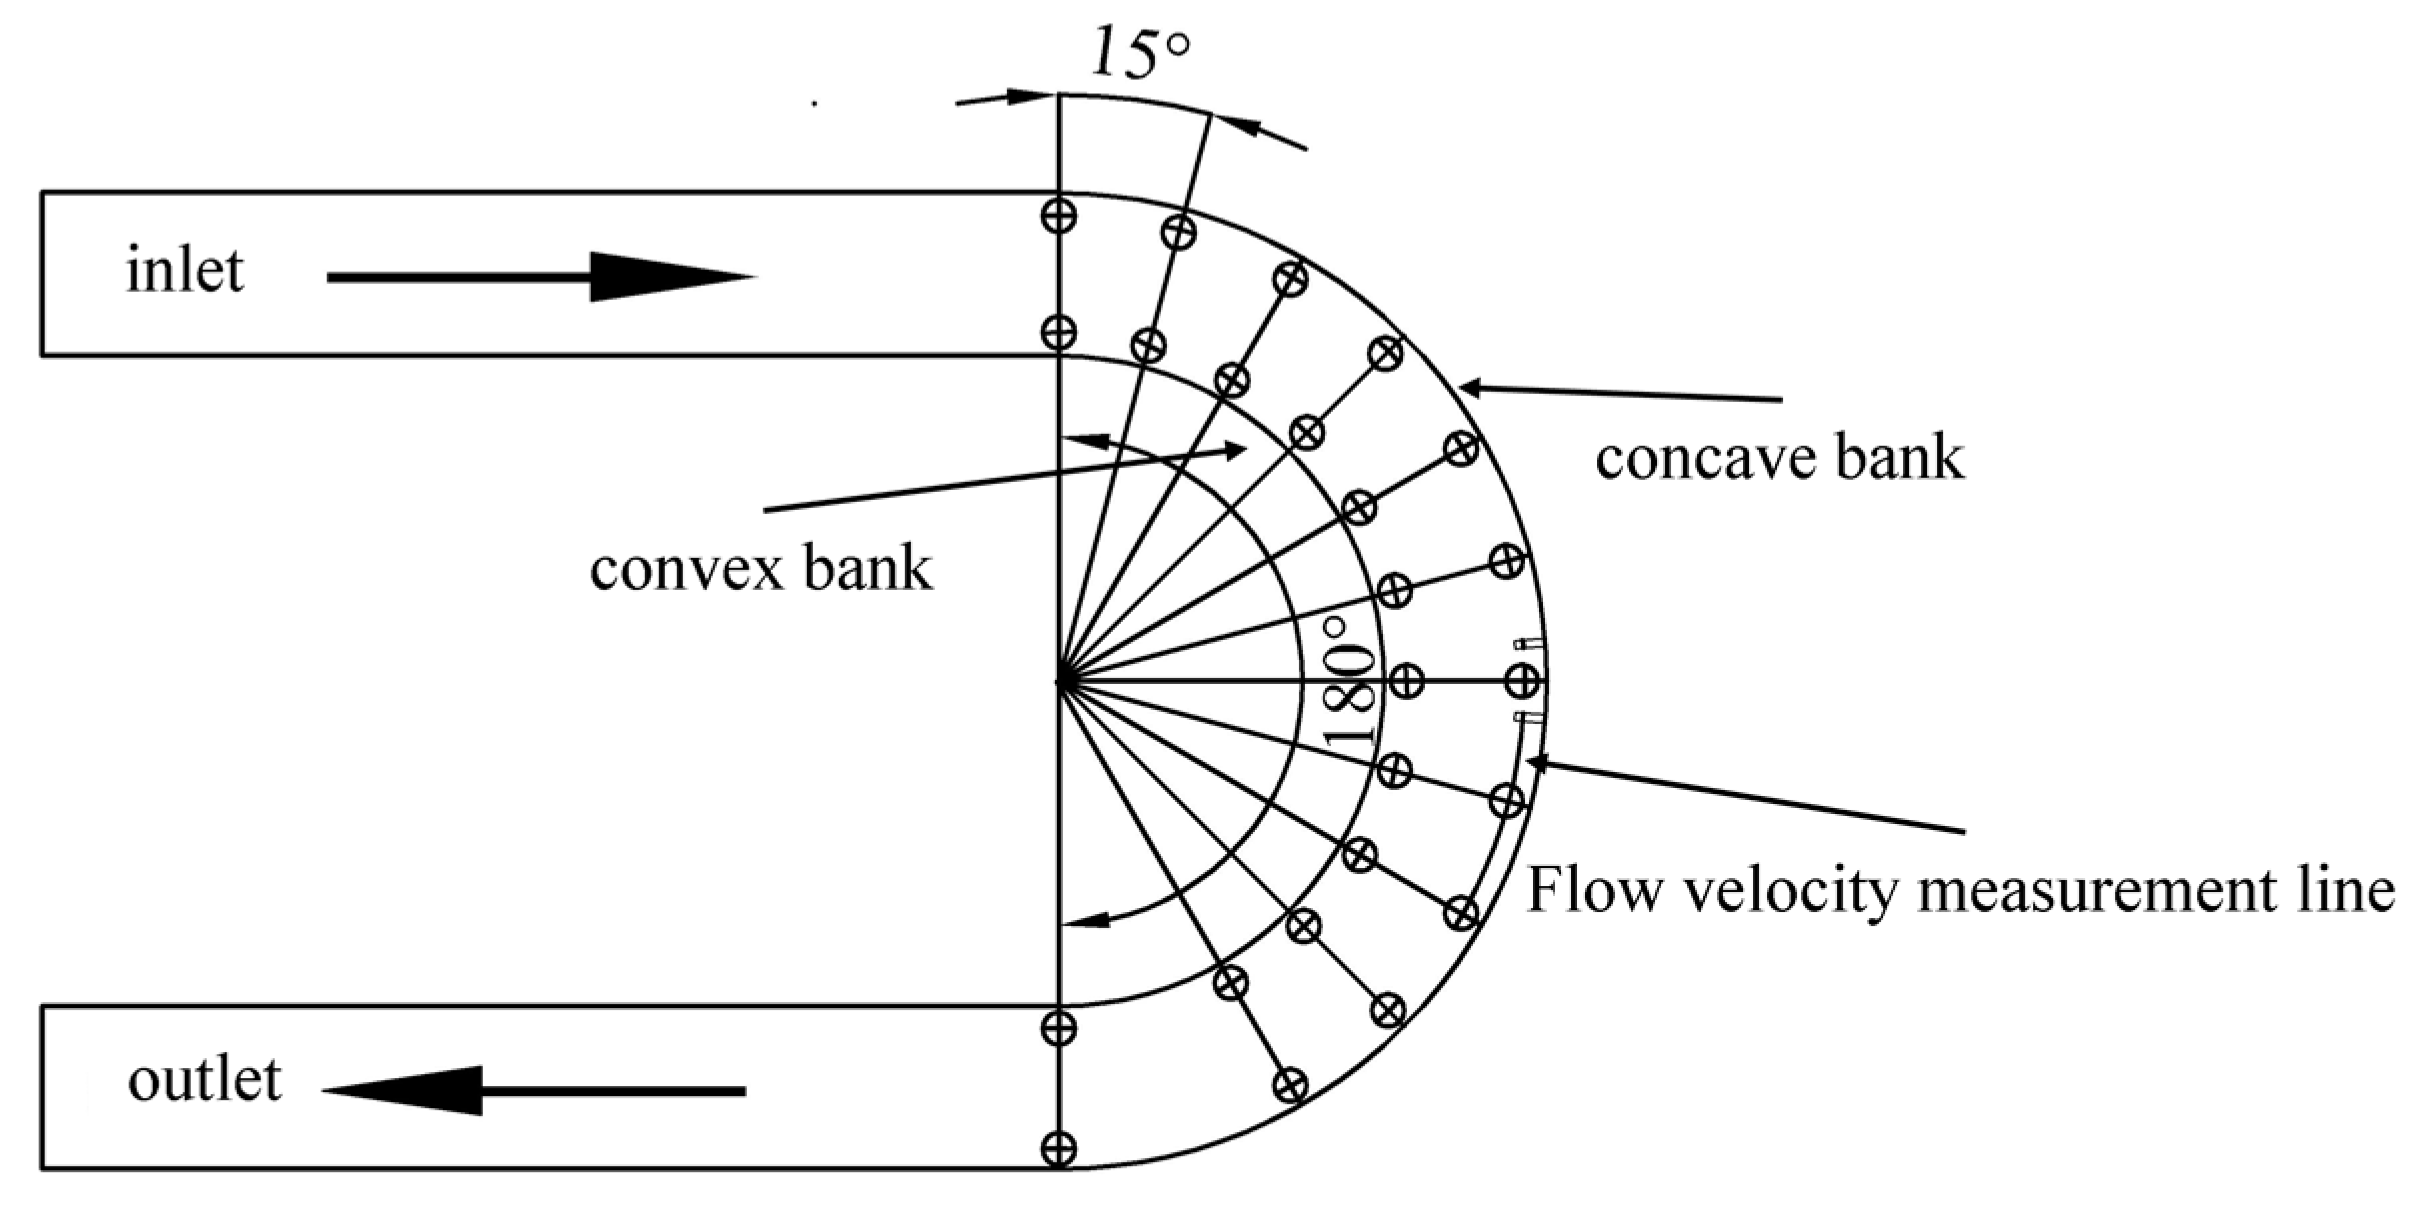
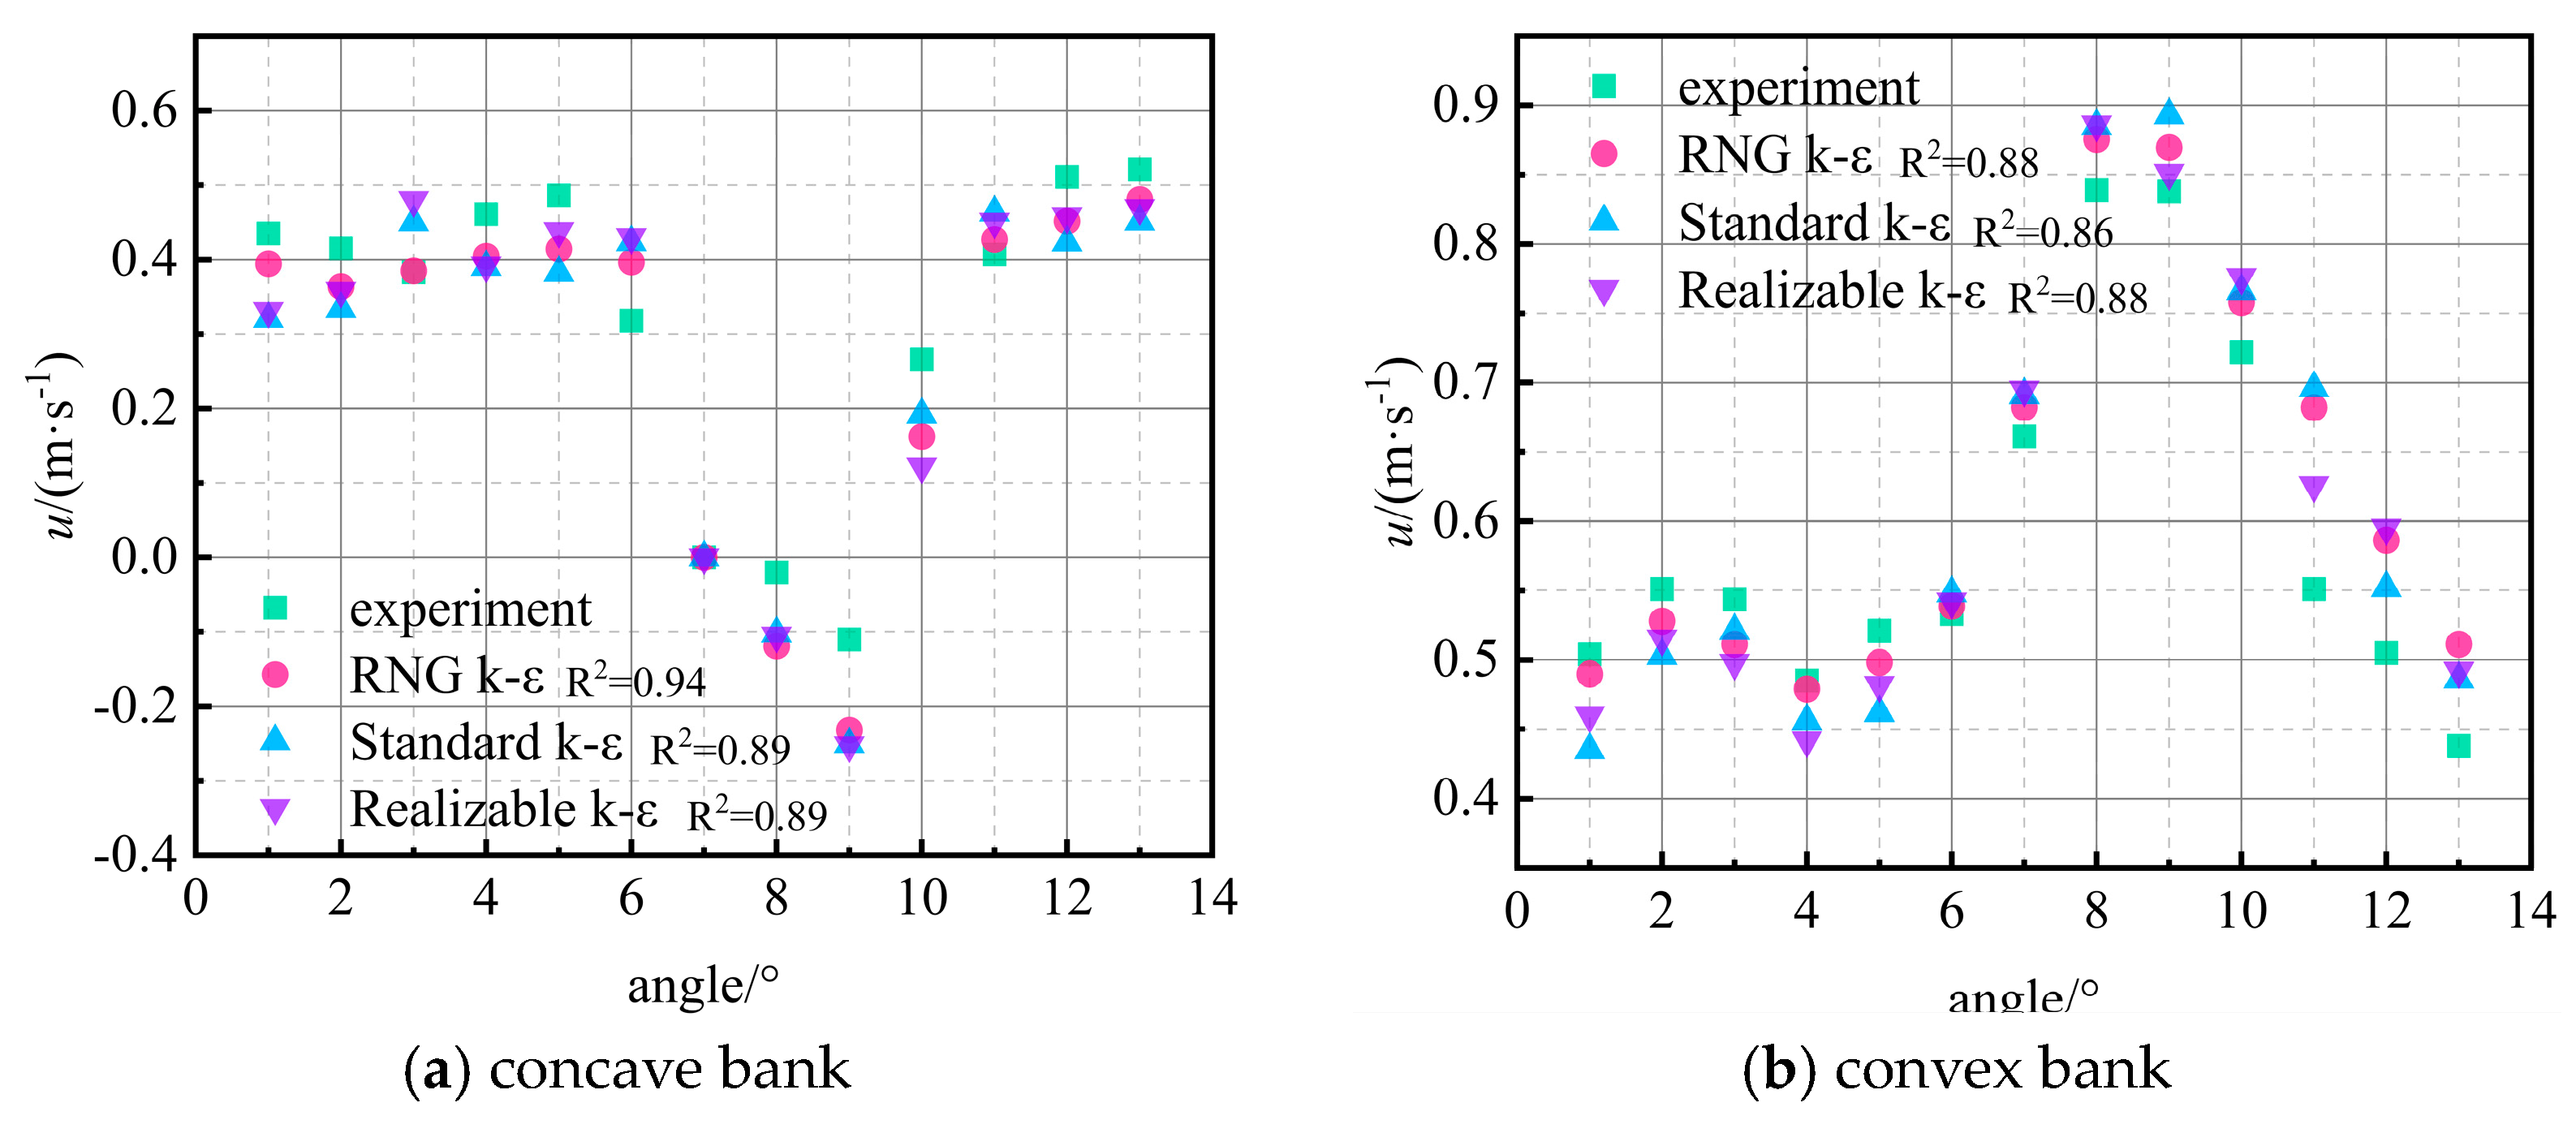
This experiment was designed using 12 observation sections positioned at intervals of 0°, 15°, 30°, 45°, 60°, 75°, 90°, 105°, 120°, 135°, 150°, and 180° along the bend. The depth of the observation sections was set at half the water depth. Two spatial points were selected at a distance of 0.05 m from both the inner and outer banks, as illustrated in Figure 6. The PIV equipment was employed to measure the flow velocity at these points, resulting in 24 velocity measurements. Subsequently, the experimental flow velocity data were correlated with the numerical simulation results obtained using the standard k–ε, RNG k–ε, and realizable k–ε turbulence models. The analysis results indicated that the average flow velocity was generally lower on a concave bank, whereas it could be higher on a convex bank. This disparity could be attributed to the presence of the permeable spur dikes obstructing water flow on the concave bank, reducing the longitudinal flow velocity as one approaches these spur dikes. Conversely, on the convex bank located away from this group of permeable spur dikes, there was a convergence of the mainstream area due to their constraining effect, leading to a reduction in the cross-sectional area near these structures. Consequently, the flow velocity on the convex bank typically exceeded that observed on the outer bank. Upon comparing the correlation coefficients between the measured and simulated flow velocities at various locations, it was evident that a lower correlation coefficient was observed at the convex bank. This could be attributed to the varying levels of turbulence exhibited by the outer and inner banks during the flow process, which introduced errors in the physical experiments. The correlation coefficients between the measured and simulated velocity values exceeded 0.85, as shown in Figure 7a,b. Overall, the physical test results exhibited excellent agreement with the numerical simulation results obtained from all three turbulence models, with particularly remarkable performance observed for the RNG k–ε turbulence model. Consequently, we adopted the RNG k–ε turbulence model for the subsequent numerical simulation studies conducted in this research.

3. Results Analysis

3.1. Velocity Distribution along the Axis of the Recirculation Zone

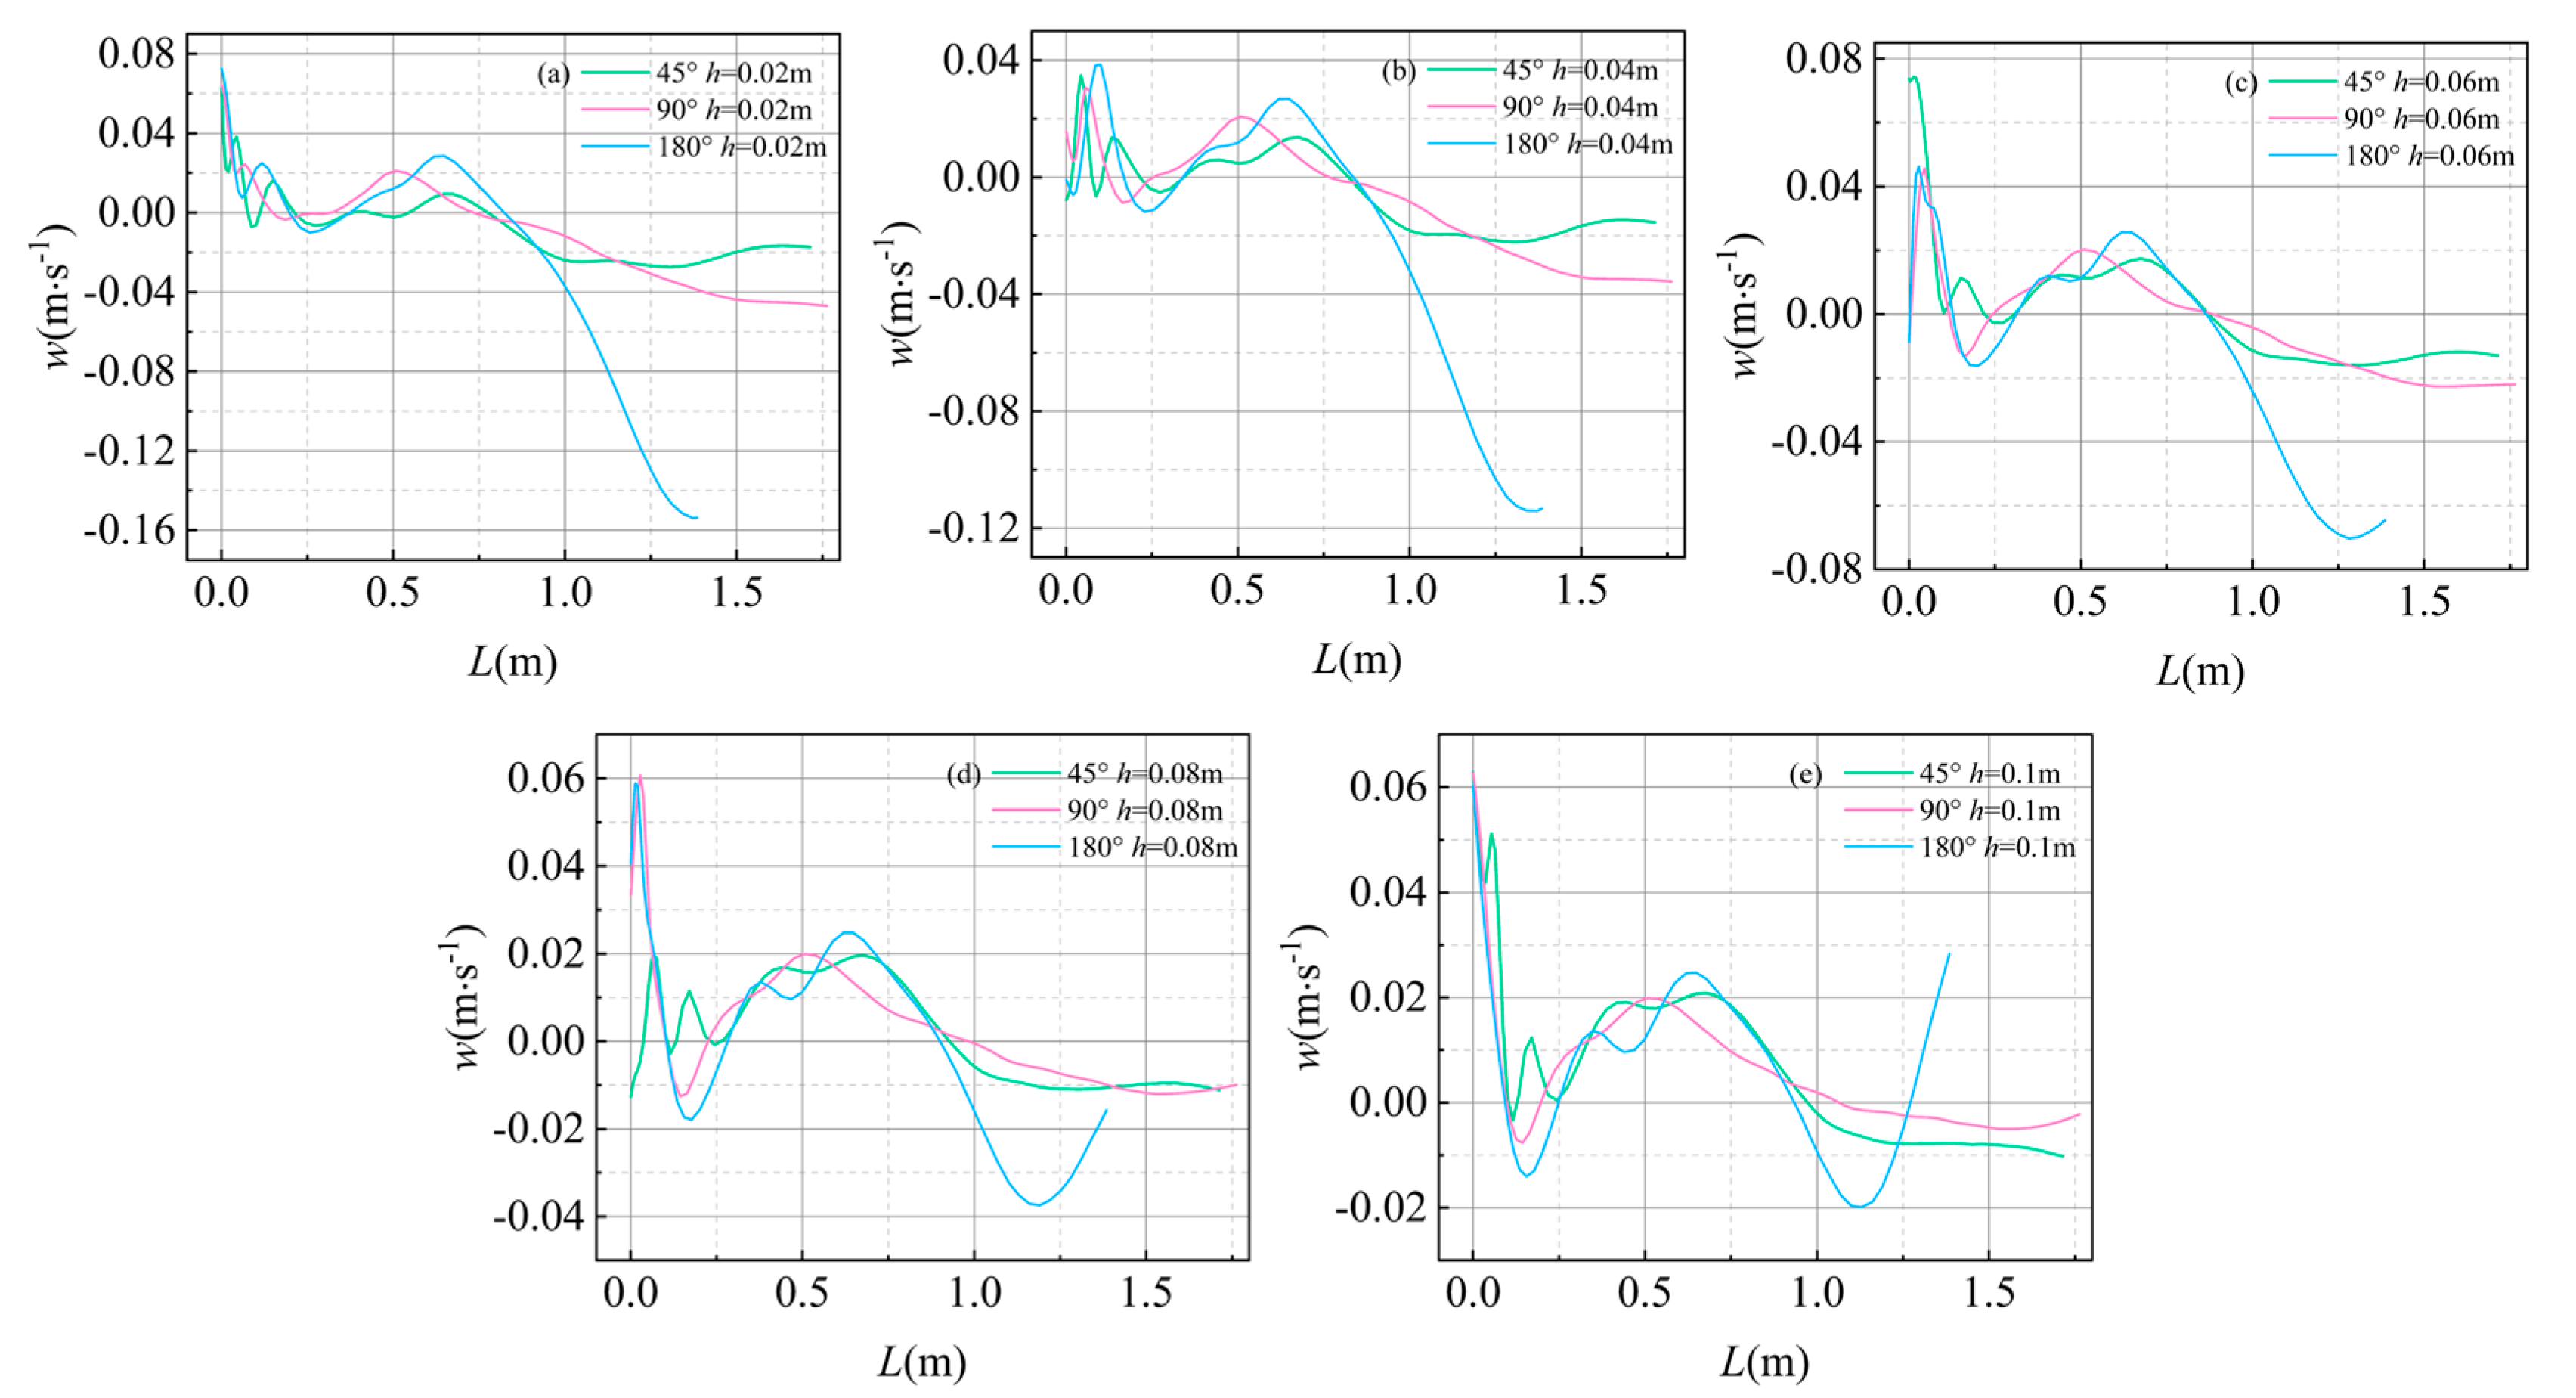
Figure 8 and Figure 9 illustrate the longitudinal and lateral time-averaged flow velocity profiles along the streamline at various water depths. The streamline elevation varied at depths of h = 0.02, 0.04, 0.06, 0.08, and 0.1 m, positioned at a relative distance of b/B = 0.09 from the lee shore. This streamline effectively traversed most of the recirculation zone, capturing the longitudinal distribution of the flow velocity within this area to a considerable extent. Figure 6 illustrates the streamlined layout.
The velocity profiles in Figure 8 exhibited the U-shape along the flow direction at different water depths with alternating positive and negative changes in longitudinal flow velocity. The lowest point of the U-shaped curve consistently corresponded to the negative velocity. Additionally, the figure illustrates that the longitudinal flow velocity transitioned from negative to positive at the end of the recirculation zone for various water depths, with the length of this zone where longitudinal flow velocity equaled zero ranging between 0.75 m and 1.25 m across all the measurement lines. Furthermore, within the measurement line, the recirculation zone was the shortest in length at a 180° bend, suggesting that increasing the bend curvature could effectively reduce its extent. As depicted in Figure 8c–e, the expansion of the negative flow velocity region and the increase in the flow velocity near the water surface indicated a relationship between the spatial length of the recirculation zone and water depth. The longitudinal flow velocity along the contour line within this zone did not exhibit a clear correlation with the bend curvature, whereas there was minimal variation in the flow velocity among the three bends. Notably, significant differences in the longitudinal flow velocity emerged beyond the recirculation zone, particularly for the bends with varying curvatures. The longitudinal flow velocity at the end of the recirculation zone exhibited a sharp increase. Moreover, within the 180° bend, the longitudinal flow velocity surpassed that observed in both the 45° and 90° bends, suggesting that increasing the bend curvature could enhance the downstream longitudinal flow velocities.
The lateral time-averaged flow velocity at various water depths in Figure 9 exhibited alternating positive and negative fluctuations, whereas the longitudinal flow velocity distribution along the water surface generated the W-shaped pattern. The lateral flow velocity was generally lower in the recirculation zone, with relatively small differences in the lateral flow velocity within the three bends. This suggested that the changes in the bend curvature did not significantly affect the lateral flow velocity in the recirculation zone. However, the curvature of the bend significantly affected the lateral flow velocity at the end of the recirculation zone. The high-curvature bends induced larger negative lateral flow velocities, indicating that the water within these bends moved towards the concave bank, potentially causing erosion.

3.2. Two-Dimensional Velocity Distribution in the Recirculation Zone

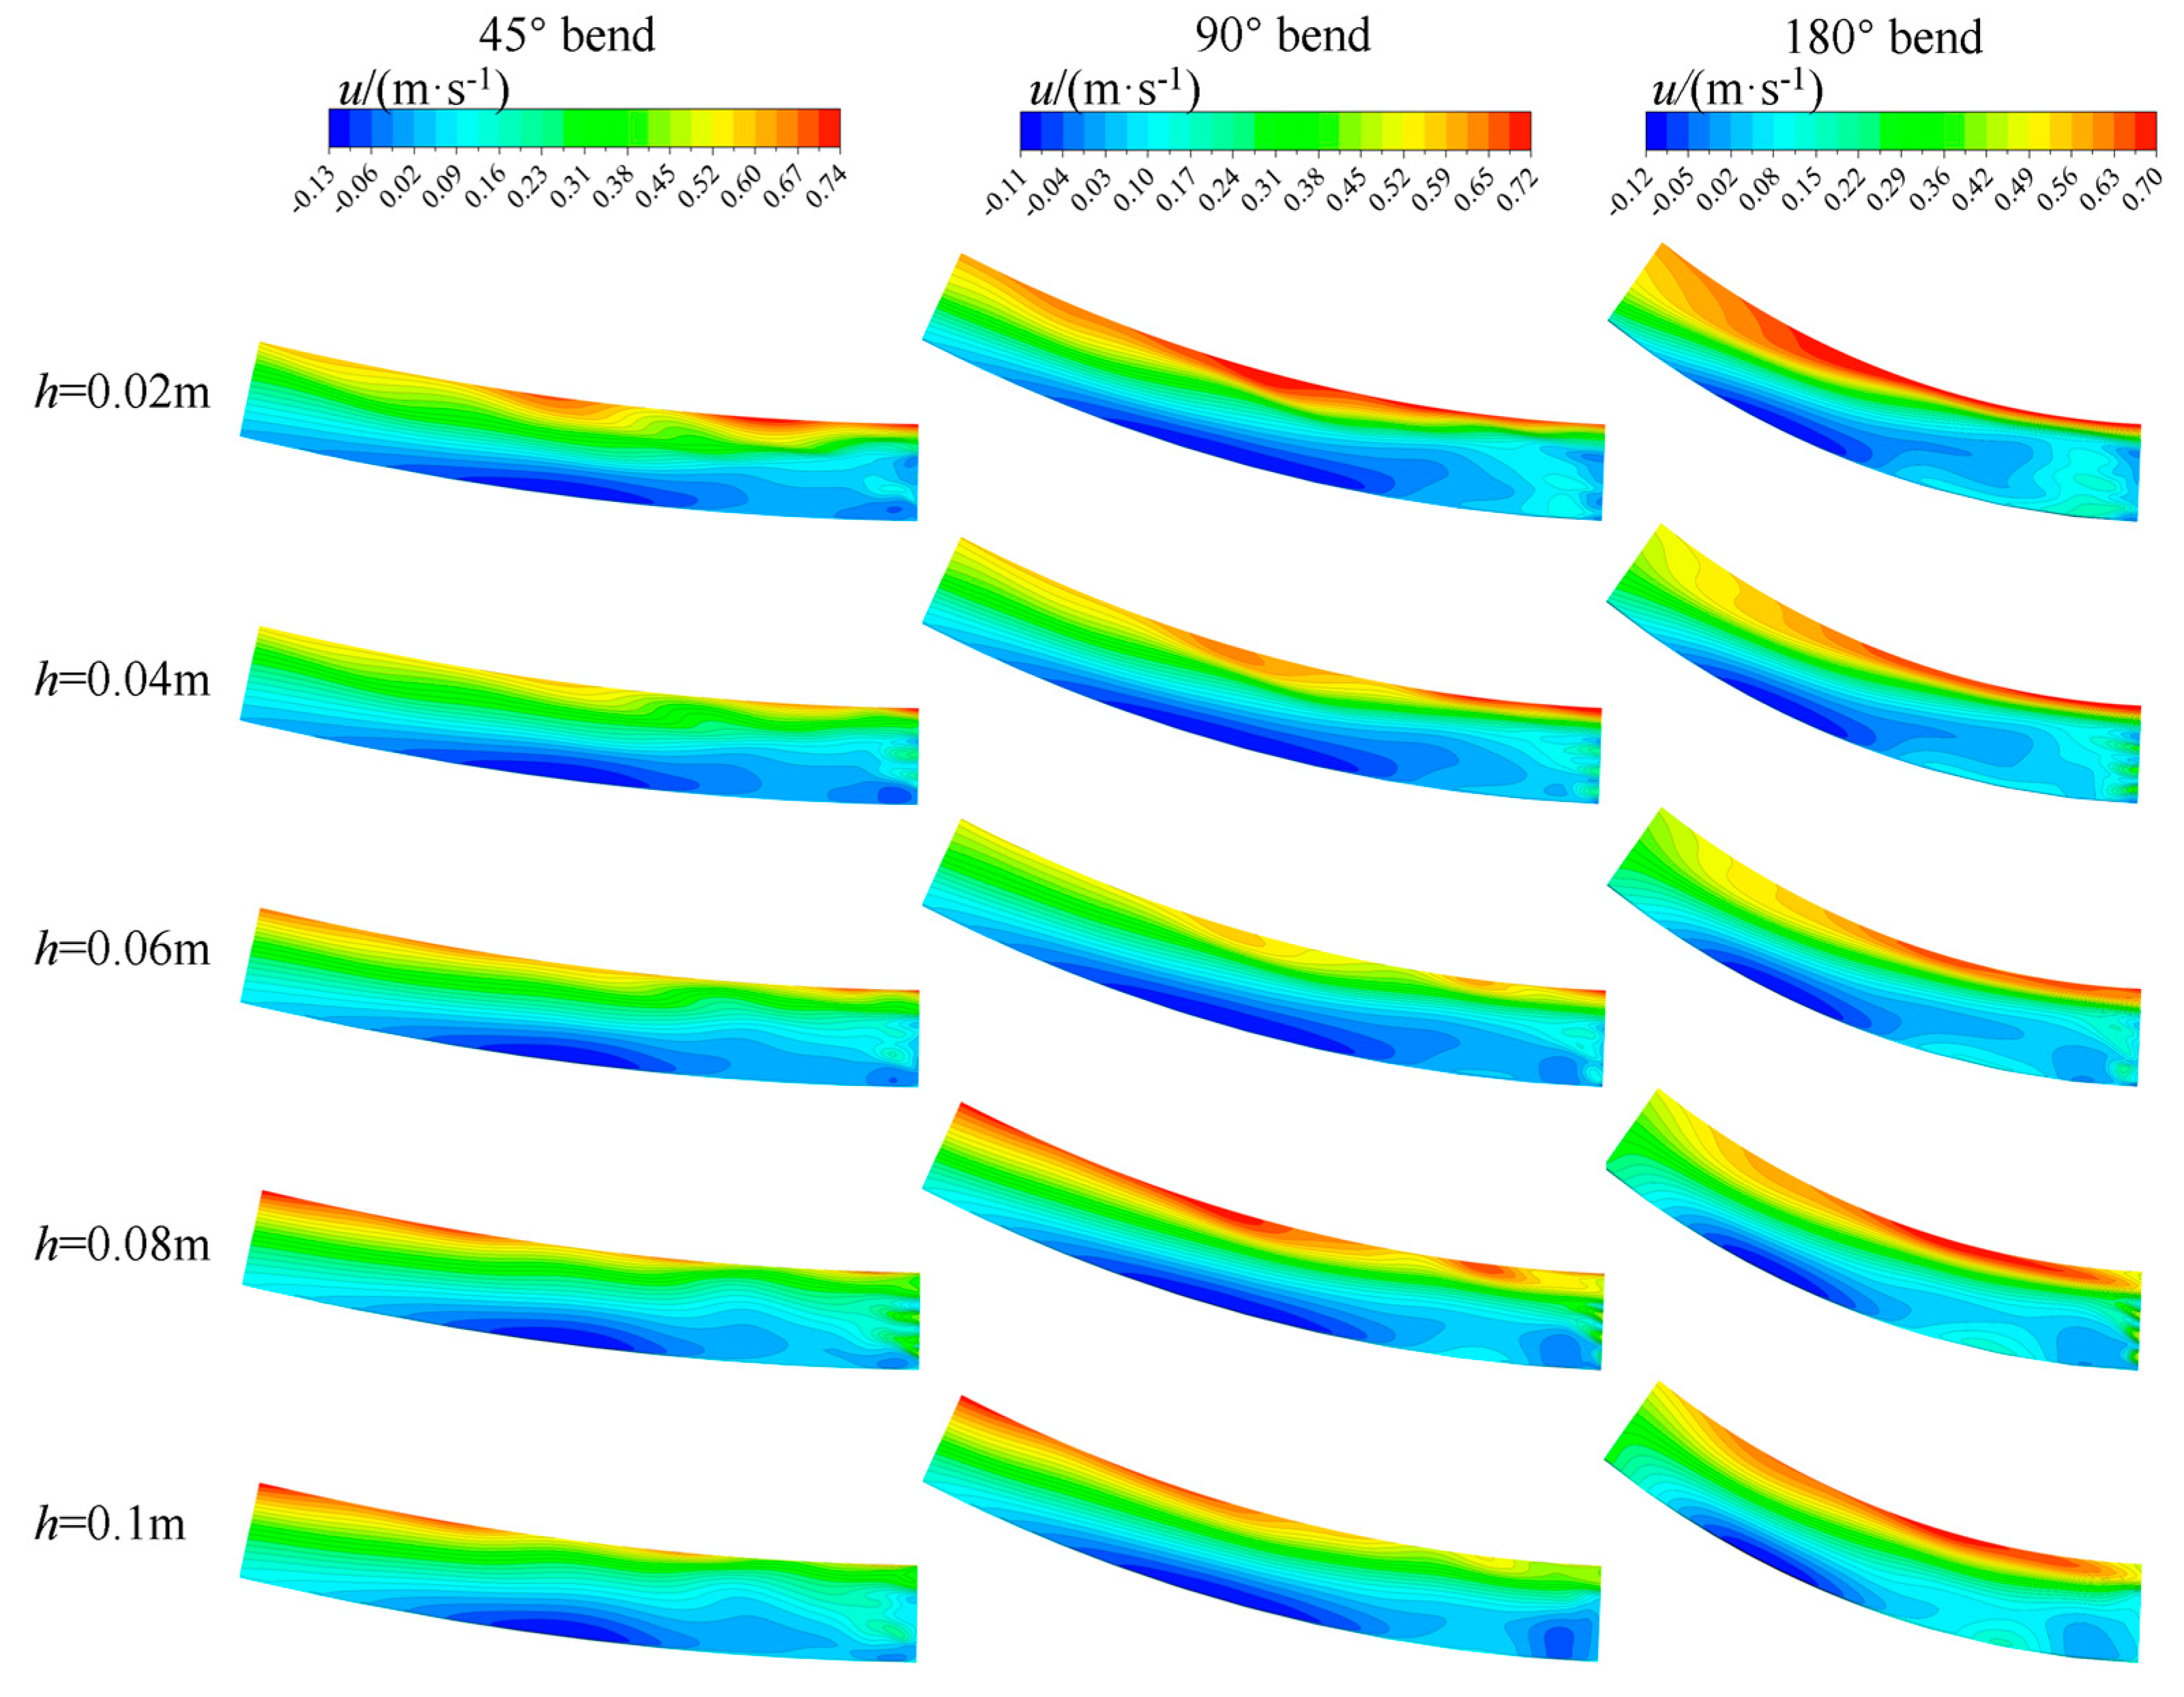
The contour lines of the longitudinal time-averaged velocity field and transverse time-averaged velocity field at various water depth planes are shown in Figure 10 and Figure 11, respectively. The velocity measurement plane elevation ranged from 0.02 to 0.1 m.
From Figure 10, the flow separation phenomenon in the recirculation zone caused a distinct variation in the longitudinal flow velocity direction compared with that in the mainstream zone. The disappearance of flow separation was initially observed at approximately eight times the length of the spur dike, indicating the end of the recirculation zone. The introduction of the permeable spur dike generated three distinct regions with varying flow velocities within the 45°, 90°, and 180° bends: a positive flow velocity region, a transition region, and a negative flow velocity region. The primary flow region was situated between the spur dike crest and convex bank, while the adverse flow region was concentrated in the submerged weir downstream of the permeable spur dike. Additionally, a transition zone originated from the spur dike crest and extended downstream along the flow direction, creating a narrow and elongated transitional flow zone. This transition zone encircled the recirculation zone and effectively demarcated it from the positive flow velocity region. Consequently, this transition zone generated a robust shear layer that strongly aligned with the spatial location of the flow velocity transition. The robust shear layers near the riverbed played a pivotal role in initiating the scour pits at the spur dike head and contributed significantly to the gradual transformation of the riverbed into a terraced morphology. Due to the obstructive effect of the permeable weir, a horseshoe vortex was generated to guide the mainstream to bypass the weir. The disruption of this vortex was sustained by the continuous action of the positive flow velocity, whereas the negative flow velocity region lacked the energy required to maintain the vortex structure. Consequently, the horseshoe vortex became attached to the flow transition zone near the weir head, increasing the turbulent dissipation rate outside the recirculation zone. The length of the recirculation zone in the 180° bend was observed to be the smallest at the same water depth (Figure 10), as the flow separation occurred earlier at the end of this zone. Comparatively, the velocity equivalent line contour at the end of the 45° bend exhibited a sharper profile than that at the termination of the recirculation zone in the 180° bend. This difference was due to the increased lateral flow velocity near the end of the recirculation zone in the 180° bend, which redirected the flow towards its concave bank, causing the streamlines to curve accordingly.
The contour map in Figure 11 presents the spatial distribution of the horizontal time-averaged flow velocity. Ahead of the recirculation zone, the predominantly positive flow velocity region existed, whereas the negative flow velocity region was primarily located at its trailing end. This distribution induced a counterclockwise rotation of the recirculation zone. The negative flow velocity at the end of the recirculation zone could cause compression, contributing to a reduction in size. Figure 11 illustrates that the lateral flow velocity (negative flow velocity) at the end of the 180° bend recirculation zone was higher, leading to a shorter recirculation zone than in the 45° and 90° bends. Additionally, the lateral dispersion of the water flow at the end of the 180° bend occurred earlier than at the 45° and 90° bends. This could be attributed to the higher lateral flow velocity in the recirculation zone at the end of the 180° bend, which caused an earlier collision between the transitional flow velocity zone surrounding the recirculation zone and the concave bank, completing the flow separation process. Meanwhile, the main stream of the river filled the entire bend and flowed downstream under the guidance of the concave bank. At the forefront of the recirculation zone, there was a difference in the horizontal flow velocity between the riverbed and the water surface, indicating the generation of a secondary flow within this region. This difference in the horizontal flow velocity across different water depths exhibited an increased intensity of the secondary flow within the recirculation zone of the 180° bend. In the 45° bend, a lateral flow velocity alternating in the positive and negative directions emerged downstream of the recirculation zone along the water flow direction. This behavior was similar to the flow around a cylinder in a straight river, where the lateral flow velocity alternated between positive and negative downstream of the cylinder, leading to an increased turbulent dissipation rate. However, this alternation of lateral flow velocity was not observed at the boundary of the return zone in the 180° bend, demonstrating that the increased bend curvature could inhibit the occurrence of this circumambulation phenomenon.
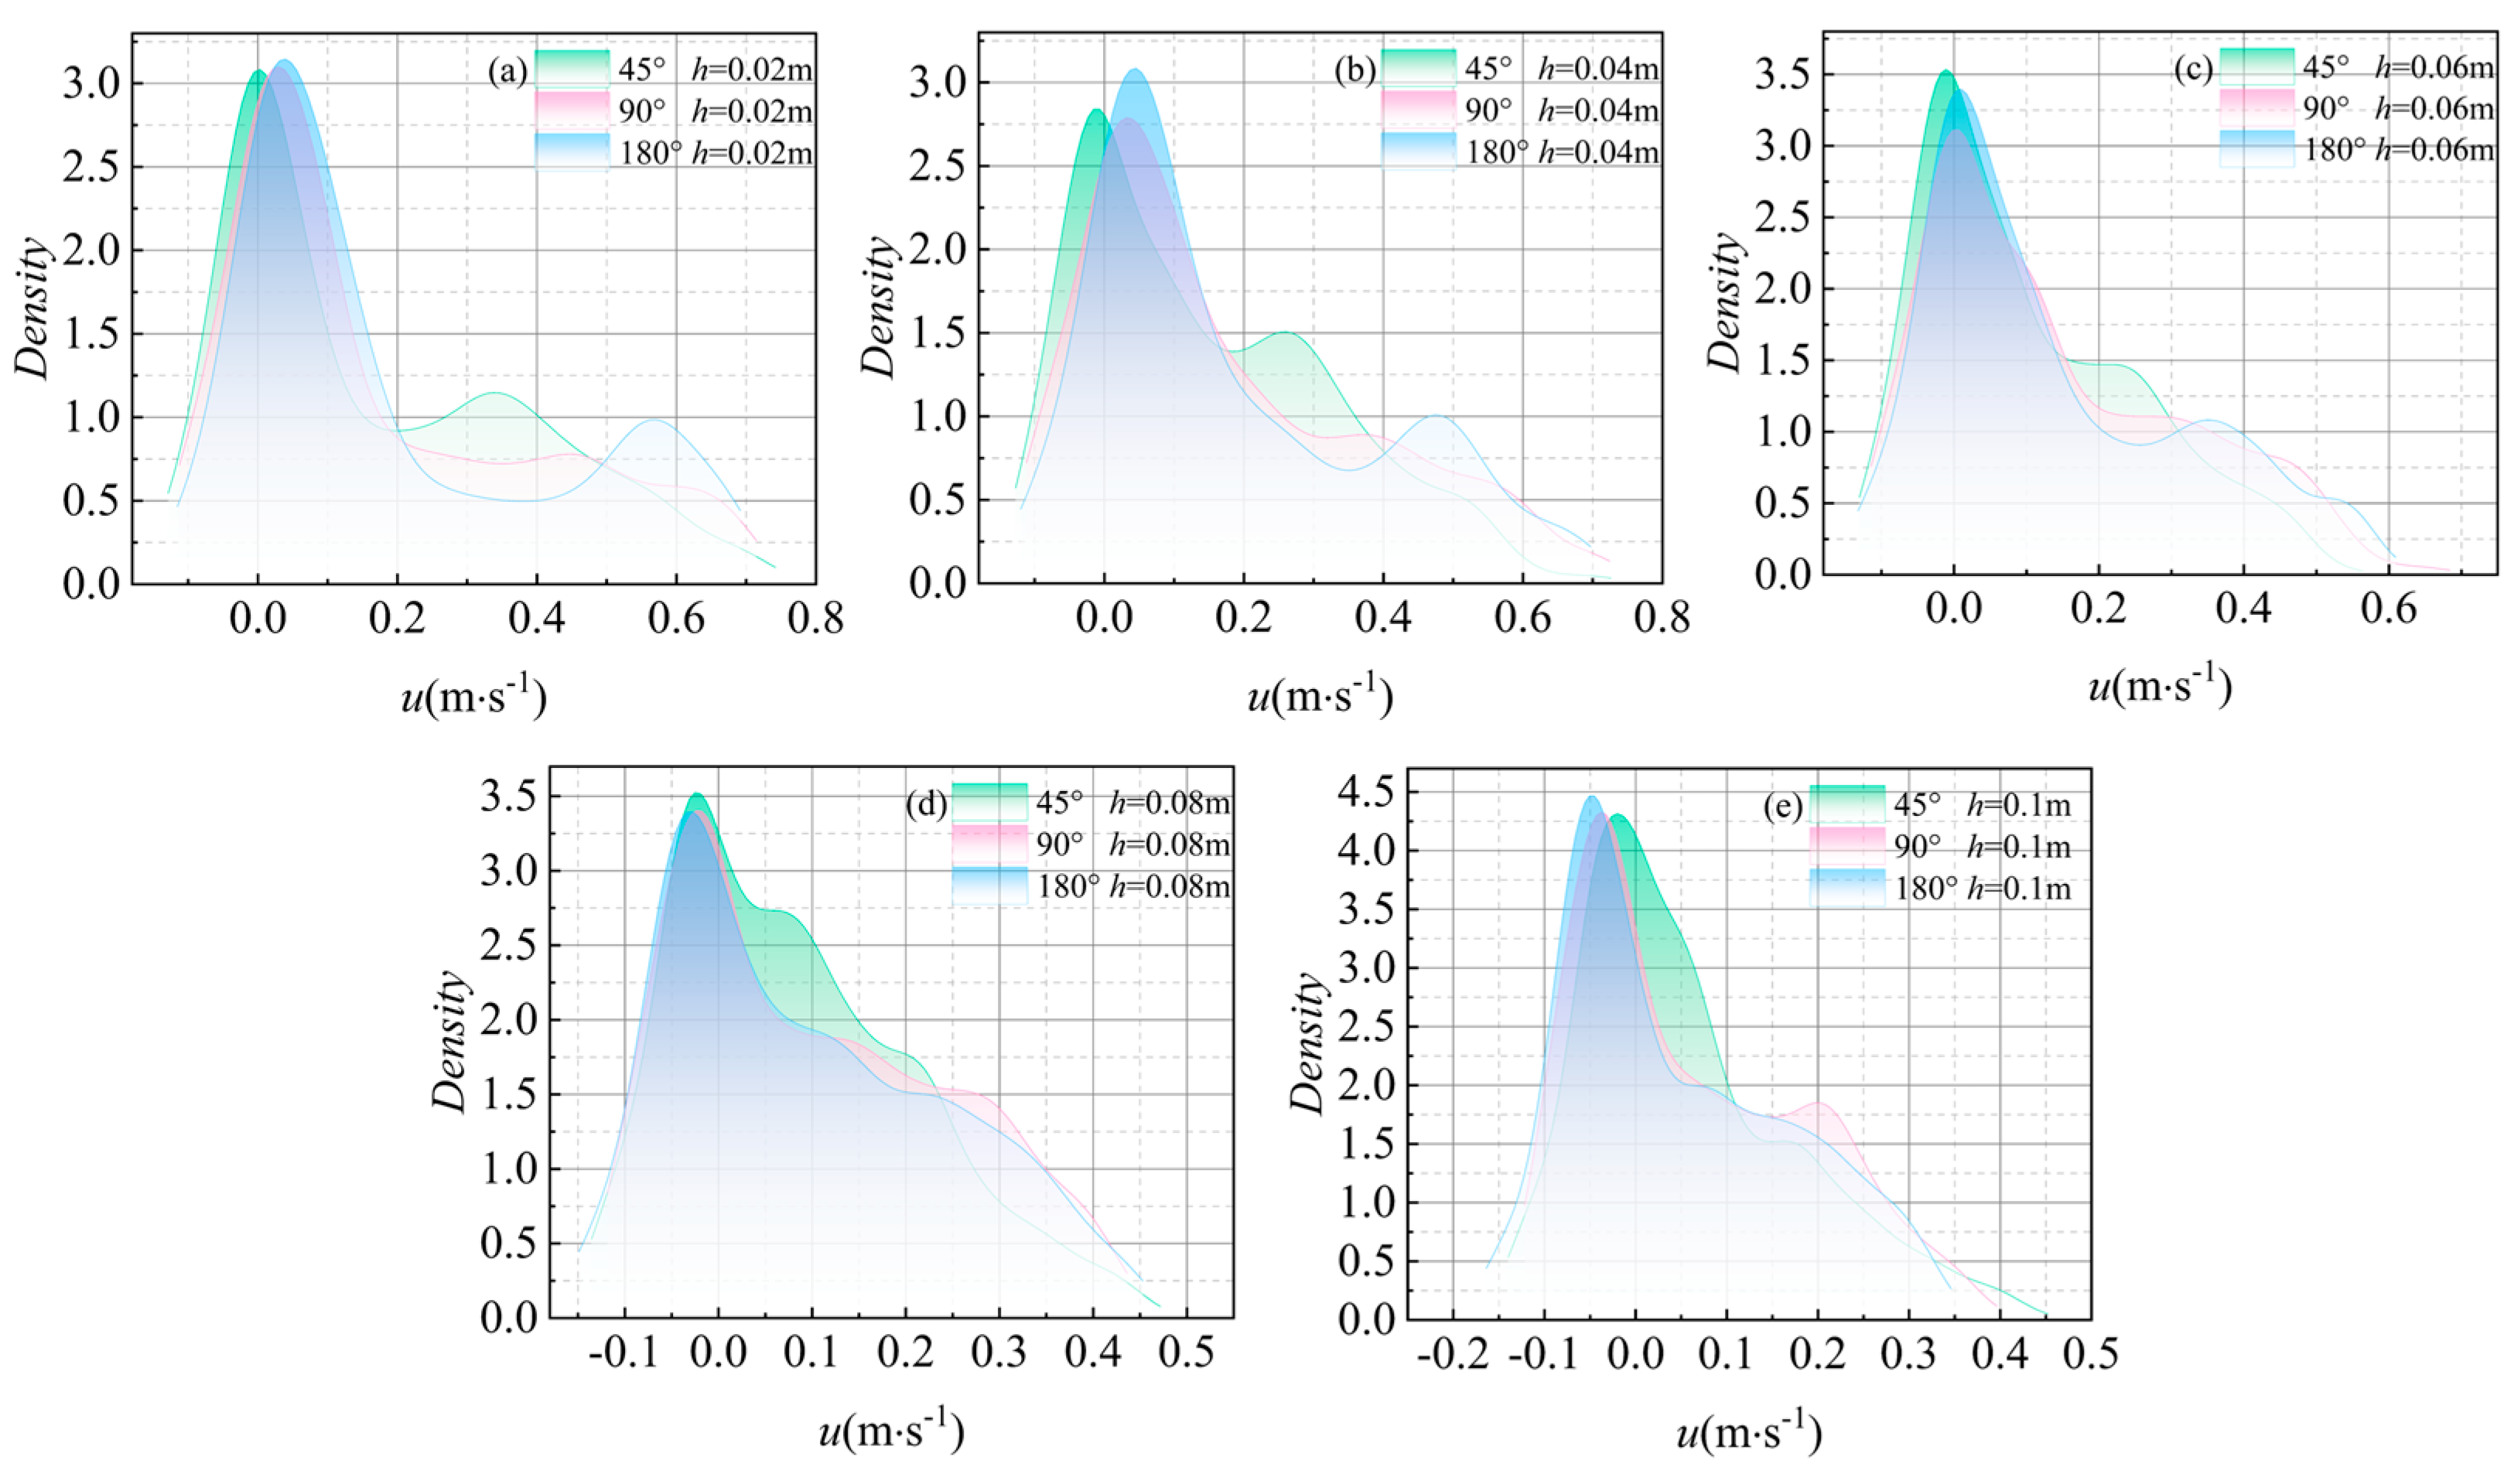
The Gaussian kernel density estimation was adopted to calculate the longitudinal and lateral time-averaged flow velocity densities at various water depth planes, as shown in Figure 12 and Figure 13. The measurement planes were positioned at elevations h = 0.02, 0.04, 0.06, 0.08, and 0.1 m for each figure. Gaussian kernel density estimation is performed based on Python; gaussian_kde is a class used to calculate kernel density estimation (KDE), and its bandwidth selection strategy is Scott’s Method. This is a general bandwidth selection method that provides a smooth density estimate for given data by considering the standard deviation of the data and the sample size to determine the bandwidth. It is calculated as follows:
H = s c o t t _ f a c t e r × s t d d a t a × n 1 / 5 .
where scott_factor is a constant (usually 1), std(data) is the standard deviation of the data, and n is the sample size.
The Gaussian kernel density estimation in Figure 12 illustrates the longitudinal mean velocity–density distribution. Table 2 presents the skewness coefficients. The longitudinal time-averaged velocity density within the recirculation zone exhibited a skewed distribution, primarily ranging from −0.2 to −0.8 m/s, with all the skewness coefficients exceeding 0. The clustering of velocities around zero suggested considerable instability in the longitudinal velocity within the recirculation zone, characterized by the overall low flow velocities. This instability could result from the vortex formation within the recirculation zone, where the velocities near the vortex center gradually approached zero. The longitudinal time-averaged velocity probability density curves for the recirculation zones of the three bends between 16% and 50% water depth (h = 0.02 m to h = 0.06 m) in Figure 12a–c indicated the presence of multiple peaks. These peak positions shifted towards the right with increasing bend curvature, indicating a higher probability of positive flow velocities within the recirculation zone and a more confined spatial extent. In Figure 12d,e, the probability density curve demonstrated a unimodal distribution between 66% and 83% water depth (h = 0.08 m to h = 0.1 m). Furthermore, an increase in the bend curvature led to a leftward shift in the peak of the probability density curve. This suggested that in the high-curvature bends, the recirculation zones expanded near the surface, along with an overall decrease in the flow velocity within these zones. The peak of the probability density of the time-averaged flow velocity increased gradually from the riverbed plane to the water surface within the same bend, indicating an expansion tendency of the low-velocity areas near the water surface. Between 66% and 83% water depth, the longitudinal time-averaged flow velocity fell below the average flow velocity (0.52 m/s), suggesting generally lower longitudinal flow velocities near the water surface.
The lateral time-averaged flow velocity density in the recirculation zone was estimated using the Gaussian kernel density estimation, and the resulting distribution is shown in Figure 13. Table 2 presents the skewness coefficients. The probability density distribution of the lateral time-averaged flow velocity exhibited a skewed pattern, ranging between −0.175 and −0.1 m/s. The skewness coefficients of less than 0 were observed at 16%, 33%, and 50% of the water depths for bends of 90° and 180°, with most flow velocities centered around zero, similar to the longitudinal flow velocity distribution. The probability density curve of the longitudinal mean flow velocity in the recirculation zone between 16% and 50% water depth exhibited multiple coexisting peaks, as shown in Figure 13. Notably, all these peaks were situated on the left side, indicating a substantial negative flow velocity within the recirculation zone. When comparing this observation with Figure 11, the positive flow velocity was mainly concentrated towards the front of the recirculation zone, whereas the region characterized by negative flow velocity was primarily focused at its end. This distribution pattern of negative flow velocity ultimately outlined the end of the recirculation zone. Between 16% and 33% water depths, the peak values of the longitudinal flow velocity density distribution map were negatively correlated with the curvature of the bend, indicating that the lateral flow velocity was lower in low-curvature bends. Between 50% and 83% water depths, the wave crests continued to rise at 90° bends, meaning that the lateral flow velocity in the recirculation area of the 90° bend was closer to 0. The negative flow velocity in the recirculation zone decreased from the riverbed surface to the water surface, indicating a weakened lateral flow effect near the water surface. Conversely, long-term erosion by negative flow velocity persisted near the riverbed and served as the primary trigger for riverbank collapse and migration.

3.3. Turbulent Kinetic Energy and Turbulent Kinetic Energy Dissipation Rate

The installation of the permeable spur dike in the meandering river altered the water flow structure, increasing the complexity of the flow field. Furthermore, distinct variations in both the turbulent kinetic energy and turbulent dissipation rate were observed across different bends. Analyzing the turbulent kinetic energy and dissipation rate at different water depths within the three bends provided a deeper understanding of the hydrodynamic characteristics of the recirculation zone.
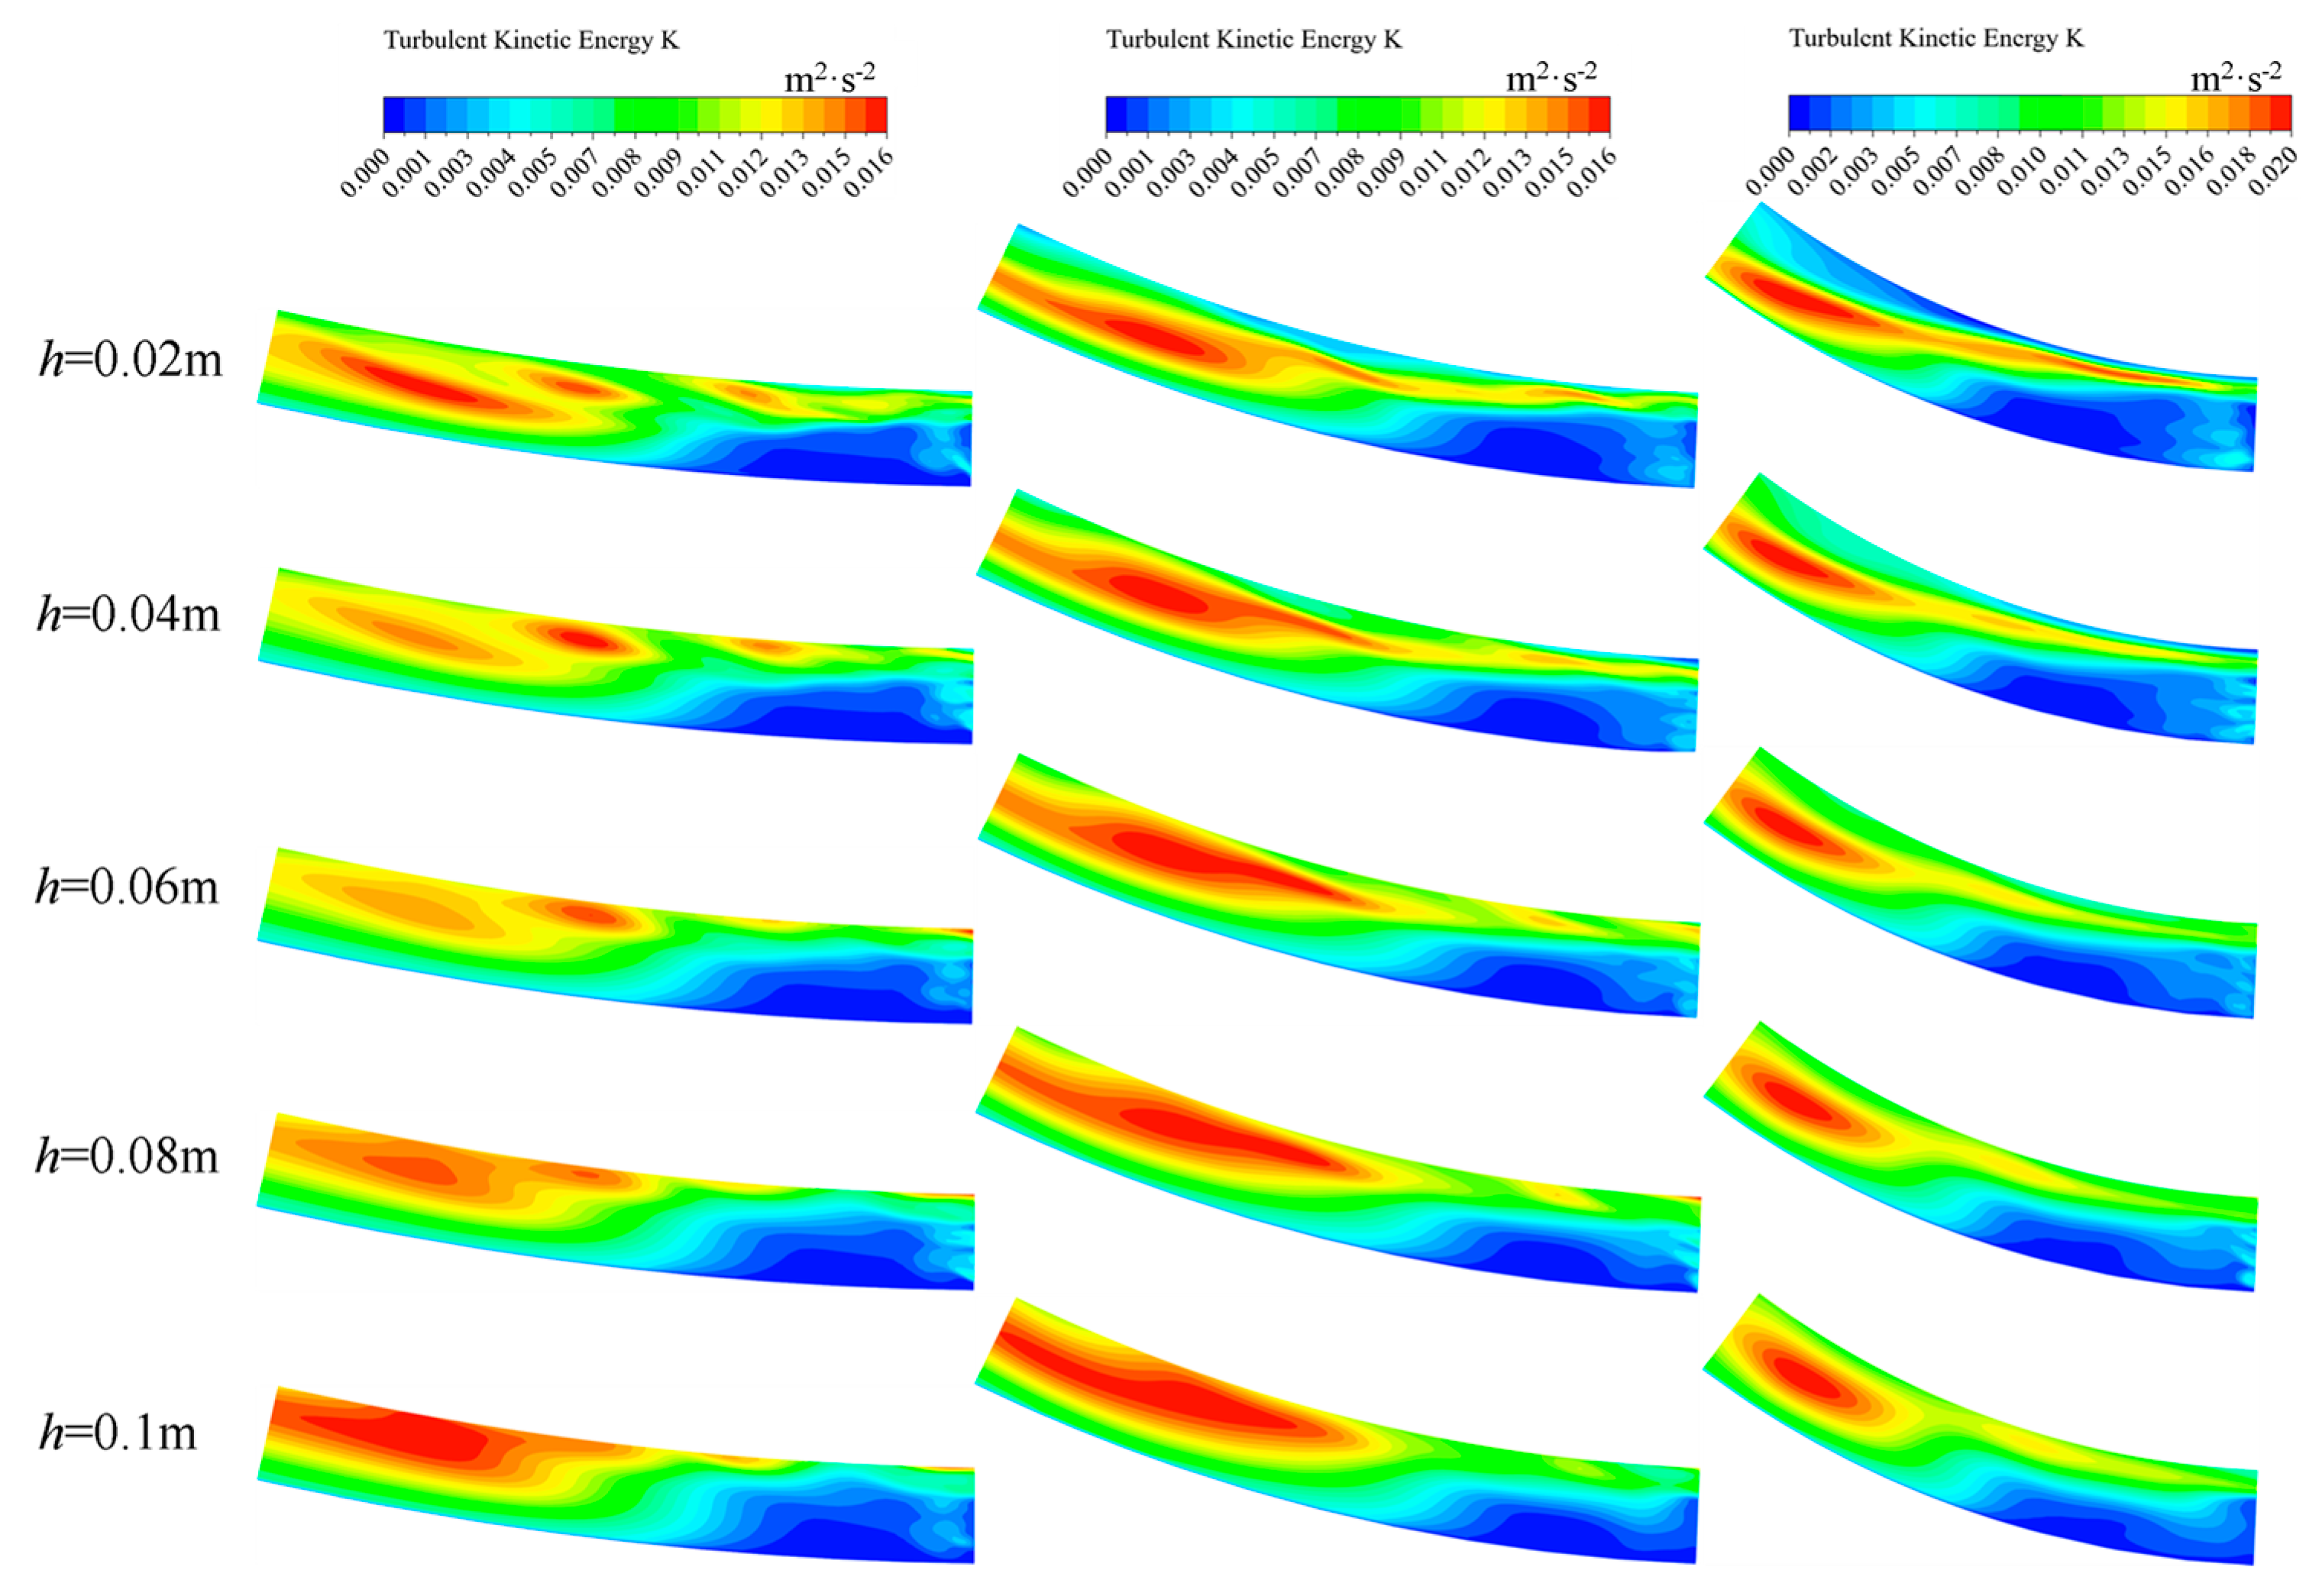
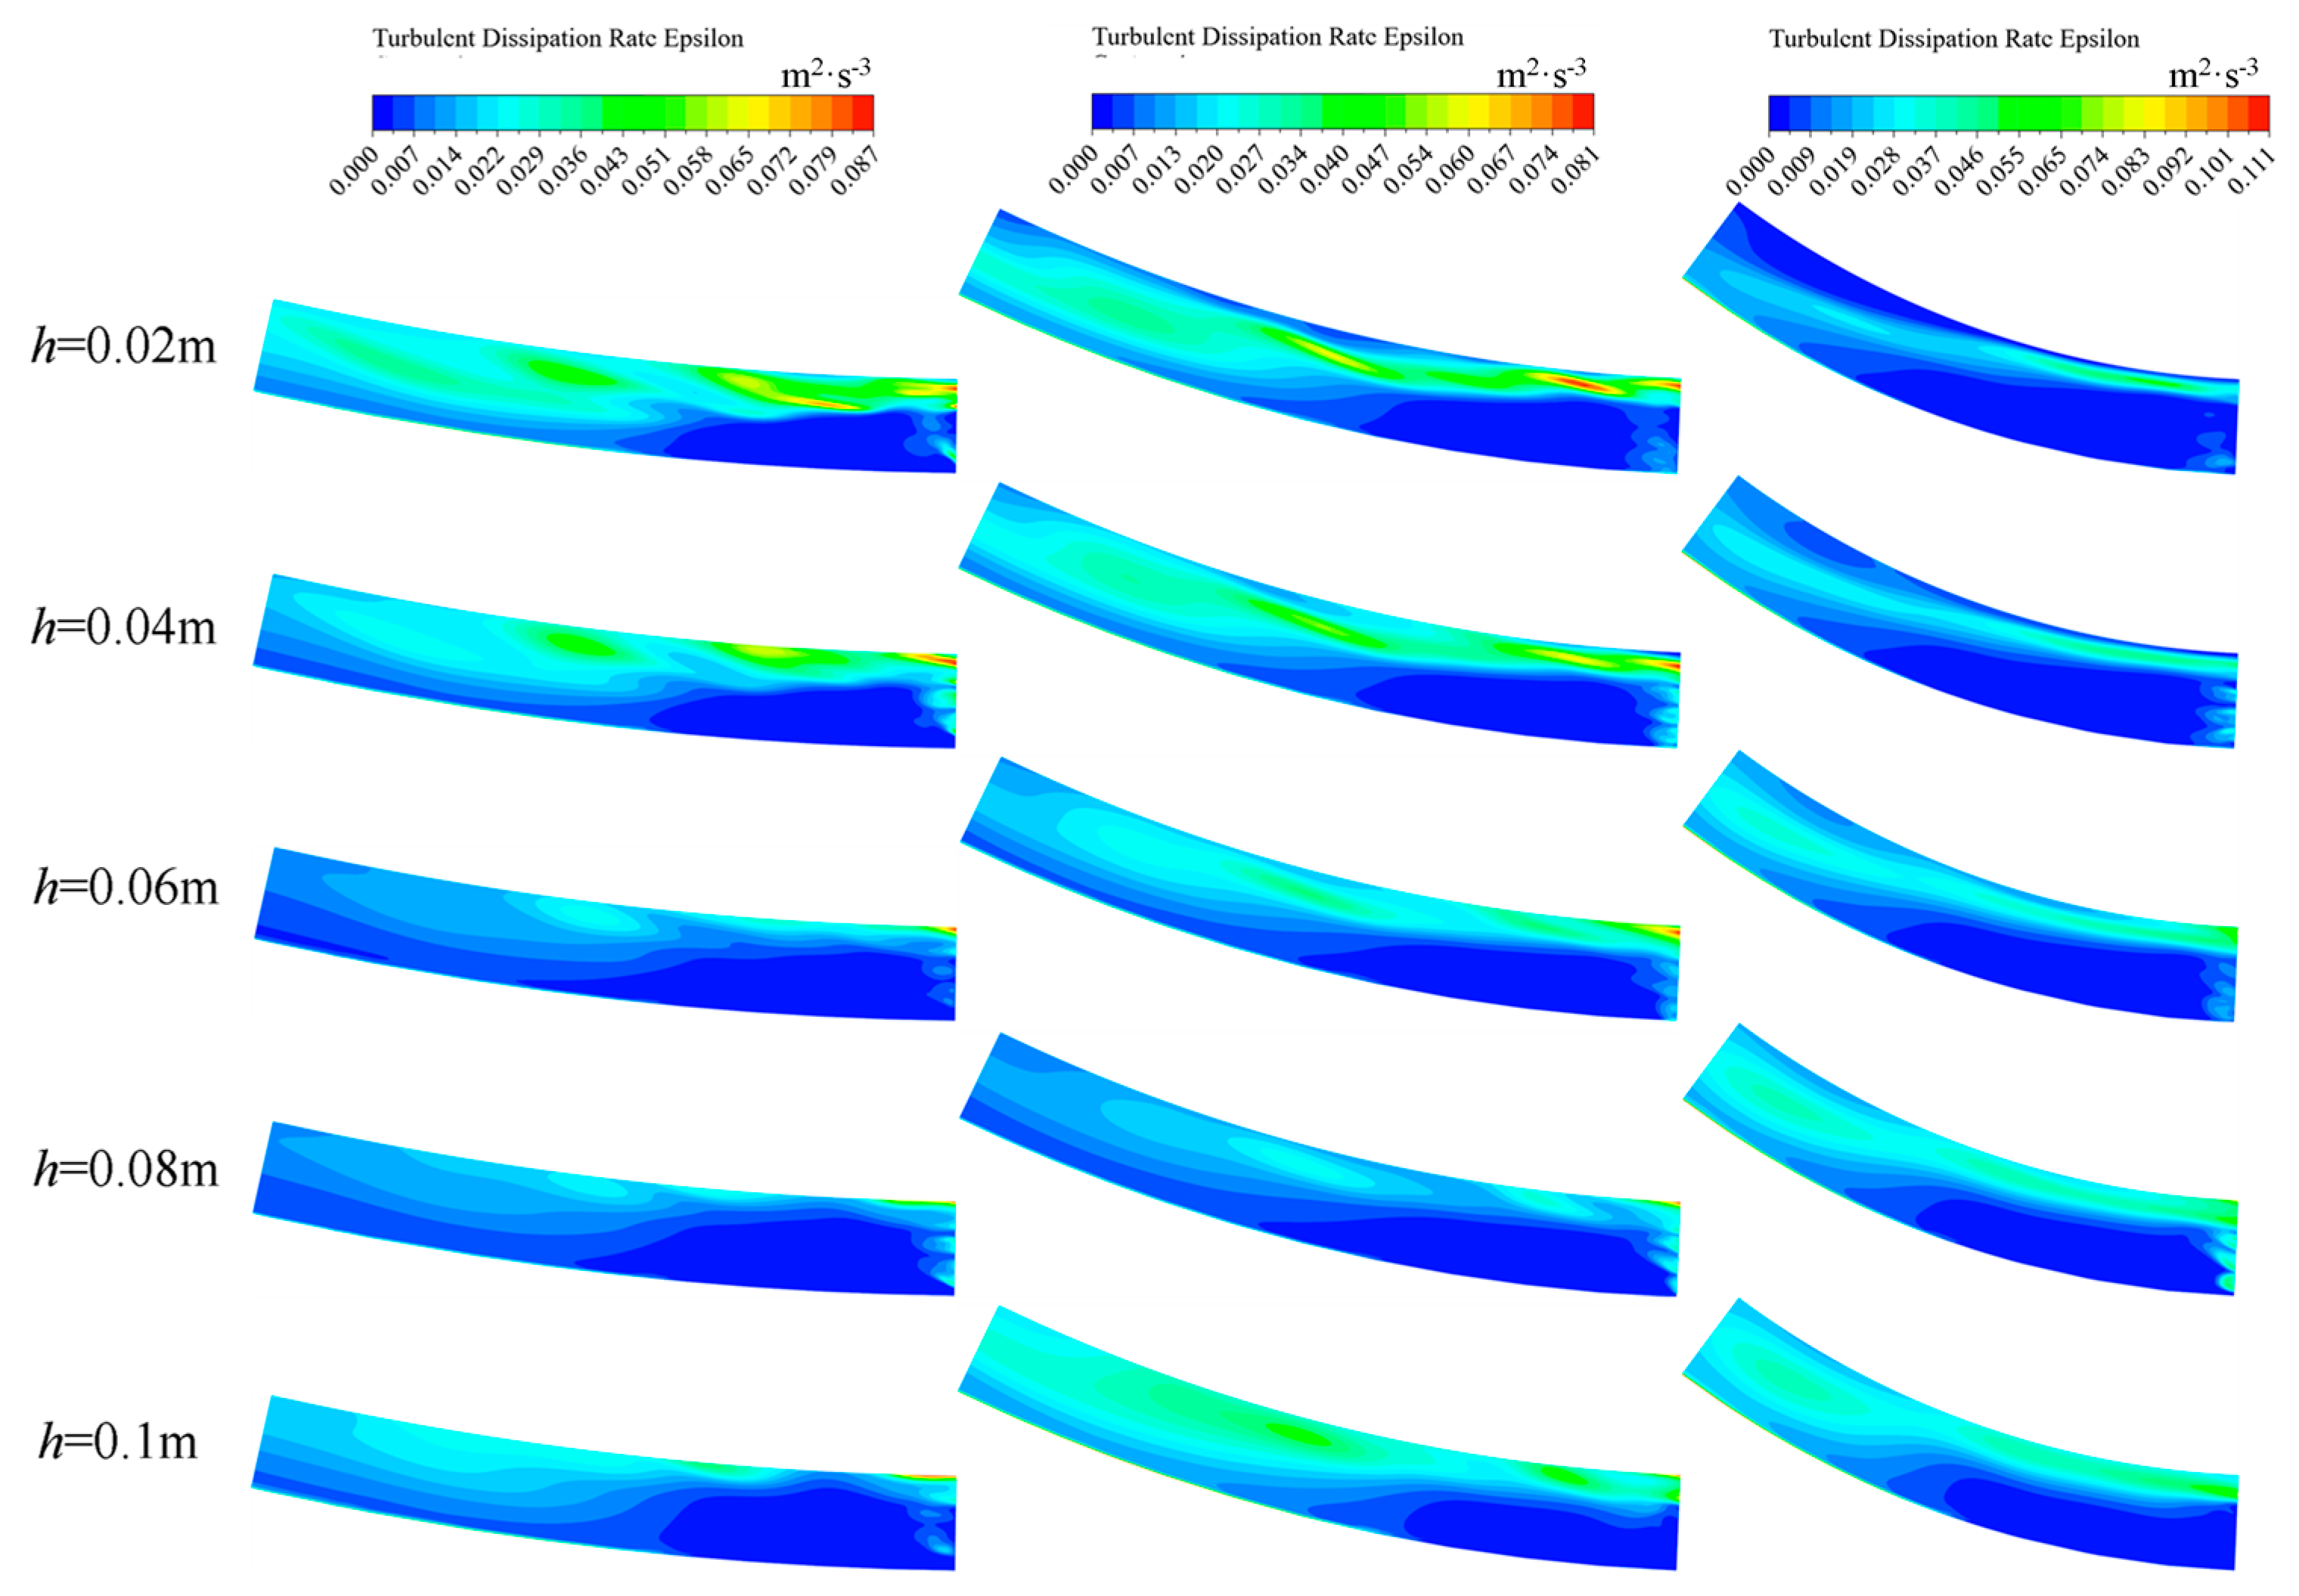
Figure 14 and Figure 15 illustrate the contour lines of the turbulent kinetic energy and turbulent kinetic energy dissipation rate, respectively, at various water depth planes within the recirculation zone, including the elevations of 0.02, 0.04, 0.06, 0.08, and 0.1 m.
Figure 14 illustrates the distribution of the turbulent kinetic energy in the recirculation zone of a bend. Higher levels are concentrated towards the middle to the end of the recirculation zone, particularly within the transition region characterized by a significant horizontal velocity gradient between the dominant high-speed mainstream and low-speed recirculation zones. This gradient prevented viscous forces from impeding the relative motion between the adjacent liquid layers, leading to the generation of turbulent eddies. The dissipation of energy within the turbulent vortex was attributed to the viscosity of the liquid and collisions, which required continuous external energy input to sustain the evolution of the turbulent vortex. The interlayer viscosity hindered the vortex formation, and under its dominance, the flow rate was reduced.
The turbulent kinetic energy distribution contracted at the end of the recirculation zone, indicating a decrease in the internal energy along the flow within the turbulent vortex body and a gradual weakening of the collision and friction between adjacent fluids. Consequently, there was a reduction in the local head loss at the end of the recirculation zone along the flow. The regions characterized by lower turbulent kinetic energy were primarily concentrated in the frontal region of the recirculation zone and in close proximity to the concave bank. Comparing Figure 10 and Figure 11 depicting the velocity components along different directions revealed that the areas exhibiting lower turbulent kinetic energy aligned closely with those presenting reduced flow velocities. This observation signified that the implementation of a permeable spur dike effectively mitigated the downstream flow velocities adjacent to the concave bank, offering substantial protection to riverbanks. The low-velocity hydrodynamic environment created by this permeable spur dike established favorable conditions for nutrient-rich sediment deposition. However, in rivers with high sediment content, the convergence of low turbulent kinetic energy and flow velocity could predominantly occur in specific areas, resulting in significant sediment deposition. This continuous accumulation of sediment could cause the loss of permeability in permeable spur dikes without human intervention and subsequently encroach on the benthic animal community habitat.
The differences in turbulent kinetic energy at varying water depths were evident within the three bends. Near the water surface, there was a clear tendency for the expansion of the high-turbulent kinetic energy region at the end of the recirculation zone. However, the strong turbulent kinetic energy gradually decreased in a belt-like manner from the middle to the front of this zone. Consequently, downstream of the recirculation zone, significant undulations and fluctuations in the water surface were observed.
Figure 15 illustrates the distribution of the turbulent energy dissipation rate in the return flow zone for the three bends. The area with a high turbulent energy dissipation rate was concentrated downstream of the spur dike head, and this area coincided with the flow velocity transition area. The dissipation rate decreased along the way, mainly due to the strong flow-lifting effect of the permeable spur dike. Downstream of the spur dike head and close to it, the high-speed water flow exhibited a lateral swing phenomenon, increasing the collision and friction between liquids and contributing to significant water flow energy consumption.
The probability density of the turbulent kinetic energy and its dissipation rate in the recirculation zone was estimated at various depth planes using the Gaussian kernel density estimation. The measurements were performed at elevations of h = 0.02, 0.04, 0.06, 0.08, and 0.1 m.
The probability density of turbulent kinetic energy in the recirculation zone was estimated using the Gaussian kernel density estimation in Figure 16, and Table 3 presents the skewness coefficients. The distribution of turbulent kinetic energy exhibited skewness ranging from −0.02 to 0 with a predominantly positive skewness coefficient. The probability density plot demonstrated multiple peaks, indicating that the turbulent energy was distributed across both high- and low-turbulent energy regions. The results suggested that the maximum turbulent kinetic energy levels were primarily observed within the ranges of 0 to 0.005 m2·s−2 and 0.008 to 0.015 m2·s−2. The peak of turbulent kinetic energy was observed between 0 and 0.005 m2·s−2 near the riverbed, with the highest probability density peak occurring in the 180° bend and another significant peak near the water surface in the 45° bend. In the 45° bend, the highest probability density peak of turbulent kinetic energy occurred when the peak of turbulent kinetic energy appeared between 0.008 and 0.015 m2·s−2 near the riverbed. The peak probability density for turbulent kinetic energy was the highest within the 180° bend, particularly near the water surface. This wave-like variation arose from the normalization condition, where the integral of the probability density curve was equaled to unity.
The probability density of the turbulent kinetic energy dissipation rate was estimated using the Gaussian kernel density estimation in Figure 17, with the corresponding skewness coefficients summarized in Table 3. Although the instances of turbulent kinetic energy dissipation rates exceeding 0.06 m2·s−3 were observed within the recirculation zone, their associated probability densities at such values were extremely small, indicating an overall relatively low level of the turbulent kinetic energy dissipation rate within the zone. Figure 17 illustrates multiple peaks in the turbulent kinetic energy dissipation rate, suggesting the presence of regions with relatively high and low rates within the recirculation zone. Combined with Figure 17e, the overall turbulent kinetic energy dissipation rate was lower in the low-radius bend near the water surface, indicating greater stability at this location.

3.4. Flowlines of the Return Flow Area

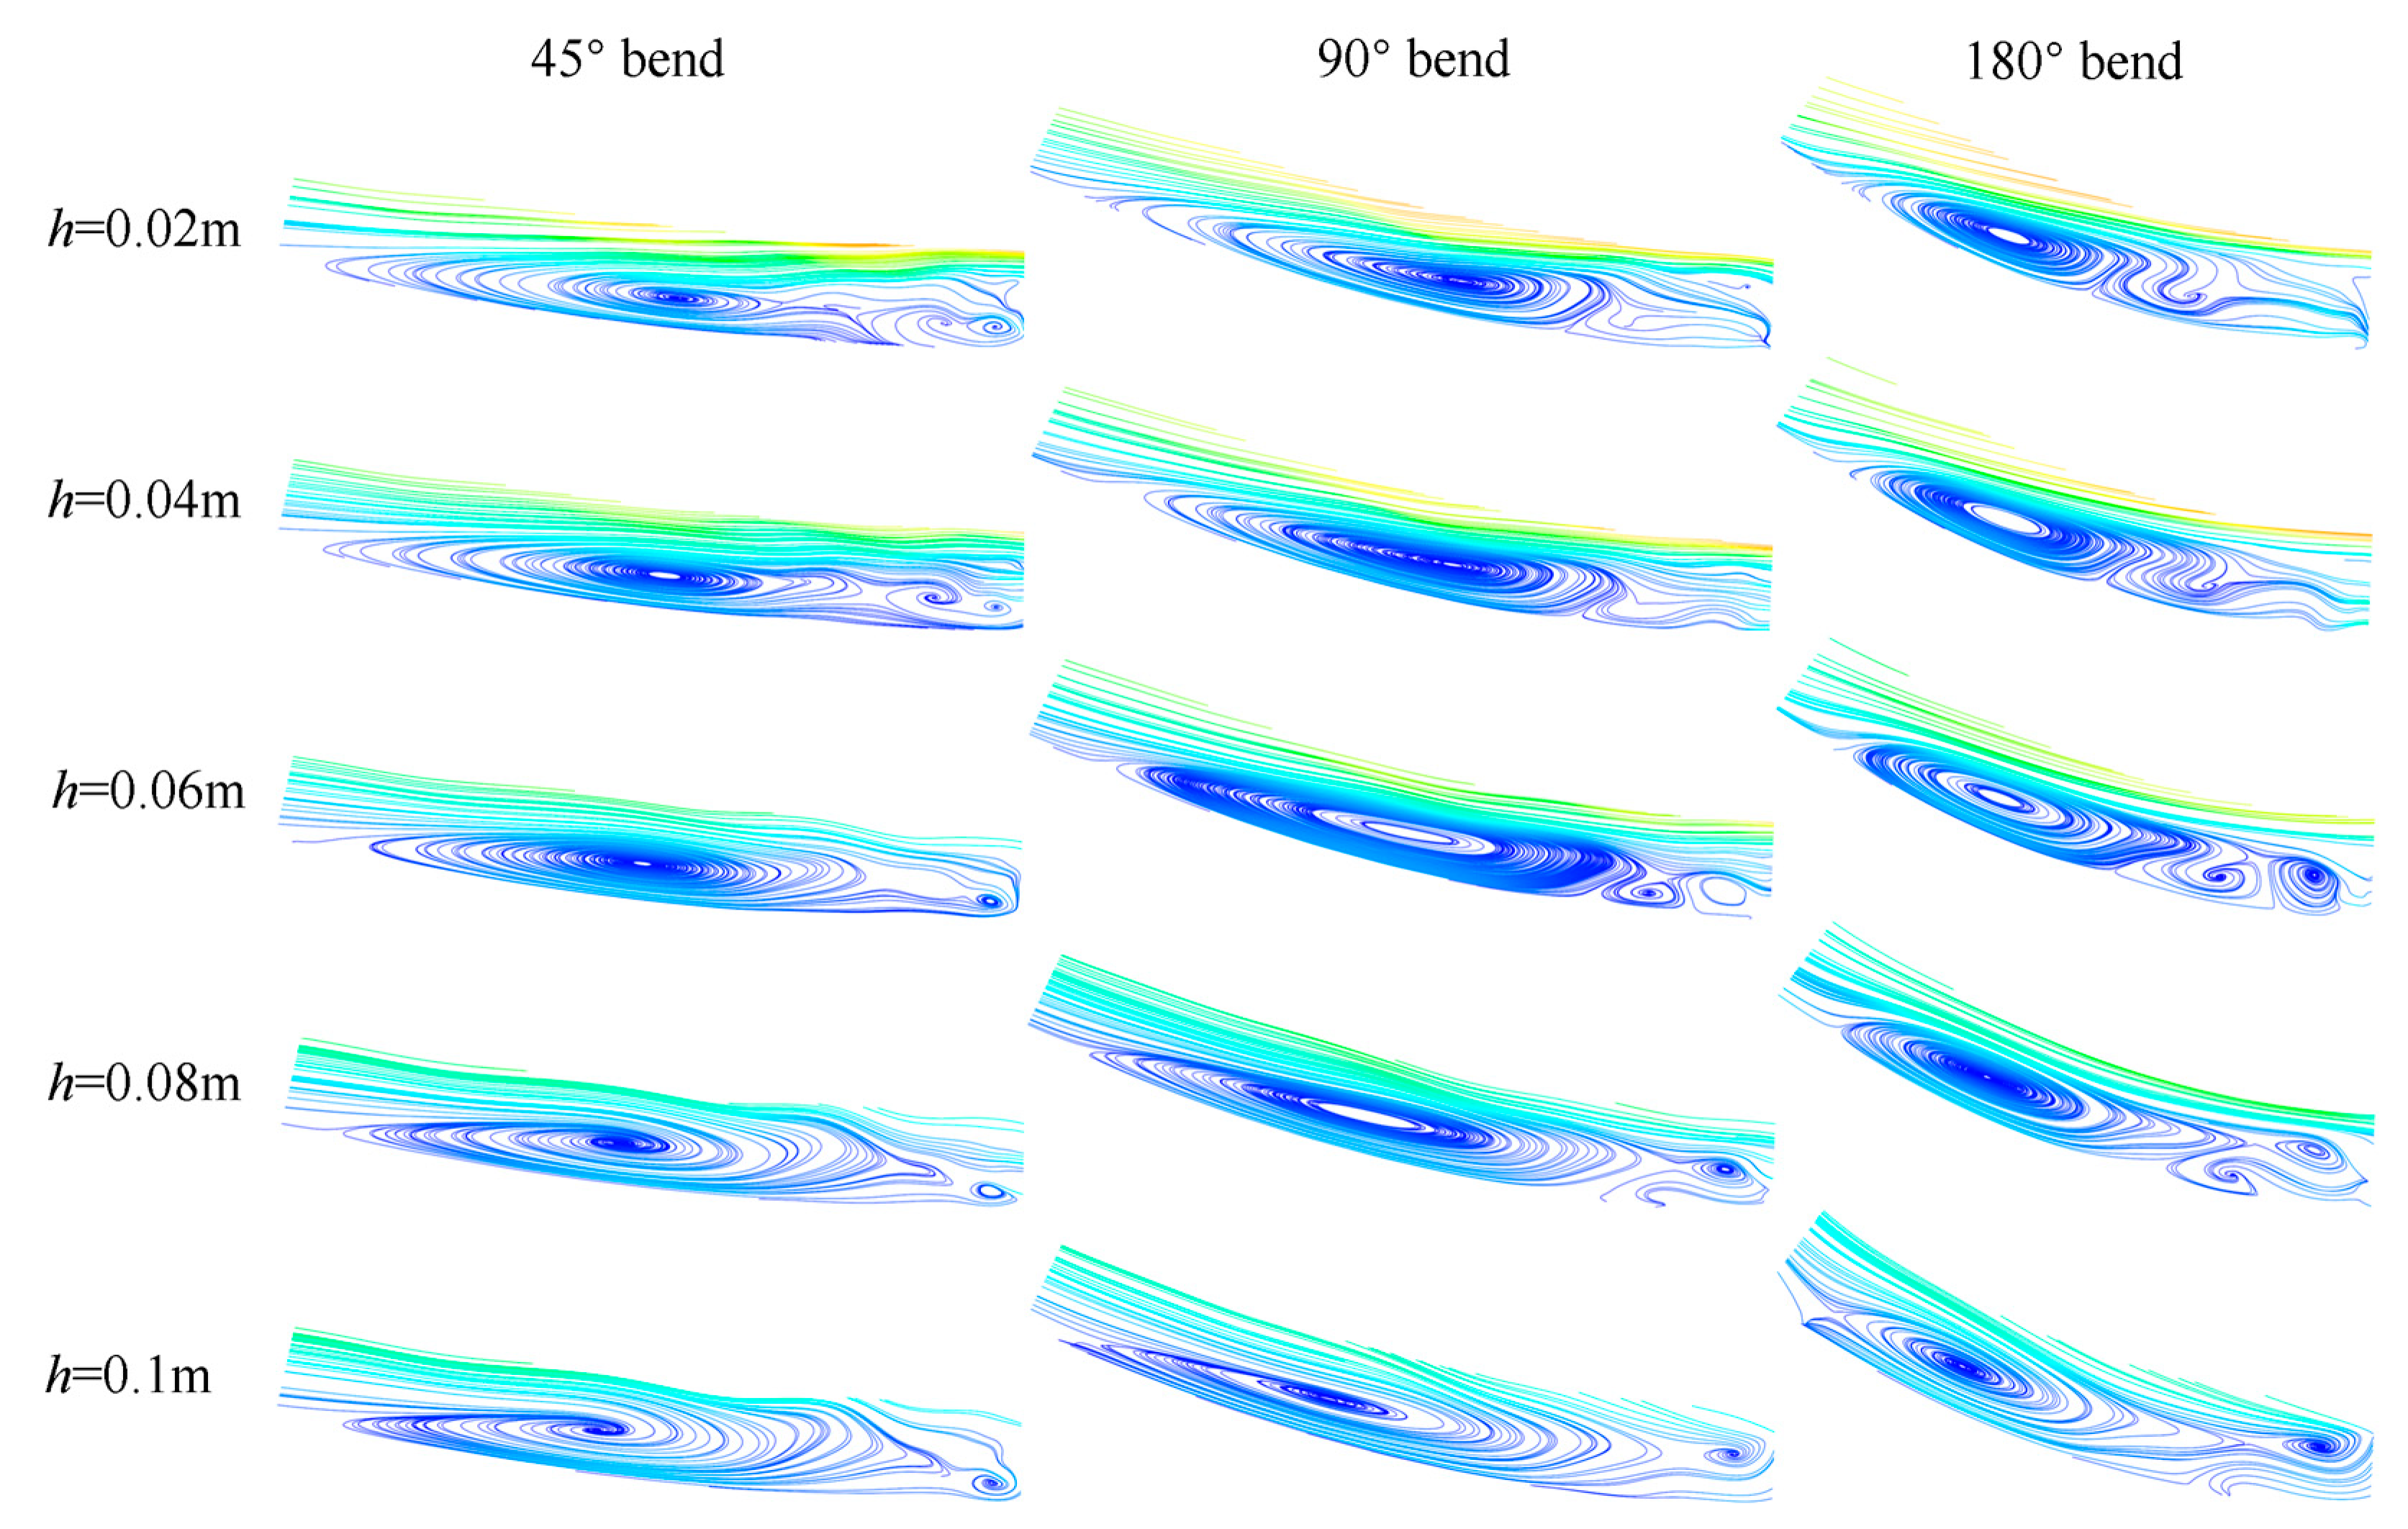
The distribution of the average flow lines at different water depth planes in the recirculation zones of the 45°, 90°, and 180° bends is illustrated in Figure 18. The elevation of the measurement plane for flow velocity was set at intervals of 0.02 m, ranging from 0.04 to 0.1 m. In Figure 18, the length of the recirculation zone within the 180° bend was reduced as the mainstream flow was directed towards the concave bank by the permeable spur dike after passing through it. This redirection led to the compression and squeezing at the end of the recirculation zone, thereby shortening its length. The centers of the vortices at different water depth levels all exhibited varying degrees of downstream inclination due to the enhanced friction experienced by the water flow near the riverbed, as well as the inherent viscosity of the fluid. The vortex structure in the recirculation zone was well-developed near the riverbed, while the streamlines at the end of the recirculation zone were stripped away near the surface. As depicted in Figure 18, the streamlines outside the recirculation zone did not encircle their ends because of the limited lateral flow velocity and insufficient kinetic energy to sustain the continued diffusion towards the concave bank, which was particularly noticeable near the water surface. Between the head and tail of the recirculation zone, the primary flow diffused laterally, exerting continuous pressure on the spatial structure of the recirculation zone, resulting in the adoption of a morphology resembling that of a pea. The middle section of the recirculation zone near the riverbed exhibited a curving pattern towards the concave bank, whereas the middle section of the recirculation zone near the water surface assumed a rounded shape. This was attributed to the amplified lateral flow velocity directed towards the concave bank in close proximity to the riverbed, leading to the compression of the recirculation zone. The backwater zone effectively mitigated the erosive impact of high-intensity lateral flow resulting from the mainstream diffusion on the concave bank. A corner vortex emerged behind the second permeable spur dike at a 45° bend near the riverbed, whereas no such vortex was observed at the 90° or 180° bends due to the relatively low water flow energy near the permeable hole, which did not disrupt the existing vortex structure. The vortices were generated within the regions of low flow velocity and characterized by a minimal velocity at the core of the vortex. Consequently, in rivers where permeable weirs were employed to enhance habitat suitability for benthic organisms, sedimentation occurred as a result of vortex formation. The accumulation of nutrient-laden sediments near weirs provided the nourishment for benthic organisms. However, in high-sediment rivers, excessive sediment deposition behind weirs could compromise their permeability. At a water depth of 75%, the corner vortices formed at bends of 45°, 90°, and 180° within the second permeable spur dike, located near the water surface. To preserve the vortex structure, no permeable holes were present at this depth to prevent the water flow from passing through and causing destruction, thereby ensuring suitable flow velocity conditions for maintaining the integrity of the vortex structure. No vortices were observed at the 90° and 180° bends near the riverbed, whereas the vortices manifested at a distance from the riverbed, indicating the presence of a water flow layer separating the vortices behind the No. 2 permeable spur dike from the riverbed, implying the subsurface water flow beneath these vortices. The centers of vortices at different water depth levels all exhibited varying degrees of downstream inclination due to the enhanced friction experienced by the water flow in close proximity to the riverbed, as well as the inherent viscosity of the fluid. The vortex structure in the recirculation zone was well-developed near the riverbed, whereas the streamlines at the end of the recirculation zone were stripped near the water surface, resulting in flow loss within this region. This phenomenon became particularly pronounced when a 45° bend was encountered.

4. Discussion

In Teraguchi et al.’s study [4], it was proposed that a low-velocity area formed downstream of the permeable weir rather than a recirculation zone. However, in our investigation of the bends with different curvatures, we observed the formation of a stable recirculation zone and a stable low-velocity area behind the permeable weir. This finding suggested that the presence of a recirculation zone was influenced by both the overall flow velocity and bend permeability. The excessive permeability and low flow velocity could impede the formation of recirculation zones. The mountainous rivers exhibited greater elevation changes and meandering river beds. Integrating the findings of Zhou and Gu et al.’s research on mountainous rivers [7,58], the hydraulic structure of the permeable spur dike investigated in this study was well-suited for river management in mountainous regions.
Jeon et al. [59] investigated the water flow structure around the spur dike and observed distinct shear layers of varying intensities. The weaker shear layers were observed farther from the spur dike, whereas the stronger shear layers exhibited a ribbon-like pattern downstream along the spur dike head. These strong shear layers coincided with the regions of reduced flow velocity, creating pronounced shear within the areas of low-velocity water flow. Figure 10 illustrates a layer of low-speed water flow surrounding the periphery of the recirculation zone. A significant velocity difference existed on either side of this low-speed region, indicating the presence of a robust shear layer encircling the recirculation zone.
The presence of a porous spur dike induced a horizontal water flow, forming a horseshoe vortex upstream. This vortex directed water to circulate horizontally around the spur dike before dissipating downstream along the transitional zone [60,61]. Figure 10 demonstrates a distinct ribbon-like region downstream of the spur dike head, characterized by the pronounced turbulent energy dissipation. This phenomenon occurred because of the circulation of the horseshoe vortex around the T-shaped spur dike structure and its downstream extension. The location of the horseshoe vortex was clearly identifiable by the cloud map of the energy dissipation rate of the turbulent flow, with higher kinetic energy near the spur dike head dissipating along the flow. However, the high-energy region at the end of the recirculation zone was unrelated to the horseshoe vortex because it occurred after its disappearance.
The formation of stable bypass flow areas occurred at bends of 45°, 90°, and 180°, as Higham [62] employed the PIV technology to reconstruct the structure of the bypass flow area at an l/H value of 6.25. Their experimental findings revealed the generation of two vortices within the bypass flow area, rotating in opposite directions and characterized by different sizes. Importantly, these vortices were aligned perpendicular to the gravitational force. The numerical simulations conducted by Paik and Sotiropoulos [63] revealed the presence of this vortex structure in the recirculation zone at l/H = 27. Similarly, Jeon et al. [59] observed a two-vortex morphology within the recirculation zone at l/H = 1.4. However, they noted that the small-scale vortex axis near the breakwater exhibited a horseshoe-like configuration parallel to the horizontal plane, which was typically associated with the upstream obstacle guidance of flow around obstacles [64,65]. Yakhot et al. [61] suggested that the vortex structures in the recirculation zone were influenced by l/H, and the experimental parameters were set to closely align with the Jeon et al. [59] experiment, specifically with l/H = 1.25. A comparison with Figure 18 revealed that multiple vortices existed within the recirculation zone. However, these vortices only coexisted simultaneously at different water depth planes within the 45° bend, whereas a single large-scale vortex was present near the riverbed at both the 90° and 180° bend planes. Evidently, the phenomena observed in this experiment were inconsistent with previous studies. On the other hand, the vortex structures identified by the aforementioned researchers within the recirculation zone were consistently present in our investigation. Three vortices manifested near the 50% water depth plane at the 180° bend, whereas only two vortices were evident at the 45° bend. This suggested that not only l/H but also the bend curvature and spur dike permeability exerted an influence on the vortex structures within the recirculation zone.

5. Conclusions

The recirculation zone in the 180° bend was the shortest, and increasing the bend curvature effectively reduced its size. However, this reduction also reduced the area of low flow velocity, which could destabilize the concave bank and limit the habitat availability for benthic communities. The lateral flow velocity within the recirculation zone remained generally low across all three types of bends, with minimal differences among them. Notably, the changes in the bend curvature had little impact on the lateral flow velocity in this region. In contrast, the bend curvature significantly affected the lateral flow velocity at the end of the recirculation zone, where higher curvatures led to larger negative velocities as water flowed towards and eroded the concave bank, increasing the erosion risks.
The longitudinal time-averaged flow velocity near the permeable dike ranged from −0.2 to −0.8 m/s, with a skewness coefficient greater than 0, indicating most velocities were near 0. The flow in the return flow area was highly unstable and generally very low. This low velocity promoted the nutrient-rich sediment deposition, providing a favorable habitat for benthic communities. Between 16% (h = 0.02 m) and 50% water depths (h = 0.06 m), the probability of positive flow velocity in the return flow area increases. The spatial range of the return flow area decreased as the bend curvature increased. Between 66% (h = 0.08 m) and 83% water depths (h = 0.1 m), the return flow area near the highly curved bend expanded, resulting in a lower overall flow velocity. Near the riverbed, the end of the return flow area created a continuous lateral flow that eroded the concave bank. However, the lower lateral kinetic energy near the water surface prevented the entire flow diffusion to the concave bank and reduced erosion compared with the riverbed. This erosion sequence progressed from the continuous erosion of the outer bank foundation to the upper structure hanging in the air, eventually collapsing.
After installing the permeable spur dike in the meandering river, the turbulent energy was distributed across areas of high and low levels rather than being concentrated within a specific range. Within the recirculation zone, two distinct regions emerged: one with a relatively high turbulent kinetic energy dissipation rate, and the other with a lower rate. Near the water surface, the turbulent kinetic energy dissipation rate was lower at the low-radius bend, indicating a more stable water surface.

Author Contributions

Software, formal analysis, writing—original draft, P.X.; project administration, conceptualization, methodology, S.L.; investigation and supervision, Z.L. and Y.Z.; writing—review and editing, J.L. All authors have read and agreed to the published version of the manuscript.

Funding

This work was supported by the Ningxia Natural Science Foundation of China (2022AAC03283, & 2023AAC02050).

Data Availability Statement

The data supporting this study’s findings are available from the corresponding author upon reasonable request.

Conflicts of Interest

The authors declare no conflicts of interest.

References

  1. Charlton, R.O. Fundamentals of Fluvial Geomorphology, 1st ed.; Routledge: London, UK, 2007. [Google Scholar]
  2. Duan, J.G.; He, L.; Fu, X.; Wang, Q. Mean flow and turbulence around experimental spur dike. Adv. Water Resour. 2009, 32, 1717–1725. [Google Scholar] [CrossRef]
  3. Azinfar, H.; Kells, J.A. Flow resistance due to a single spur dike in an open channel. J. Hydraul. Res. 2009, 47, 755–763. [Google Scholar] [CrossRef]
  4. Teraguchi, H.; Nakagawa, H.; Kawaike, K.; Baba, Y.; Zhang, H. Effects of hydraulic structures on river morphological processes. Int. J. Sediment Res. 2011, 26, 283–303. [Google Scholar] [CrossRef]
  5. Iqbal, S.; Pasha, G.A.; Ghani, U.; Ullah, M.K.; Ahmed, A. Flow dynamics around permeable spur dike in a rectangular channel. Arab. J. Sci. Eng. 2021, 46, 4999–5011. [Google Scholar] [CrossRef]
  6. Fujita, I.; Muto, Y.; Shimazu, Y.; Tsubaki, R. Velocity measurements around non-submerged and submerged spur dykes by means of large-scale particle image velocimetry. J. Hydrosci. Hydraul. Eng. 2004, 22, 51–61. [Google Scholar] [CrossRef]
  7. Gu, Z.; Akahori, R.; Ikeda, S. Study on the transport of suspended sediment in an open channel flow with permeable spur dikes. Int. J. Sediment Res. 2011, 26, 96–111. [Google Scholar] [CrossRef]
  8. Wu, W.; Wang, S.S.Y. Application of a depth-averaged 2-D model in river restoration. In Proceedings of the World Environmental and Water Resources Congress: Examining Confluence of Environmental and Water Concerns, Omaha, NE, USA, 21–25 May 2006; pp. 1–10. [Google Scholar]
  9. Hartman, K.J.; Titus, J.L. Fish use of artificial dike structures in a navigable river. River Res. Appl. 2010, 26, 1170–1186. [Google Scholar] [CrossRef]
  10. King, H.E. River stabilization with groynes in the Western Cape, South Africa. In Proceedings of the International Conference on Fluvial Hydraulics River Flow, Lausanne, Switzerland, 3–5 September 2014; pp. 2145–2150. [Google Scholar]
  11. Zha, W.; Huang, M.; Zeng, Y. Swimming behavior of crucian carp in an open channel with sudden expansion. River Res. Appl. 2019, 35, 1499–1510. [Google Scholar] [CrossRef]
  12. Gao, F.; Ma, W.; Zambonini, G.; Boudet, J. Large-eddy simulation of 3-D corner separation in a linear compressor cascade. Phys. Fluids 2015, 27, 085105. [Google Scholar] [CrossRef]
  13. Rajaratnam, N.; Nwachukwu, B.A. Erosion near groyne-like structures. J. Hydraul. Res. 1983, 21, 277–287. [Google Scholar] [CrossRef]
  14. Ikeda, S.; Sugimoto, T.; Yoshiike, T. Study on the characteristics of flow in channels with impermeable spur dikes. Doboku Gakkai Ronbunshu 2000, 2000, 145–155. [Google Scholar] [CrossRef] [PubMed]
  15. Fazli, M.; Ghodsian, M.; Neyshabouri, S.A.A.S. Scour and flow field around a spur dike in a 90 bend. Int. J. Sediment Res. 2008, 23, 56–68. [Google Scholar] [CrossRef]
  16. Haghnazar, H.; Hashemzadeh Ansar, B.; Asadzadeh, F.; Salehi Neyshabouri, A.A. Experimental study on the effect of single spur-dike with slope sides on local scour pattern. J. Civ. Eng. Mater. Appl. 2018, 2, 111–120. [Google Scholar]
  17. Fukuoka, S.; Watanabe, A.; Kawaguchi, H.; Yasutake, Y. A study of permeable groins in series installed in a straight channel. Proc. Hydraul. Eng. 2000, 44, 1047–1052. [Google Scholar] [CrossRef]
  18. Li, Z.; Michioku, K.; Maeno, S.; Ushita, T. Hydraulic characteristics of a group of permeable groins constructed in an open channel flow. J. Appl. Mech. 2005, 8, 773–782. [Google Scholar] [CrossRef]
  19. Han, L.; Riviere, N.; Chatelain, M.; Mignot, E. Recirculation zone downstream lateral expansions of open channel flow. Phys. Fluids 2020, 32, 115119. [Google Scholar] [CrossRef]
  20. Tominaga, Y.; Stathopoulos, T. CFD simulation of near-field pollutant dispersion in the urban environment: A review of current modeling techniques. Atmos. Environ. 2013, 79, 716–730. [Google Scholar] [CrossRef]
  21. Blocken, B.; Stathopoulos, T.; Van Beeck, J. Pedestrian-level wind conditions around buildings: Review of wind-tunnel and CFD techniques and their accuracy for wind comfort assessment. Build. Environ. 2016, 100, 50–81. [Google Scholar] [CrossRef]
  22. Thordal, M.S.; Bennetsen, J.C.; Koss, H.H.H. Review for practical application of CFD for the determination of wind load on high-rise buildings. J. Wind Eng. Ind. Aerodyn. 2019, 186, 155–168. [Google Scholar] [CrossRef]
  23. Moin, P.; Mahesh, K. Direct numerical simulation: A tool in turbulence research. Annu. Rev. Fluid Mech. 1998, 30, 539–578. [Google Scholar] [CrossRef]
  24. Ishihara, T.; Gotoh, T.; Kaneda, Y. Study of high–Reynolds number isotropic turbulence by direct numerical simulation. Annu. Rev. Fluid Mech. 2009, 41, 165–180. [Google Scholar] [CrossRef]
  25. Koken, M.; Constantinescu, G. An investigation of the flow and scour mechanisms around isolated spur dikes in a shallow open channel: 1. Conditions corresponding to the initiation of the erosion and deposition process. Water Resour. Res. 2008, 44, W08406. [Google Scholar] [CrossRef]
  26. Li, S.; Cain, S.; Wosnik, M.; Miller, C.; Kocahan, H.; Wyckoff, R. Numerical modeling of probable maximum flood flowing through a system of spillways. J. Hydraul. Eng. 2011, 137, 66–74. [Google Scholar] [CrossRef]
  27. Olsen, N.R.B. CFD Algorithms for Hydraulic Engineering; The Norvegian University of Science and Technology: Trondheim, Norway, 2000. [Google Scholar]
  28. Yakhot, V.; Orszag, S.A. Renormalization group analysis of turbulence. I. Basic theory. J. Sci. Comput. 1986, 1, 3–51. [Google Scholar] [CrossRef]
  29. Bulat, M.P.; Bulat, P.V.; Tian, C.; Lu, Y.; Goldberg, U.; Peroomian, O.; Chakravarthy, S. Comparison of turbulence models in the calculation of supersonic separated flows. World Appl. Sci. J. 2013, 27, 1263–1266. [Google Scholar]
  30. Choi, S.U.; Kang, H. Reynolds stress modeling of vegetated open-channel flows. J. Hydraul. Res. 2004, 42, 3–11. [Google Scholar] [CrossRef]
  31. Anjum, N.; Tanaka, N. Hydrodynamics of longitudinally discontinuous, vertically double layered and partially covered rigid vegetation patches in open channel flow. River Res. Appl. 2020, 36, 115–127. [Google Scholar] [CrossRef]
  32. Ghani, U.; Anjum, N.; Pasha, G.A.; Ahmad, M. Numerical investigation of the flow characteristics through discontinuous and layered vegetation patches of finite width in an open channel. Environ. Fluid Mech. 2019, 19, 1469–1495. [Google Scholar] [CrossRef]
  33. Kumar, M.; Malik, A. 3D simulation of flow around different types of groyne using ANSYS Fluent. Imp. J. Interdiscip. Res. 2016, 2. Available online: https://www.semanticscholar.org/paper/3D-Simulation-of-Flow-around-Different-Types-of-Kumar-Malik/be8645a521701e679e620bd4124f9fa78352f9bf (accessed on 26 June 2024).
  34. Tang, X.; Ding, X.; Chen, Z. Large eddy simulations of three-dimensional flows around a spur dike. Tsinghua Sci. Technol. 2006, 11, 117–123. [Google Scholar] [CrossRef]
  35. Choi, S.; Oh, D. Finite element modeling of shallow water equations for numerical simulation of flows near spur–dike. Adv. Hydro-Sci. Eng. 2004, 6, 1–9. [Google Scholar]
  36. Mostafa, M.M.; Ahmed, H.S.; Ahmed, A.A.; Abdel-Raheem, G.A.; Ali, N.A. Experimental study of flow characteristics around floodplain single groyne. J. Hydro-Environ. Res. 2019, 22, 1–13. [Google Scholar] [CrossRef]
  37. Giglou, A.N.; Mccorquodale, J.A.; Solari, L. Numerical study on the effect of the spur dikes on sedimentation pattern. Ain Shams Eng. J. 2018, 9, 2057–2066. [Google Scholar] [CrossRef]
  38. Zhang, H.; Nakagawa, H.; Kawaike, K.; Baba, Y. Experiment and simulation of turbulent flow in local scour around a spur dyke. Int. J. Sediment Res. 2009, 24, 33–45. [Google Scholar] [CrossRef]
  39. Shin, J.; Lee, S.; Park, I. Analysis of storage effects in the recirculation zone based on the junction angle of channel confluence. Appl. Sci. 2021, 11, 11607. [Google Scholar] [CrossRef]
  40. Jenkins, S.A.; Inman, D.L.; Richardson, M.D.; Wever, T.F.; Wasyl, J. Scour and burial mechanics of objects in the nearshore. IEEE J. Ocean. Eng. 2007, 32, 78–90. [Google Scholar] [CrossRef]
  41. Cataño-Lopera, Y.A.; Landry, B.J.; Abad, J.D.; García, M.H. Experimental and numerical study of the flow structure around two partially buried objects on a deformed bed. J. Hydraul. Eng. 2013, 139, 269–283. [Google Scholar] [CrossRef]
  42. McCoy, A.; Constantinescu, G.; Weber, L.J. Numerical investigation of flow hydrodynamics in a channel with a series of groynes. J. Hydraul. Eng. 2008, 134, 157–172. [Google Scholar] [CrossRef]
  43. Zhu, H.; Gao, X.; Liu, Y. Experimental study of velocity fluctuations in inlet/outlet under outflow diffusion. J. Hydraul. Eng. 2022, 41, 129–139. [Google Scholar]
  44. Fu, C.J.; Wang, J.G.; Zhao, T.L.; Yi, L. Experimental research on the flow structure in the open channel with bionic grass. China Rural Water Hydropower 2021, 10, 55–65. [Google Scholar]
  45. Yang, L.; Liu, B.; Xu, H.; Zhang, S.; Zhang, H. Experimental study on oscillating pressure characteristics of overtopped cofferdam with monolithic protection slab. J. Hydraul. Eng. 2015, 34, 103–108. [Google Scholar]
  46. Cheng, N.S.; Adrian, W.K.L.; Lin, S.Y. Probability distribution of bed particle instability. Adv. Water. Resour. 2003, 26, 427–433. [Google Scholar] [CrossRef]
  47. El-Raheem, A.; Ali, N.A.; Tominaga, A.; Khodary, S.M. Flow analysis around groyne with different permeability in compound channel floodplains. JES J. Eng. Sci. 2013, 41, 302–320. [Google Scholar]
  48. Yun, B.G.; Yu, T.; Wang, P.Y. Experiment research on energy variation around the permeable spur dike. Sci. Technol. Eng. 2021, 21, 3783–3789. [Google Scholar]
  49. Fan, X.J.; He, W.J.; Zhao, W.J.; Yan, C.F. Study on variation law of flow structure of hydraulic flashboard permeable spur dike along with water permeability. Water Res. Hydropower Eng. 2018, 49, 120–126. [Google Scholar]
  50. Fukuoka, S.; Nakagawa, H.; Sumi, T.; Zhang, H. Advances in River Sediment Research, 1st ed.; Taylor & Francis Group: London, UK, 2013. [Google Scholar]
  51. Futian, C.; Wei, F. Experiment at Investigation of Reasonable Spacing among Spur Dikes. J. Hohai Univ. (Nat. Sci.) 1992, 4, 7–14. [Google Scholar]
  52. Karami, H.; Ardeshir, A.; Saneie, M.; Behzadian, K.; Jalilsani, F. Reduction of local scouring with protective spur dike. In Proceedings of the World Environmental and Water Resources Congress 2008: Ahupua’A, Honolulu, HI, USA, 12–16 May 2008; pp. 1–9. [Google Scholar]
  53. Ning, J.; Li, G.D.; Li, S.S. Experimental study on the influence of spur dikes spacing on local scouring. In Proceedings of the 2018 International Conference on Energy Development and Environmental Protection (EDEP 2018), Nanjing, China, 17–19 August 2018; pp. 298–303. [Google Scholar]
  54. Tajnesaie, M.; Jafari Nodoushan, E.; Barati, R.; Azhdary Moghadam, M. Performance comparison of four turbulence models for modeling of secondary flow cells in simple trapezoidal channels. ISH J. Hydraul. Eng. 2020, 26, 187–197. [Google Scholar] [CrossRef]
  55. Gildeh, H.K. Numerical Modeling of Thermal/Saline Discharges in Coastal Waters. Master’s Thesis, University of Ottawa, Ottawa, ON, Canada, 2013. [Google Scholar]
  56. Versteeg, H.K.; Malalasekera, W. An Introduction to Computational Fuid Dynamics, 1st ed.; Longman Science & Technical: Harlow, UK, 1995. [Google Scholar]
  57. Shih, T.H.; Zhu, J.; Lumley, J.L. A new Reynolds stress algebraic equation model. Comput. Methods Appl. Mech. Eng. 1995, 125, 287–302. [Google Scholar] [CrossRef]
  58. Zhou, Y.J.; Qian, S.; Sun, N.N. Application of permeable spur dike in mountain river training. Appl. Mech. Mater. 2014, 641, 236–240. [Google Scholar] [CrossRef]
  59. Jeon, J.; Lee, J.Y.; Kang, S. Experimental investigation of three-dimensional flow structure and turbulent flow mechanisms around a nonsubmerged spur dike with a low length-to-depth ratio. Water Res. Res. 2018, 54, 3530–3556. [Google Scholar] [CrossRef]
  60. Meinders, E.R.; Hanjalic, K.; Martinuzzi, R.J. Experimental study of the local convection heat transfer from a wall-mounted cube in turbulent channel flow. J. Heat Transf. 1999, 121, 564–573. [Google Scholar] [CrossRef]
  61. Yakhot, A.; Liu, H.; Nikitin, N. Turbulent flow around a wall-mounted cube: A direct numerical simulation. Int. J. Heat Fluid Flow 2006, 27, 994–1009. [Google Scholar] [CrossRef]
  62. Higham, J.E.; Brevis, W.; Keylock, C.J.; Safarzadeh, A. Using modal decompositions to explain the sudden expansion of the mixing layer in the wake of a groyne in a shallow flow. Adv. Water Res. 2017, 107, 451–459. [Google Scholar] [CrossRef]
  63. Paik, J.; Sotiropoulos, F. Coherent structure dynamics upstream of a long rectangular block at the side of a large aspect ratio channel. Phys. Fluids 2005, 17, 115104. [Google Scholar] [CrossRef]
  64. Devenport, W.J.; Simpson, R.L. Time-depeiident and time-averaged turbulence structure near the nose of a wing-body junction. J. Fluid Mech. 1990, 210, 23–55. [Google Scholar] [CrossRef]
  65. Paik, J.; Escauriaza, C.; Sotiropoulos, F. Coherent structure dynamics in turbulent flows past in-stream structures: Some insights gained via numerical simulation. J. Hydraul. Eng. 2010, 136, 981–993. [Google Scholar] [CrossRef]
Figure 1. U-curve slope flume.
Water 16 02247 g001
Figure 2. High-speed particle image velocimetry (PIV).
Water 16 02247 g002
Figure 3. Model of permeable spur dike.
Water 16 02247 g003
Figure 4. Boundary Conditions Setup.
Water 16 02247 g004
Figure 5. Computational Domain.
Water 16 02247 g005
Figure 6. Location plan of measurement points and lines.
Water 16 02247 g006
Figure 7. Correlation analysis between the experimental and numerical simulation values of the average flow velocity in the three turbulence models.
Water 16 02247 g007
Figure 8. (ae) Variation of average flow velocity along the longitudinal direction.
Water 16 02247 g008
Figure 9. (ae) Variation of mean flow velocity along the transverse time.
Water 16 02247 g009
Figure 10. Longitudinal time-averaged velocity field at different bathymetric planes.
Water 16 02247 g010
Figure 11. Transverse time-averaged velocity field at different water depth planes.
Water 16 02247 g011
Figure 12. (ae) Probability density of longitudinal mean flow velocity at different bathymetric planes.
Water 16 02247 g012
Figure 13. (ae) Probability density of average flow velocity transversely at different water depth planes.
Water 16 02247 g013
Figure 14. Turbulent kinetic energy contours of different water depth planes in the reflux zone.
Water 16 02247 g014
Figure 15. Turbulent energy dispersion rate diagram of different water depth planes in the reflux area.
Water 16 02247 g015
Figure 16. (ae) Probability density of turbulent kinetic energy at different water depth planes in the reflux zone.
Water 16 02247 g016
Figure 17. (ae) Probability density of turbulent energy dispersion rate at different water depth planes in the reflux zone.
Water 16 02247 g017
Figure 18. Time-averaged streamlines at different water depth planes in the 45°, 90°, and 180° curve return areas.
Water 16 02247 g018
Table 1. Physical and numerical simulation experiment parameters.
Model ParametersCase 1Case 2Case 3Case 4
Tailgate   water   depth , H ( m ) 0.12
The   width   of   the   sink , B ( m ) 0.8
Thickness   of   the   spur   dike , t ( m ) 0.02
Length   of   spur   dike , l ( m ) 0.15
The ratio of the width of the sink to the water depth of the tailgate, B / H 6.67
The ratio of the length of the spur dike to the water depth of the tailgate, l / H 1.25
The ratio of the length of the spur dike to the width of the tank, l / B 0.19
Flow rate, Q ( m 3 / s ) 0.05
Average   flow   rate ,   U 0 ( m / s ) 0.52
Froude   number ,   F r = U 0 / g h 0.48
Temperature ,   ( ° C ) 24
Kinematic   viscosity ,   ν ( m 2 / s )0.9 × 10⁻⁶
Reynolds   number ,   R e = U 0 H / ν 6.9 × 10⁴
Radius   of   a   curve ,   ( m ) 8422
Center angle of the curve, (°)4590180180
Curvature of a curve0.1250.250.50.5
Research methodsNumerical simulationNumerical simulationNumerical simulationPhysical experiment
Note: Variables ν and g denote the dynamic viscosity and gravitational acceleration of water, respectively.
Table 2. Skewness coefficient of probability density of mean flow velocity in both longitudinal and transverse directions.
Curvatureh (m)Skewness Coefficient
longitudinalHorizontal
0.1250.020.7020170.789333
0.250.020.856053−0.38265
0.50.020.850755−1.03391
0.1250.040.6473290.128103
0.250.040.790334−0.55784
0.50.040.779543−0.96054
0.1250.060.7174720.993362
0.250.060.710017−0.27714
0.50.060.756787−0.46314
0.1250.080.6168260.848162
0.250.080.4516691.210951
0.50.080.5086940.714217
0.1250.10.8678491.410127
0.250.10.5901591.873173
0.50.10.5629671.443221
Table 3. Turbulent kinetic energy (k) and turbulent kinetic energy dissipation rate (ε) probability density skew coefficients.
Curvatureh (m)Skewness Coefficient
kε
0.1250.02−0.028140.918754
0.250.020.2468021.242032
0.50.020.7455323.142222
0.1250.040.0379771.395058
0.250.040.1364171.05524
0.50.040.4736282.250936
0.1250.060.1788073.530223
0.250.060.050451.569564
0.50.060.2906311.553615
0.1250.080.2824873.151887
0.250.080.0556162.293563
0.50.080.2087761.047833
0.1250.10.3530972.812622
0.250.10.1143050.962738
0.50.10.1546311.290174
Disclaimer/Publisher’s Note: The statements, opinions and data contained in all publications are solely those of the individual author(s) and contributor(s) and not of MDPI and/or the editor(s). MDPI and/or the editor(s) disclaim responsibility for any injury to people or property resulting from any ideas, methods, instructions or products referred to in the content.