
Impact of Spur Dike Placement on Flow Dynamics in Curved River Channels: A CFD Study on Pick Angle and River-Width-Narrowing Rate


Abstract
1. Introduction
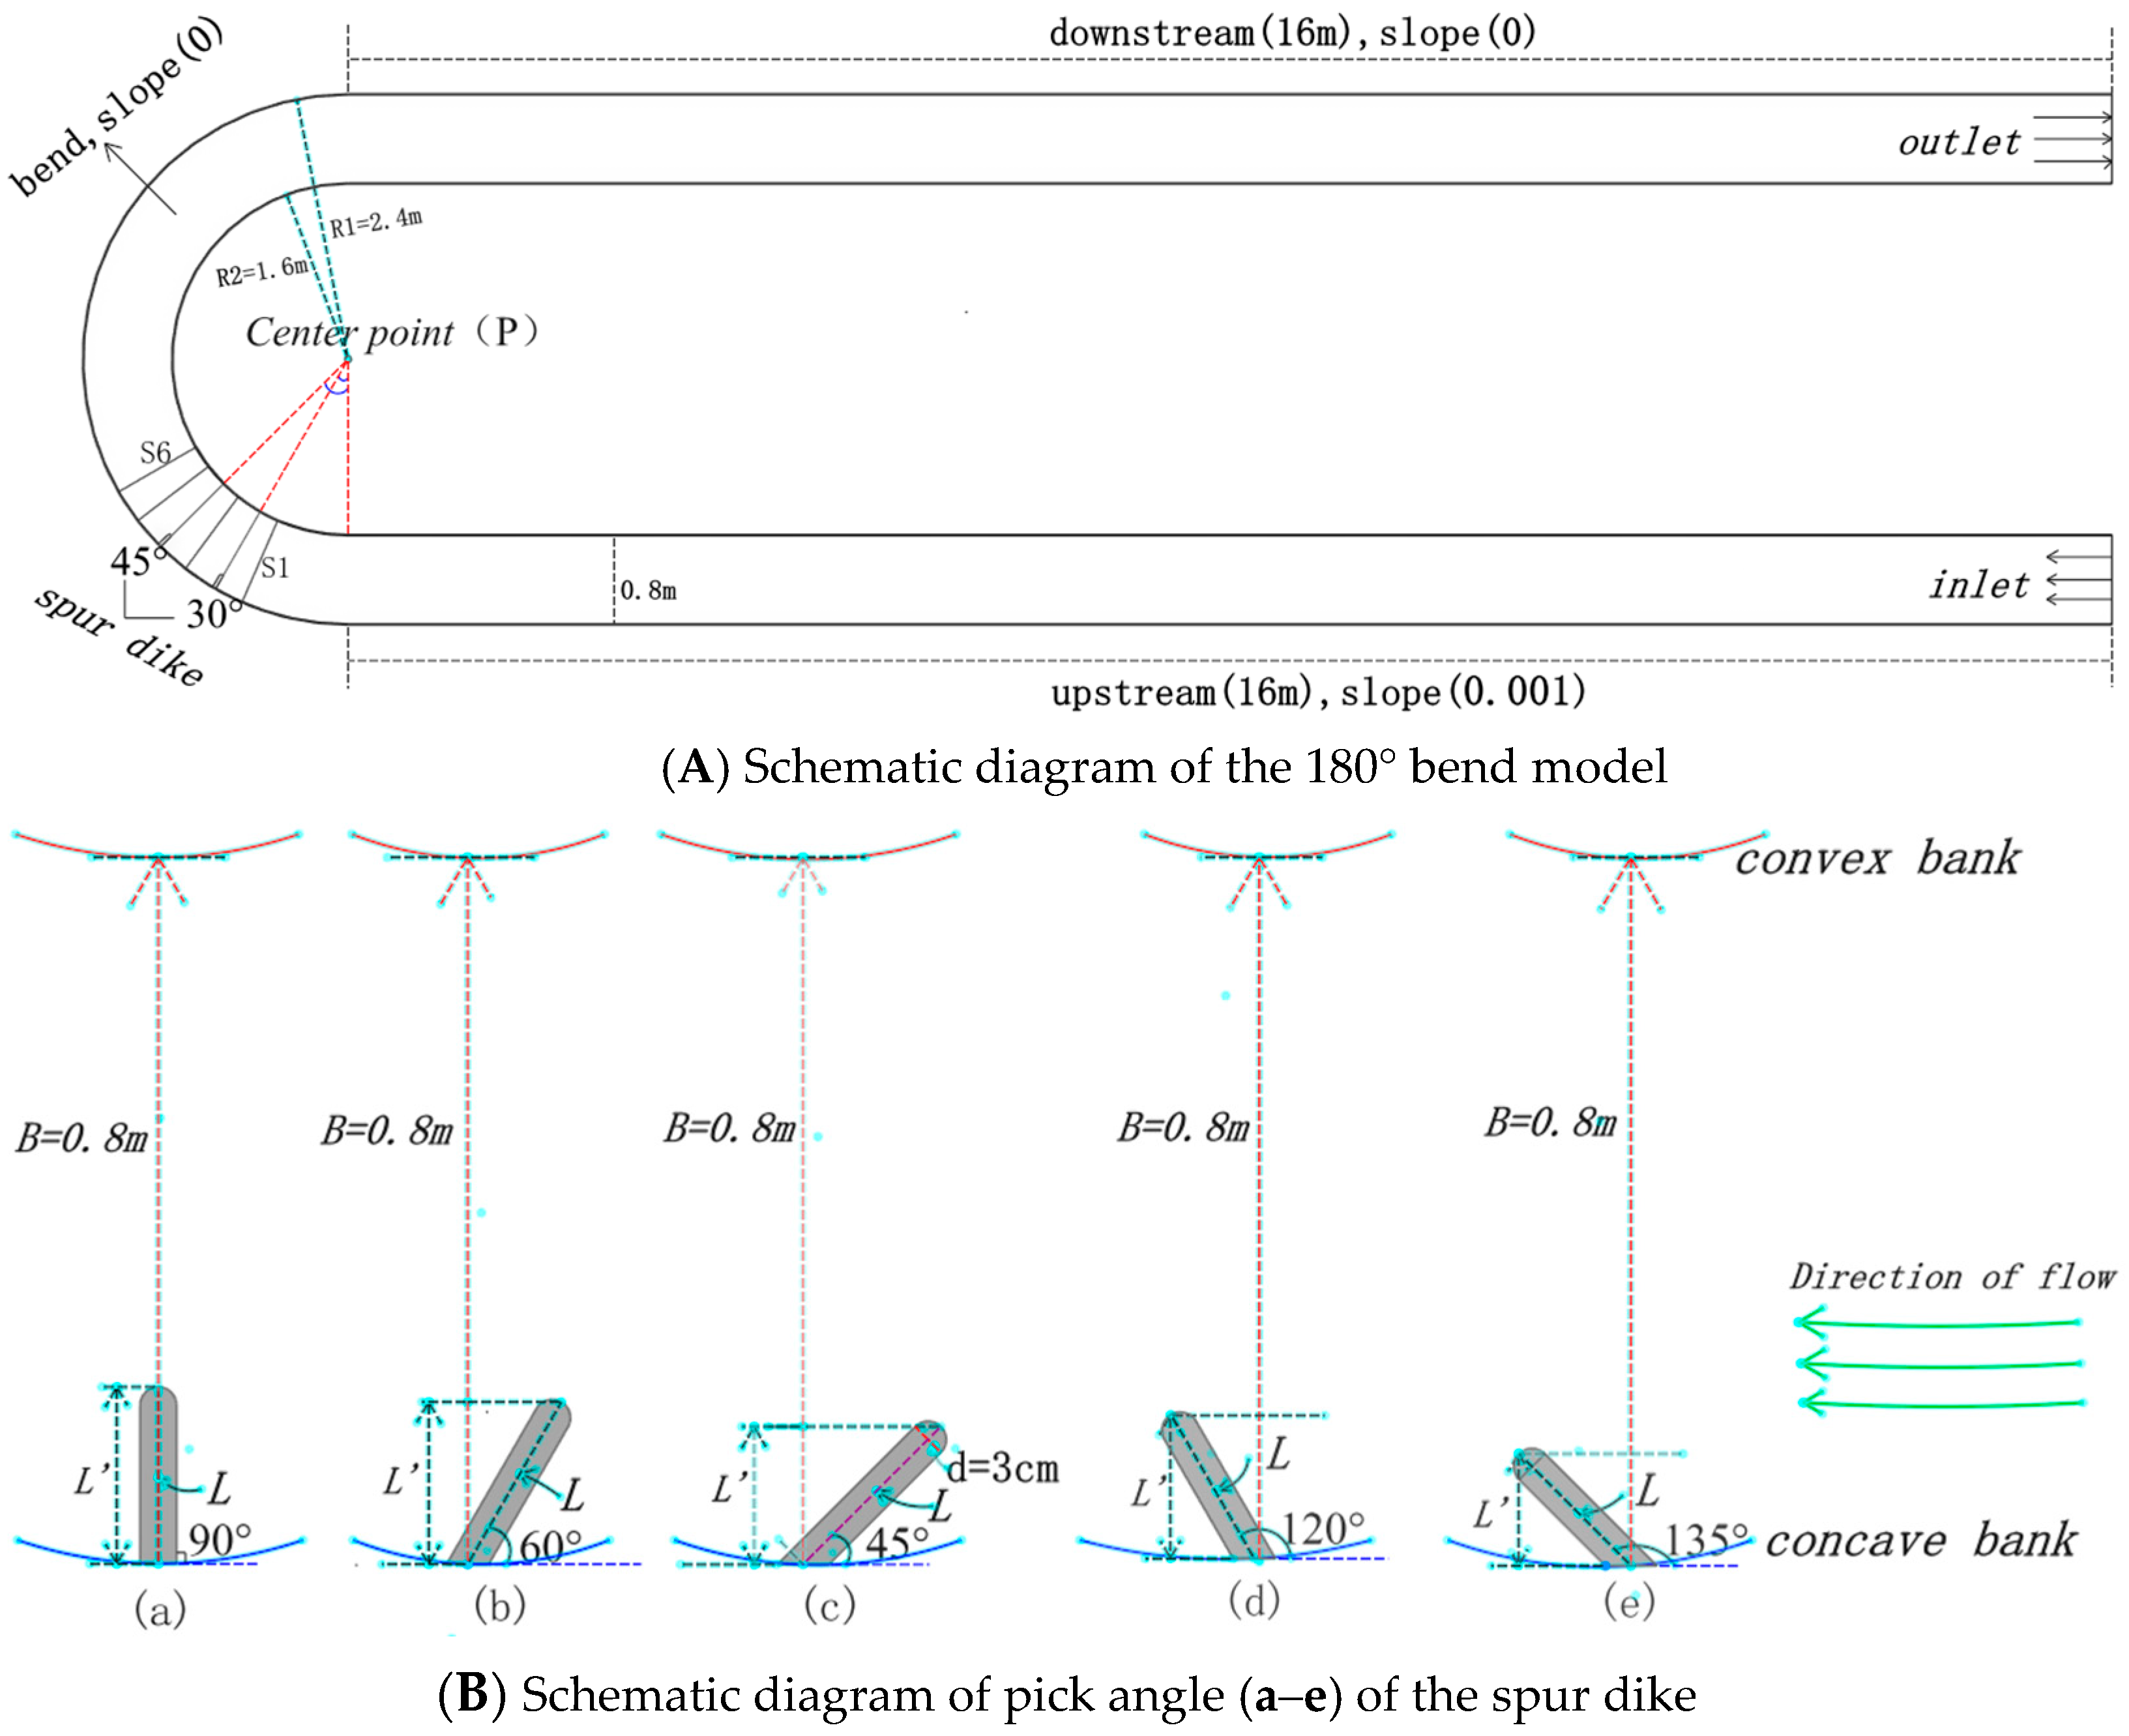
2. Numerical Model
2.1. Water Flow Control Equations
2.2. Turbulence Model
2.3. Initial and Boundary Conditions
3. Condition Design and Model Validation
3.1. Condition Design
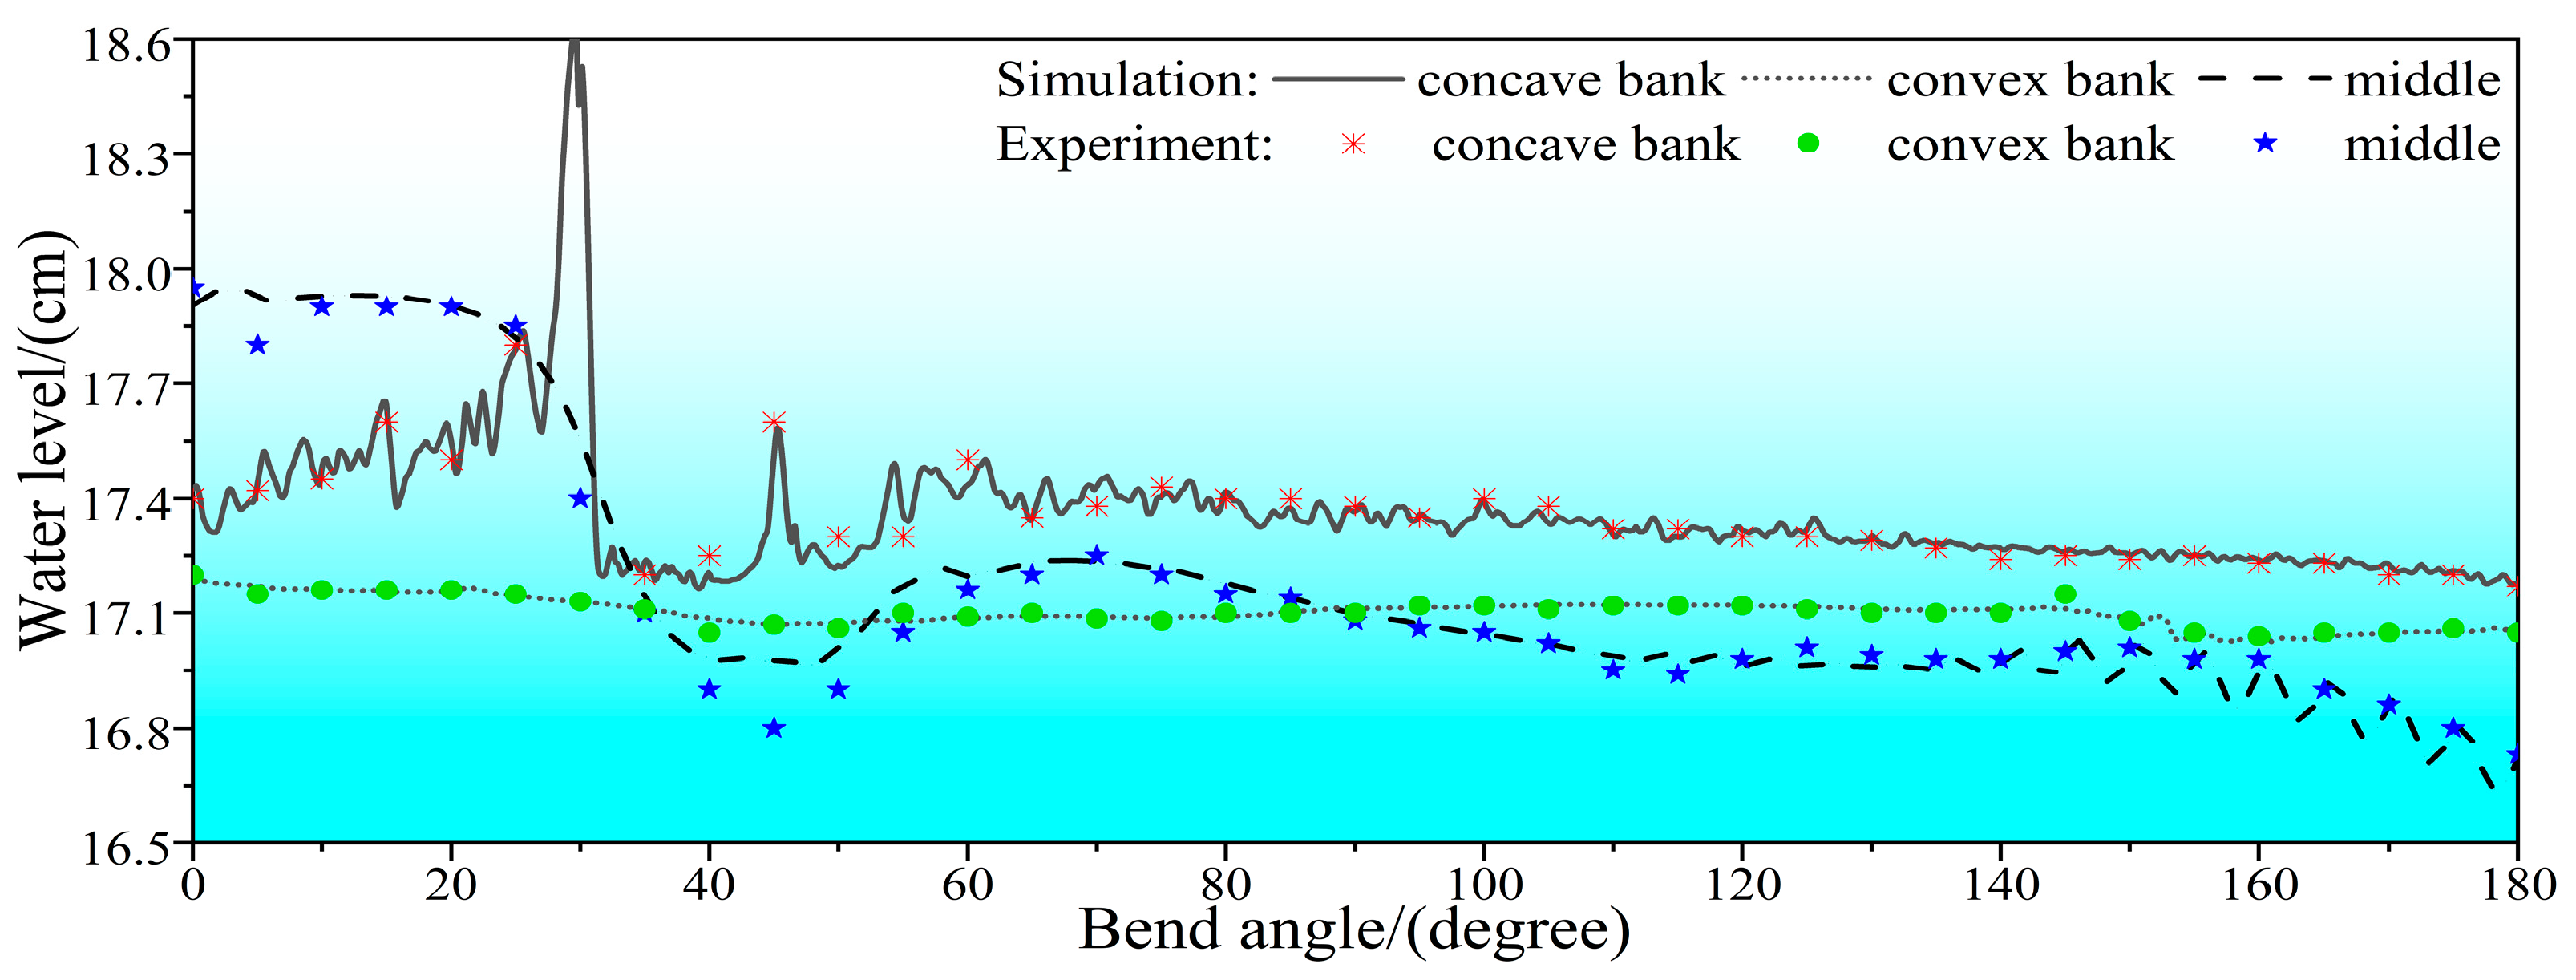
3.2. Model Validation
4. Results
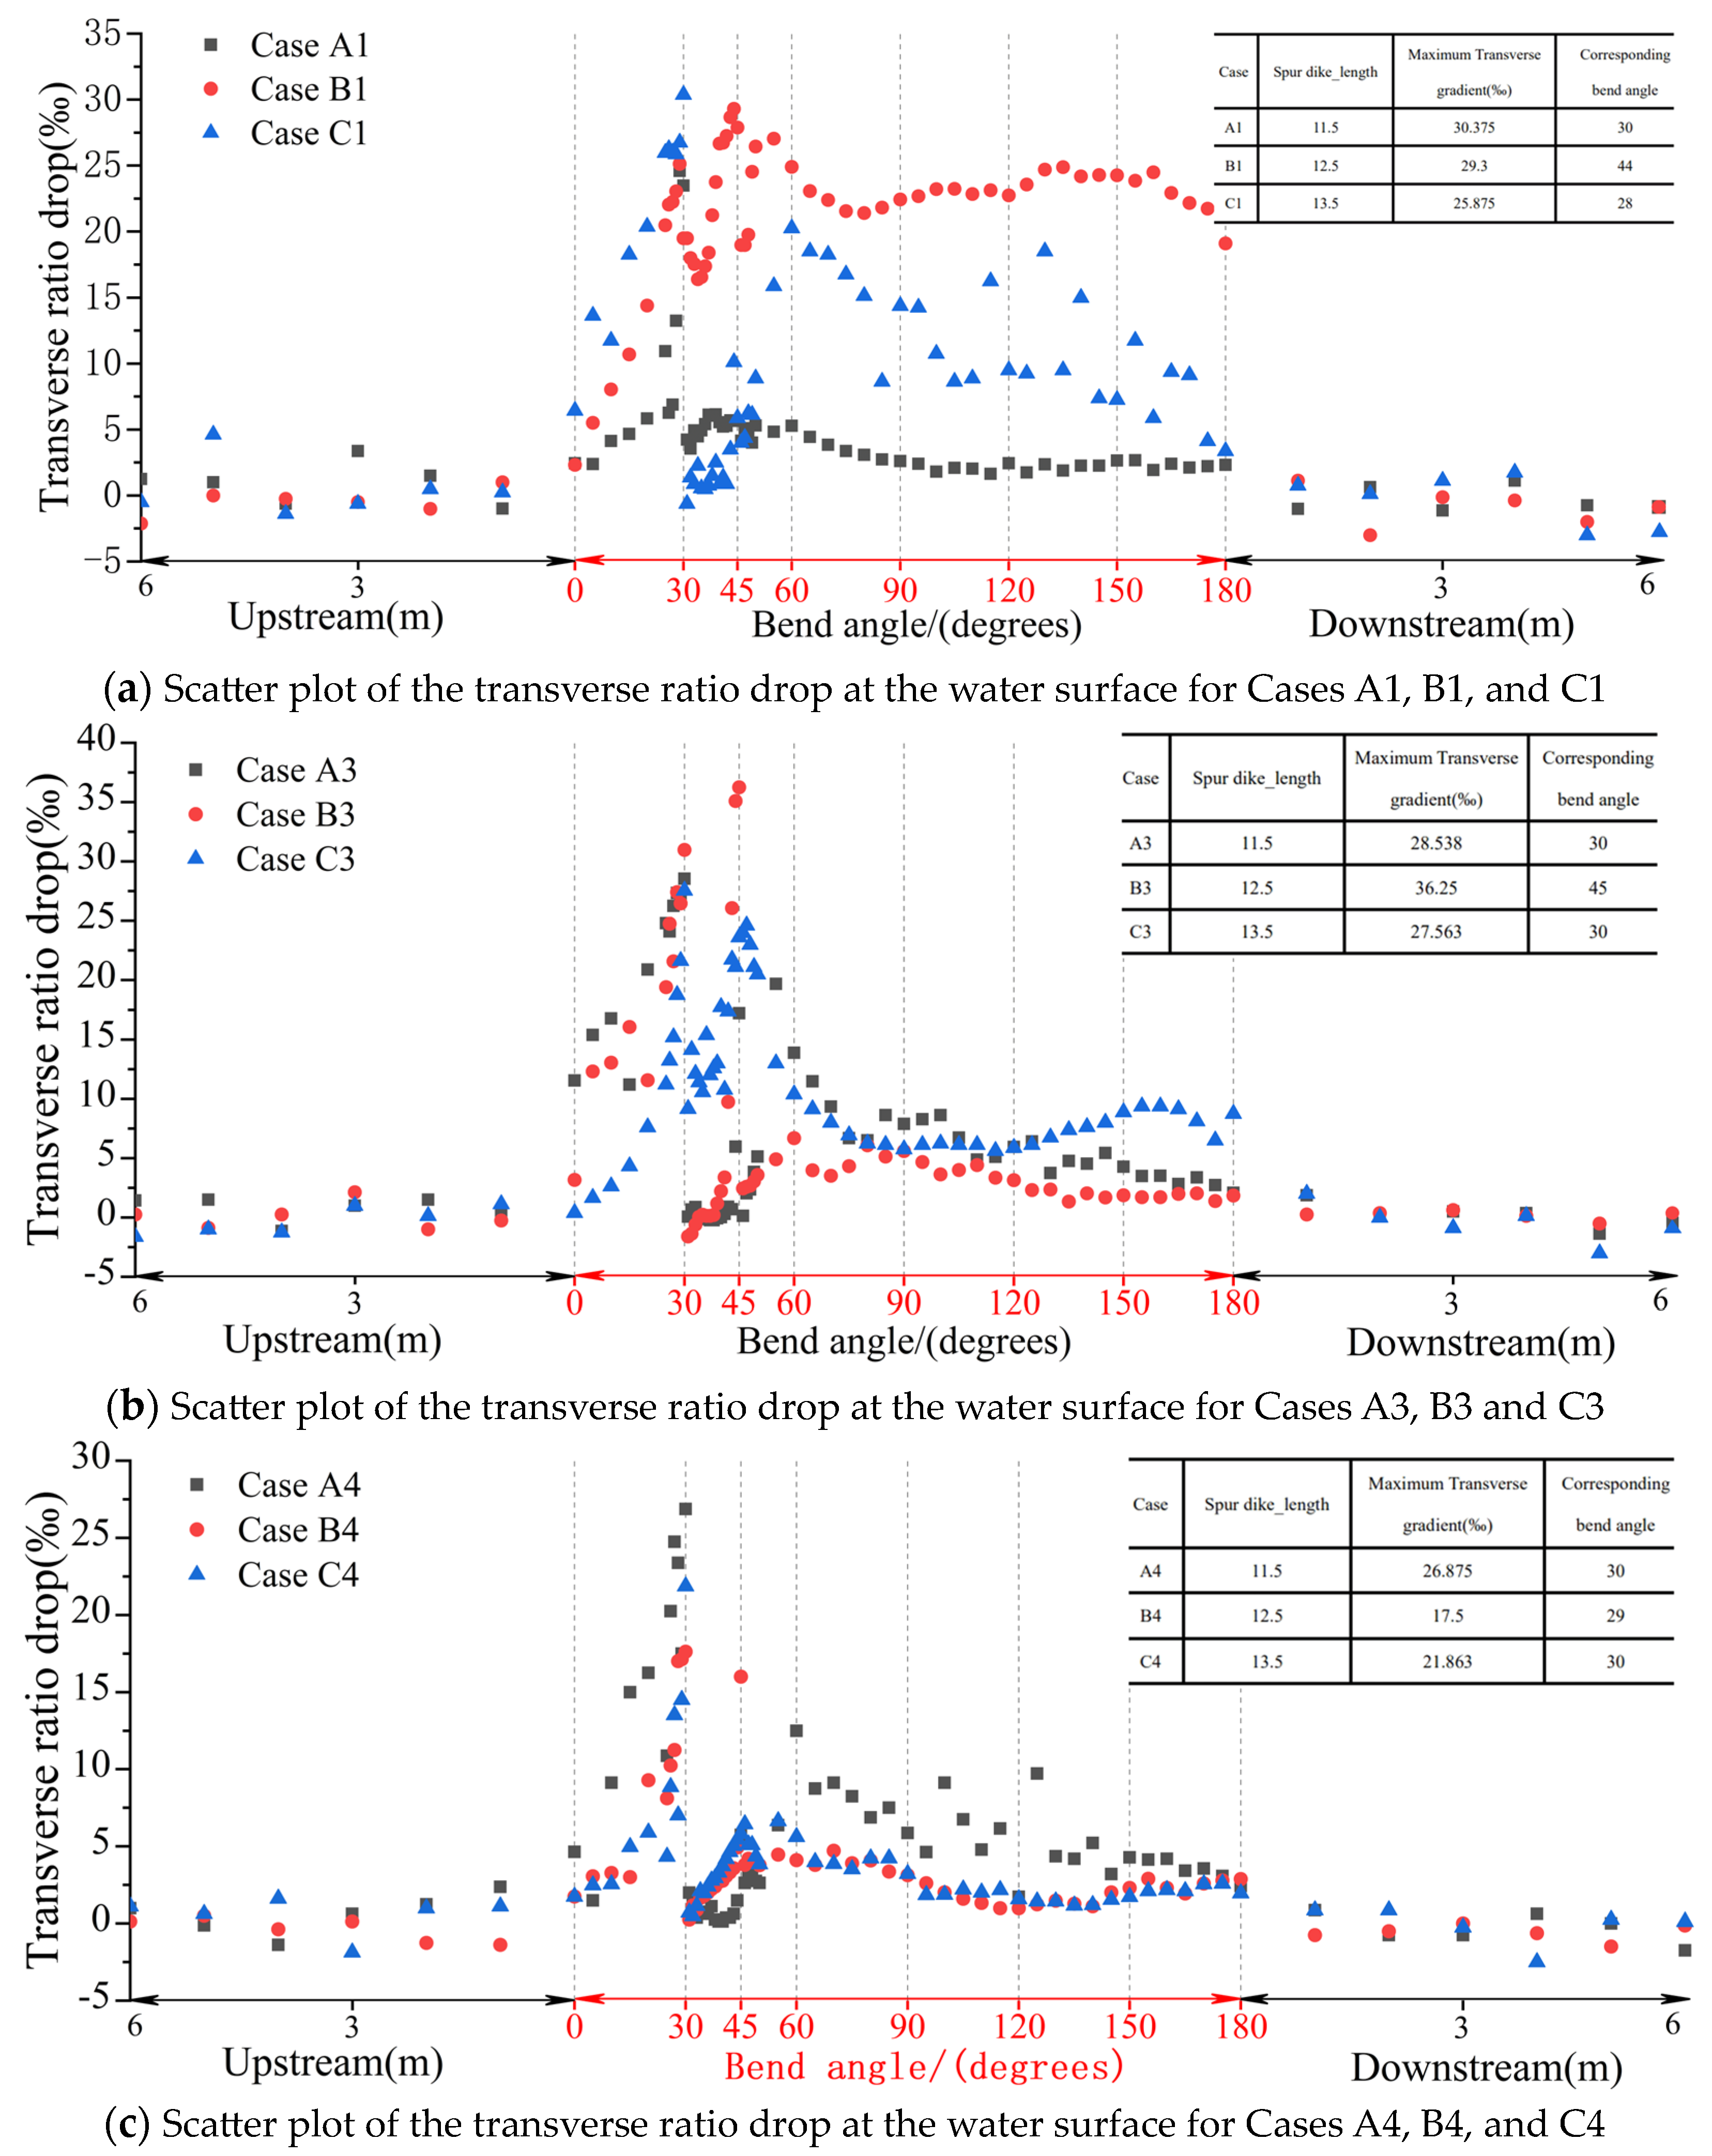
4.1. Transverse Ratio Drop of the Water Surface
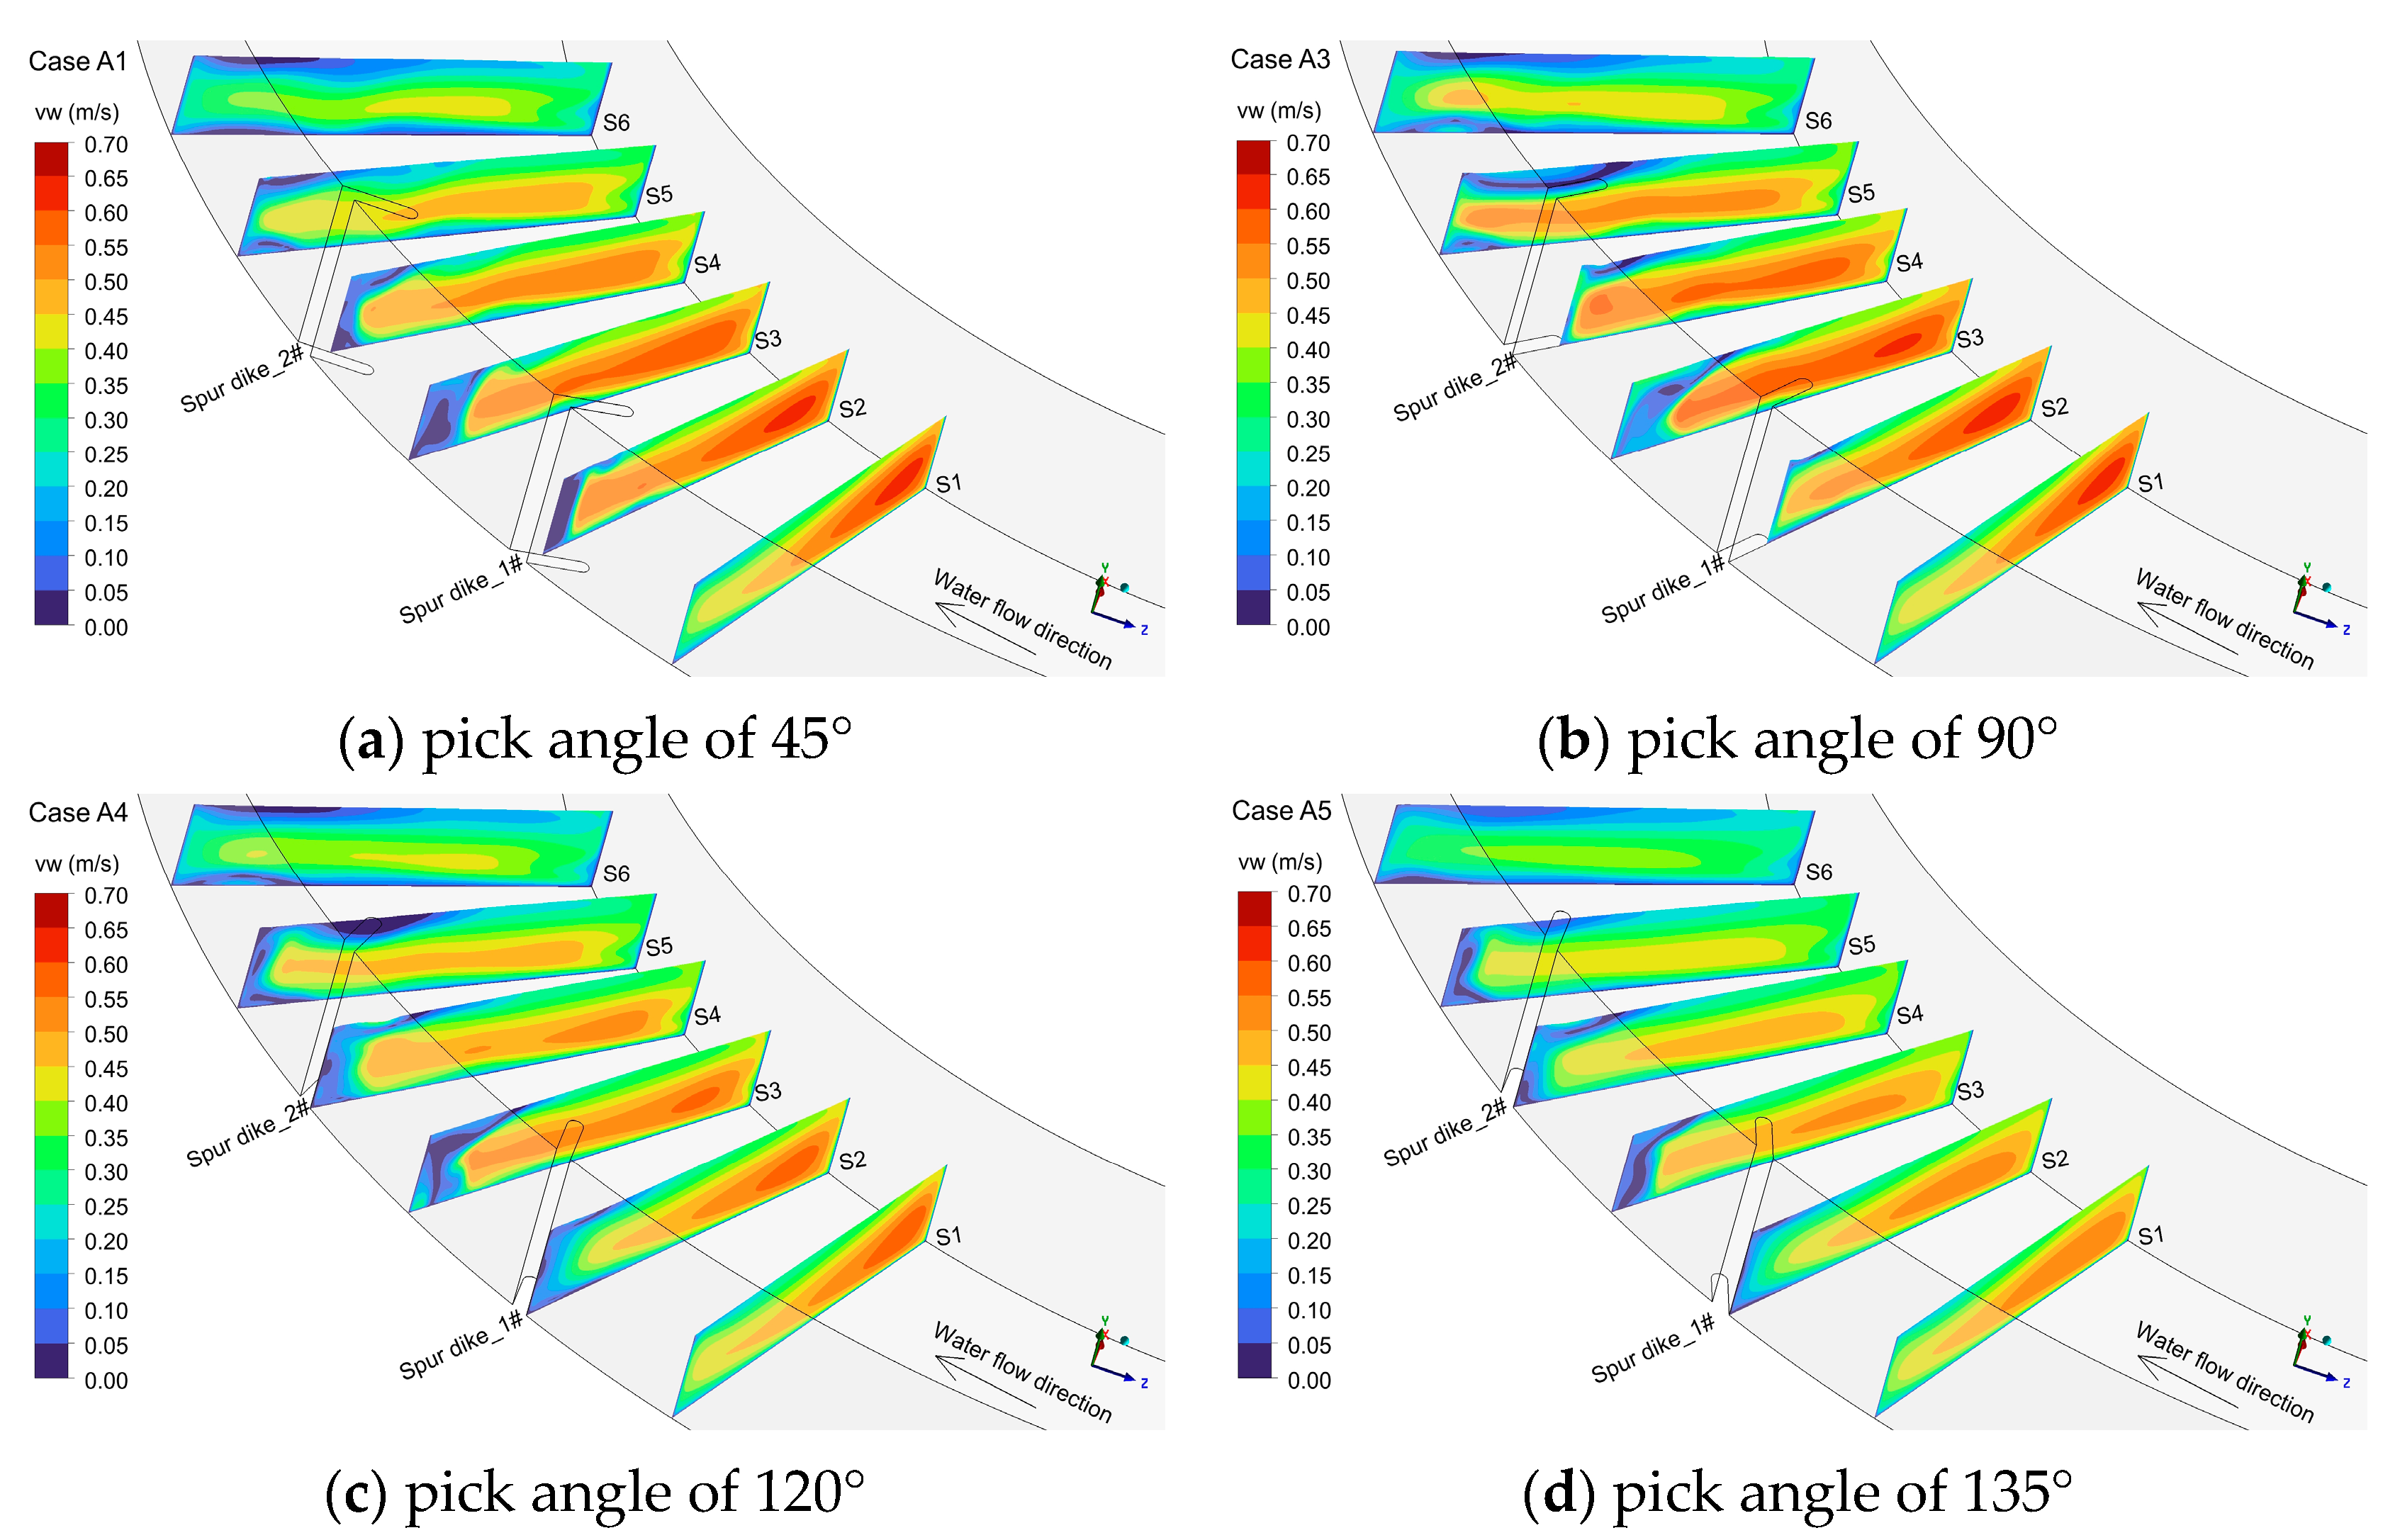
4.2. Cross-Sectional Flow-Velocity Distribution
4.3. Flow Field of the Plane
- (1)
- Congestion occurs in front of the primary spur dike, and flow velocity gradually decreases along the spur dike from the head to the root. When the pick angle is upward or positive, a smaller vortex is created at the root of the spur dike. The magnitude of the vortex is greater for the upward pick angle than for the positive pick angle. When the pick angle is downward, water flows along the side wall of the spur dike without forming a vortex. This results in minimal head loss and reduces erosion on the spur dike.
- (2)
- As water flows around the head of the primary spur dike, the over-water cross-section shrinks, causing an increase in flow velocity and the formation of a bypass flow near the head of the spur dike. Due to inertia, the cross section continues to contract, the flow behind the spur dike begins to separate, part of the flow between the two spur dikes forms backflow, and the flow velocity decreases to less than 0.15 m/s. The scale and central position of the vortex are determined by the length and pick angle of the spur dike. For a constant length of the spur dike, the position of the vortex centre moves upwards with the increasing pick angle. The vortex scale is the largest with a positive pick, followed by the upward pick, and it is the smallest with a downward pick.
- (3)
- When the pick angle of the spur dike is upward, a large-scale vortex and a small-scale vortex are formed between the two spur dikes. When the pick angle of the spur dike is positive, a large-scale vortex is formed between the two spur dikes. Nevertheless, the upward pick angle induces a larger vortex scale. When the pick angle of the spur dike is downward, a smaller vortex is formed between the two spur dikes. The lateral width and length of the vortex are significantly smaller than the vortex scale when the pick angle of the spur dike is upward or positive.
- (4)
- Likewise, vortices of varying scales form behind the secondary spur dike. In terms of the size of the vortex scale, the pick angles can be ranked as positive > upward > downward.
- (5)
- Under a constant pick angle, the vortex formed near the concave bank increases slightly with the effective length of the spur dike. Both the length and the pick angle of the spur dike have different effects on the flow structure of the bends. In particular, the dominant factor influencing the flow is the pick angle, followed by the length.
4.4. Turbulent Kinetic Energy Distribution
5. Discussion
6. Conclusions
- (1)
- The pick angle of the spur dike significantly influenced the directionality of mainstream flow and the distribution of water levels. When the pick angle is 90°, the obstruction to flow reached its maximum intensity, resulting in the most pronounced difference in water levels near the front and rear of the spur dike.
- (2)
- The pick angle of the spur dike has a predominant effect on water flow, with the length of the spur dike being secondary. The size of the vortex in the reflux zone is the largest at a positive pick angle, smaller at an upward angle, and the smallest at a downward angle. For a particular pick angle, the vortex size increases with the narrowing rate of the river width.
- (3)
- When the narrowing rate of the river width is the same, at an upward or positive pick angle of the spur dike, the area of influence is larger and the maximum value of turbulent kinetic energy appears behind the spur dike of the second stage. When the pick angle of the spur dike is downward, the area of influence of turbulent kinetic energy is small, and the overall flow of water is relatively smooth. The maximum value of turbulent kinetic energy shows a trend of increase and subsequent decrease along with the increase of the pick angle.
- (4)
- In river-training projects, the selection of pick angles for spur dikes significantly influences both flow structure and riverbed scour. It is essential to consider the scouring effects produced by high-flow velocity zones and strong eddy formations adjacent to the spur dikes. Future research will investigate the impacts of multiple spur dike groups and staggered spur dikes on flow structure and riverbed scouring in bends, building upon the findings presented in this study.
Author Contributions
Funding
Data Availability Statement
Conflicts of Interest
References
- Hou, H.M.; Deng, K.W.; Yang, Z.H. Study on Flow Characteristics of Trapezoidal Bend Based on numerical simulation of turbulence model. Water Resour. Power 2022, 40, 124–127. [Google Scholar]
- Pan, Y.W.; Liu, X.; Yang, K.J. Flow Characteristics in a Meandering Channel under Backwater Condition Caused by Overflow Dam. J. Chang. River Sci. Res. 2023, 40, 84–91. [Google Scholar]
- Wang, F.; Animasaun, I.L.; Al Shamsi, D.M.; Muhammad, T.; Ali, A. Transient cold-front-water through y-shaped aluminium ducts: Nature of turbulence, non-equilibrium thermodynamics, and velocity at the converged and diverged outlets. J. Non-Equilib. Thermodyn. 2024. [Google Scholar] [CrossRef]
- Nan, J.; Zhang, S.; Yuan, F.; Yang, X.; Wang, C.; Qiu, Z. Naturalization of biological habitat in river based on arrangement of gravel groups. Adv. Water Sci. 2021, 32, 609–617. [Google Scholar]
- Chang, L.; Wang, H.; Zhang, F.; Shi, H.; Zheng, J.; Deng, Y. Influence mechanism of local hydrodynamic characteristics of trapezoidal hollow spur dike on benthos habitat succession. Water Resour. Prot. 2023, 39, 216–224. [Google Scholar]
- Chang, L.; Xu, B.; Zhang, P.; Tang, W. The influence of spur dikes for deep-water channel regulation on fish habitat. J. Hydraul. Eng. 2019, 50, 1086–1094. [Google Scholar]
- Zhang, Y. Research and application on near nature river restoration: A review. Environ. Conserv. J. 2023, 5, 65–71. [Google Scholar]
- Luo, C.W.; Liu, R.; Chen, Y.; Liu, Z.A.; Chen, J.Y.; Yang, B.Q.; Dong, J.H.; Tan, C. Research on the Failure Mode of Dam Foundation under the Influence of Dense Gently Inclined Weak Interlayer. China Rural Water Hydropower 2023, 10, 240–247. [Google Scholar]
- Zhang, L.H.; Zhang, L.X.; Cheng, S.Z. Stability Analysis of Gravity Dam on Soil Foundation. Appl. Mech. Mater. 2014, 501, 79–82. [Google Scholar] [CrossRef]
- Majid, F.; Masoud, G.; Seyed Ali Akbar Salehi, N. Scour and flow field around a spur dike in a 90° bend. Int. J. Sediment Res. 2008, 23, 56–68. [Google Scholar]
- Ghodsian, M.; Vaghefi, M. Experimental study on scour and flow field in a scour hole around a T-shape spur dike in a 90° bend. Int. J. Sediment Res. 2009, 24, 145–158. [Google Scholar] [CrossRef]
- Koken, M.; Gogus, M. Effect of spur dike length on the horseshoe vortex system and the bed shear stress distribution. J. Hydraul. Res. 2015, 53, 196–206. [Google Scholar] [CrossRef]
- Pandey, M.; Ahmad, Z.; Sharma, P.K. Estimation of maximum scour depth near a spur dike. Can. J. Civ. Eng. 2015, 43, 270–278. [Google Scholar] [CrossRef]
- Ning, J.; Li, G.; Ma, M. Numerical simulations of the impacts of river width narrowing ratio on riverbed deformation. J. Hydraul. Eng. 2017, 36, 43–49. [Google Scholar]
- Akbari, M.; Vaghefi, M.; Chiew, Y.M. Effect of T-shaped spur dike length on mean flow characteristics along a 180-degree sharp bend. J. Hydrol. Hydromech. 2021, 69, 98–107. [Google Scholar] [CrossRef]
- Rashedipoor, A.; Masjedi, A.; Shojaenjad, R. Investigation on Scour Hole Around Spur Dike in a 180 Degree Flume Bend. World Appl. Sci. J. 2012, 19, 924–928. [Google Scholar]
- Giglou, A.N.; Mccooquodale, J.A.; Sloari, L. Numerical study on the effect of the spur dikes on sedimentation pattern. Ain Shams Eng. J. 2018, 9, 2057–2066. [Google Scholar] [CrossRef]
- Choufu, L.; Abbasi, S.; Pourshahbaz, H. Investigation of flow, erosion and sedimentation Pattern around Varied Groynes under different hydraulic ang geometric conditions:a numerical study. Water 2019, 11, 235. [Google Scholar] [CrossRef]
- Wei, W.; Chen, X.; Li, Q.; Zhang, Z.; Liu, Y. Numerical simulation of the influence of spur dikes on the hydraulic characteristics of a bend channel. J. Water Resour. Water 2019, 30, 146–152. [Google Scholar]
- Ulu, A.E.; Aydin, M.C.; Önen, F. Energy Dissipation Potentials of Grouped Spur Dikes in an Open Channel. Water Resour. Manag. 2023, 37, 4491–4506. [Google Scholar] [CrossRef]
- Granados, J.M.; Bustamante, C.A.; Toro-Botero, F.M.; Cuervo, A.F.; Nieto-Londoño, C. Wall shear stress in open channel flow using different configurations of groynes. ISH J. Hydraul. Eng. 2023, 29, 138–146. [Google Scholar] [CrossRef]
- Shaheed, R.; Mohammadian, A.; Kheirkhah Gildeh, H. A comparison of standard k–ε and realizable k–ε turbulence models in curved and confluent channels. Environ. Fluid Mech. 2019, 19, 543–568. [Google Scholar] [CrossRef]
- Wang, F.Z.; Animasaun, I.L.; Al-Mdallal, Q.M.; Saranya, S.; Muhammad, T. Dynamics through three-inlets of t-shaped ducts: Significance of inlet velocity on transient air and water experiencing cold fronts subject to turbulence. Int. Commun. Heat Mass Transf. 2023, 148, 107034. [Google Scholar] [CrossRef]
- Gholami, A.; Akbar Akhtari, A.; Minatour, Y.; Bonakdari, H.; Javadi, A.A. Experimental and numerical study on velocity fields and water surface profile in a strongly-curved 90 open channel bend. Eng. Appl. Comput. Fluid Mech. 2014, 8, 447–461. [Google Scholar]
- Niknezhad, F.; Mahmoudi, A.; Vaghefi, M. A study of the effects of a lateral intake’s positions on the flow pattern around a bridge pier in a 180° bend using SSIIM2. Arab. J. Sci. Eng. 2023, 48, 12903–12929. [Google Scholar] [CrossRef]
- Wang, G.; Yang, F.; Wu, K.; Ma, Y.; Peng, C.; Liu, T.; Wang, L.P. Estimation of the dissipation rate of turbulent kinetic energy: A review. Chem. Eng. Sci. 2019, 229, 116113. [Google Scholar] [CrossRef]
- Li, B.H.; Puay, H.T.; Hamidi, M.A.B. Influence of spur dike’s angle on sand bar formation in a rectangular channel. IOP Conf. Ser. Earth Environ. Sci. 2023, 1238, 1. [Google Scholar] [CrossRef]
- Ren, J.; Zhuang, T.; Wang, F.; Dai, J.; Wang, J. Hyporheic exchange law driven by spur dikes: Numerical modeling. J. Hydrol. 2023, 618, 129203. [Google Scholar] [CrossRef]
- Tripathi, R.P.; Pandey, K.K. Experimental study of local scour around T-shaped spur dike in a meandering channel. Water Supply 2021, 21, 542–552. [Google Scholar] [CrossRef]
- Fan, X.; Zeng, Q.; Ji, N.; Qian, Z.; Deng, X. Numerical study on flow field and backflow characteristics of double spur dikes. J. Chongqing Jiaotong Univ. Nat. Sci. 2023, 42, 12–21. [Google Scholar]
- Jafari, R.; Sui, J. Velocity field and turbulence structure around spur dikes with different angles of orientation under ice covered flow conditions. Water 2021, 13, 1844. [Google Scholar] [CrossRef]
- Zhang, Y.; Wu, Y.; Cui, P.; Huang, Y.; Zhang, H. Numerical simulation for the effect of spur dike lengths on the hydraulic characteristics of the bend. J. Water Resour. Water Eng. 2019, 30, 164–170. [Google Scholar]
- Zhang, Y.; Wu, Y.; Cui, P.; Huang, Y.; Zhang, H. Numerical simulation of the influence of spur dike angle and length on flow characteristics in recirculation zone. J. Univ. Shanghai Sci. Technol. 2020, 42, 79–87. [Google Scholar]


| Case | Length (cm) | Angle (Degrees) | River Width Narrowing Rate | Q |
|---|---|---|---|---|
| A1 | 11.5 | 45° | 0.10163 | |
| A2 | 60° | 0.12449 | ||
| A3 | 90° | 0.14375 | 64 | |
| A4 | 120° | 0.12449 | ||
| A5 | 135° | 0.10163 | ||
| B1 | 12.5 | 45° | 0.11047 | |
| B2 | 60° | 0.13231 | ||
| B3 | 90° | 0.15625 | 64 | |
| B4 | 120° | 0.13231 | ||
| B5 | 135° | 0.11047 | ||
| C1 | 13.5 | 45° | 0.11931 | |
| C2 | 60° | 0.14614 | ||
| C3 | 90° | 0.16875 | 64 | |
| C4 | 120° | 0.14614 | ||
| C5 | 135° | 0.11931 |
Disclaimer/Publisher’s Note: The statements, opinions and data contained in all publications are solely those of the individual author(s) and contributor(s) and not of MDPI and/or the editor(s). MDPI and/or the editor(s) disclaim responsibility for any injury to people or property resulting from any ideas, methods, instructions or products referred to in the content. |
© 2024 by the authors. Licensee MDPI, Basel, Switzerland. This article is an open access article distributed under the terms and conditions of the Creative Commons Attribution (CC BY) license (https://creativecommons.org/licenses/by/4.0/).
Share and Cite
Liu, D.; Lv, S.; Li, C. Impact of Spur Dike Placement on Flow Dynamics in Curved River Channels: A CFD Study on Pick Angle and River-Width-Narrowing Rate. Water 2024, 16, 2236. https://doi.org/10.3390/w16162236
Liu D, Lv S, Li C. Impact of Spur Dike Placement on Flow Dynamics in Curved River Channels: A CFD Study on Pick Angle and River-Width-Narrowing Rate. Water. 2024; 16(16):2236. https://doi.org/10.3390/w16162236
Chicago/Turabian StyleLiu, Dandan, Suiju Lv, and Chunguang Li. 2024. "Impact of Spur Dike Placement on Flow Dynamics in Curved River Channels: A CFD Study on Pick Angle and River-Width-Narrowing Rate" Water 16, no. 16: 2236. https://doi.org/10.3390/w16162236
APA StyleLiu, D., Lv, S., & Li, C. (2024). Impact of Spur Dike Placement on Flow Dynamics in Curved River Channels: A CFD Study on Pick Angle and River-Width-Narrowing Rate. Water, 16(16), 2236. https://doi.org/10.3390/w16162236