3.2. Defining the Objectives for a Solution
The solution involved the creation of an NEM within the WEFN from the perspective of sustainability, Industry 4.0, and the SDGs. More specifically, the following objectives adopted for the creation of the NEM are outlined as follows:
Technological integration—Incorporating Industry 4.0 capabilities to optimize the management of the WEFN. The solution should enable an interaction between the biological, digital and physical dimensions and the nexus, facilitating more efficient and sustainable production processes.
Multidimensional sustainability—Ensure that the model contemplates sustainability criteria in the environmental, economic and social dimensions.
Alignment with the SDGs—Ensure that the model contributes to the achievement of the SDGs. Each aspect of the project should be evaluated for its ability to address specifically the SDGs, serving as a tool for the implementation of policies and projects aligned with these global goals.
Practicality and usability—Develop a tool that is not only theoretically robust, but also practical and easy to use by managers and decision-makers. The NEM should offer clear and intuitive interfaces for project evaluation, with easily interpretable indicators and metrics.
Adaptability and scalability—Ensuring that the model is flexible enough to adapt to different projects, deployed or not, and applicable to both small and large initiatives.
3.3. Model Design and Development
This phase involved determining the functionalities of the NEM, its architecture, and its effective creation, based on the knowledge of theories that can be applied in the solution. Based on the assumption of the relevance of sustainability, Industry 4.0, and the SDGs in projects related to the WEFN, the next step was to think about how to structure the logic of the relationship between this body of knowledge and the WEFN in a project evaluation context. A logical structure of the design for the NEM and its development is presented in
Figure 2.
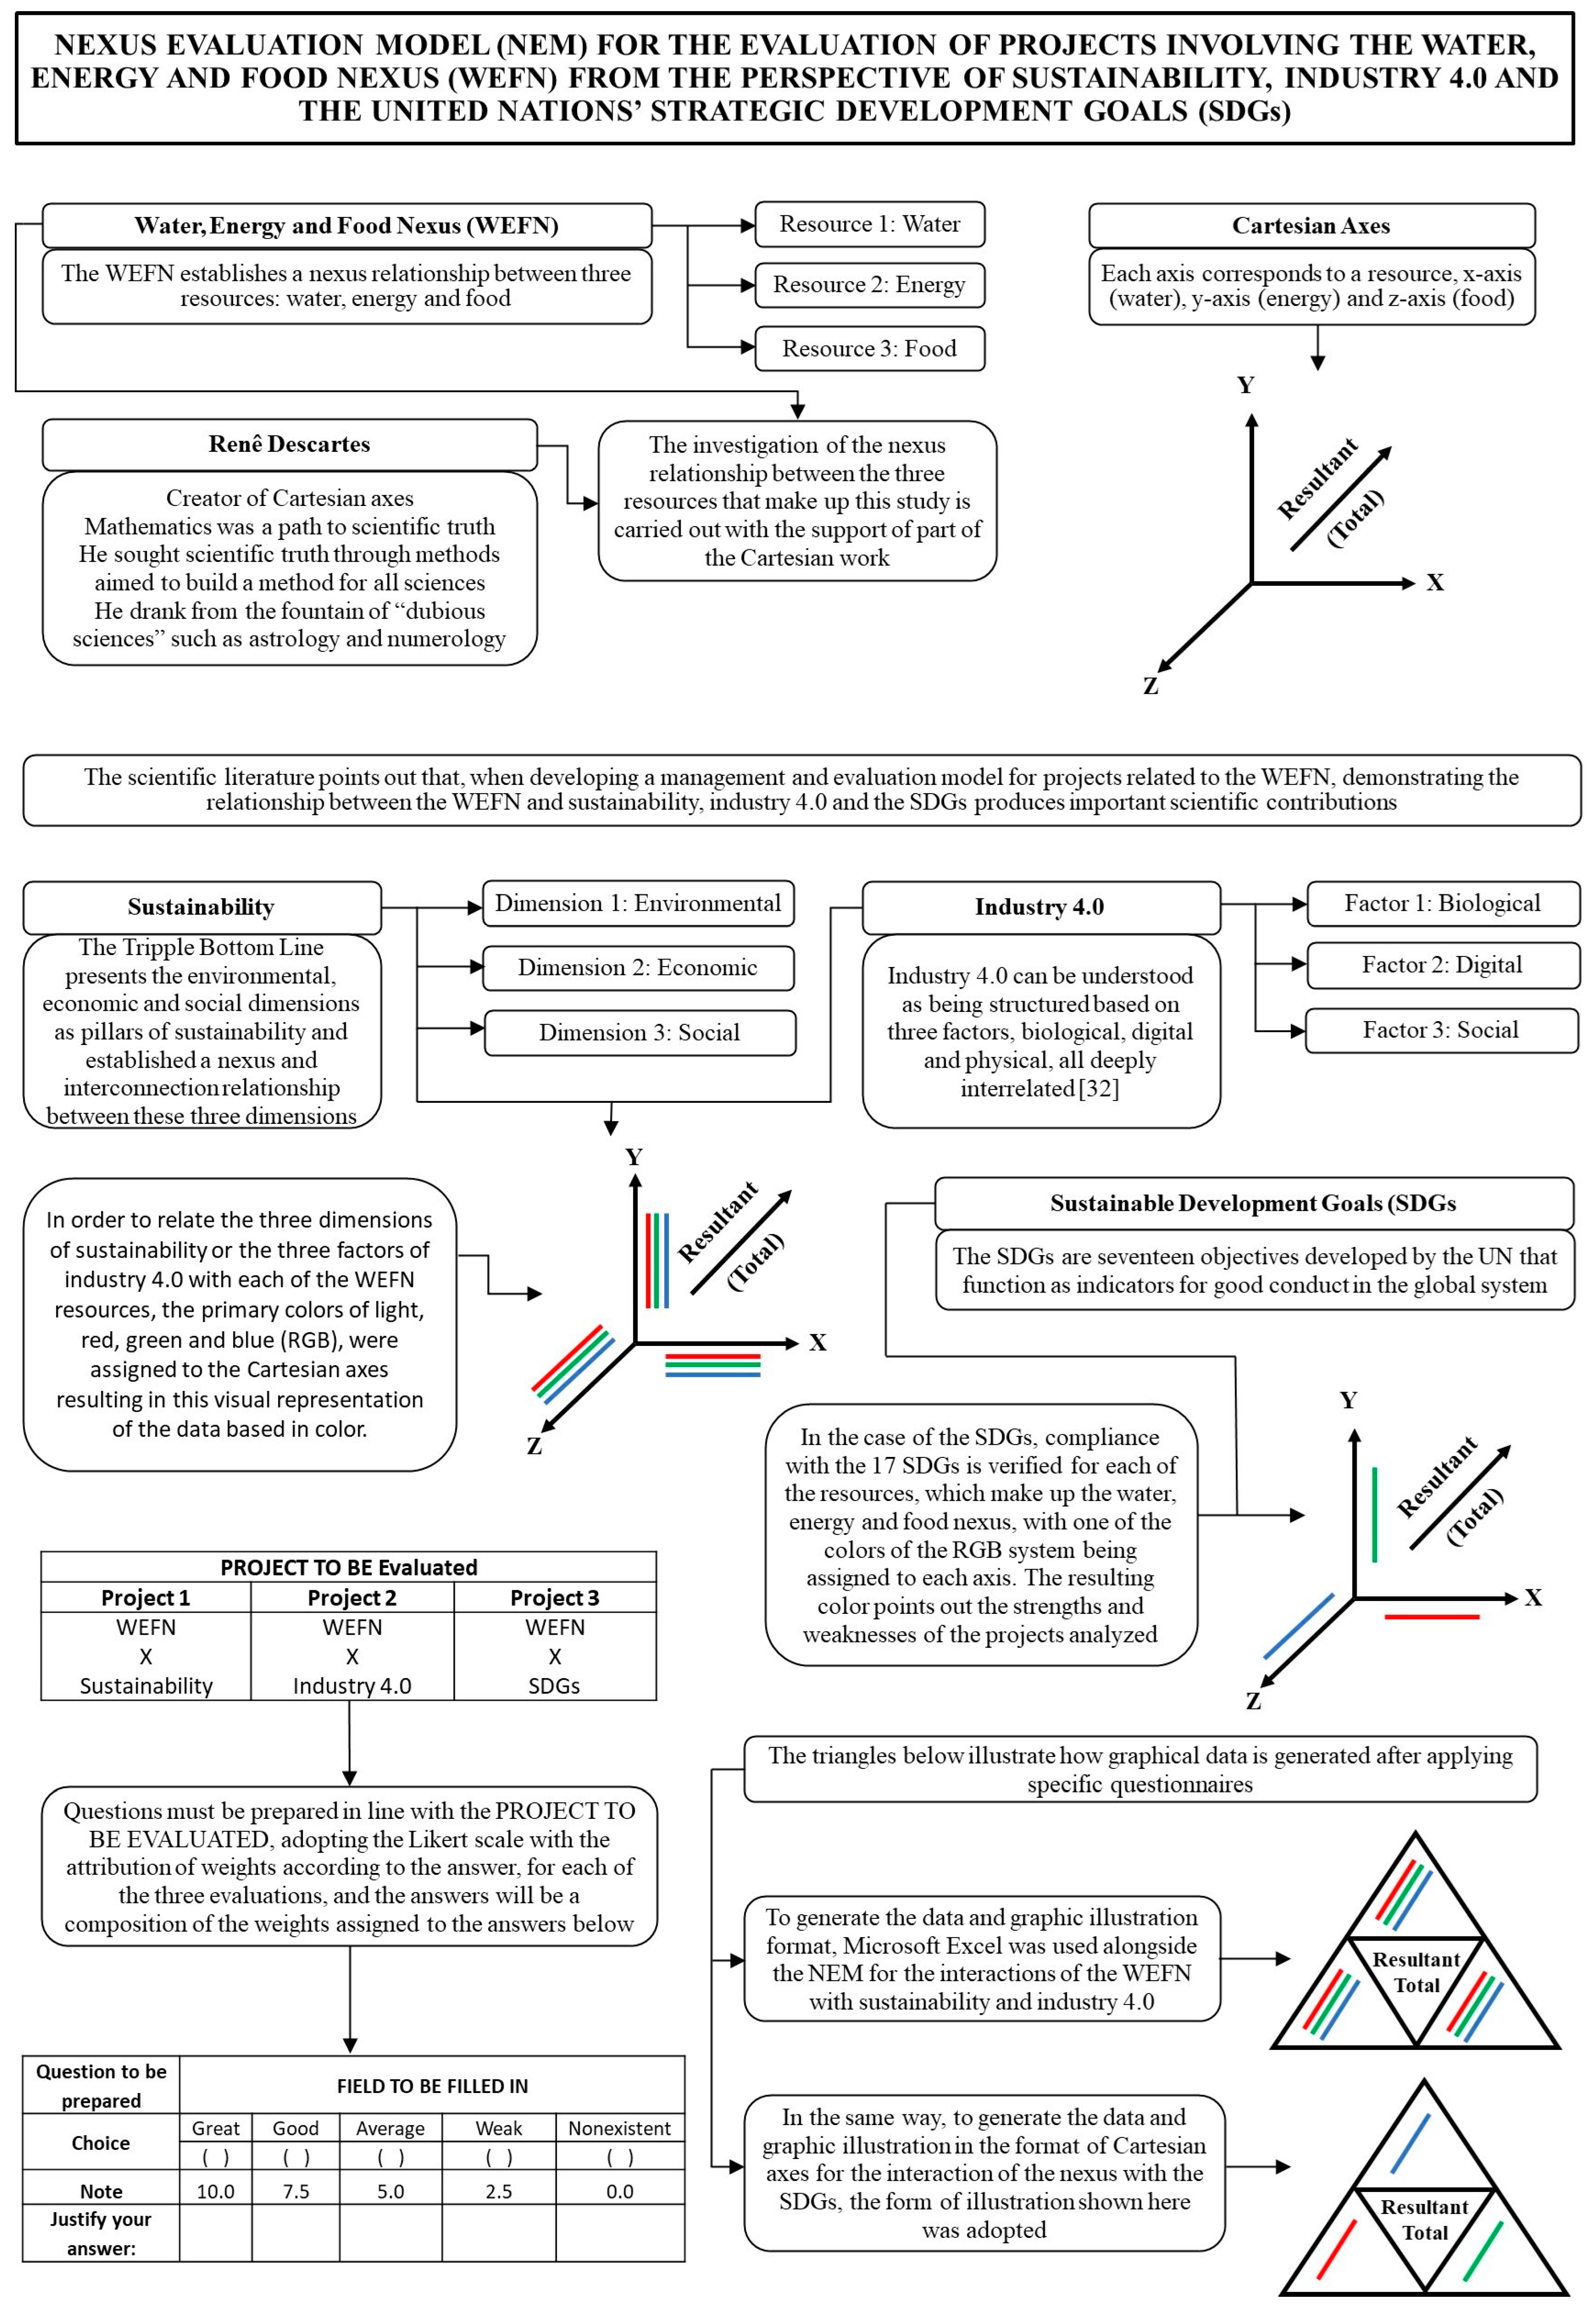
Considering that the WEFN is structured with three resources, sustainability with three dimensions, Industry 4.0 with three factors, and the SDGs with 17 goals, it was necessary to consider carefully the types of visualization that could be used in the NEM to represent its results clearly and concisely. For this purpose, the principles of color theory, along with mathematical and geometric concepts inspired by the Cartesian method of Descartes (2005) [
25], were adopted. This methodology highlights the progression of thought from intuition to deduction, an approach analogous to mathematical reasoning. The NEM presented here applies this logic, performing a detailed analysis of different segments of a project, which facilitates a holistic understanding of the project through the synthesis of information that resembles clear and objective indicators for decision-making.
In addition to the Cartesian axes, the fundamentals of color science were incorporated into the model, adopting an interdisciplinary perspective that explores both physical and physiological aspects [
26]. From a physical point of view, colors are perceived as manifestations of light reflected by objects and not as intrinsic properties of objects. Primary colors (red, yellow, and blue) are fundamental in the formation of the entire visible spectrum through their unique combinations [
26,
33,
34]. In the digital context, the red, green, and blue (RGB) system of colors, as used in electronic devices, operates by the additive synthesis of these colors, resulting in white light when all three are combined equally [
26,
35]. Thus, in computer systems, the RGB colors are used, which, like the primary colors, make up all the other colors.
From a physiological point of view, color is studied through the relationship between vision and the brain [
26,
33]. The theories of Young-Helmholtz and Retinex (1964) [
36,
37,
38], for example, explain how the three types of cones on the retina (red, green, and blue) detect different wavelengths, allowing for accurate color reproduction in devices such as monitors and televisions. This discovery was essential for the development of the RGB system in visual technologies [
26,
36,
37,
38]. In addition, we consider variations in color perception, including conditions such as color blindness, and phenomena such as color illusions, to deepen our understanding of the complexities of color perception [
26,
39,
40].
D’arcy W. Thompson argues that biological forms are controlled more by the laws of physics than by evolution [
41], and the laws of physics, in turn, use mathematical laws as a language to express themselves. The proposed NEM adopts physical laws for the composition of colors and uses mathematics to explain how this same composition can express the result of each resource of the analyzed nexus in the face of the interaction made with sustainability, Industry 4.0, and the SDGs. In addition, the model uses the mathematical and geometric logic of the Cartesian axes, associating them with the features of the WEFN.
Using the Cartesian axes and the RGB color system, the sequence of the WEFN components was combined with the sustainability (environmental, economic, and social) and Industry 4.0 (biological, digital, and physical) components in the model, as well as the 17 SDGs. Thus, the X-axis is associated with water, the Y-axis with energy, and the Z-axis with food.
As sustainability and Industry 4.0 are structured using three components, the three additive primary colors were adopted to represent them. In the case of sustainability, the color Red is associated with the environmental dimension, the color Green with the economic dimension, and the color Blue with the social dimension. The combinations were structured in the sequence of the Cartesian axes X, Y, and Z, and for each axis there is a resultant, as illustrated in
Table 2. It should be noted that the “questions” in each of the axes in
Table 2 correspond to information from the projects that will be evaluated regarding the interaction of the resource that the axis represents with each of the dimensions of sustainability.
Similarly, in the case of Industry 4.0, the color Red is associated with the biological factor, the color Green with the digital factor, and the color Blue with the physical factor, as shown in
Table 3.
In the case of the SDGs, each Cartesian axis of the WEFN was represented by a specific color of the RGB system, varying its intensity from weakest to strongest, according to the information of the project under evaluation in relation to the 17 SDGs. The resulting axis is the composition of these three colors, remembering that it is expected to result in the color white.
Table 4 illustrates the relationship between WEFN and SDGs.
These X, Y, and Z axes of the Cartesian coordinate system can be considered components of a vector possessing intensity and direction as defined by the information from the project being evaluated and generated by the questions in
Table 2,
Table 3 and
Table 4. Structuring how to capture this information in a project was key to the design and development of the NEM. For this purpose, a structured evaluation questionnaire (see
Table 5) comprising both closed and open mixed questions [
42] was incorporated into the model. For each question, an opinion on its theme was requested using a Likert scale and a means to justify the chosen option. This justification aimed to demonstrate the respondent’s understanding of the theme in each answer made and, through this, an understanding of the respondent’s answers was developed. In filling in the questionnaire, the field “justify your answer” opens a range of judgments from readers who may disagree with the arguments made and formulate different opinions knowing the respondent’s beliefs and reasons supporting their response [
25].
The structure of each question is illustrated in
Table 5. The NEM proposes that the completion should be made by specialist(s) in nexus-based projects and the data collected can be obtained by one or more respondents.
The construction of the questions involving WEFN and sustainability and WEFN and Industry 4.0 may vary. The selection criteria for these questions present elements of subjectivity and multiple interpretations to the motivating biases of the selected questions, as well as their answers. In the case of the SDGs, as they are already defined by the United Nations, the possibility of variation between issues is more restricted.
A grade is assigned to the answer given to each question and the final result varies according to the answers obtained for the proposed questions. The measurement of each question is obtained in association with the weighted average that makes up the result of each axis. The composition of the sum of the answers to Questions X01 to X25 (sustainability and Industry 4.0) will define the resulting color of the X axis. Similarly, the composition of Questions Y01 to Y25, and Z01 to Z25, will define the colors of the Y and Z axes, which have their own resultants.
As for the SDGs, the composition of the sum of questions X01 to X17 results in the color red, varying its intensity, according to the answers received. Similarly, for the composition of the Y and Z axes, the composition of Questions Y01 to Y17 results in the color green, and Questions Z01 to Z17 result in the color blue, respectively, with the intensity of their colors varying according to the answers received.
The resultant output from the NEM is a graphical illustration resulting from a representative of the set of answers to the questions about the project being evaluated. This result may be expressed mathematically as an organized table of data or graphically as a vector, by means of the Cartesian axes. However, for the purpose of this study, Microsoft Excel was used to express the result in the form of graphical illustrations, where triangles are used to represent each of the simulated relationships. Each triangle represents a Cartesian axis, and a central triangle represents the resultant vector.
Figure 3a,c present graphically the format of presentation of the results for the evaluations of WEFN and Sustainability and WEFN and Industry 4.0, where it is possible to visualize the results in three axes that have colors determined by the answers to the questions composed from the result of the composition of the RGB color system. In the case of WEFN and SDGs, each axis is represented by a color, as illustrated in
Figure 3b,d.
Figure 3a is equivalent to
Figure 3c, just as
Figure 3b is equivalent to
Figure 3d.
In the case of the RGB system, the intensity of each of the three colors is expressed digitally using a numbered scale from 0 to 255. It is from the combination of these colors that a final resulting color is obtained. The most accurate way to know colors through the RGB system is using the numbered scale from 0 to 255 for each color. The representation of colors may vary according to the medium in which the information is being conveyed, with the technical characteristics of the media, among others, being a factor.
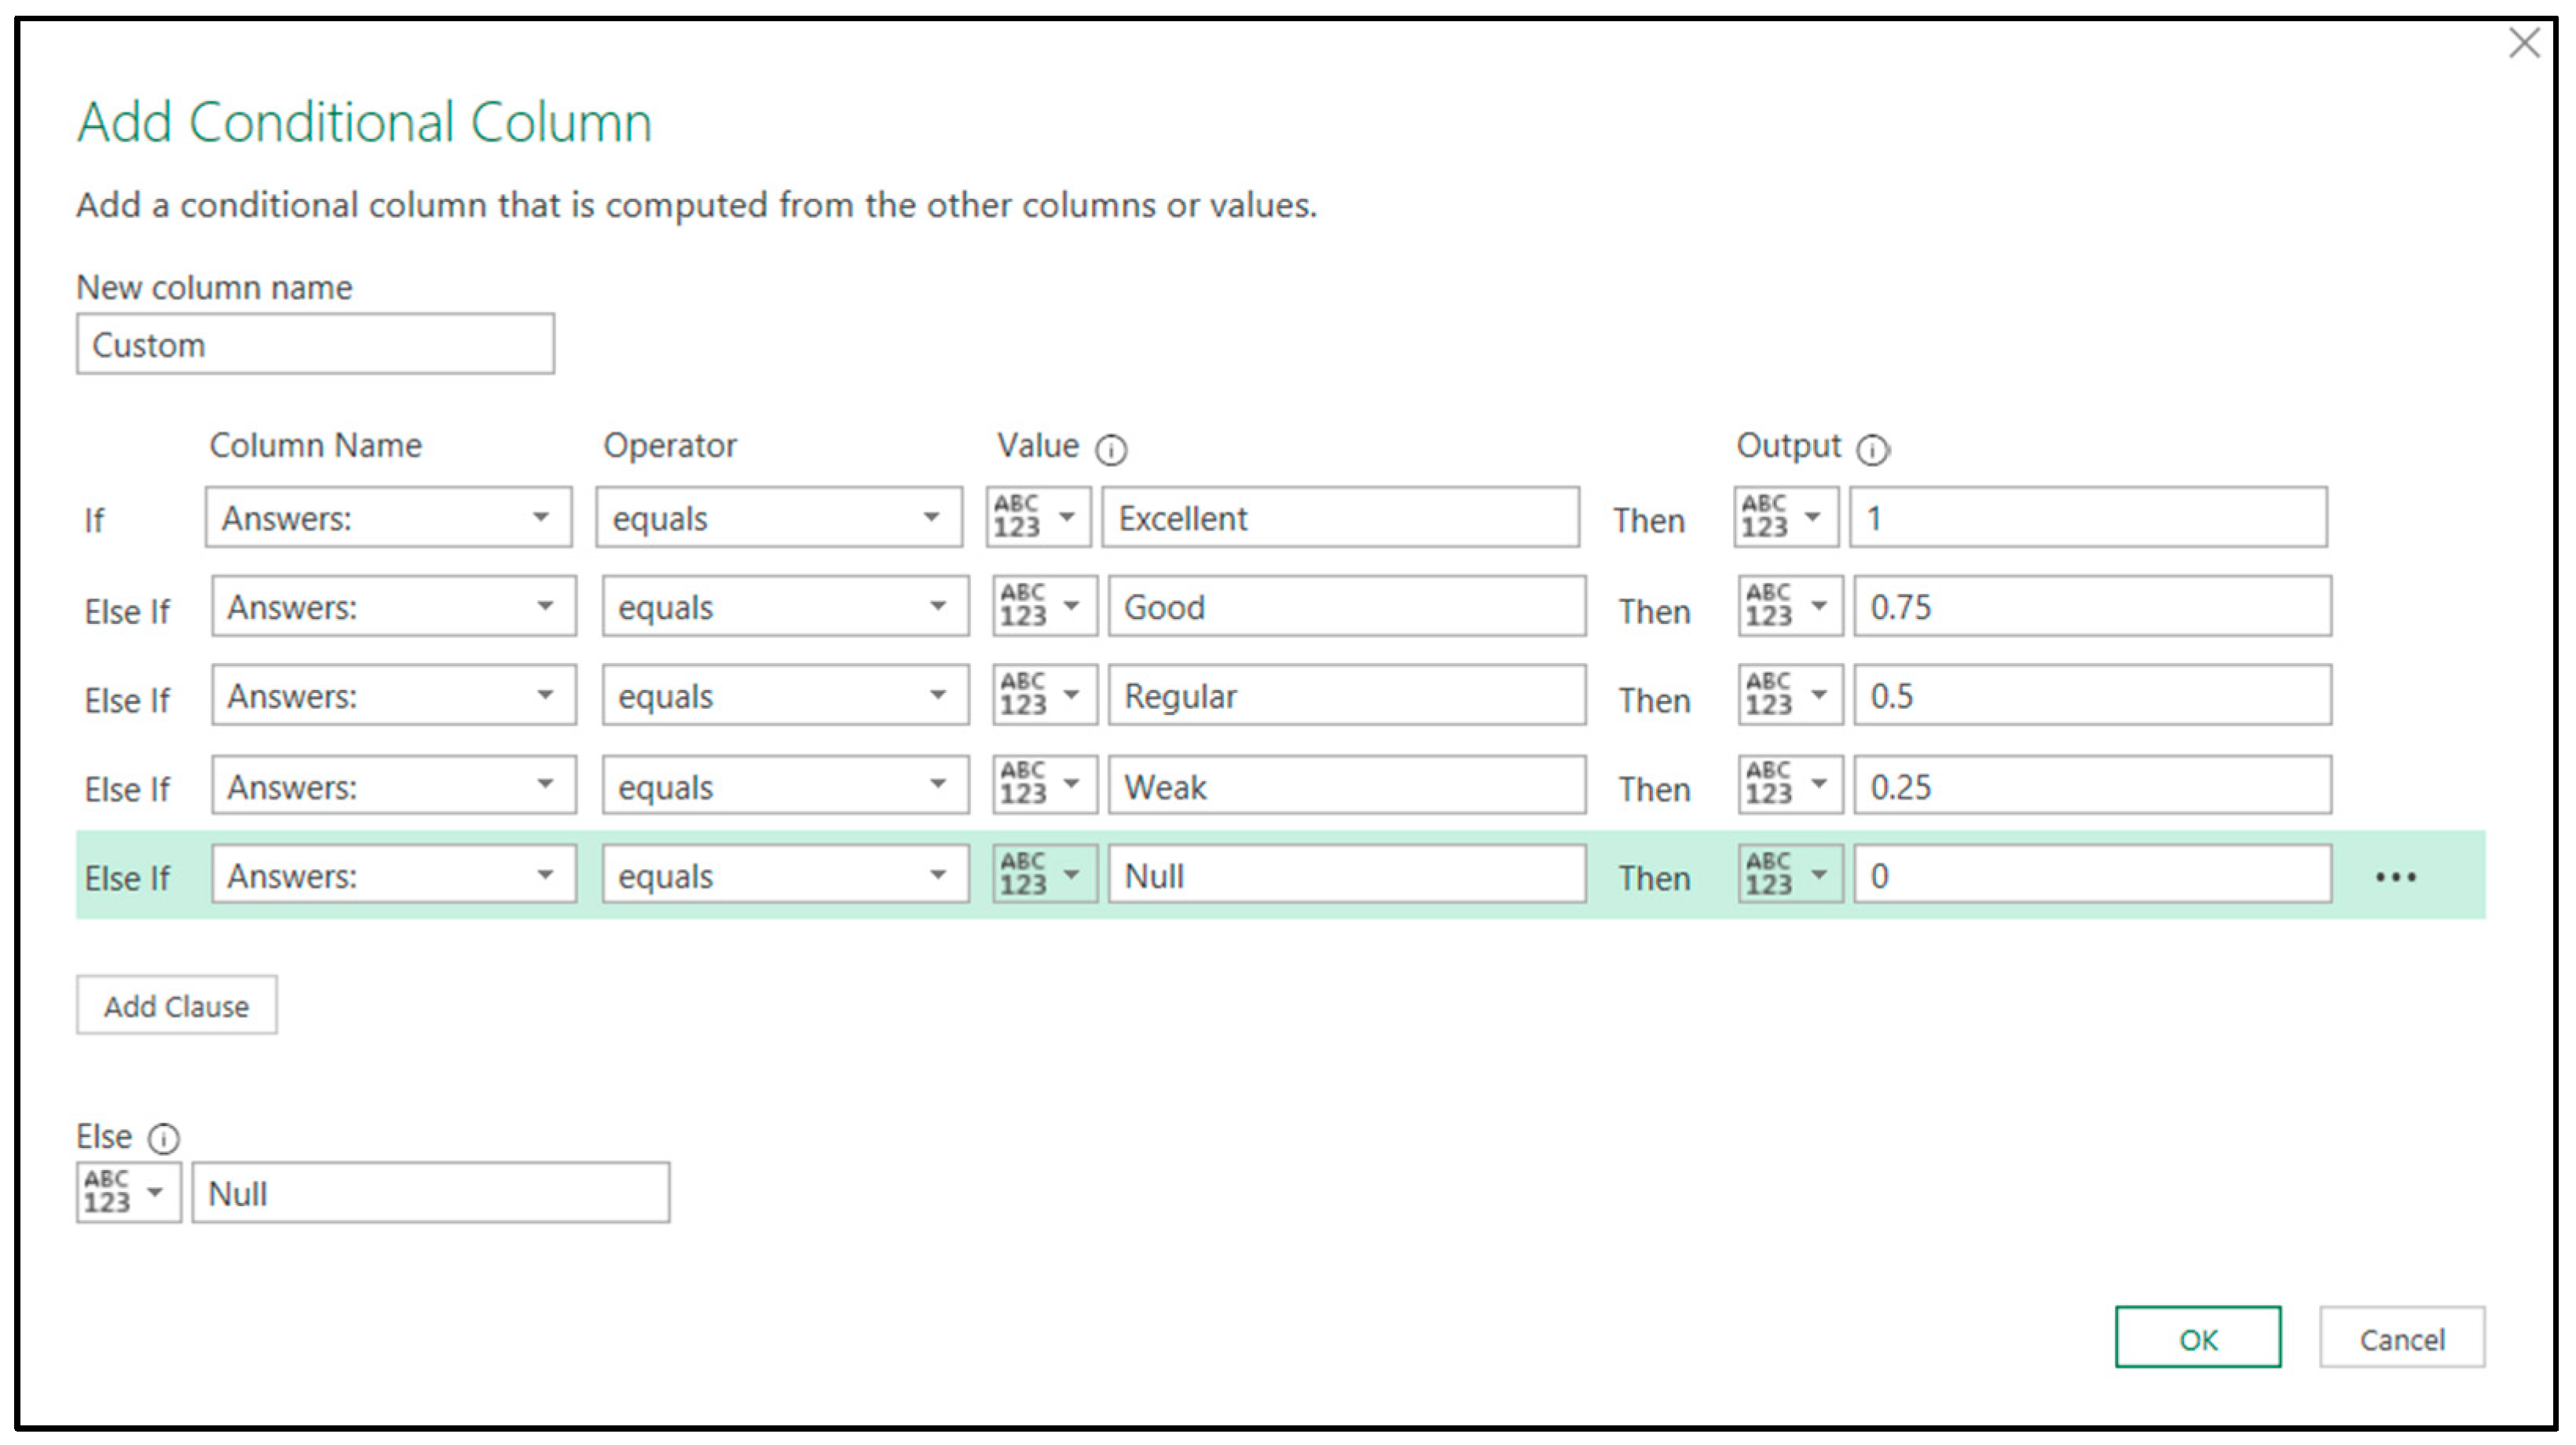
Figure 4 and
Figure 5 illustrate the logic implemented in the NEM when summing the answers to the questions that make up the composition of the final colors. Weights were assigned to the answers of the questionnaire and to the RGB system, as follows: “0” represents “Non-existent/Null” and “black” in the RGB system; “0.25” for a “Weak” response is assigned “64” in the RGB system; “0.5” for an “Average/Regular” response is assigned “128” in the RGB system; “0.75” for a “Good” answer is assigned “191” in the RGB system; and “1.0” for an “Excellent” response is assigned “255” in the RGB system. White represents the perfect balance of the three RGB colors.
For the demonstration of the model, as presented in the following section, a set of questions related to WEFN and Sustainability, WEFN and Industry 4.0, and WEFN and SDG was elaborated and is listed in
Appendix A. For the application of the questionnaire, the questions were implemented in Google Forms and the answers were integrated into an Excel spreadsheet.
3.4. Demonstration of the Model
Once the model had been developed, this phase of the DSR involved demonstrating its use to evaluate one or more WEFN case studies. In this case, the NEM was applied to three different projects, but with all having traces of the WEFN in their conception:
Project 1—Photovoltaic solar plants integrated with beef cattle farms: this project proposed a business model between the energy and agricultural sectors, through the installation of photovoltaic solar plants on beef cattle farms. The photovoltaic roofs capture rainwater to mix with the cattle manure underneath, where the resulting mixture is conducted to a bio-digester.
Project 2—Efficient House: refers to a single-family housing project designed within the scope of the National Program for the Conservation of Electric Energy. Inaugurated in March 2006, in its conception it sought to be a showcase of concepts and technologies so that researchers, professionals in the field of civil construction, and the community in general could adopt in their projects the concepts that best suited their needs. Having won several national and international awards, this project is now a reference in the sector.
Project 3—Biogas project: aimed to generate electricity from pig manure in the city of Itapiranga, located in the extreme west of Santa Catarina in the Uruguay River basin, and bordering Rio Grande do Sul (RS) and Argentina. On the one hand, Itapiranga and Santa Catarina stand out economically for their pig breeding; on the other hand, it is as a result of this production that animal waste has polluted the Uruguay River basin. This is the largest biogas R&D project in Brazil when considering the number of bio-digestion solutions investigated and associated with the size of the project, and because it contains a gas pipeline system having a length of more than eleven kilometers and an associated supervisory system.
The instruments developed for project data collection, as recommended by the model (
Section 3.3), are shown in
Appendix A. For this study, questions compatible with the analyzed projects were elaborated in order to compare the results of the application of the NEM in different projects. The same set of questions was applied to all three projects being analyzed in order to capture the differences between them, and thus demonstrate the functionality of the model. With this it was possible to show, through the graphic illustrations of each project, how each project is presented according to the characteristics evaluated either by the resulting color or the numerical data.
From the answers obtained, the results were calculated for the three simulated situations for each project: WEFN and Sustainability, WEFN and Industry 4.0, and WEFN and SDGs. Although the results of the evaluations were computed and analyzed for each project individually, they are presented together here, allowing a better graphical and numerical comparison to be made between the projects.
3.4.1. WEFN and Sustainability Evaluation
The graphic and numerical illustrations resulting from the evaluations of the three projects regarding the WEFN and dimensions of sustainability are presented in
Figure 6 and
Table 6.
For Project 1, shown graphically in
Figure 6, it is possible to observe that the food resource was the one that presented the best performance because it was represented by the white color, the energy resource was the second best and presented a pinkish color, while the water resource presented the worst performance in this project. The numerical analysis in
Table 6 shows that the three values of the food resource in the composition of the sustainability dimensions, on the RGB scale, were 255, which results in the color white at its maximum intensity. It is important to remember that the understanding of better or worse will depend on the context of the analysis. For example, if managers or researchers seek to implement a project in a place where they need to emphasize their environmental actions aimed at water resources, then this will be evaluated specifically to see, for example, whether Red 140, equivalent to the environmental dimension of sustainability, meets the expectations of local actions. In this way, the model helps to guide actions that institutions such as companies, universities, and governments must take so that even greater gains can be achieved.
In the case of the results of Project 2, it is possible to observe in
Figure 6 that the food resource was the one with the worst performance, as it was represented by the color black. The water resource showed the best performance, being closely followed by the energy resource. In the case of these last two resources, graphically there may be some doubt, and it should be noted that water is closer to the white color than energy. In this case, the observer has the means to clarify the performance of the project being evaluated by examining both the graphic illustration and the numerical table. In doing this, it can be seen that the water and energy resources presented the same value for the environmental dimension, 230, and for the economic and social dimensions, while they presented values of 230 and 242 for water and values of 217 and 229 for energy.
The results of the evaluation of Project 3 (see
Figure 6) show that the energy resource was the one that presented the best performance, as it was represented by the light white color, symbolizing the balanced mixture of red, green, and blue colors. The food resource was the second best and presented a light gray color, while the water resource presented the worst performance. In the numerical illustration (see
Table 6), it can be seen that the three resources present different values, but when examined individually, present the same values for all three dimensions of sustainability. It was found that the result of the energy resource was excellent, that of the food resource was very good, and that of the water resource was weak. It must be emphasized that the NEM applied the same set of questions to all projects and, in the case of Project 3, this was not through rainwater harvesting or water reuse being a project concept. Therefore, despite the important contribution of this Itapiranga Biogas Project, and its predecessor, Alto Uruguay Project, in the preservation of the Uruguay River, the result of the water resource was weak.
It can be demonstrated that the model also allows a comparative analysis to be carried out between the three projects. Thus, considering the WEFN and Sustainability evaluation, we can identify that, graphically (
Figure 6) for the water resource, there are no white or black triangles whose interpretation is more direct, referring to the presence, or absence, of all colors, represented by the dimensions of sustainability. For this analysis, the numerical data (
Table 6) show that Project 2 presents the best result. This result is in line with the fact that the Efficient House was designed with the rational use of water in mind. In cases of visual proximity such as this, it is important to refer to the numerical data to gain more a more in-depth analysis.
In the case of energy, Project 3 presented the best results. The result of Project 1 was also very good, and a similar situation was observed for Project 2 which, despite having presented the worst performance for this resource, also presented good numerical results. The good scores of the three projects for the analyzed resource are in line with the fact that they were projects implemented, or that are being implemented, by a reputable company in the national electricity sector.
From the analysis of the food resource, it can be seen that Project 1 presented the best result, while Project 2 had the worst. These results are in line with the projects analyzed, as Project 1 refers to an animal protein production project and, to integrate the energy and livestock sectors, it adopts important animal welfare practices for the production of animal products. In the case of Project 2, it is noted that, at the time of its installation, animal protein production systems were not thought of for the Efficient House. Project 3 was classed as the second-best project for the food resource as, being a project to generate energy from pig manure, pigs are seen as important source of food.
Observing the triangle graphics in
Figure 6 and referring to the total placed in the center triangle, it can be seen that Project 1 presented the best performance, being composed of the results 217, 202, and 212 for the dimensions of sustainability, as shown in
Table 6. Project 3 received the second-best evaluation, consisting of the results 191, 191, and 191. Project 2 was in third position, consisting of the results 162, 158, and 170. These results illustrate the potential of the NEM, as it allows managers and researchers to compare projects based on the WEFN from the perspective of sustainability, and thus evaluate and manage more efficiently the important resources necessary for life.
3.4.2. WEFN and Industry 4.0 Evaluation
Similar to the previous section, the WEFN and Industry 4.0 evaluation in the NEM provides the graphics shown
Figure 7 and the numerical representation shown in
Table 7.
In the case of Project 1, from the graphics in
Figure 7 it can be seen that the water resource obtained the clearest result, demonstrating that it is the resource with the greatest balance among those evaluated. However, the energy resource in his illustration was much closer to the result presented by the water resource than to the result of the food resource, which was the worst result in this evaluation. Numerically (
Table 7), the food resource presented a perfect balance between the three factors, registering 128 for all of them; however, its color became dark gray because on the RGB scale, 128 represents the half intensity between the purely black (0) and purely white (255) results. It can be seen too that Project 1 was conceived with much more focus on sustainability than on Industry 4.0. Again, this is shown graphically in
Figure 6 as the colors are closer to white. Additionally, in the case of the numerical representation (
Table 7), the RGB axes values are significantly higher for the resources of water, energy, and food in the Project 1 WEFN and Sustainability evaluation rather than in the Project 1 WEFN and Industry 4.0 evaluation.
In the evaluation of Project 2 for WEFN and Industry 4.0, it was observed that the three resources are very close to the absolute black color (see
Figure 7), which demonstrates that the Efficient House project practically had nothing in its conception that was being questioned for this theme. Looking at the numerical values in
Table 7, it is possible to see that water was the resource that did best in this evaluation, as it had the best values for the three factors of Industry 4.0, i.e., 13, 32, and 26, respectively, although it was tied with the food resource in the biological factor and with the energy resource in the physical one.
The graphic illustration for Project 3 shown in
Figure 7 may raise doubts about its interpretation because the color tones are similar, which requires further investigation of colors and their RGB compositions. In this case, the numerical table presents the colors and their scores in a stratified manner, allowing for an accurate evaluation. Considering
Table 7, it can be seen that Project 3 presented the best score for the energy resource, which obtained the best evaluations for the three factors of Industry 4.0. The water resource was the second best, because in this case its three component factors of Industry 4.0 had higher evaluations than the food resource.
The comparative analysis of the three projects evaluated shows that, in the case of Industry 4.0, Project 2 presented the worst results for all resources. Project 3 had the second-worst result, while Project 1 showed the best results for all resources, as shown in
Figure 7.
3.4.3. WEFN and SDG Evaluation
In the WEFN and SDG evaluation, it can be observed that the graphic and numerical illustrations are different from the previous evaluations presented against sustainability and Industry 4.0. This is due to the fact that the WEFN and SDG evaluation crosses data between the three resources, water, energy, and food, with the 17 SDGs, where the rates of service of the projects for each of the SDGs are evaluated separately for each resource. In this evaluation, each of the three features is composed of only one color, varying only the intensity of the color, whose scale goes from 0 to 255. So, the higher the feature score, the closer it will get to the pure red, green, or blue color, with the sum of these resulting in pure white.
Figure 8 and
Table 8 present graphically and numerically, respectively, the results of the evaluation of the three projects regarding WEFN and SDG.
It can be seen, both graphically and numerically, that the evaluation of Project 1 WEFN and SDG presented an excellent result since two resources, energy and food, reached the maximum score, 255, in the RGB scale and the third resource, water, approached this number by reaching 244, as illustrated in the resultant (Total) column shown in
Table 8.
Although Project 1 excelled, as demonstrated by the well-defined colors in
Figure 8, the same cannot be observed for Project 2, where it can be seen that the water resource is the one that comes closest to its pure color (corresponding to the template), followed by the energy resource, which presented a performance from average to good. In the case of the food resource, it is observed that the project presented a poor performance for the WEFN and SDG evaluation, and this can be seen by the blue color, which is shown in a weaker less-intense color. From the numerical data in
Table 8, it is possible to confirm what was observed graphically, since the water resource presented a resultant score of 214 while the energy resource presented 195. The poor performance of the food resource can be observed by the result presented in the value of 30.
In the case of Project 3, the
Figure 8 graphic illustrates this project presented good results because the three colors of the triangles that represent each of the WEFN features are relatively strong. This can be confirmed by the result of the sum of the three features, as the composition of the three colors resulted in the light gray color. Again, as shown by the numerical data in
Table 8, the three resources of the WEFN presented high values, registering 221 for water and energy resources, and 210 for food resources.
Comparing the three projects with regard to WEFN and SDGs, Project 1 had the best results for the three resources as seen by the intense colors in the red, green, and blue triangles (axes), and, above all, by the white color of the resulting (total). Project 2 presented the worst results for WEFN and SDGs, while Project 3 presented intermediate results.
These results illustrate another potential of the NEM, as it allows managers and researchers to compare projects based on the WEFN from the perspective of the SDGs. This is important since a demonstration of compliance with the SDGs is required, especially in the case of large companies listed on stock exchanges or those that establish business relationships with listed companies. In the graphical analysis (
Figure 8), the main doubts regarding the project classifications may exist regarding the water and energy resources of Projects 2 and 3. In this case, the numerical analysis shown in
Table 8 is recommended. The food resource presents a visually striking difference for the three projects.
3.5. Evaluation of NEM
The validation and legitimization of the NEM as a tool to support the identified WEFN should occur in accordance with the ontological or epistemological view adopted, and comply with the scientific perspective as well as the practical perspective [
43,
44]. Thus, to support this analysis, both perspectives are considered to ensure the relevance, efficacy, and applicability of the NEM.
From a practical perspective, results from the application of the NEM to real projects by experts in the demonstration phase, who were also part of the teams of the projects being evaluated, gave evidence about the degree or capacity of the NEM to describe and represent correctly and accurately the status of the projects being evaluated [
45]. The results of the application of the NEM to the three projects, in general, were more positive regarding the WEFN and Sustainability relationship (environmental, economic, and social) than the WEFN and Industry 4.0 relationship (biological, digital, and physical). This difference in results signals, firstly, that the projects meet the dimensions of sustainability more satisfactorily than the structuring factors of Industry 4.0. The experts demonstrated in their answers that these results were in line with the reality of the evaluated projects. For example, the following statement shows how one of the three experts, designated as E1, refers to this when dealing with the WEFN and Sustainability result for Project 3 (Biogas):
“Here, too, the results of the assessment are consistent with expectations, since the direct impacts involve energy generation and production of animal protein for human food purposes. With regard to water, it must be considered that the full operation of the system, once installed, has the consequence of not discharging effluents into streams, preserving and even recovering environments that were previously contaminated.”
(E1)
Similarly, in relation to Project 2 (Efficient House), the experts agreed among themselves with the results regarding sustainability as shown in the following illustrative testimonies:
“As for Project 2 and sustainability, I agree with the water and energy indexes, but as for food, I believe that with all the technologies used in the house, it would be very possible to create hydroponic gardens and even raise animal protein, especially insects, in an urban environment.”
(E1)
“The result of the proposed project is aligned with what is expected empirically, since food development is not part of the scope, being, at most, a side effect. For the Water and Energy items, the result is representative of what has been put in place and built.”
(E2)
These testimonies show that the application of the model not only reflects the real results of the project, but also denotes the potential of the model to present possibilities for improvements in terms of aligning the WEFN with the dimensions of sustainability. Although the food resource was not part of the scope of Project 2, as expert E2 says; the results presented by the model make expert E1 reflect on the possibility and gains of incorporating this resource into the project. Regarding the relationship between WEFN and Industry 4.0, experts also denote the coherence of the results presented in the demonstration of the application of the model with the reality of the projects. This is illustrated by these comments from E2 regarding projects 2 and 3, respectively:
“The result is within the expected limits, since the Efficient House, from its conception to the present moment, did not take into account aspects related to Industry 4.0.”
(E2)
“Compared to the scores in the scope of Sustainability and SDGs, here again the result was below the midpoint of evaluation because it is yet another project that was not conceived, planned and developed considering the aspects of Industry 4.0.”
(E2)
The less-favorable results of the evaluation of the projects regarding the relationship between WEFN and Industry 4.0 are coherent, considering that the factors of Industry 4.0 were not in the design of the projects. It must be considered that the results are more favorable to sustainability than to Industry 4.0, and are in line with the very nature of the WEFN that emerged at the Bonn Conference [
46], in the search for more sustainable management solutions and the projects that were evaluated were structured in the logic of the WEFN. However, in some of the projects evaluated, experts already understand that Industry 4.0 factors could have been considered, as referred to by Expert E3 regarding Project 3:
“The Itapiranga project, as we discussed previously, is very useful, profitable, has a timely marketing appeal, and is part of the model of socio-environmental improvement of Brazil’s energy matrix. However, I think it could be more disruptive, advancing not only with current technologies, but also allowing us to anticipate the probability of new technologies.”
(E3)
In other cases, it is observed that even in the “eyes” of the experts themselves, the relationship between the elements of the WEFN and the factors of Industry 4.0 became difficult to see in practice, as shown in this extract from Expert E1’s report regarding Project 1:
“As for the digital factor, I can’t see a relationship between water and food and the digital factor.”
(E1)
Although they are specialists with extensive experience in evaluating projects that bring together the three resources, this difficulty may be related to the nature of the WEFN, which has sustainability at its core and not Industry 4.0. Considering that Industry 4.0 is increasingly present in contemporary times, the possibility of this evaluation perspective being incorporated in the model is promising in the management of projects related to the WEFN. In general, experts also agree with the positive results of the WEFN and SDG evaluations and reinforce that this is due to the fact that the WEFN resources are implicit in the SDGs. Expert E2 states this in relation to Project 1:
“Due to the fact that the elements analyzed were directly anticipated in the SDGs, the result of the project was of high value in its aspects.” And also, regarding Project 3: “The result shows the adherence of the project to the SDGs, quite close to a condition of perfect equilibrium in high scores. As expected empirically when pre-analyzing the project.”
(E2)
Similarly, Expert E3 reinforces this perspective when addressing the results of the evaluation of Project 1:
“The project, as we had previously discussed, is very useful and innovative, as it involves in the same project, the interactions of water, energy and food, water and energy as vectors for the food result, which clearly refers to the SDGs”.
(E3)
Another point considered that appears in the evaluation of the model carried out by the experts, that can be attributed to a limitation of the model, is the fact that it is not available in software with a user-friendly interface, but through an evaluation made in Excel. This fact implies the visualization of the results of the evaluation, since the answers that generated the graphs are presented separately, which may cause some difficulty for the specialists.
It was suggested by the experts that the creation of specific software based on the proposed NEM would be useful in order to disseminate the science of the WEFN without requiring the need for an in-depth knowledge of Excel. This will allow managers and researchers to achieve better performance in their projects under elaboration, or in restructuring, as well as in the evaluation of the acquisition of companies in brownfield processes, whether in meeting the dimensions of sustainability or in the factors that structure Industry 4.0. In the case of organizations listed on stock exchanges, which must annually fill out questionnaires aimed at meeting the SDGs, the experts pointed out that this solution can be an instrument to help managers.


 ,
, 

