1. Introduction
A few months before the Great Salt Lake (GSL) reached its lowest level in recorded history, in the fall of 2022, the executive director of the Utah Department of Natural Resources described the risks inherent in the lake’s desiccation in very stark terms. “We have this potential environmental nuclear bomb that’s going to go off if we don’t take some pretty dramatic action”, Joel Ferry told The New York Times [
1].
Further drying could indeed be catastrophic. The GSL is an essential “rest stop” for more than 10 million birds—including many that make a transcontinental voyage each year—that rely on the lake’s flies and brine shrimp to fuel their migrations [
2]. Via the so-called “lake effect”, in which dry desert westerlies pick up moisture while passing over the relatively warm lake [
3], the mountains just to the east receive copious snow—recharging watersheds in the second-driest state in the nation. The lakebed also contains high levels of arsenic and other dangerous heavy metals; thus, further drying and inevitable wind erosion is likely to send airborne toxins across one of the fastest-growing metropolitan areas in the nation [
4].
With these threats looming in late 2022 and early 2023, many concerned citizens called for “emergency measures” to keep the lake from completely drying up—an outcome that one coalition of scientists and activists warned could occur in as little as five years without extreme changes to the hundreds of billions of gallons of water that are rerouted each year via human diversion of the major streams that feed the lake [
5]. These warnings were repeated by hundreds of media organizations across the globe and widely shared on social media.
Starting in December of 2022, however, snowpacks in the GSL’s three main subbasins—the Bear River, Weber River, and Jordan River catchments—began to positively diverge from historic averages. By April, the snow water equivalent holdings in these basins had reached historic records, an outcome that had not been predicted by the North American Multi-Model Ensemble’s Probability Anomaly Correlation-calibrated forecasts and which cannot retrospectively be accounted for by known oceanic and atmospheric teleconnections [
6]. This stochastic winter resulted in an increase in inflow, temporarily halting the lake’s decline, and recharging groundwater in the lake’s 21,000-square-mile watershed. It also stoked ridicule for the highly publicized worst-case warnings that had been issued at the onset of that record-breaking pluvial winter. The mockery may have reached a crescendo in the spring of 2024 when, after yet another anomalously pluvial winter, the state’s governor declared that the five-year warning was “laughable”. “It’s a joke and everybody knows it’s a joke. They were never serious about that”, Gov. Spencer Cox told National Public Radio. “That’s the ‘doomerism’ that is terrible for people” [
7].
It is notable that Cox has been an outspoken champion of the Disagree Better Initiative of the National Governor’s Association, a call for grace and civility in political disputes [
8]. The fact that Cox was nonetheless willing to “pile on” may thus be telling of the risks inherent for researchers who warn of worst-case scenarios, particularly when these warnings are either not comprehensively informed by a holistic assessment of risk and stochastic potentialities, or are poorly translated through the media ecosphere.
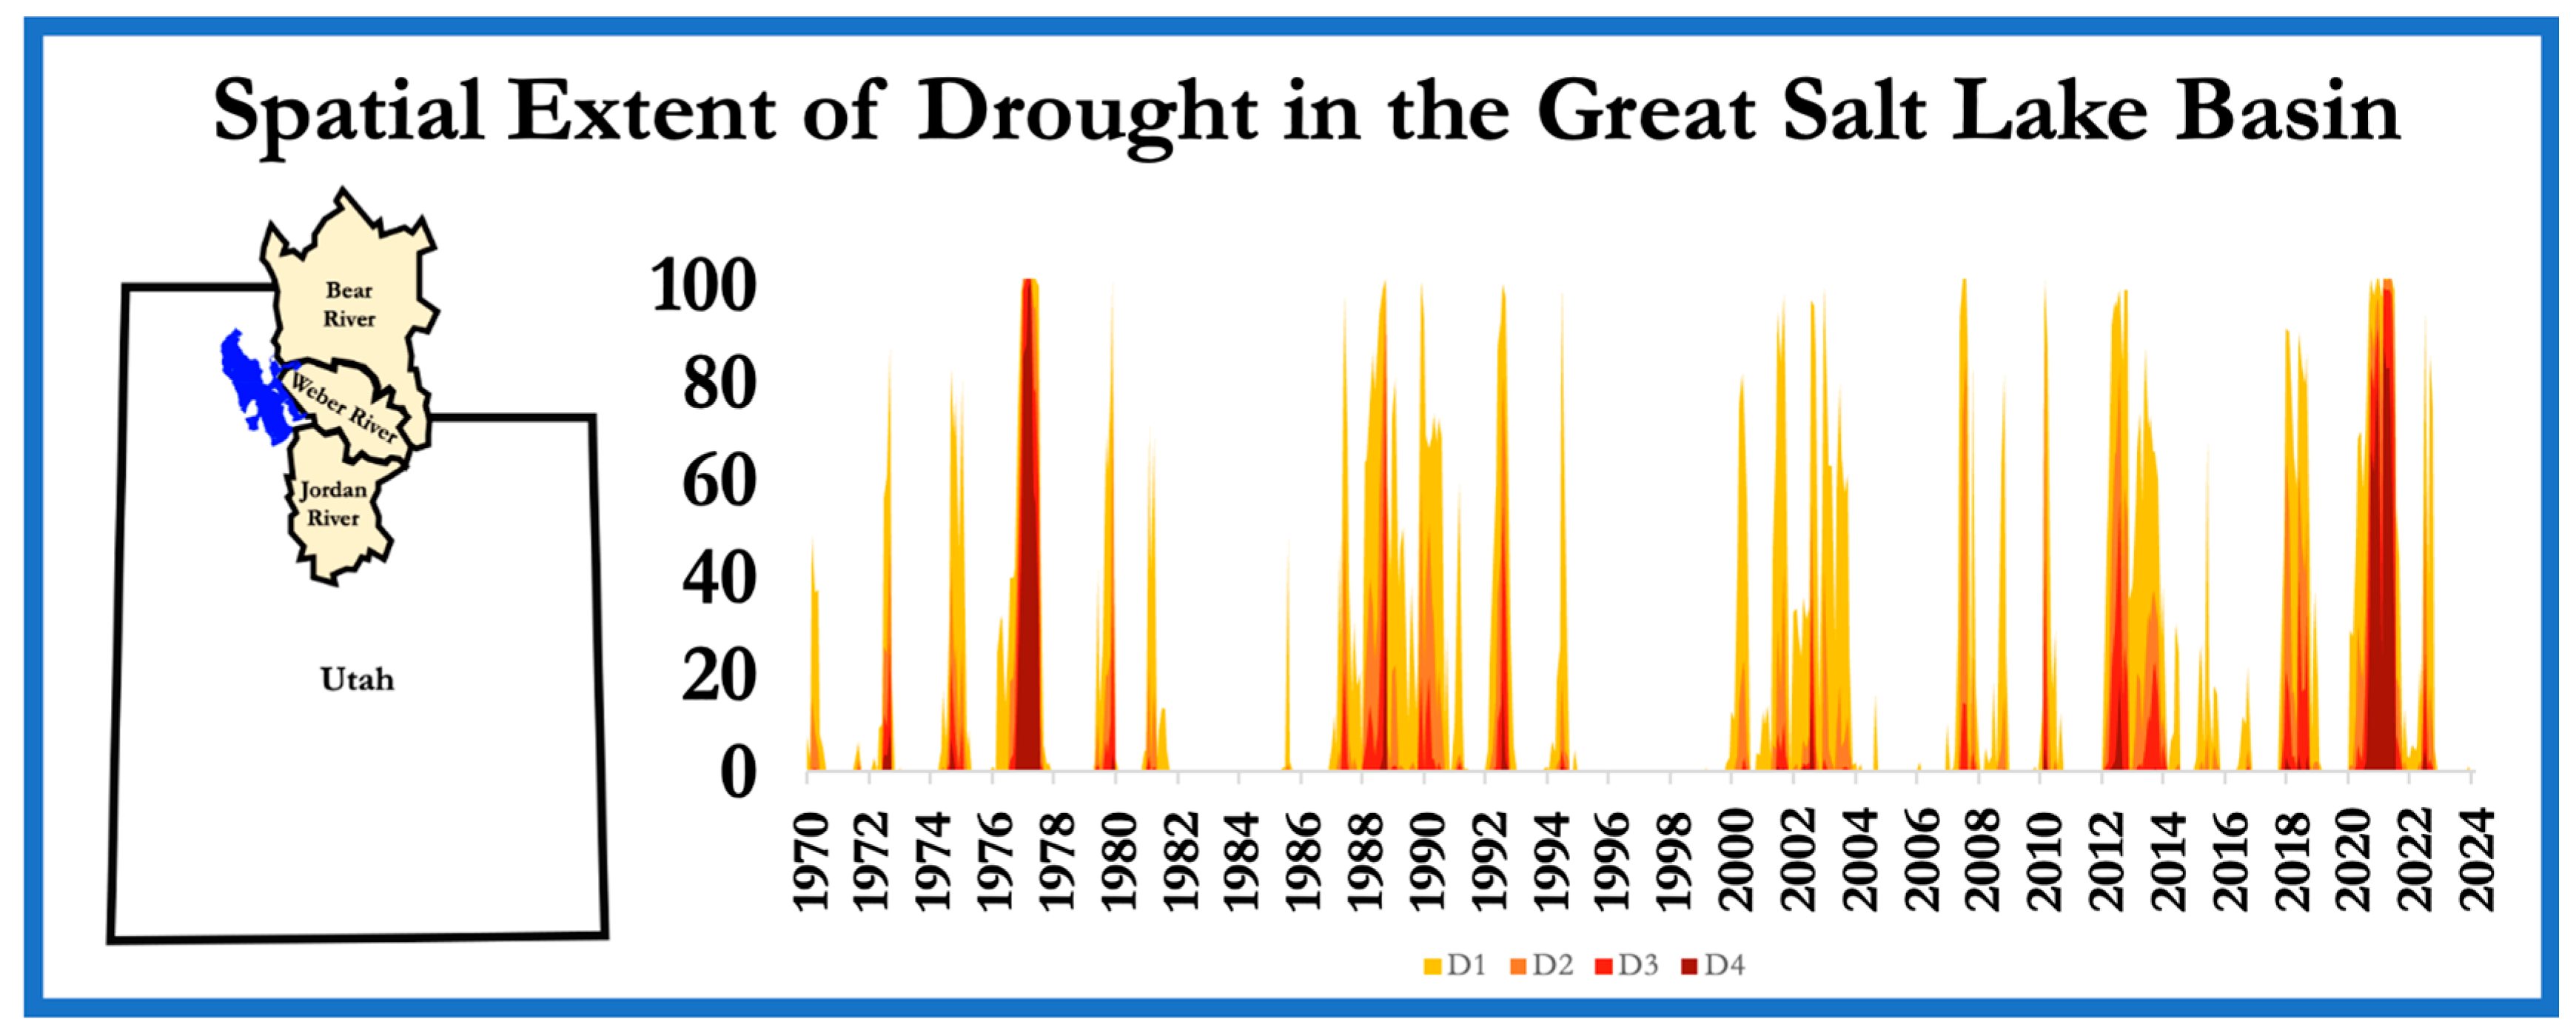
The researchers and advocates whose desiccation warnings were widely shared based their assessment on lake level depletions beginning in 2020, using a water budget that accounted for two inflows, direct precipitation of 0.6 million acre feet (MAF), and runoff of 1 MAF, for a total inflow of 1.6 MAF. Their assessment also included two outflows, evapotranspiration of 2.6 MAF, and industrial mineral extraction of 0.2 MAF for a total outflow of −2.8 MAF. The assumed deficit was thus −1.2 MAF. The team noted that this deficit could be mitigated by the moderation of the upstream human water diversion of 2.1 MAF. However, the period of time upon which their assessment was based coincided with an intense drought in the sub-basins that flow into the GSL, equally if not more intense than any such period of anomalous dryness in the past half century (
Figure 1).
Also largely lost in the ensuing public dialogue was the global context in which the GSL declines are occurring. The Great Salt Lake is the western hemisphere’s largest endorheic body of water, but it is by no means the only closed-basin lake that appears to be experiencing long-term drying. Substantial shifts in total water storage (TWS) have been observed since 2002 in endorheic basins across the globe and, notably, in the world’s largest region of contiguously connected closed basins, across western and central Asia in an area that has a similar northern latitude to the GSLW [
9].
While the authors were clear about the fact that their analysis was singularly focused on the GSL, and were forthright about the period used for their assessment, these nuances were quickly lost in the ensuing public discourse, which was focused on their warning that the GSL could be “on track to disappear in the next five years”. The authors also expressly acknowledged that their water budget estimates were not inclusive of groundwater, which moves through the pervious rock surrounding the lake at rates measured in feet per day as opposed to the feet per second common for streamflow [
10]. It can thus take years and even decades for precipitated water to move from a recharge area to a discharge zone such as the GSL [
11]. Therefore, to better inform possible trajectories for the GSL—and to create the best opportunity for public discourse that reflects more of the nuances of possible long-term trajectories for the lake—it is important to develop models that include interannual- and decadal-scale projections of groundwater availability in the 21,000-square-mile watershed that surrounds the GSL.
To these ends, we build on research from Halaka (2014), showing that northern Utah groundwater and the GSL’s elevation are closely associated and that coupled simulations may adequately represent the natural processes connecting ocean-induced atmospheric teleconnections to fluctuations in water storage [
12], as well as research which has concluded that groundwater decline is a major threat to the GSL [
13,
14], albeit most likely in multi-decadal rather than semi-decadal timescales. Using Community Earth System Model projections for groundwater-impacting meteorological variables, we extrapolate possible trajectories for the GSL, demonstrating a high unlikelihood of immediate and complete desiccation, but a pronounced long-term risk of slow, continuing decline in lake level elevation through the end of the century.
2. Materials and Methods
The Great Salt Lake watershed (GSLW) encompasses about half of a percent of the total landmass of the United States, but was well represented in the now-defunct Active Groundwater Level Network of the U.S. Geological Survey (USGS), which included data on water levels and well information from more than 400 wells in the GSLW gathered and analyzed by [
12], who demonstrated a close association between lake elevation and groundwater. Using Hakala’s approach, in which springtime groundwater levels were standardized prior to averaging, but utilizing the USGS National Water Information System (NWIS) in lieu of the Active Groundwater Level Network (which was decommissioned in September 2022) we utilized 5000+ observations from 66 wells within the general GSLW area (40 to 42° N, −114 to −111° W) from 1937 to 2022 (
Figure 2a). As observations were less frequently recorded in the first few decades of this dataset, we chose to focus on data derived from 4200+ observations made from 1970 onward and standardized the values to create a time series representing GSLW well-derived observations of groundwater.
Compared to groundwater, GSL lake level elevation observations have been more steadfastly collected and recorded. (USGS lake level measurements were first made in 1875; lake level values going back to 1847 are estimates based on other reports but have long been relied upon as a starting place for the observational GSL record [
15].) For GSL elevation, we used USGS observations from the Saltair Boat Harbor monitoring station at 40°43′53 N, −112°12′46 W.
The power spectrum of the GSL elevation time series broadly coincides with that of the available years (1850–present) for modeled variables from the Community Earth System Model (CESM), which also simulates potential future changes through to 2100. The CESM1, which includes groundwater depth projections, has been shown to accurately represent the natural processes connecting ocean-induced atmospheric teleconnections to fluctuations in Utah’s water storage [
12]. We thus utilized the updated large-ensemble simulations of the CESM2, a state-of-the-art climate model with 1-degree spatial resolution (versus the coarser CESM1) that includes the up-to-date Community Land Model (CLM), which is produced using the Shared Socioeconomic Pathway known as SSP370, a “middle of the road” scenario for greenhouse gas emissions before the year 2100. We selected five variables from the CLM related to groundwater availability (precipitation rate, 2 m temperature, runoff, snow depth, and evapotranspiration) and created an ensemble and ensemble spread and annual mean for each, along with corresponding historical time series from ERA-5 for the general GSLW region (40 to 42° N, 114 to 111° W). While the CESM2-associated CLM does not output the same groundwater depth variable as the CESM1 used by Hakala [
12], it does include total water storage (TWS, the sum of all water stored at and below ground,) which offers a holistic reflection of the water budget of an endorheic watershed, including in the deep aquifers, and was the variable used by Wang, et al. [
9] to demonstrate that endorheic basins like the GSLW have experienced a net loss in water availability since the start of the century. For this analysis, we assessed TWS in the same region, then employed quantile mapping, a method of bias correction designed to adjust the distribution of modeled data [
16,
17] often in association with observed climatologies [
18] and which is widely used in regional downscaling of climate projections [
19]. Thus, the distribution of these variables was adjusted to match that of observed groundwater depth, this can be regarded as a bias correction approach, similar to the manner of Heo et al. [
20], but for groundwater variables instead of precipitation. We then treated the reconstructed future TWS as modeled GSL elevation for a more straightforward comparison with the observed GSL elevation.
3. Results
Using the NWIS well observations from the GSLW (
Figure 2a, brown box), we plotted the groundwater time series (
Figure 2b, brown line), alongside the elevation of the GSL from Saltair Boat Harbor monitoring station (
Figure 2b, blue line), demonstrating a clear and consistent relationship between groundwater observations from the NWIS-monitored wells and the GSL, including during a substantial recharge event (1979–1987) that led to a 100+ year lake elevation record, and several smaller rebounds. While there have been several shorter periods of recharge since 2000, none have been sustained long enough to return the lake to its observational historic average of 4200 feet. Notably, the wells historically recharge and recess several years before the GSL, with the peak of the precursive relationship occurring at two years (R = 0.754).
Although the variability of the ensemble mean for TWS (
Figure 2b, green line) cannot reflect any calendar year and cannot be directly correlated to the well-derived observations or GSL elevation, in the long run it can additionally be seen that TWS broadly reflects the observed declines in well levels and GSL elevation.
The observational record for the Great Salt Lake going back to 1850 (
Figure 3a gray line) reflects a long-term decline in lake level elevation punctuated by quasi-decadal-scale recharge events. These multi-annual and quasi-decadal lake level collapses, along with the long-term lake decline, are generally well captured by CLM-backcasted estimates of TWS, as demonstrated through a box and whisker plot (
Figure 3a, green) showing the distribution of modeled outcomes in 30-year increments (a timescale chosen to temper known decadal cycles for GSL elevation [
21]) for 100 ensemble runs of variability in overlapping increments (e.g., 1851–1880; 1866–1895; 1881–1910; etc.). The GSL-TWS relationship has remained well-connected for most of the time series, with GSL elevation broadly adhering to the middle two quartiles of TWS, with substantial divergences coinciding with two historically extreme highwater events. As reflected by both the ensemble mean and the 30-year incremental runs, this coherence appears to have remained adherent through the past half century, encompassing the onset of anthropogenic warming effects, suggesting that recent shifts in the natural variability [
6] have not materially offset this long-term relationship.
Given the notably consistent relationship between long-term GSL elevation, well-derived observations of groundwater, and the TWS ensemble mean from 1970–present, and the longer relationship between GSL elevation and TWS from 1850–present, we deemed it reasonable to treat the reconstructed TWS as a proxy for future GSL elevation. Run forward, the TWS model affirms widespread concerns about lake desiccation, suggesting a downtrend in TWS, and thus presumably groundwater and lake elevation, through the end of the current century, providing a quantitative measure of the likelihood that, and timeframe in which, the GSL may reach specific critical points. For instance, our model suggests that the potential for a return to a highwater event (dark blue dotted line in
Figure 3a and corresponding dark blue lake area in
Figure 3b) will diminish in future decades. Meanwhile, there is an increasing likelihood that the historic low point of 4188 feet (medium blue dotted line in
Figure 3a and medium blue lake area in
Figure 3b), which prompted widespread concerns when reached in 2022, will be exceeded as an observational low point in the decades to come. While the projections do not indicate a total desiccation event is likely before 2100, there are certainly scenarios in which the model-projected groundwater proxy levels aligned to a lake elevation lower than 4180 feet (light blue dotted line in
Figure 3a and light blue lake area in
Figure 3b), an outcome that would result in a landscape unlike anything in observed history, such as below 4175 feet in which the GSL would bifurcate into two parts (e.g., around year 2045), if severe drought is to happen again.
4. Discussion
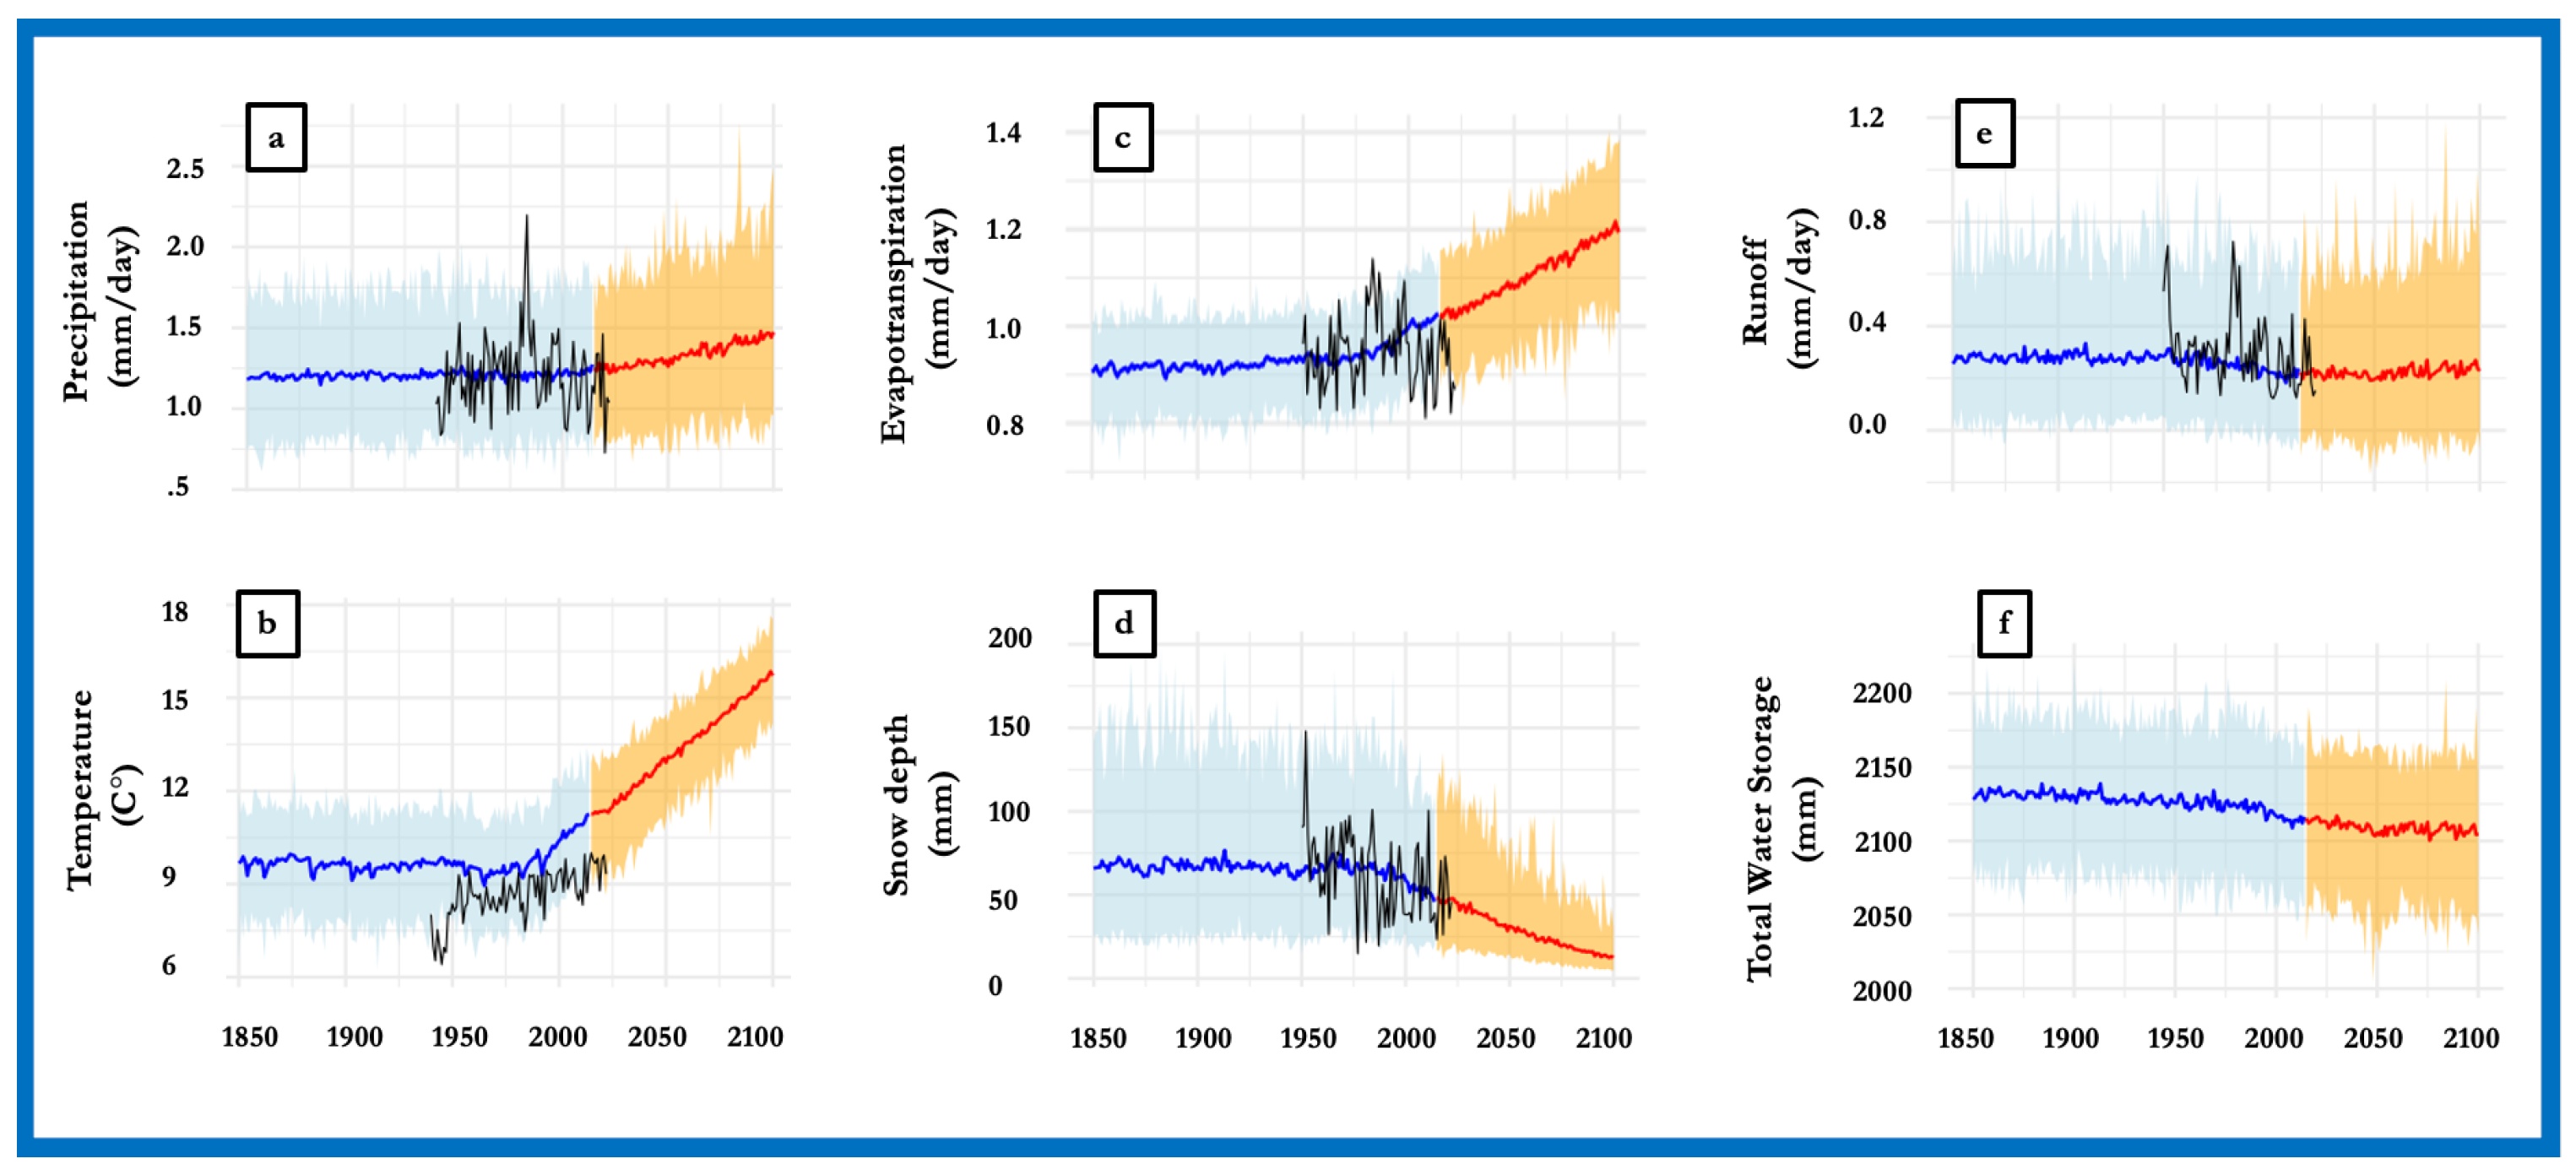
An examination of five related CLM variables helps explain the complexities involved in the TWS (and thus groundwater and GSL) trajectories. Under the moderately increased greenhouse forcings modeled in the SSP370, total precipitation may inch very slowly upward in the GSLW (
Figure 4a), perhaps as a reflection of the orographic amplification of the Clausius–Clapeyron relationship [
22]. (It is important to note, however, that precipitation is an atmospheric variable that remains difficult to predict in numerical weather models, including climate models [
23], particularly in relatively small domains such as Northern Utah.) Even if precipitation does increase, though, the CLM agrees with virtually all other models that temperatures will also increase in the GSLW through to 2100 under SSP370 (
Figure 4b); thus, any precipitation increases are likely to be negated by increased evapotranspiration (
Figure 4c), resulting in decreased snow depth (
Figure 4d) and decreased runoff (
Figure 4e), the net effect of which is decreased TWS as modeled as an ensemble mean in
Figure 2, overlapping increments of 30 years as shown in
Figure 3, and the ensemble spread and mean in
Figure 4f. These variables, which do not account for human diversion, collectively tell an important story: while the immediate risk of total desiccation is low, the long-term risk of further decline is likely independent of local action.
Interannual variability will, of course, persist, and anomalously wet years such as the historic 2022–2023 winter, which brought record snowpacks across the GSLW, may bring other periods of temporary respite to falling TWS (thus diminishing groundwater and lowering GSL elevation). As this analysis suggests that groundwater recharge generally precedes lake elevation rises with somewhat variable lead–lag times, we are not yet able to discern the holistic long-term impacts of the 2022–2023 snow season. However, it is clear that a particular winter (and another that followed, which while not nearly so substantial also resulted in snowpacks that exceeded long-term averages) temporarily alleviated many perceived concerns about continued lake desiccation, leading to the aforementioned mockery of the dire projections offered in early 2023. This did not, however, alter the fact that the GSL had indeed reached a record low in 2022, and that it had done so in a seemingly precipitous fashion—nor did it change the possibility that, as the report warned, human diversion of the major streams that feed the lake may be a substantial contributing factor in the lake’s decline.
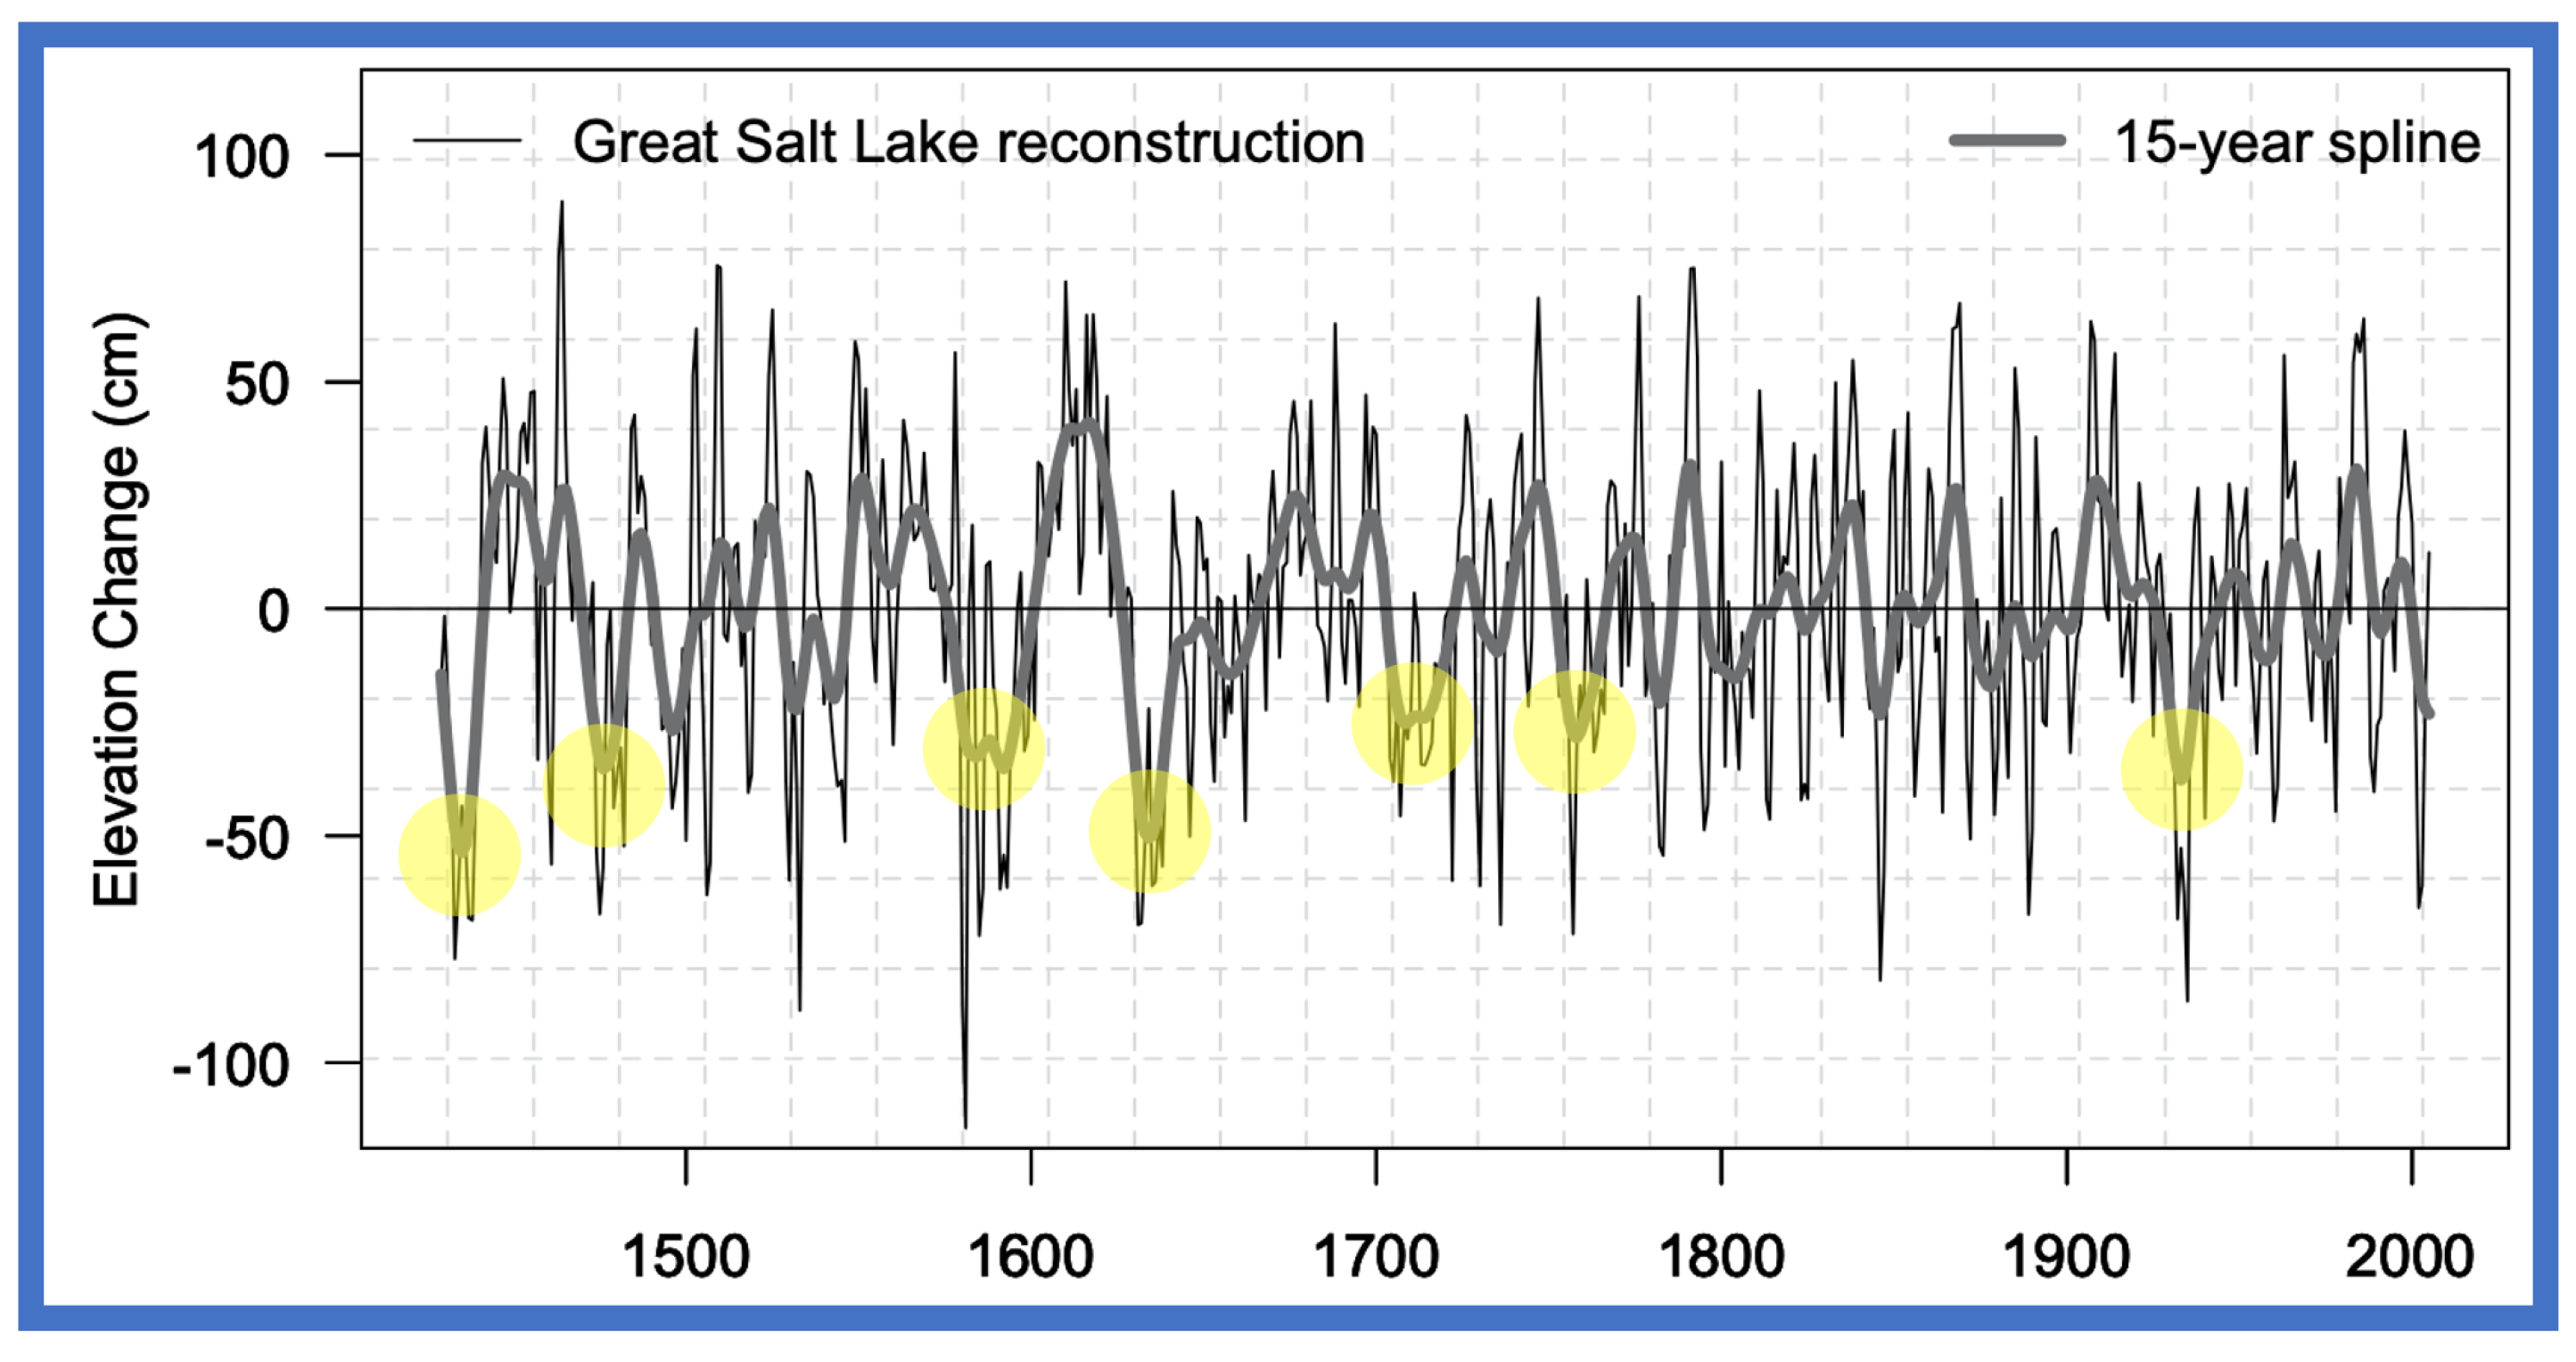
It is nonetheless important to note that diversion does not happen in a void of short- and long-tern natural variability. Indeed, a 576-year tree-ring reconstruction of GSL elevation by DeRose et al. (2014) [
24] suggests that the recent observational low falls within natural extremes, including large, multi-year reductions (e.g., 1580–1600, 1630–1640, and 1700–1710) may have resulted in lake levels that were equal to or lower than the 2022 minima (
Figure 5). Diversion and warming effects are likely to depress those low points further in the future.
Building resilience in natural systems impacted by human activities requires not only restorative interventions (i.e., curtailing diversions) but also addressing underlying drivers of degradation (e.g., climate warming). This may be unfulfilling from a localized context, since local action alone will not move the needle on the key forcing that appears to be most responsible for the long-term desiccation trajectory and the proliferation of greenhouse gasses in the atmosphere. While this forcing does not appear to be enough to prompt a total desiccation event by the end of this century, our plots indicates that the 2022 record-low water level could re-materialize at virtually any point in the immediate future, an outcome that was reached or exceeded in a substantial number of the modeled runs through the end of the century, whereas high-water marks are shrinkingly likely in this same time period.
5. Conclusions
By accounting for short-term fluctuations (such as the record drought that began in 2020), and long-term trends, (such as the decades-long but less abrupt declines in GSL elevation that began in the 1980s and the modeled projections), and accounting for both forms of variability, researchers may be able to provide more nuanced and reliable forecasts and warnings. Our projections, speak to the long-term perils, which are certainly aggravated by diversion, but do not indicate a total desiccation event is likely before 2100, in part because of a seeming leveling-off trend in GSL elevation in the latter part of this century, echoing simulations by Mohammed and Tarboton [
16], who suggests that lake area sensitivity may rebalance lake level decline with reduced evaporation and increased precipitation. This may also be a response to somewhat mitigated warming as per SSP370, and thus an important caveat is in order: the estimated GSL decline we have presented is a middle-of-the-road scenario for future greenhouse emissions under different climate policies. If the future reveals itself to have continued and expanded exploitation of fossil fuels and progressively energy-intensive societies, the decline would be likely to worsen, although this assumption would need to be evaluated using models that are inclusive of other scenarios.
These sorts of nuances may have been valuable in the conversations provoked by the dire “five-year” warnings that were published in January 2023. By the first week of April, which is typically considered to be the end of the snowpack accumulation season across Utah [
25], it was clear that the acute drought, which had persisted during the period in which the five-year desiccation trajectory had been calculated, had been interrupted by record-setting snowfall driven by stochastic variability that is commonplace in the GSL’s climate regime [
6].
This does not mean the report’s authors were wrong. The stochastic nature of the record-setting 2022–2023 winter was such that it might be said that, at the time the warnings were issued, the region existed under something of a “Schrodinger’s snowpocalypse” neither likely nor unlikely given what is currently know of the prevailing oceanic and atmosphere conditions at that season’s onset. Moreover, several years of exceptional drought (as depicted in
Figure 1), if continued for five additional years, may indeed have decimated “the lake as we know it”, as the coalition warned.
However, a drought that intense and persistent would not have simply been historic; it would have obliterated known variability. By way of example, the longest period in which at least 10 percent of the counties comprising the GSL Basin were under exceptional drought conditions was 13 months, in 1933–1934. The period of exceptional drought in 1976–1977 lasted nine months. The exceptional drought of 2020–2021 ended up lasting 11 months; thus, it was well within known variability. While it is widely established that anthropogenic climate warming has led to observed climate extremes across the globe, observational records have almost always been overtaken by new records by fractions, not factors [
26].
As knowledge producers, scientists are positioned to drive change and appear to be increasingly willing to assume a compatibilist identity that embraces both research and activism [
27], but while science communicators may worry that presenting uncertainties could affect the perceived trustworthiness of the information or its source, particularly in high-stakes circumstances such as the potential desiccation of the GSL, research from a variety of scientific arenas suggests that transparency does not undermine credibility, especially when researchers endeavor to provide a quantification of the risk they are assessing [
28]. Additionally, while “simplification” is often seen as a meritorious goal in science communication, in a 2004 correspondence Ladle et al. warned of the dangers of “damaging simplifications of research findings”, attributing some of the blame for media misinterpretations to a lack of “clear and unequivocal findings” from researchers and their institutions [
29]. In 2023, Wang noted the dangers of oversimplifying the potential trajectories of the Great Salt Lake, writing that people who remembered the warnings, but not the nuances, of the five-year desiccation projection, “might look out over a lake in 2027 that has not dried up and say, ‘I remember when the scientists said this lake was about to disappear’” [
30]. Alas, it did not take that long; by 2024 the governor of Utah had already declared the warnings “a joke”. Perhaps not coincidentally, Utah is one of just nine states where a majority of residents in 2023 do not agree with the statement “my governor should do more to address global warming”, according to the Yale Climate Opinion Maps project, which tracks beliefs about climate change, risk, policies, responsibility, and behaviors across the United States based on a survey and estimation model developed by Howe et al. [
31]. While science in general retains high levels of trust relative to other institutions, such derision may reflect pronounced declines in public trust for scientists in the United States since the late 2010s [
32].
We therefore suggest that the long-term trends and patterns that influence the lake’s dynamics should guide the communication of risks and opportunities in a warming world, and we suggest that these communications should reflect probabilistic and quantitative assessments of the Great Salt Lake’s future, which will be incumbent upon continually improving understandings of groundwater availability at myriad timescales. While it is likely that these risks are substantially increased by human diversion, further desiccation is independently likely under anthropogenic climate change—even if diversions are decreased.
The most likely risks to the Great Salt Lake may not be as immediate as some have projected, but they remain and, like so many other risks to regional ecologies, the solutions are not just local but global.


 ,
, 