4.1. Climate and Hydrology
The air temperature in the region increased by 1.4 °C between 1993 and 2022 (
p = 0.0017) (
Figure 2). The trend of rising temperatures is significant in Central Europe, particularly in the last decade [
27], and has affected the hydrological cycle, primarily by increasing evapotranspiration. In a previous study from this area, Hruška et al. [
6] concluded that between 1993 and 2006, no temperature increase was observed. The temperatures began to rise noticeably as of 2013.
The annual precipitation amounts did not exhibit any statistically significant trends from 1993 to 2022. The annual average was 979 mm for LYS and CEP and 792 mm at PLB. Precipitation varied from year to year, ranging between 765 mm and 1285 mm (LYS and CEP) and between 564 mm and 1028 mm at PLB. Although the trend is not statistically significant, it is notable after 2013 that more values fell below the long-term average when significant droughts were observed in 2014, 2015, and 2018 (
Figure 2c).
The annual runoff from LYS averaged 412 mm (1993–2022). The lowest runoff occurred in 2014 (178 mm), and the highest occurred in 2002 (747 mm). Until 2013, the runoff did not show any long-term trends (average of 460 mm for 1993–2013), similar to precipitation (
Figure 2b). However, from 2014 onward, there was a significant decline in runoff (average of 300 mm for the period of 2014–2022) due to a combination of increasing temperatures and reduced precipitation (
Figure 2c). The decline in runoffs during the 1993–2022 period is statistically significant (
p = 0.004 for LYS,
Figure 2c), particularly because it has never exceeded 400 mm since 2014. Oulehle et al. [
21] calculated an average runoff loss of 45 mm per 1 °C degree as a result of increased evapotranspiration in the GEOMON network for the 1994–2019 period. Therefore, from 1993 to 2022, the runoff at LYS decreased by 63 mm due to the temperature increase of 1.4 °C (from 5.9 °C to 7.3 °C). This decrease became visible after 2013, when the above-mentioned decline in precipitation occurred. We can conclude that approximately 40% of the average decrease in runoff (160 mm when compared to the 1993–2013 and 2014–2022 periods) was related to the increase in temperature, while the decrease in precipitation accounted for the remaining 60%.
In the CEP catchment, the runoff volume was not measured, and values from adjacent LYS were used. Water yield similarity was tested using Cl
− concentrations in stream water, which is a hydrologically conservative tracer sourced mostly from precipitation (e.g., [
21]). No statistically significant differences were found for the entire observation period from 1993 to 2022 in stream water concentrations (ANOVA,). Thus, it can be assumed that the amount of annual runoff depths in both catchments is very similar. The distance between the two catchment outlets is just 2 km; the CEP is at a slightly higher elevation (
Table 1).
The average annual runoff from PLB was 266 mm, with the minimum (129 mm) recorded in 2014 and the maximum (451 mm) recorded in 2002. In contrast to LYS, there was no statistically significant decline in runoff during the observation period (
Figure 2b). The conditions for a decrease, i.e., rising temperatures and reduced precipitation, are the same as for LYS. However, the reason why runoff in the last decade did not decrease as dramatically as in LYS and CEP may be related to deforestation in the catchment. Due to bark beetle (
Ips typhographus) infestation, a significant portion of the catchment (approximately 50% [
28]) was deforested in the last decade. The loss of transpiration from overmatured spruce stands may have caused the reduction in runoff to be less severe than at LYS, where younger spruce stands continue to grow and transpire (
Figure 2). In mountainous regions of Central Europe, the forest dieback is usually accompanied by only a small increase in runoff. Kopáček et al. [
29] reported a 6% (70 mm) increase after complete dieback in the Norway-spruce forested Plešné Lake catchment (Bohemian Forest), but these data are from considerably higher elevations (1130–1350 m), where both precipitation and runoff are significantly higher than at PLB (690–804 m). Similar findings [
30] were published for the Bavarian Forest in Germany (Grosse Ohe, elevation 999 m a.s.l.), where forest dieback resulted in an 11% increase in runoff when 30% of the catchment was deforested. In areas where the evapotranspiration demands of spruces are similar to the annual runoff, the loss of ca. 50% of mature trees in a catchment can have a significant impact on runoff quantities. Additionally, the reduced canopy interception, which averages approximately 25% in GEOMON catchments [
21], could also help to explain the statistically insignificant trend in runoff observed in PLB.
4.2. Atmospheric Deposition
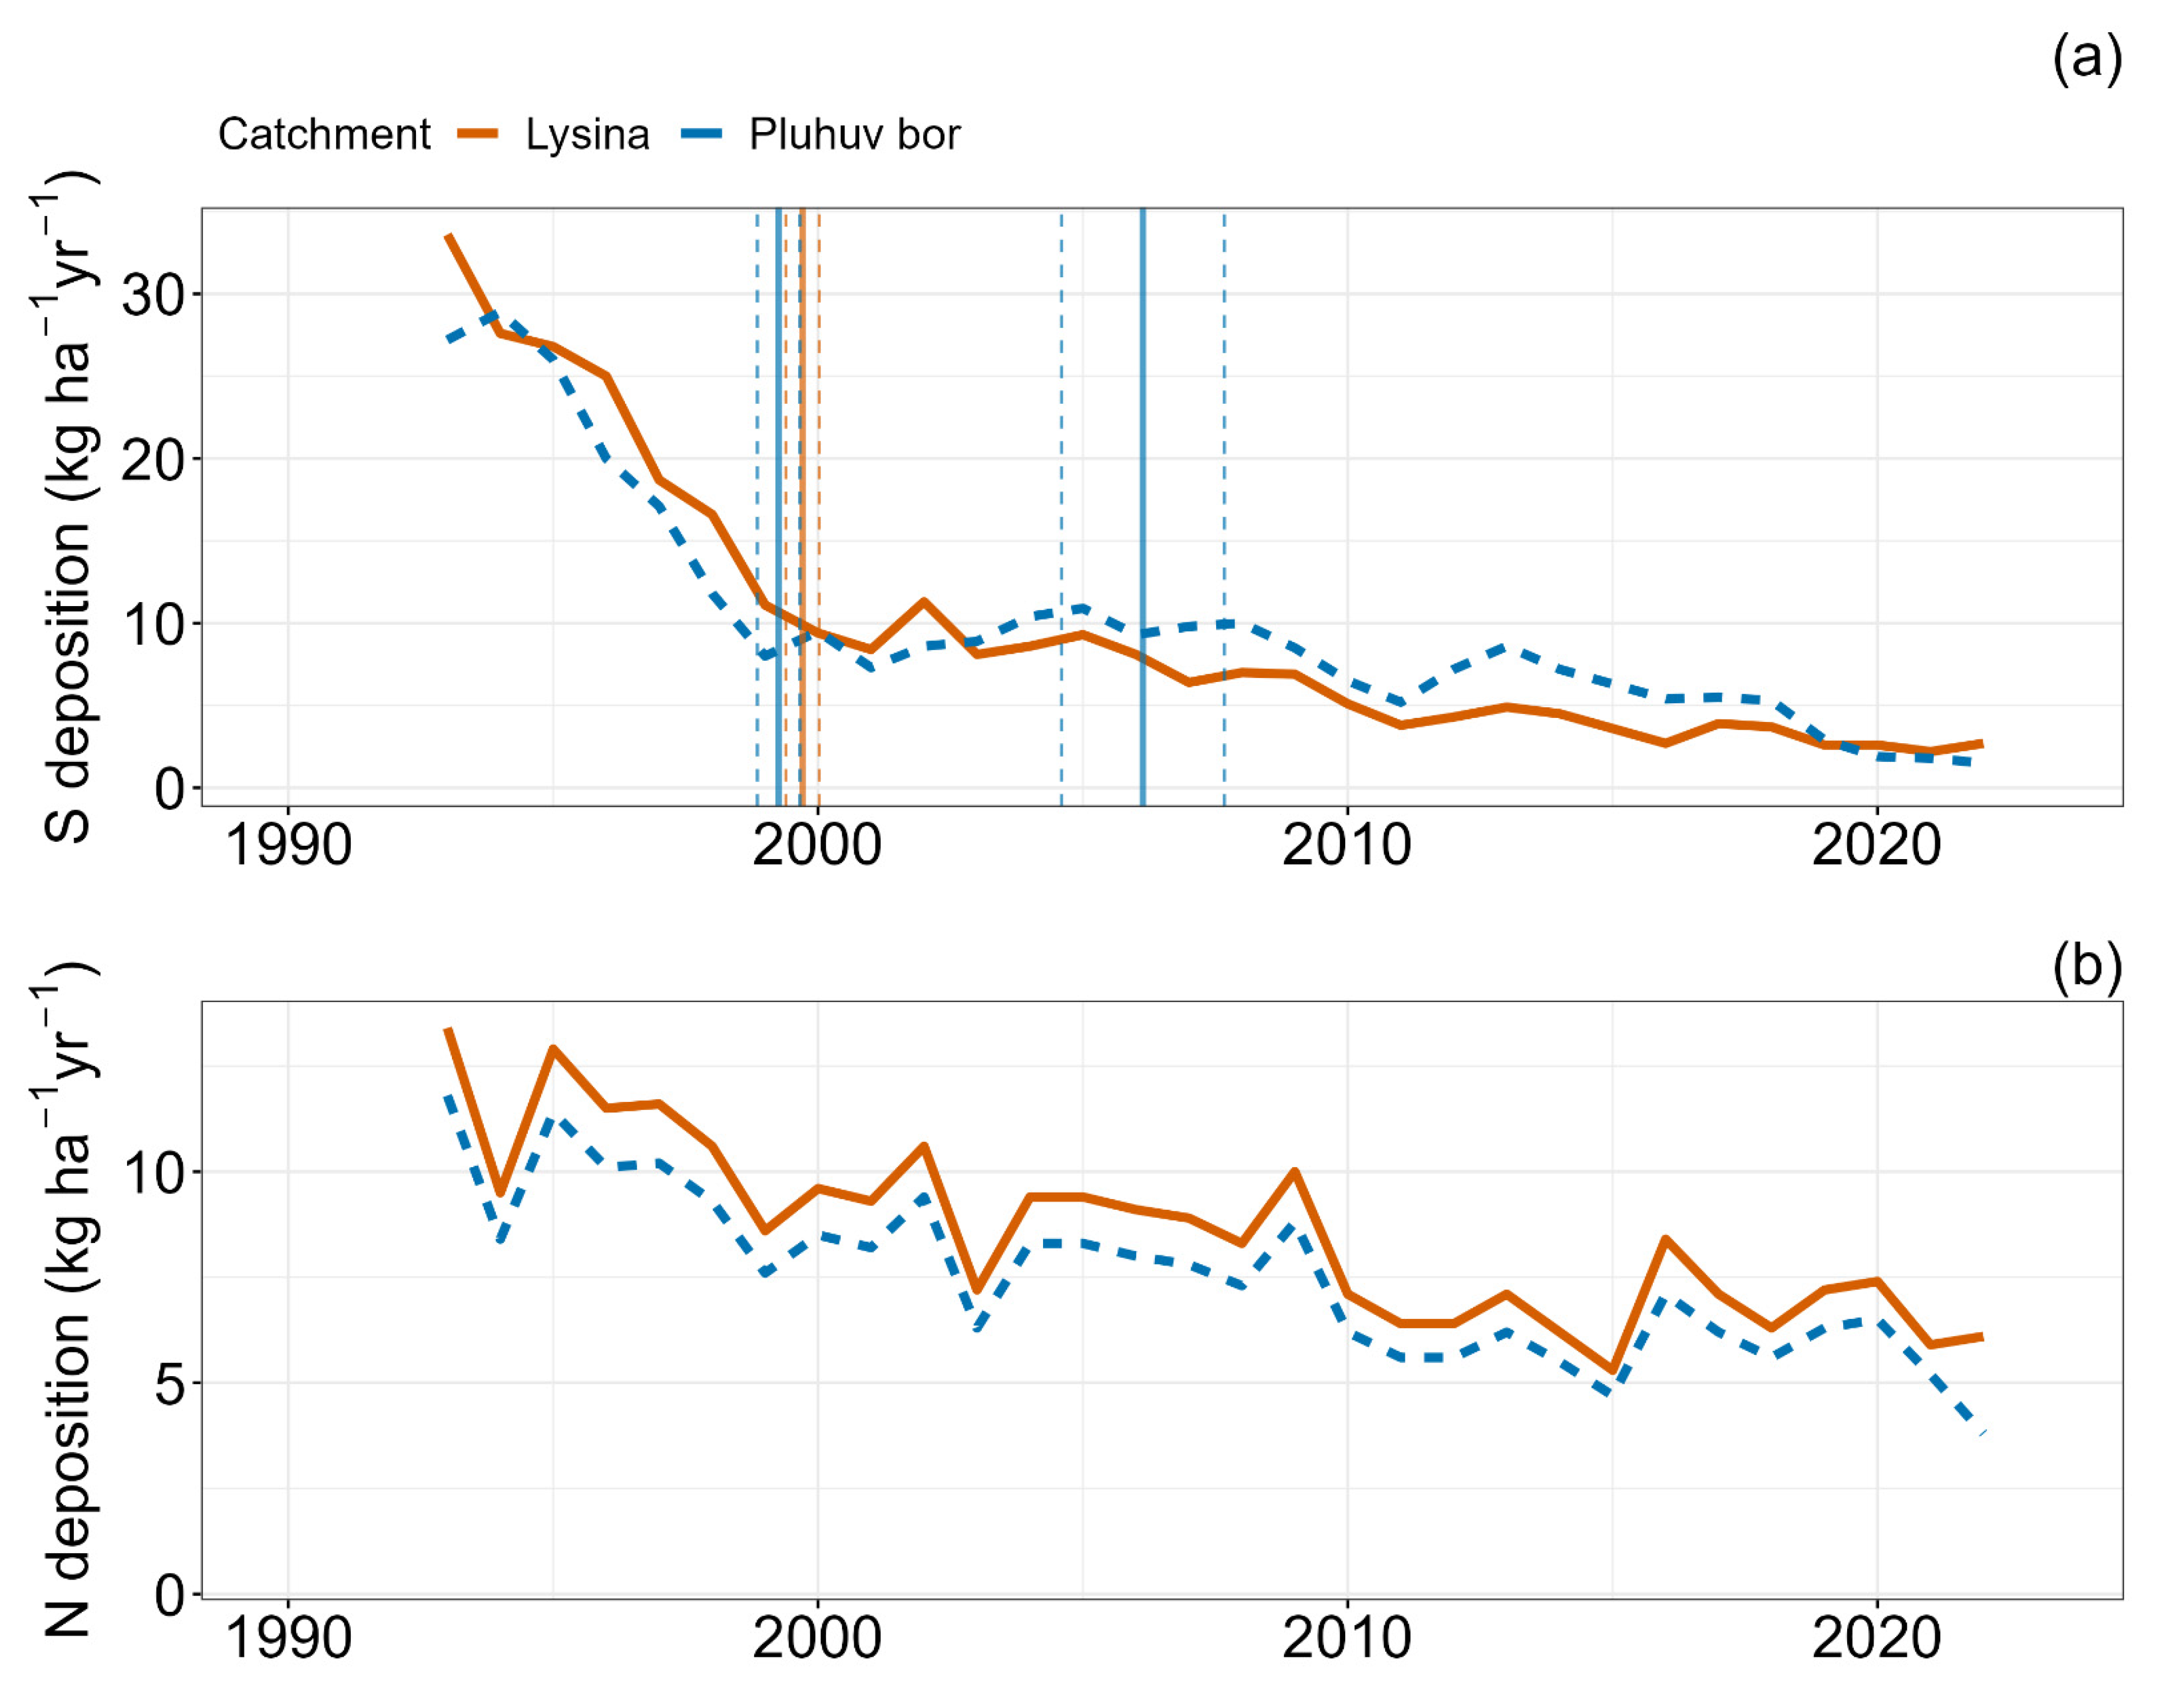
The measured atmospheric deposition of total sulfur (S) was 30–35 kg ha
−1 yr
−1 at LYS between 1993 and 1995 [
16] and declined to 2.2–2.7 kg ha
−1 yr
−1 in the 2020–2022 period (
Figure 3a). A very similar atmospheric deposition can be assumed for CEP, as the distance between catchments is only 1.5 km (
Figure 1). The sulfur deposition at PLB was 25–28 kg ha
−1 yr
−1 for the 1993–1995 period and declined to 1.5–1.9 kg ha
−1 yr
−1 in 2020–2022. The total deposition of sulfur thus declined by approximately 95% over our study period. Dissolved inorganic nitrogen deposition (DIN) showed much smaller declines (
Figure 3b). At LYS, the DIN deposition declined from 12–15 kg ha
−1 yr
−1 measured between 1993 and 1995 to 5–6 kg ha
−1 yr
−1 in recent years (2020–2022), and it decreased from 12–13 to 4–5 kg ha
−1 yr
−1 at PLB during the same time period.
The sulfur deposition decreased intensely prior to 1999 (PLB) and 2000 (LYS), when statistically significant breakpoints were detected (
Figure 3a), and then declined steadily until the present. At PLB, the breaking point was also recorded in 2006. The nitrogen deposition declined steadily the entire time.
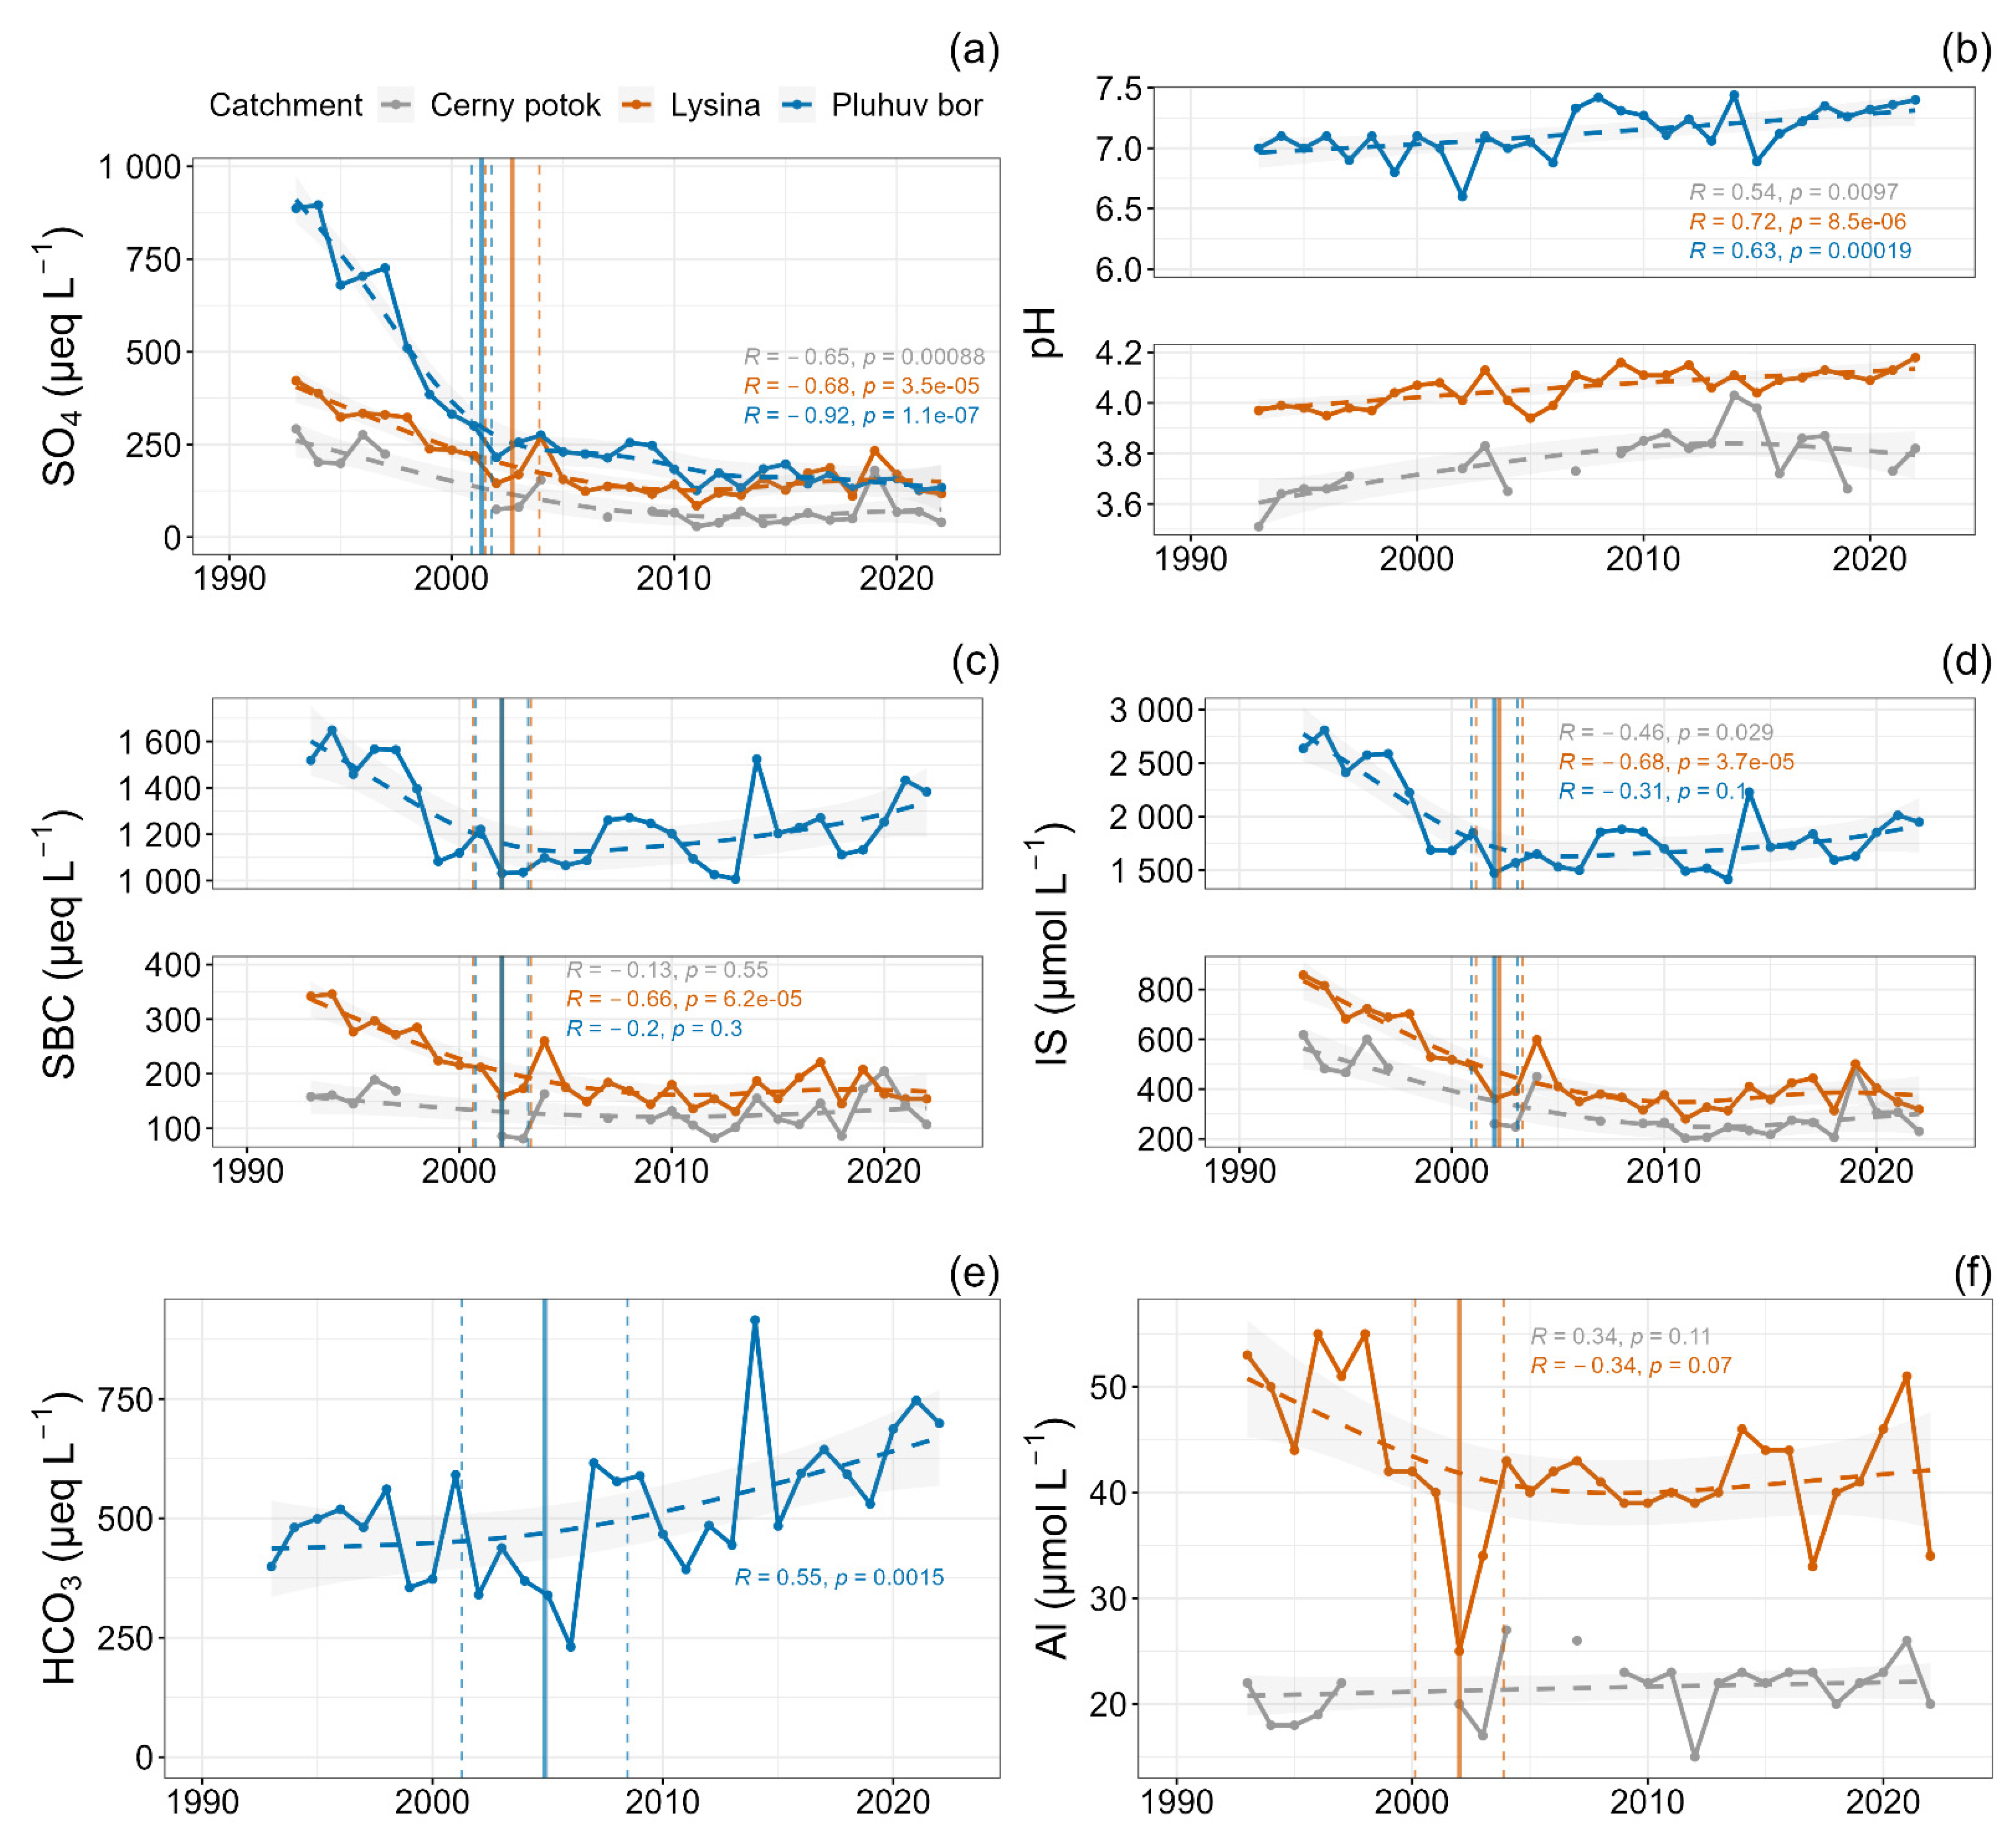
4.3. Stream Water Chemistry
Changes in the chemistry of surface waters are a key factor driving DOC changes. The most important was a decrease in sulfate (SO
42−), which followed a decline in atmospheric S deposition. Sulfate concentrations (
Figure 4a) declined sharply in the 1990s when the decrease in S deposition was most significant. A breakpoint was detected in 2003, three years after the S deposition breakpoint (
Figure 4a). At PLB, the SO
42− concentrations decreased in the 1990s at a rate of 60 µeq L
−1 yr
−1 from approximately 900 µeq L
−1 in 1993 to around 130 µeq L
−1 in 2022. A breakpoint was detected in 2001, only two years after the S deposition breakpoint (
Figure 4a). At LYS, the decline, due to lower initial sulfate concentrations, was smaller, from approximately 400 µeq L
−1 to 120 µeq L
−1. From around 2010, the trends in SO
42− concentrations in both watersheds (LYS and PLB) became similar, and after 2013, they even slightly increased. This is due to the declining runoff (see previous chapters) and likely similar desorption processes releasing sulfur adsorbed or organically cycled in soils [
31] during the previous period of high atmospheric deposition. The trend of SO
42− decline at CEP was similar to that at LYS, decreasing from approximately 300 µeq L
−1 to 40 µeq L
−1. The lower sulfate concentrations at CEP can be explained by minimal adsorption/desorption in the soils, as most of the catchment is covered by very well-drained peat with low sulfate adsorption and potential bacterial reduction capacity.
The concentrations of the sum of base cations (calcium, magnesium, potassium and sodium; Ca
2+ + Mg
2+ + K
+ + Na
+; SBC) decreased similarly to SO
42− concentrations (
Figure 4c) because the main source in stream water is ion exchange from the soil cation exchanger [
16,
23]. As the input of H
+ ions from atmospheric deposition decreased together with S, the leaching from the soil cation-exchanger also decreased (for more details, see [
23]). The breakpoints (2002 for both of catchments) corresponded very closely to SO
42− patterns (
Figure 4a,c). Similar to SO
42−, the SBC concentrations levelled off after 2010. At PLB, the anion concentrations have been increasing in recent years, not only because of the lower runoff but also due to the increased leaching of bicarbonate (HCO
3,
Figure 4e), which is associated with increasing pH (see below).
Due to the decrease in
2− deposition, the discharge-weighted annual mean pH of all three watersheds gradually rose (
p < 0.001 for LYS and PLB;
p < 0.01 for CEP), although in completely different ranges (
Figure 4b). No breakpoints were detected. PLB exhibited a pH above 6.6 with always positive HCO
3− alkalinity (
Figure 4e) and efficient buffering capacity. LYS was very acidic (annual values pH < 4.0 or around 4.0 during the 1990s), and during the 30-year recovery, the pH reached 4.2 in 2022. According to biogeochemical model predictions, the annual mean pH will not exceed 4.3 by 2050, which is still far from the estimated preindustrial pH of around 5.5 [
15]. CEP, as a peatland-dominated catchment without mineral soil, had an extremely low pH of 3.3 in 1993. Due to the rapid decline in SO
42−, the pH slightly increased to values around 3.8 shortly after 2000. However, it has slightly declined since 2016, with no clear explanation. Such low pH is due to the acid-base properties of humic and fulvic acids [
18,
32,
33], which effectively prevent the pH from further rising.
Ionic strength (IS;
Figure 4d) is a parameter that characterizes the total amount of dissolved solutes and their charges in solutions. It is an important characteristic regulating the solubility of organic molecules [
6,
7,
8]. The IS decreased significantly (as did the concentrations of all dissolved substances from which it is calculated) until around 2010, with a breakpoint in 2002. Since then, it has slightly increased, mostly due to a decrease in pH (CEP) and rising Al levels (CEP and LYS). At PLB, a more significant increase is visible due to rising concentrations of SBC and HCO
3 (
Figure 4c,e).
The total dissolved aluminum (
Figure 4f) decreased at LYS due to an increase in pH, exhibiting a break in 2002 similar to that observed for other solutes. Conversely, the CEP maintained stable aluminum concentrations, likely due to high and consistent DOC concentrations that bind aluminum to organic complexes. The aluminum concentrations at the alkaline PLB site were consistently very low (<5 µmol L
−1). The synchronous break in solute concentrations (BC, Al, IS) in 2002 could potentially be explained by the unusual solute dilution. In 2002, a major summer flood took place, resulting in the largest water runoff of the year (
Figure 2c).
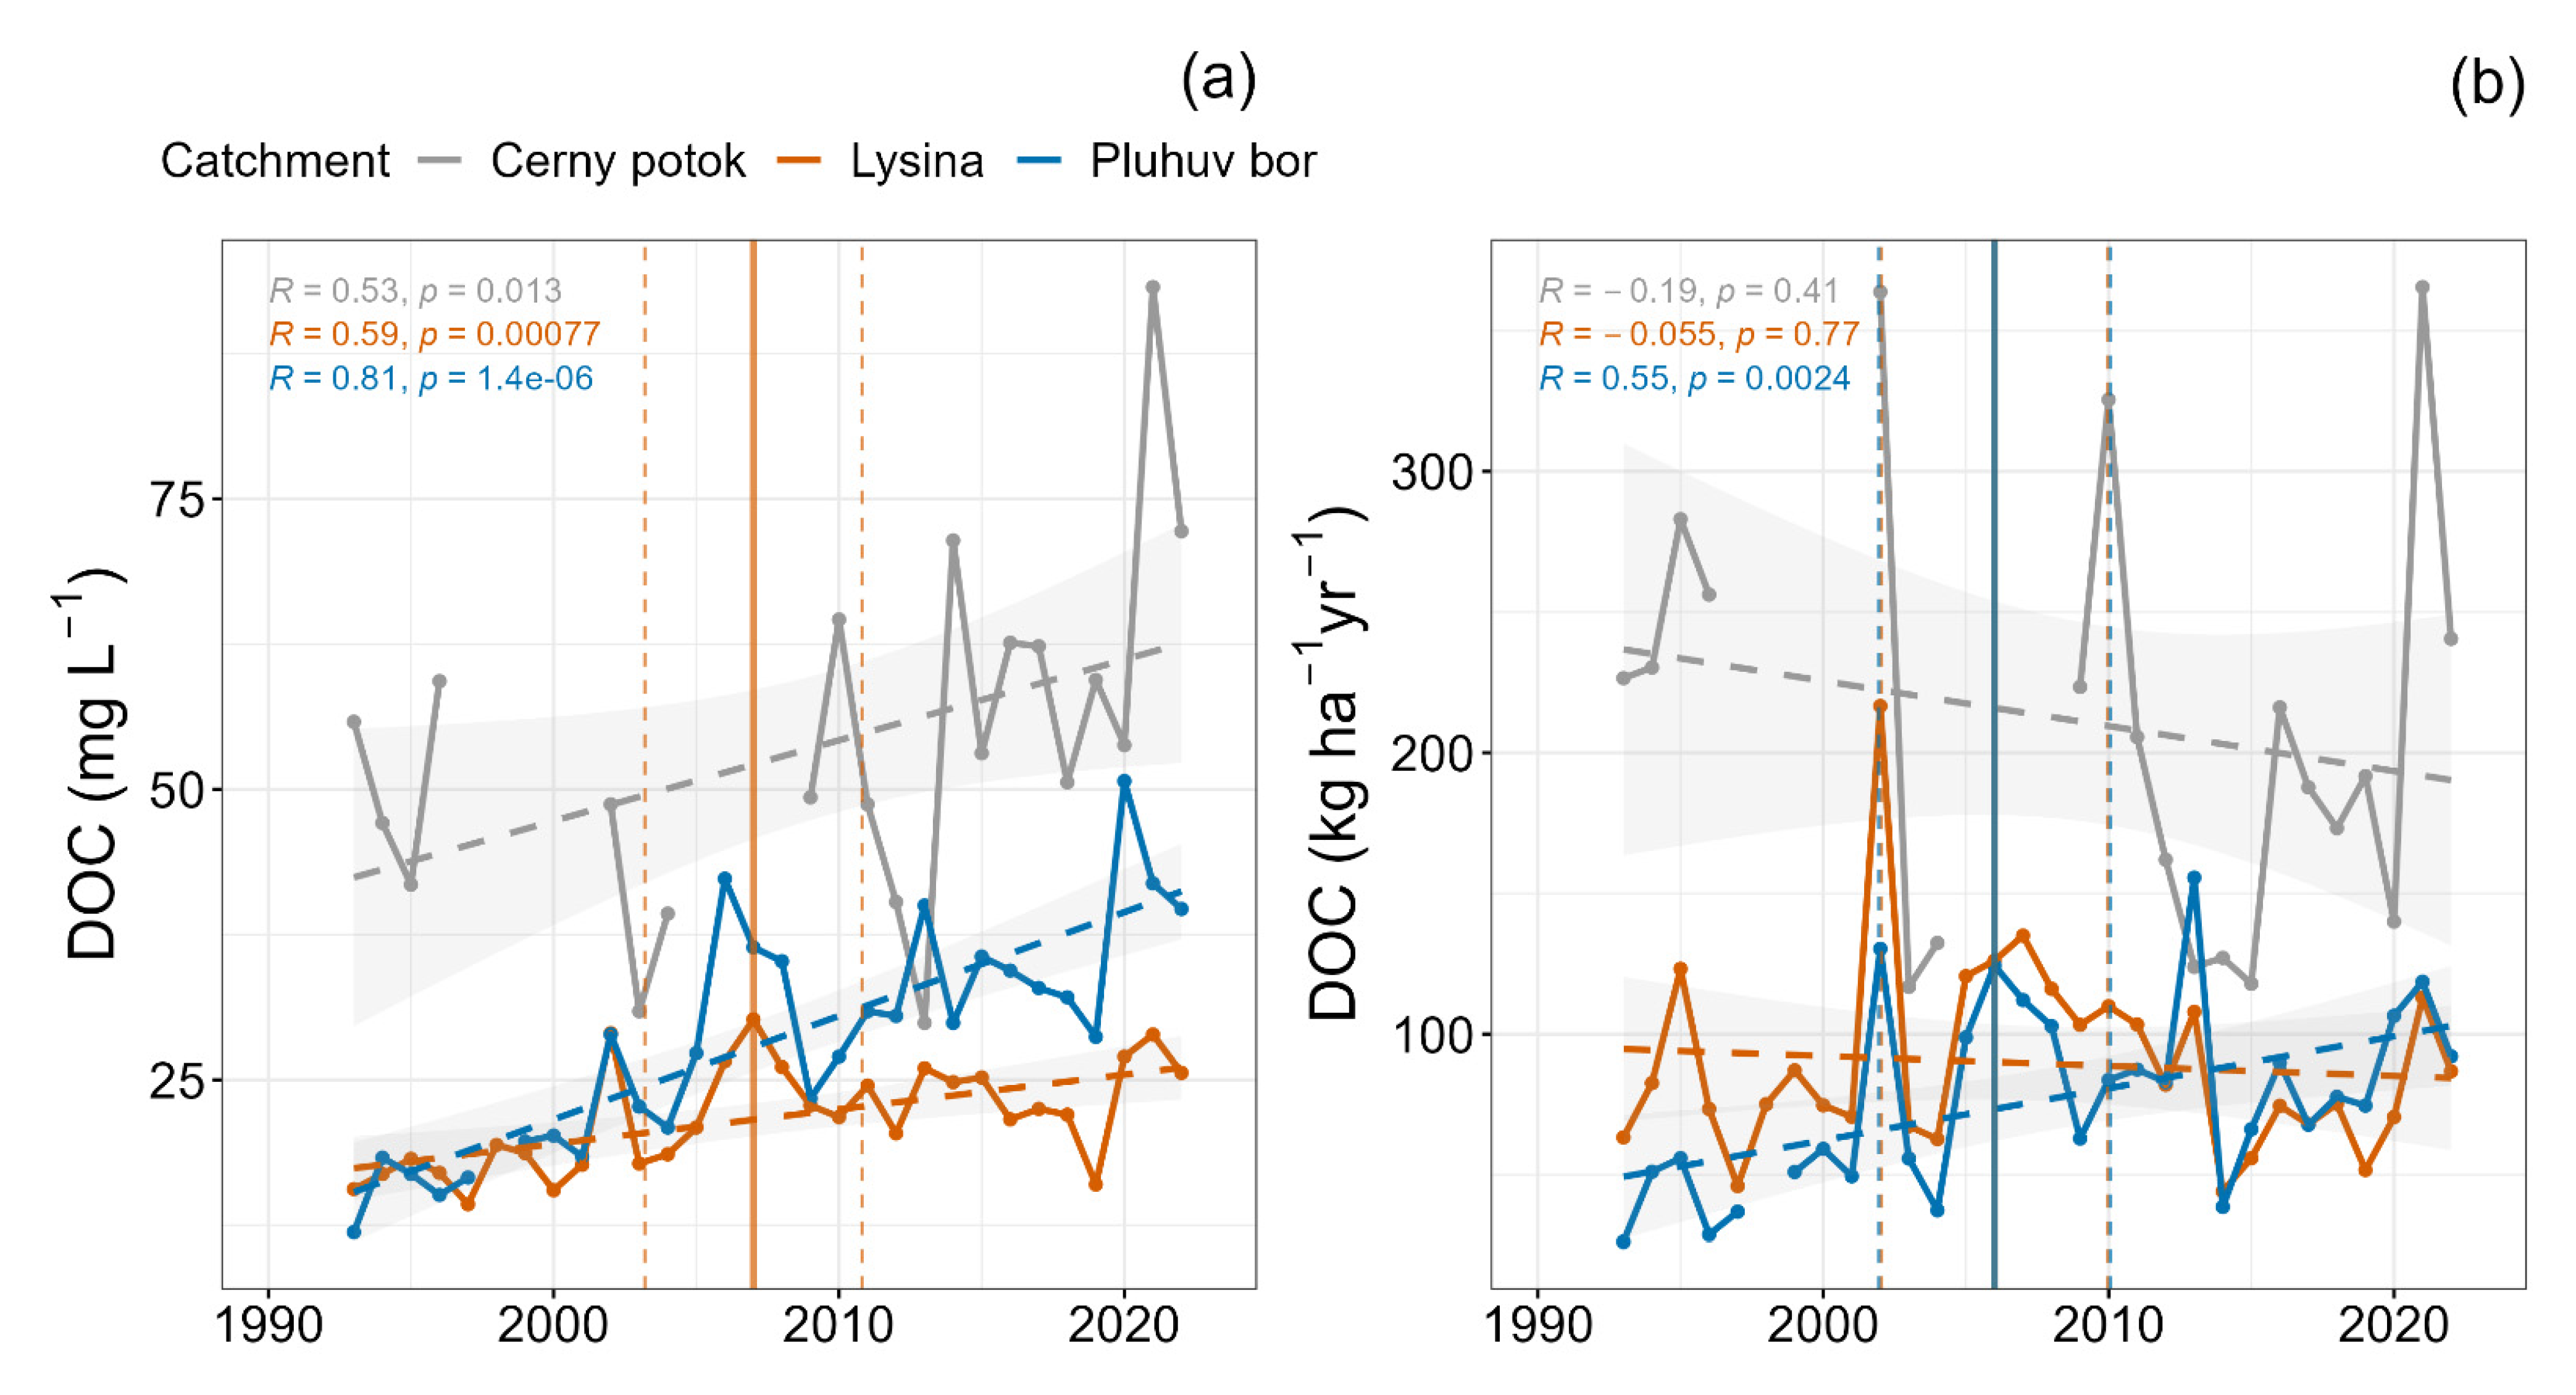
4.4. DOC Concentrations
The most pronounced increase in stream water DOC concentrations (discharge weighted annual means) was observed at alkaline PLB. Over 30 years, DOC concentrations increased from 15.7 mg L
−1 (1993–1995 average) to 36.7 mg L
−1 (2020–2022) (
Figure 5a), representing an annual increase of 0.89 mg L
−1 yr
−1 (
p < 0.001). The most acidic CEP showed an increase from 48.2 mg L
−1 to 68.3 mg L
−1, i.e., an annual increase of 0.69 mg L
−1 yr
−1 (
p < 0.05). The acidic LYS exhibited an increase from 16.9 mg L
−1 to 25.4 mg L
−1 for the same period. The annual increase there was 0.30 mg L
−1 yr
−1 (
p < 0.001). The PLB exhibited an enormous increase of 131% compared to that of the 1993–1995 period. Analogously, the increase at CEP corresponded to 42% and that at LYS corresponded to 50%. A breakpoint in DOC concentrations was only detected at LYS (in 2007), whereas PBL exhibited a monotonic upward trend throughout the observed period.
Nevertheless, the relative increase in ΔDOC (annul rise of concentration per mg DOC) was not proportional to the initial stream water concentration. The largest increase of 0.031 mg DOC per mg DOC yr−1 was detected at PLB, followed by that at LYS (0.014 mg DOC per mg DOC yr−1) and CEP (0.013 mg DOC per mg DOC yr−1).
The increase in concentrations is, therefore, the highest in both relative and absolute terms in the alkaline PLB catchment. This catchment has never experienced acidification in terms of a decrease in surface runoff pH (
Figure 4b) beyond the buffering capacity of HCO
3−. In contrast, LYS, which is strongly anthropogenically acidified, also experienced a significant increase in DOC concentrations. In both catchments, the most significant predictor of DOC growth is the reduction in ionic strength (IS) due to the decline in acidic deposition, followed by a subsequent decrease in IS (
Figure 6a), primarily due to declining SO
42− concentrations (
Figure 4a). This mechanism operates in both alkaline and acidic catchments and is independent of the acid-base character of the catchment environment [
6].
The observed DOC concentrations increase at PLB is robust and monotonic (
Figure 5a). At LYS, an increase in DOC was observed until 2007, after which the trend flattened but did not decline, despite a statistically significant runoff reduction after 2013 (
Figure 2c). Nevertheless, considering the entire interval from 1993 to 2022, the increase in DOC remains statistically significant (
Figure 5a). Therefore, it is evident that the decrease in IS due to the extremely large reduction in atmospheric S deposition (
Figure 3a), which dropped from values > 30 kg ha
−1 yr
−1 to values < 2 kg ha
−1 yr
−1, remains the primary cause of the DOC increase.
In the case of PLB, it likely represents the highest recorded increase in DOC (0.89 mg L
−1 yr
−1) in temperate and boreal forest catchments, while a three-times lower increase at LYS still exhibits a very high rate of an increase (0.30 mg L
−1 yr
−1). Garmø et al. [
3] analyzed extensive datasets from the ICP Water program in Europe and North America, divided into several eco-regions. The highest increase (Sen slope for the period 1990–2016) of 0.11 mg L
−1 yr
−1 was observed in southern Scandinavia. The DOC increase was strongly correlated with trends in S deposition and was more pronounced in the 1990s than after 2005. Similar conclusions were presented by de Witt et al. [
5]. A database of 426 undisturbed headwater lakes and streams in Europe and North America was divided into two intervals—1990–2004 and 2006–2016. In the first interval, the dominant controlling variable was the decline in atmospheric deposition, followed by a decline in IS (90% explained variability), while in the second period, the chemical drivers accounted for only 55%. Changes in hydrology (increased flow) explained approximately 40%, and temperature increases accounted for 5% of the observed changes. Monteith et al. [
7] also confirmed changes in IS in precipitation, soil, and surface waters as the main reason for the DOC increase in watersheds in the United Kingdom, Norway, Sweden, and the Czech Republic. Similar conclusions were drawn by Lawrence and Roy [
4] for the Adirondack region in the northeastern United States. On the other hand, a halt in the DOC concentration increase has been observed in most of Sweden after 2010 [
34]. One of the significant factors that can lead to increased DOC concentrations is afforestation [
35] because it increases the extension of forest soils with humic and fulvic acid production. However, in the case of the studied catchments, there has been no afforestation (PLB has even experienced partial deforestation) or an increase in flows, which are considered important factors for the DOC increase in Scandinavian studies.
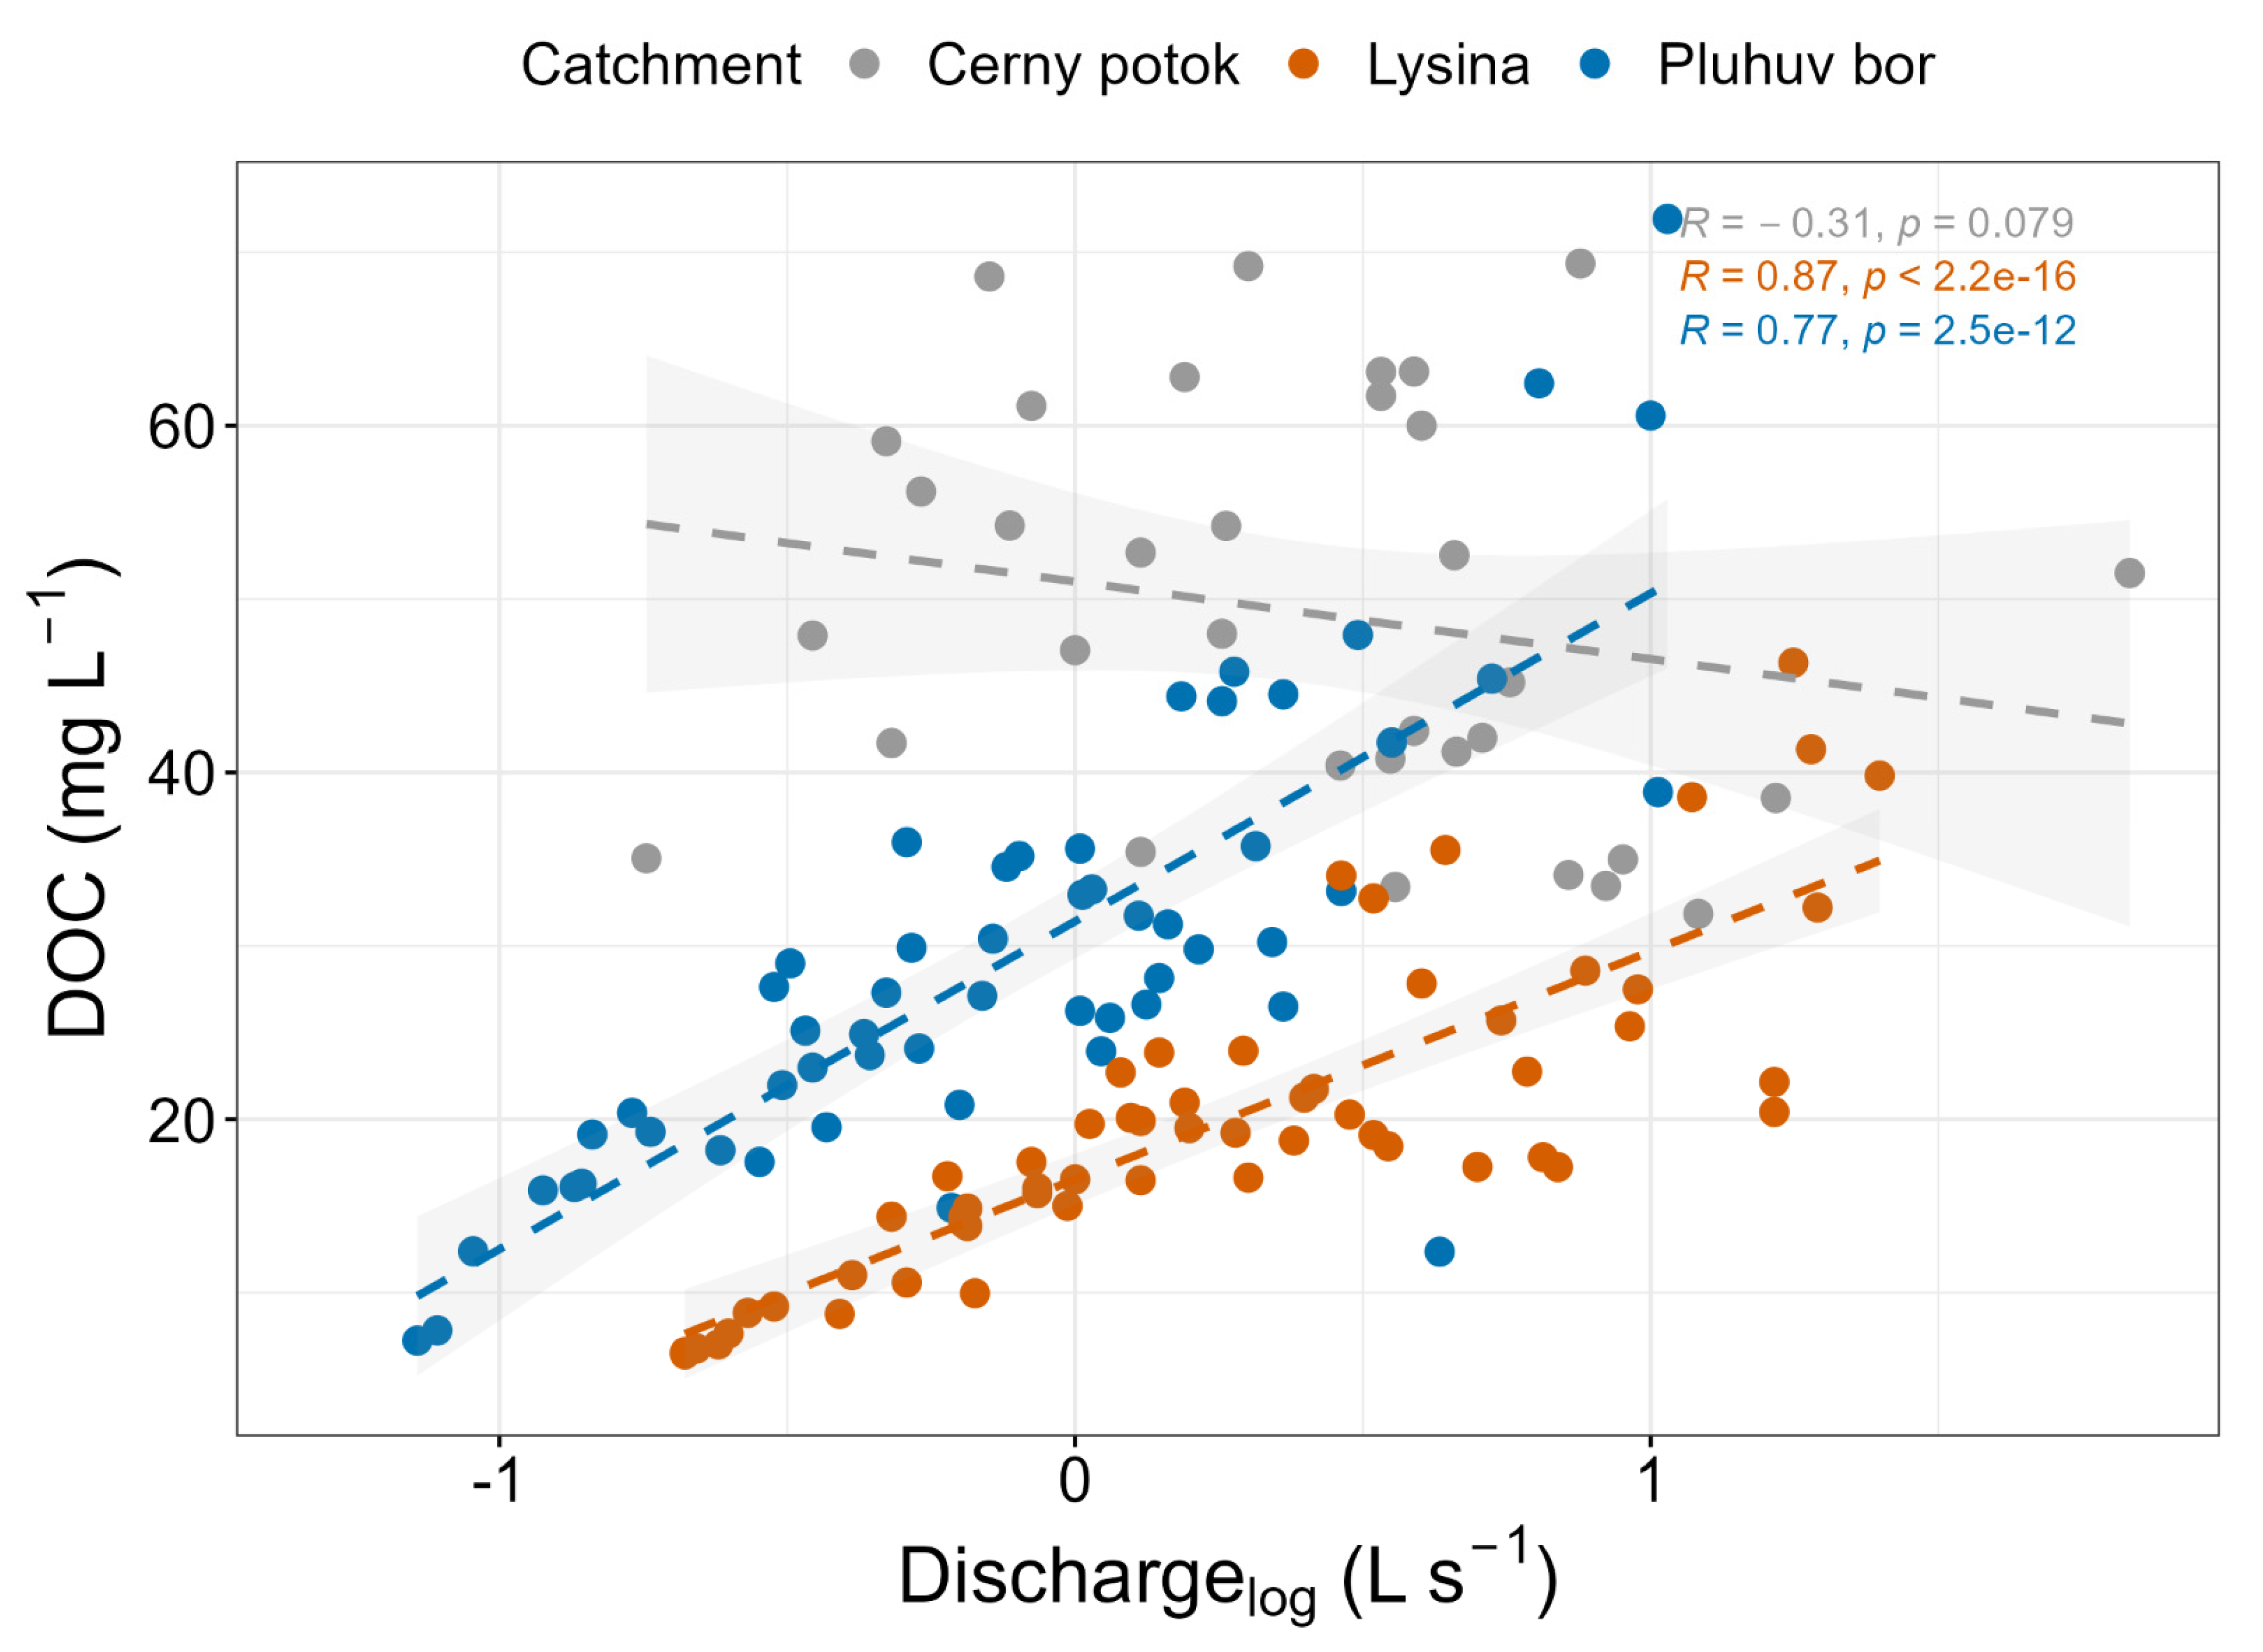
At CEP, the observed increase in DOC concentrations cannot be explained by decreasing ionic strength (IS) or SO
42− (
Figure 6a,b). The peat that forms most soils in the catchment has virtually no mineral horizons, and runoff is generated directly within the peat. The applicability of the Debye–Hückel theory in peat is likely limited due to the absence of potential adsorption structures where coagulated humic acids might be retained. However, an increase in DOC concentrations can be explained hydrologically. In the PLB catchment, DOC concentrations rise sharply with increased flow (
Figure 7), while in LYS, this increase is somewhat smaller. Conversely, in the CEP peatland catchment, DOC concentrations decrease (not statistically significantly) with increasing flow (
Figure 7). PLB and LYS are catchments with typical forest soil profiles, where shallow organic soil layers overlay mineral substrates. Therefore, when the water table increases after rainfall events, there is a greater mobilization of organic compounds from the temporarily water saturated organic soil horizons.
In contrast, at CEP, which primarily consists of a 5-m-thick layer of peat, water is diluted within the peatland after rainfall or snowmelt, resulting in a decrease in DOC concentrations in surface runoff (
Figure 7). Similar trends have been observed in peatland catchments in northern Sweden (e.g., [
32]). This is consistent with the relatively low increase in the relative concentration at CEP because the relative increase in ΔDOC was only 0.013 mg DOC per mg DOC per year. This increase is much smaller than that observed at LYS and PLB dominated by mineral soils. De Wit et al. [
5] observed a linear increase in ΔDOC with a median DOC stream concentration, and such a small ΔDOC is typical for the median stream water DOC concentrations around 10 mg L
−1. This means that CEP, where the average DOC concentration is around 50 mg L
−1 (
Figure 7), differs from ordinary catchments, and its observed increase in DOC concentrations is driven by changes in hydrology associated with reduced precipitation and increasing temperatures during the last decade.
4.5. DOC Fluxes
Calculations of annual element fluxes are influenced not only by the total amount of runoff but also by the relationship between the concentration of DOC and flow (
Figure 7). The decrease in water runoff after 2013 (
Figure 2c) and, consequently, the higher frequency of lower flows imply a higher occurrence of lower DOC concentrations for LYS and PLB. However, in the case of the peatland-dominated CEP, the opposite trend is observed, with a higher frequency of higher DOC concentrations during lower flow periods contributing to the increase in average DOC concentrations (
Figure 7).
As a result, the long-term trends in DOC fluxes in all three catchments exhibit distinct characteristics. In the alkaline PLB, where the increase in concentrations has been consistently the highest over time, and where changes in the catchment runoff have not shown statistical significance over time, there has been a statistically significant increase (
p < 0.01) in the DOC export (
Figure 5b). This increase has gone from approximately 44 kg ha
−1 yr
−1 (average for the years 1993–1995) to roughly 2.5 times that amount, 106 ha
−1 yr
−1 in the years 2020–2022. This increase is proportional to the rise in stream water DOC concentrations, and similarly high increases in the DOC export have not been published according to our knowledge. The maximum values were reached in the years 2002 (128 kg ha
−1) and 2013 (155 kg ha
−1), both with highly above average annual runoffs. The lowest value, 32 kg ha
−1, was recorded in the first year of observation in 1993 during a period of very low water flows and the lowest average DOC concentrations.
The DOC flux from LYS and CEP between 1993 and 2022 has not changed significantly (
Figure 5b), despite statistically significant increases in DOC concentrations. LYS exhibits large variability (
Figure 5b), fluctuating around an average value of 90 kg ha
−1 yr
−1. The highest export (except for 2002) occurred approximately between 2005 and 2013, with the average reaching 112 kg ha
−1 yr
−1. This corresponds to both increased DOC concentrations and a not yet reduced runoff (
Figure 2a). However, after 2013, due to drought and reduced precipitation (
Figure 2b), there has been a substantial reduction in flow (
Figure 2c), and this hydrological change has led to a significant decrease in the DOC export. The average for the years 2014–2020 was even lower than in the early 1990s, reaching only 63 kg ha
−1 yr
−1. From 1993 to 2001, the average export was 77 kg ha
−1 yr
−1. An extremely high DOC export (217 kg ha
−1 yr
−1) was recorded in 2002 due to exceptional summer floods that increased the annual water flow to highly above average, 747 mm. The years 2021 and 2022, with a slight increase in annual runoff after seven dry years (
Figure 2c), pushed the DOC export back to around 100 kg ha
−1 yr
−1 (
Figure 5b).
The highest, but also the most variable, DOC export comes from the peatland-dominated CEP catchment (
Figure 5b). The average value for the period 1993–2022 is 210 kg ha
−1 yr
−1. However, these fluxes vary greatly, ranging from 747 kg ha
−1 yr
−1 in the flood year of 2002 to a minimum of 178 kg ha
−1 yr
−1 in the extremely dry year of 2014. Because the water flow is the same as at LYS, CEP mirrors the overall trend. The catchment was not sampled in 1997–2001 and 2005–2008, which is why the statistical parameters differ slightly from those of LYS.
The observation that riverine DOC fluxes did not change or are declining is not typical for ecosystems recovering from acidification. De Wit et al. [
5] estimated that riverine DOM (Dissolved Organic Matter) export from northern ecosystems increased by 27% from 1990 to 2016. This applies to both European (mostly Scandinavian) catchments and catchments in North America. The runoff did not decrease in these regions, and thus, the increase in DOC fluxes was driven by rising DOC concentrations. Similarly, Monteith et al. [
7] mentioned increased flows as one of the factors explaining the higher DOC export in the United Kingdom. In the Adirondack catchments in New York State, Lawrence and Roy [
4] also did not observe a reduction in water flow despite the long-term increase in DOC concentrations. In contrast, Oulehle et al. [
21] reported the same trend as the one seen at LYS and CEP for 14 catchments of the GEOMON network (Czech Republic), meaning there were no statistically significant changes in DOC fluxes due to the reduced water flow after 2013.
Central Europe seems to be a region where changes in hydrological patterns lead to different trends than those typical for northern North America and northern Europe. PLB, where surface runoff likely increased due to recent deforestation, represents an exception to the general trend described in Central Europe.
4.6. Bedrock Geochemistry
All experiments and observations assessing the impacts of acidification on DOC production were conducted in ecosystems sensitive to acidity or anthropogenically acidified environments (e.g., [
1]). In these settings, recovery from acidification was associated with either a decrease (during recovery) or an increase (during acidification) in IS. Therefore, it is challenging to determine whether the observed changes in stream water DOC in these systems result from acidification-induced alterations in aluminum and pH or if these changes solely reflect variations in ionic strength.
Our study catchments offer a unique opportunity to differentiate between the effects of reduced acidity and changes in IS on DOC stream concentrations. Over the past 30 years, all three catchments have experienced reduced inputs of acids and IS. However, the well-buffered soils at serpentinite PLB have prevented any significant decline in stream water pH (
Figure 4b). Incoming acids from the atmosphere were buffered by exchangeable Mg
2+ weathered from the serpentinite bedrock (
Table 1 and
Figure 4c), resulting in consistently high stream pH but decreasing ionic strength over time (
Figure 4d). In contrast, the nearby LYS catchment, which is base-poor, has exhibited a modest decrease in stream acidity in response to decreased inputs of acidic deposition.
Despite changes in stream DOC concentrations occurring in both the acid-insensitive and acid-sensitive mineral-soil-dominated catchments, variations in IS alone appear to be the primary driver of DOC concentrations in these areas. The decrease in IS in these catchments was mainly due to declines in SO
42− and divalent cations (Ca
2+ in granitic LYS and peaty CEP and Mg
2+ in serpentinic PLB), while dissolved Al
n+ had a minor impact. This is evidenced by only slight decreases in aluminum concentrations, particularly in acidic LYS, despite its high initial concentrations (
Figure 4f). Peaty CEP, with a limited contact of surface water with the regolith in the ombrotrophic peat bog, did not show any trend in dissolved Al concentrations (
Figure 4f). Although H
+ decreased (pH increased) moderately at LYS and CEP, H
+ changes were negligible at the alkaline and high-pH PLB. Dissolved aluminum remained low (<5 µmol L
−1) and unchanged over time in the high-pH stream water at PLB (
Figure 4b), indicating that changes in pH and aluminum cannot explain the significant increase in DOC observed there. We conclude that the geology of all three catchments did not play a significant role in the observed DOC trends.


