Balancing the basic function of wave prevention and disaster reduction with ecological functions such as waterfront accessibility and scenic qualities poses a significant challenge in the optimization of seawall cross-section profiles. A sloping seawall with composite slopes and a berm can effectively address this contradiction. The benefit of a berm is that the equivalent slope angle becomes smaller, which reduces wave overtopping and leads to a lower required crest level [
41]. As shown in
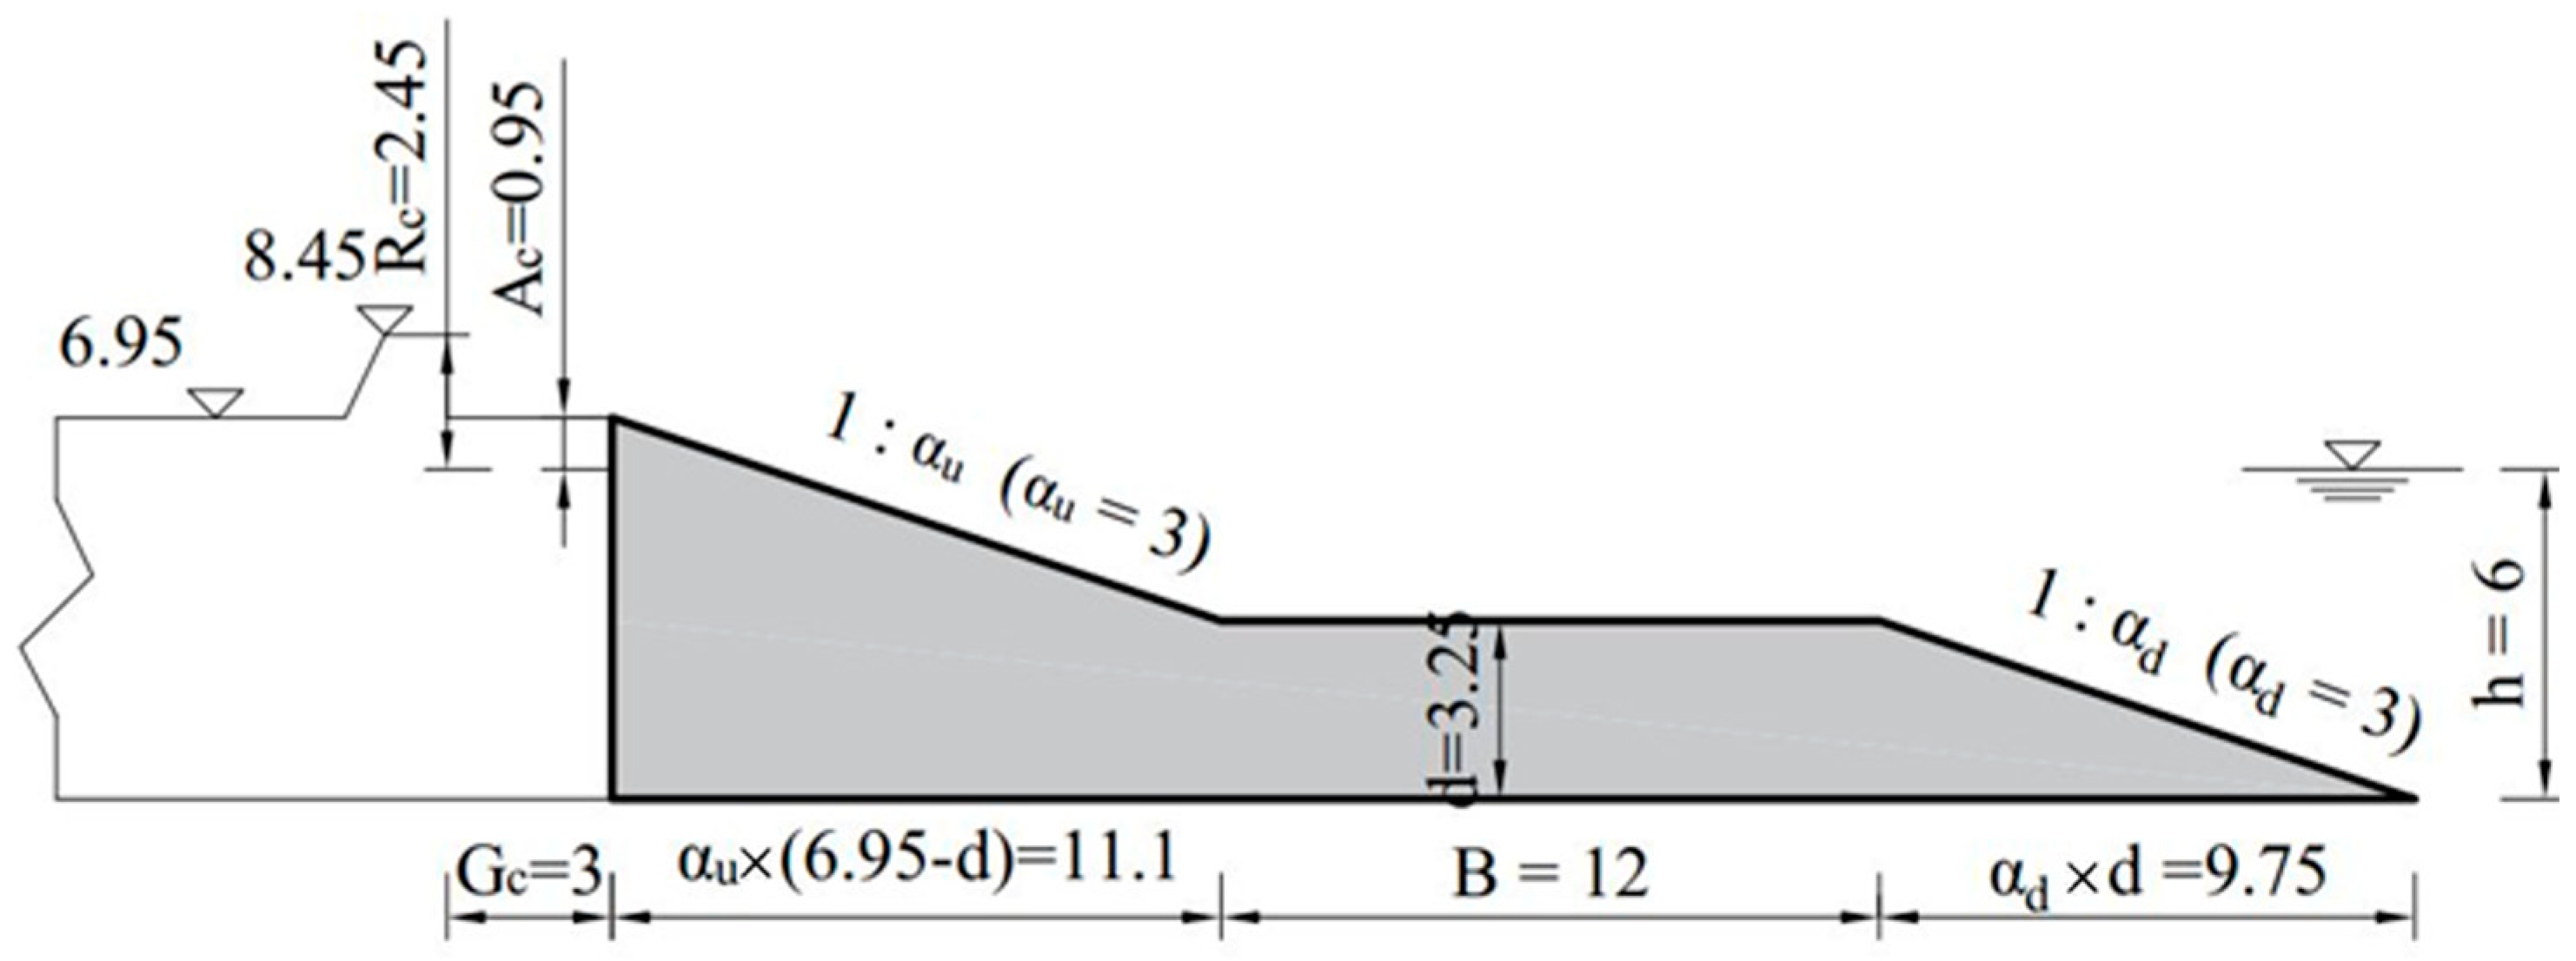
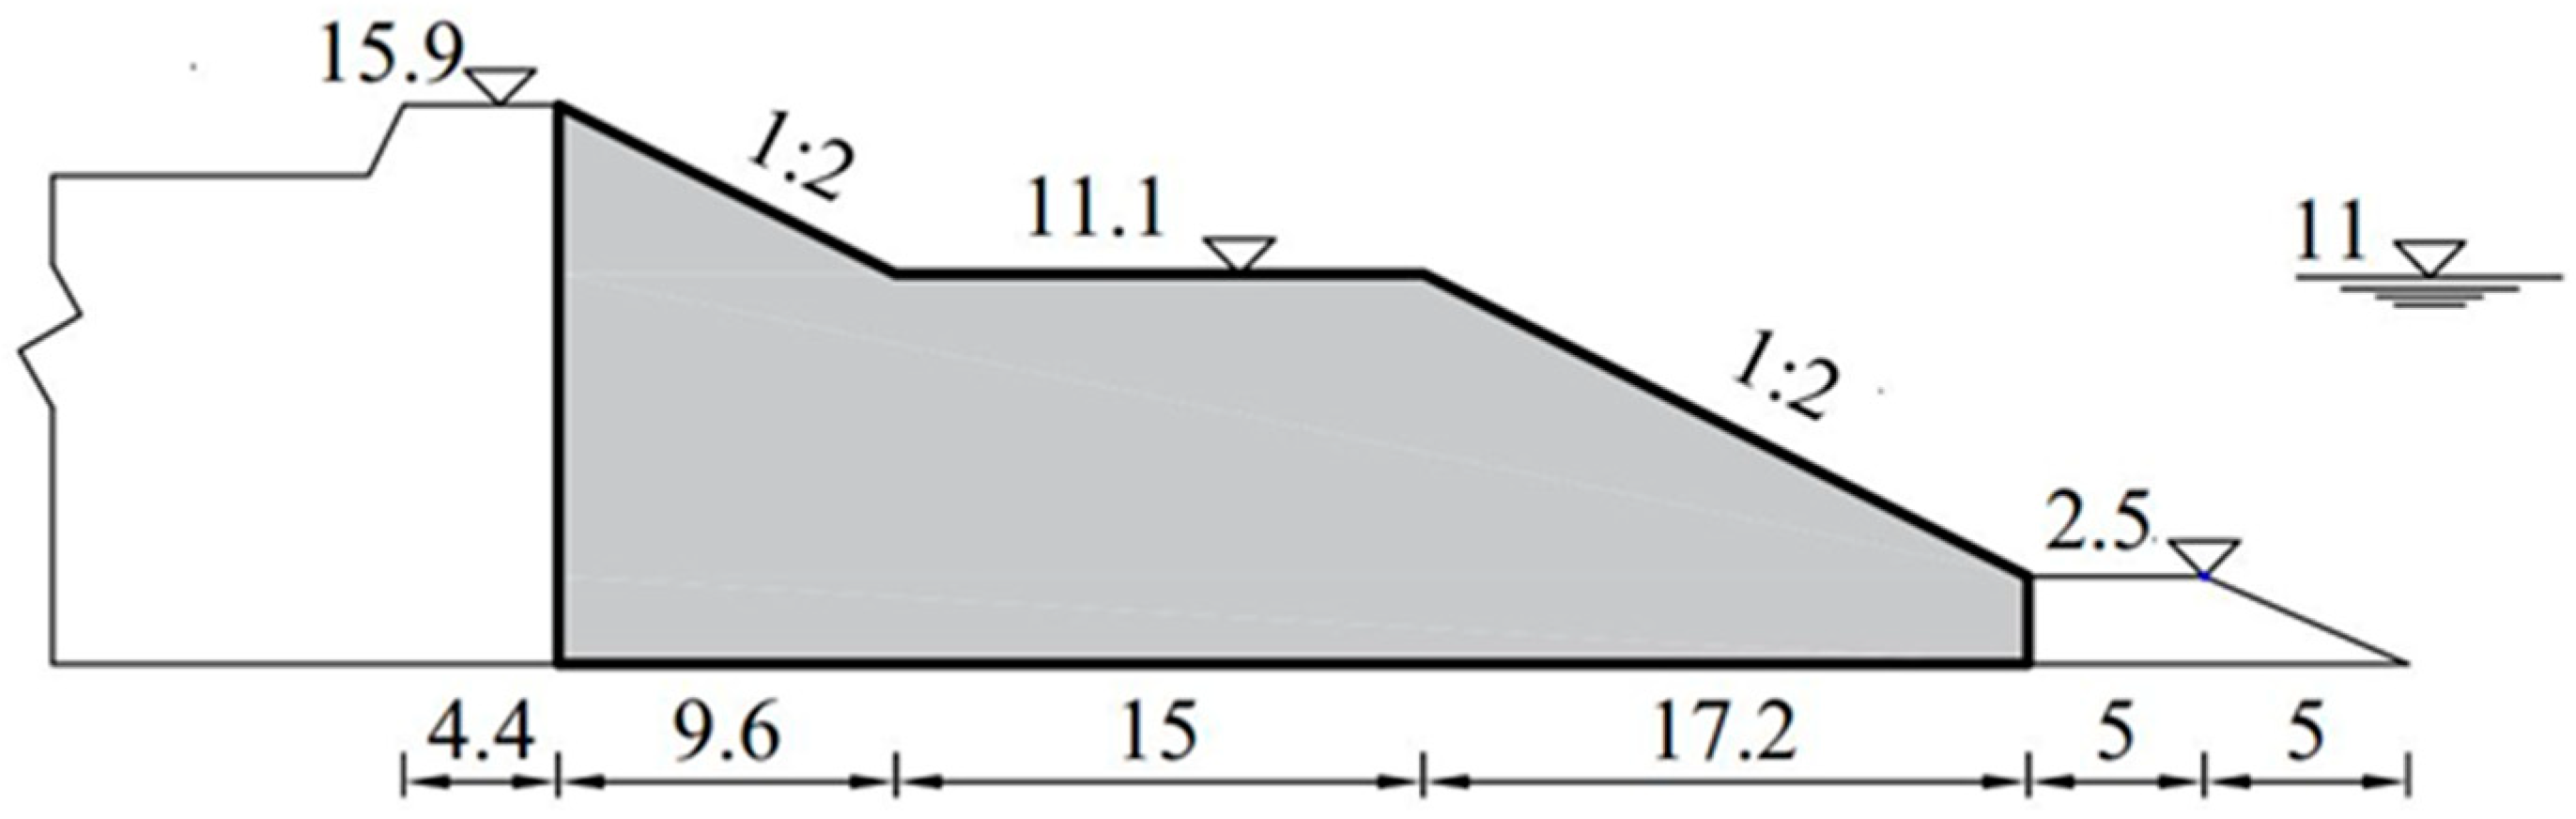
Figure 2, we will use this type of seawall as an example to validate our methodology and conduct specific optimizations for this cross-section. In order to preserve the coastal view and enjoy the picturesque scenery of “wide expanse of sea and sky, with sails in full view”, we will maintain a fixed crest elevation for the seawall. However, there are various factors that affect wave overtopping discharge. For the seawall with a berm, the key to achieving the best wave dissipation efficiency lies in determining the optimal berm height and width, and the slopes of the berm. Therefore, as
Figure 2 shows, we will only focus on the main structure (the shaded area within the black bold line border) of the seawall for the optimization. Here,
are the cotangent of angles with respect to the horizontal direction of downslope and upslope, respectively. B is the width of the berm and d represents the height of the berm. The four decision vectors are all independent from one another. In contrast to the decision vectors, the design parameters are fixed in the whole optimization process, as given by designers, including wave conditions and structure characteristics, which are essential and indispensable in the design process. These parameters remain consistent with those used for original cross-section configuration of the seawall in a coastal area of China (
Figure 2; the original cross-section configuration will be compared with our optimization solution in the following
Section 3.3).
Table 1 presents the specified value of design parameters used in our optimization problem. According to EurOtop, 2018 [
41], for two layers of rock on an impermeable core, the roughness factors for the downslope,
, and the upslope,
, are both 0.55.
3.1. Multi-Objective Optimization
The mean overtopping discharge is widely accepted as a primary design criterion for assessing the performance of seawalls. At the same time, the construction cost is also the focus of optimization considerations. Therefore, both construction cost and overtopping discharge are taken as the optimization objectives in this paper. The goal is to find a solution that minimizes the construction cost while also keeping the wave overtopping discharge as low as possible. By considering both objectives simultaneously, we can strike a balance between the seawall’s effectiveness in mitigating wave overtopping and the economic feasibility of the solution. The multi-objective functions for determining the optimum variables of the seawall are shown as Equations (1)–(5).
where
represents decision vectors,
is the dimensionless form of the mean wave overtopping discharge,
is the dimensionless form of construction costs,
is the objective function,
is the cost function,
is the overtopping function, obtained from the ANN model,
is the maximum value of the
, and
is the minimum value of the
. Obviously,
(This is the value of the ideal state). Similarly,
is the maximum cost function, while
is the minimum one.
is the work amount for different parts and
is their unit price. For brevity, we assume that the cost function only relates to the amount of work as we consider a consistent unit price for each component. In practical applications, designers can adjust this function according to actual situations.
and
are adjustable coefficient used to weight cost,
, and overtopping discharge,
.
When optimizing the seawall cross-section, there are virtually infinite possible combinations within the range of decision vectors. Indeed, it is impossible to identify all the solutions. However, we can determine the solutions under extreme states based on the extreme values of decision vectors. For cost, we can identify the maximum and minimum costs by considering the solutions under extreme states. Similarly, for wave overtopping, we can determine the maximum and minimum values of wave overtopping discharge. It is evident that all solutions will fall within these ranges of cost and wave overtopping discharge values. Therefore, to compare different solutions, we have performed the dimensionless normalization of construction costs and wave overtopping discharge, as shown in Equations (1) and (2), respectively. and represent the wave overtopping discharge ration of the proposed solution in all solutions and the cost ration of the proposed solution in all solutions, respectively. Clearly, the value of the ratio falls between 0 and 1, reflecting the effectiveness of the proposed solution relative to all other solutions. A smaller value indicates a better solution.
In order to minimize values of and simultaneously, we utilize the weighted sum method, combining multiple objective functions, and , into a single objective function by linearly combining them and adjusting the weights to balance the importance of different objectives. This can be represented mathematically, as shown in Equations (3) and (4). Thus, solving the multi-objective optimization problem is transformed into minimizing the new objective function, . When it comes to allocating weight values, we can consider them from an economic cost perspective. If increasing the wave overtopping discharge per unit width leads to disaster losses of , while decreasing the cost per unit width is , then we have . This implies that . Otherwise, , and then .
In our present study, we have chosen and for illustrative purposes. It is important to emphasize that different weighting coefficients imply different optimization objectives, with varying emphasis on cost and wave overtopping discharge. The specific selection in practical applications can be set based on the actual requirements. This does not affect the performance of our optimization methodology as it is a general approach.
3.2. Search Space for the Optimization
The search space in an optimization problem refers to the set of decision vectors that the algorithm explores to find a solution, defined by the upper and lower bounds of the decision vectors. In the given optimization problem, there are four decision vectors,
, and d. According to the Code for Design of sea dike project [
8],
typically range from 1.5 to 3.5. For the berm width, B, and height, d, there are specific considerations to ensure its effectiveness. According to EurOtop, 2018 [
41], the berm width, B, may not be greater than 0.25 L
m−1,0 (the deep water wave length) to ensure effectiveness. Additionally, a berm lying below 2
or above Ru
2% has no influence on wave run-up and wave overtopping. Therefore, B varies from 0 to 30 m and d varies from 0 to 6.95 m. The upper and lower bounds of the decision vectors are shown in
Table 2.
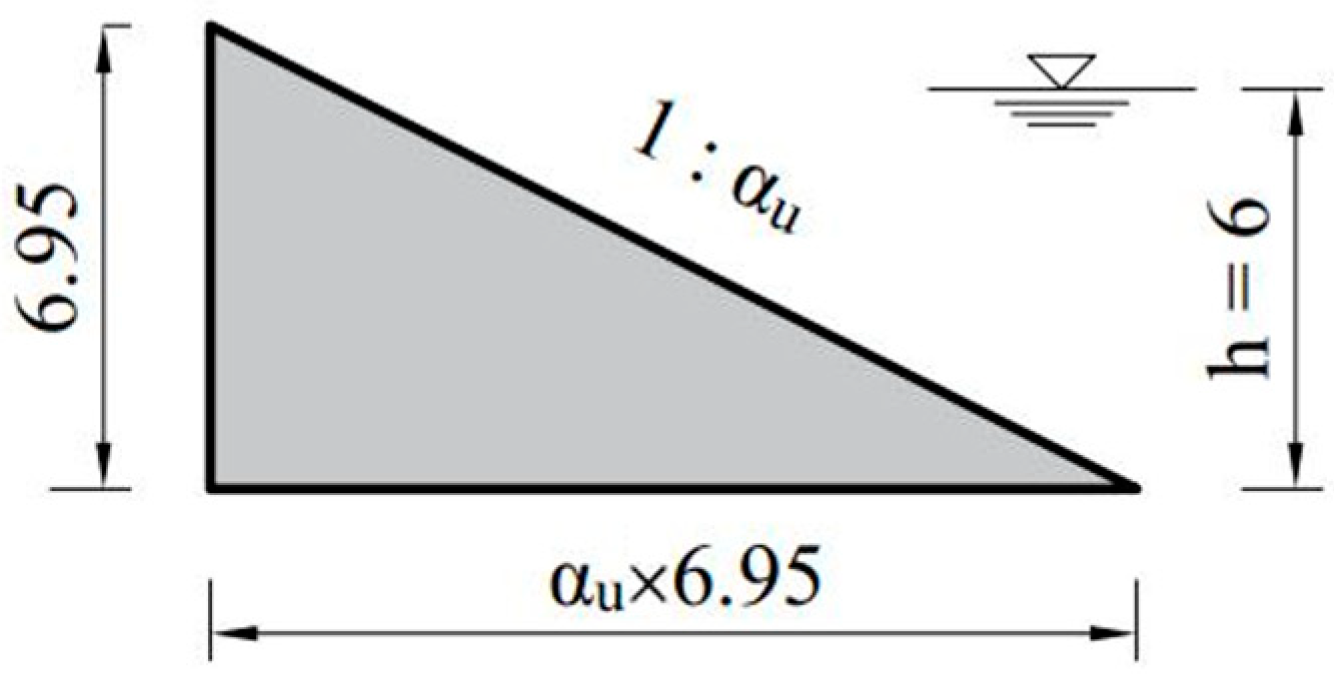
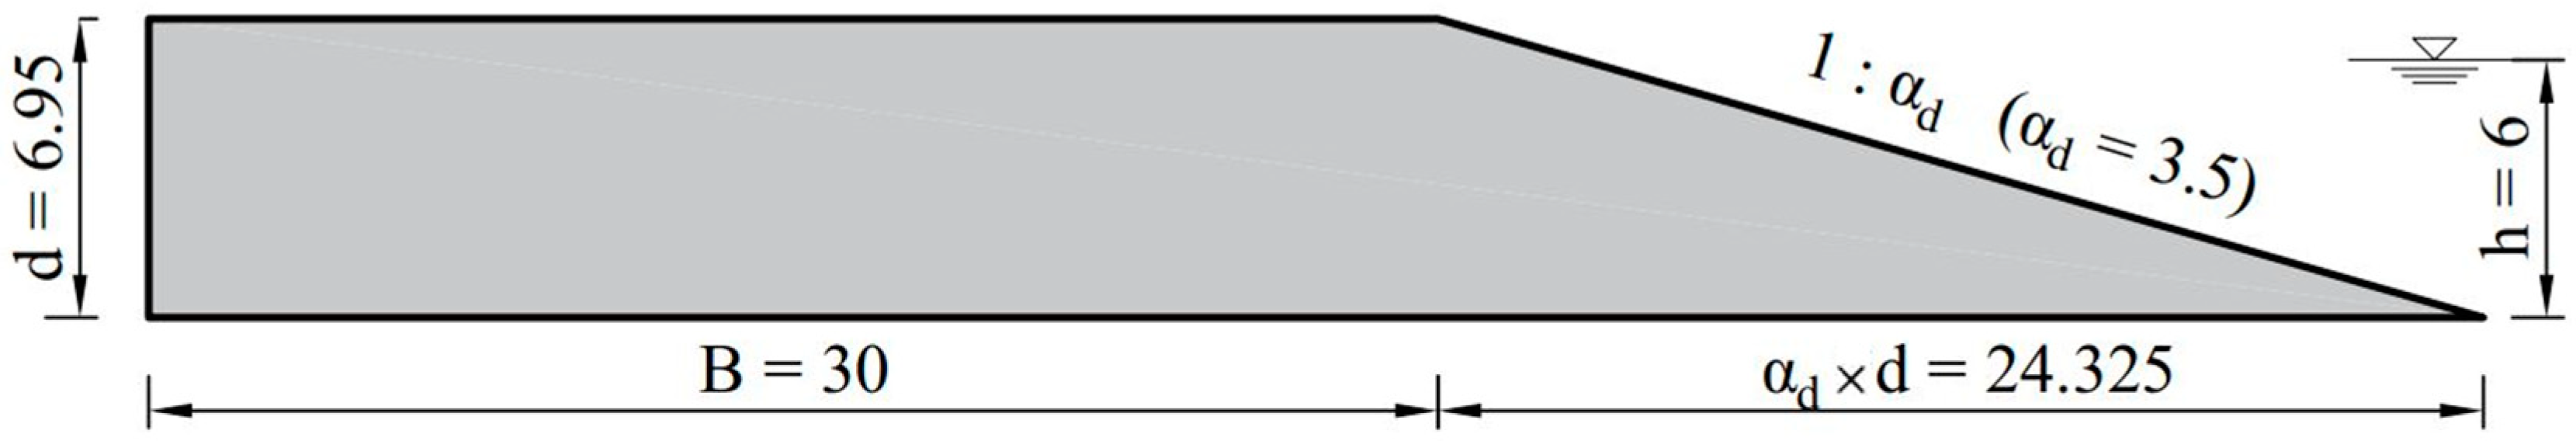
Here, when
, it means there is no berm with the seawall; the configuration becomes a single-slope seawall with the upslope,
, see
Figure 3, while when
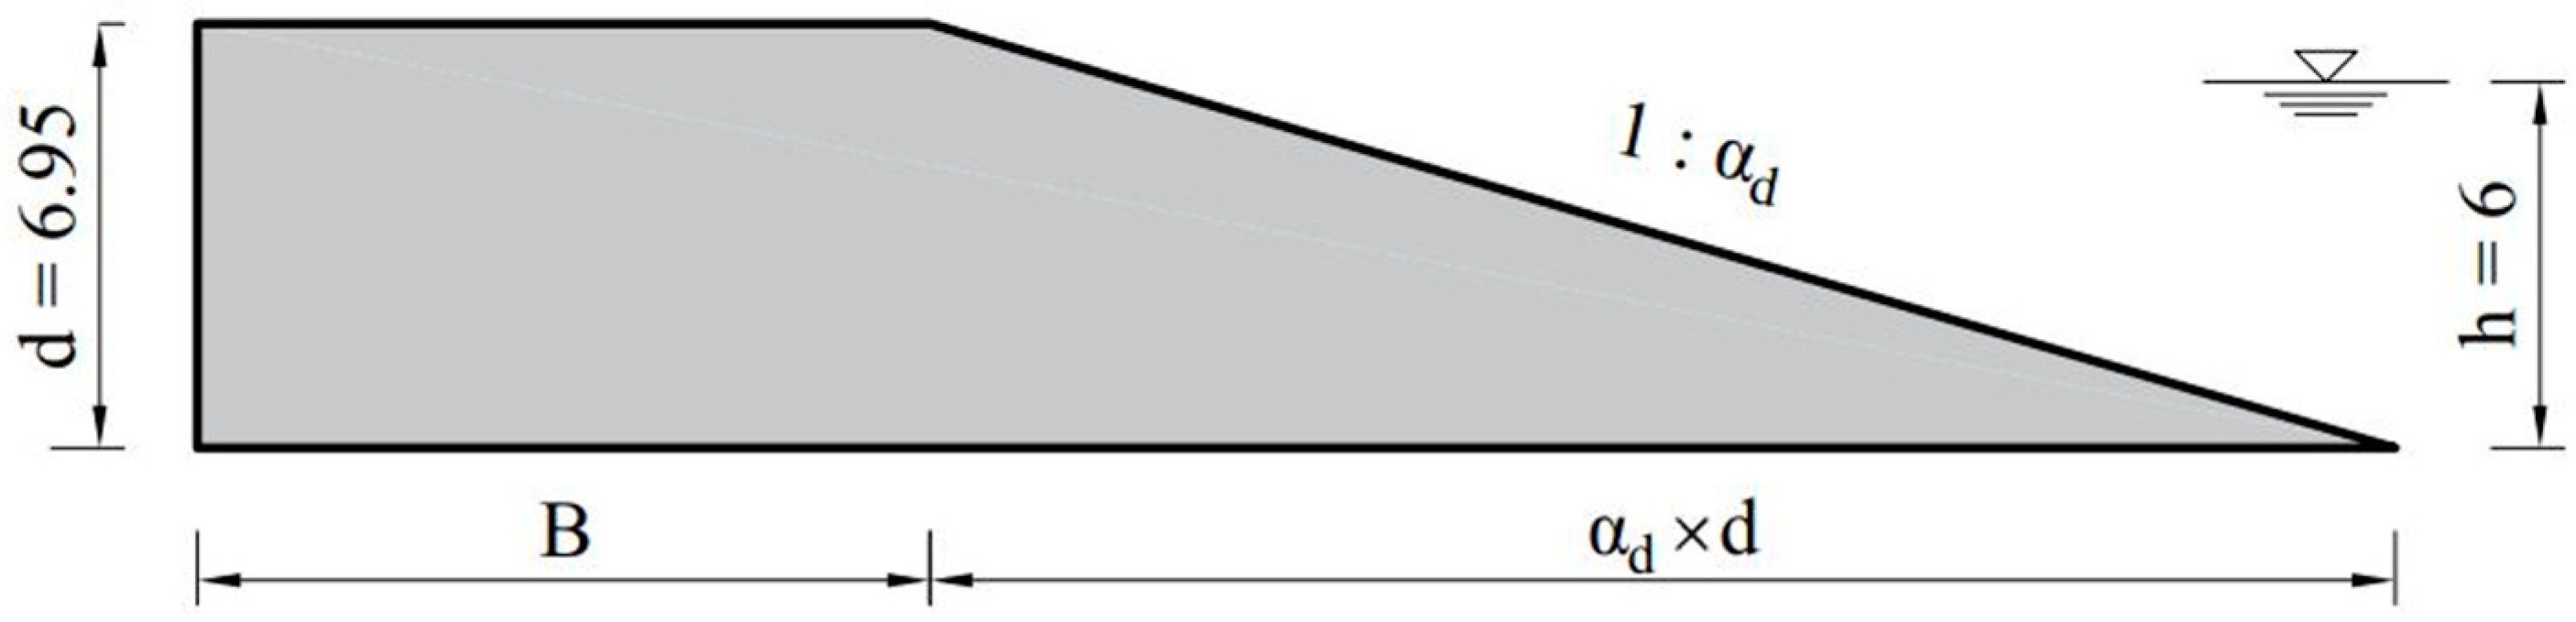
, the height of the berm is flush with the crest, thereby increasing the crest width,
. In this configuration, the seawall becomes a single-slope structure with a downslope,
, as depicted in
Figure 4. At this height, it is appropriate to refer to it as a promenade rather than a berm, as it provides a wider space for pedestrian access and recreational purposes.
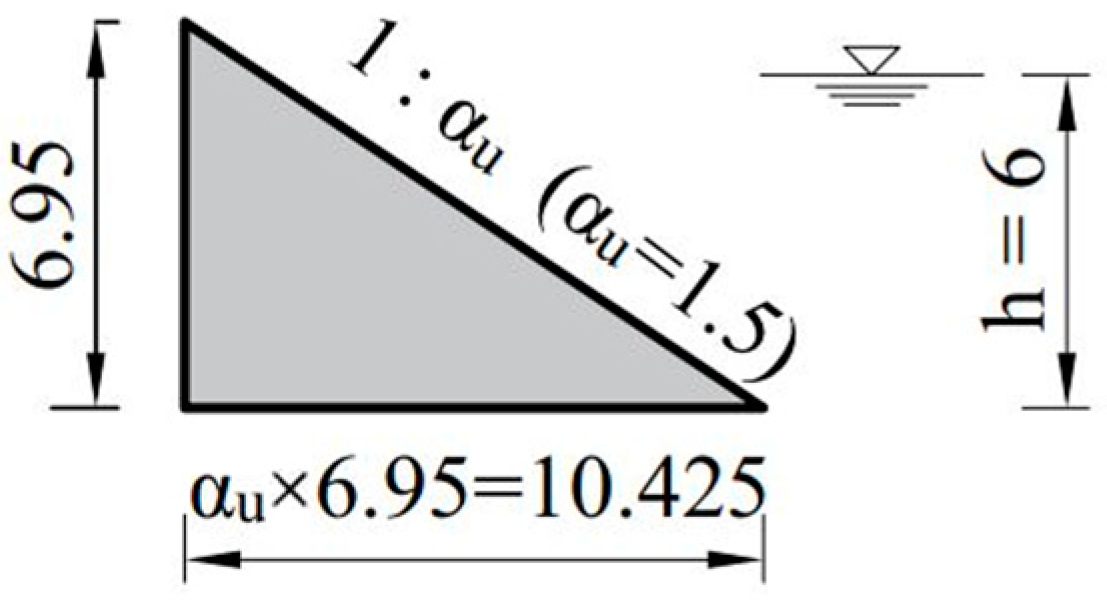
Obviously, when
the seawall reaches the smallest cost solution; see
Figure 5. Based on the geometrical dimensions, we can calculate
(as mentioned earlier, for the sake of simplicity, we assume that the unit prices of each part are consistent, so the cost is only determined based on the size of the engineering quantity). Simultaneously, the overtopping discharge reaches its maximum at
(obtained by the ANN overtopping model). Meanwhile, when
the seawall reaches its highest-cost solution; see
Figure 6. After calculation,
The specified values are shown in
Table 3.
In conclusion, the optimization objective function at this stage is as follows:
3.3. Results and Discussion
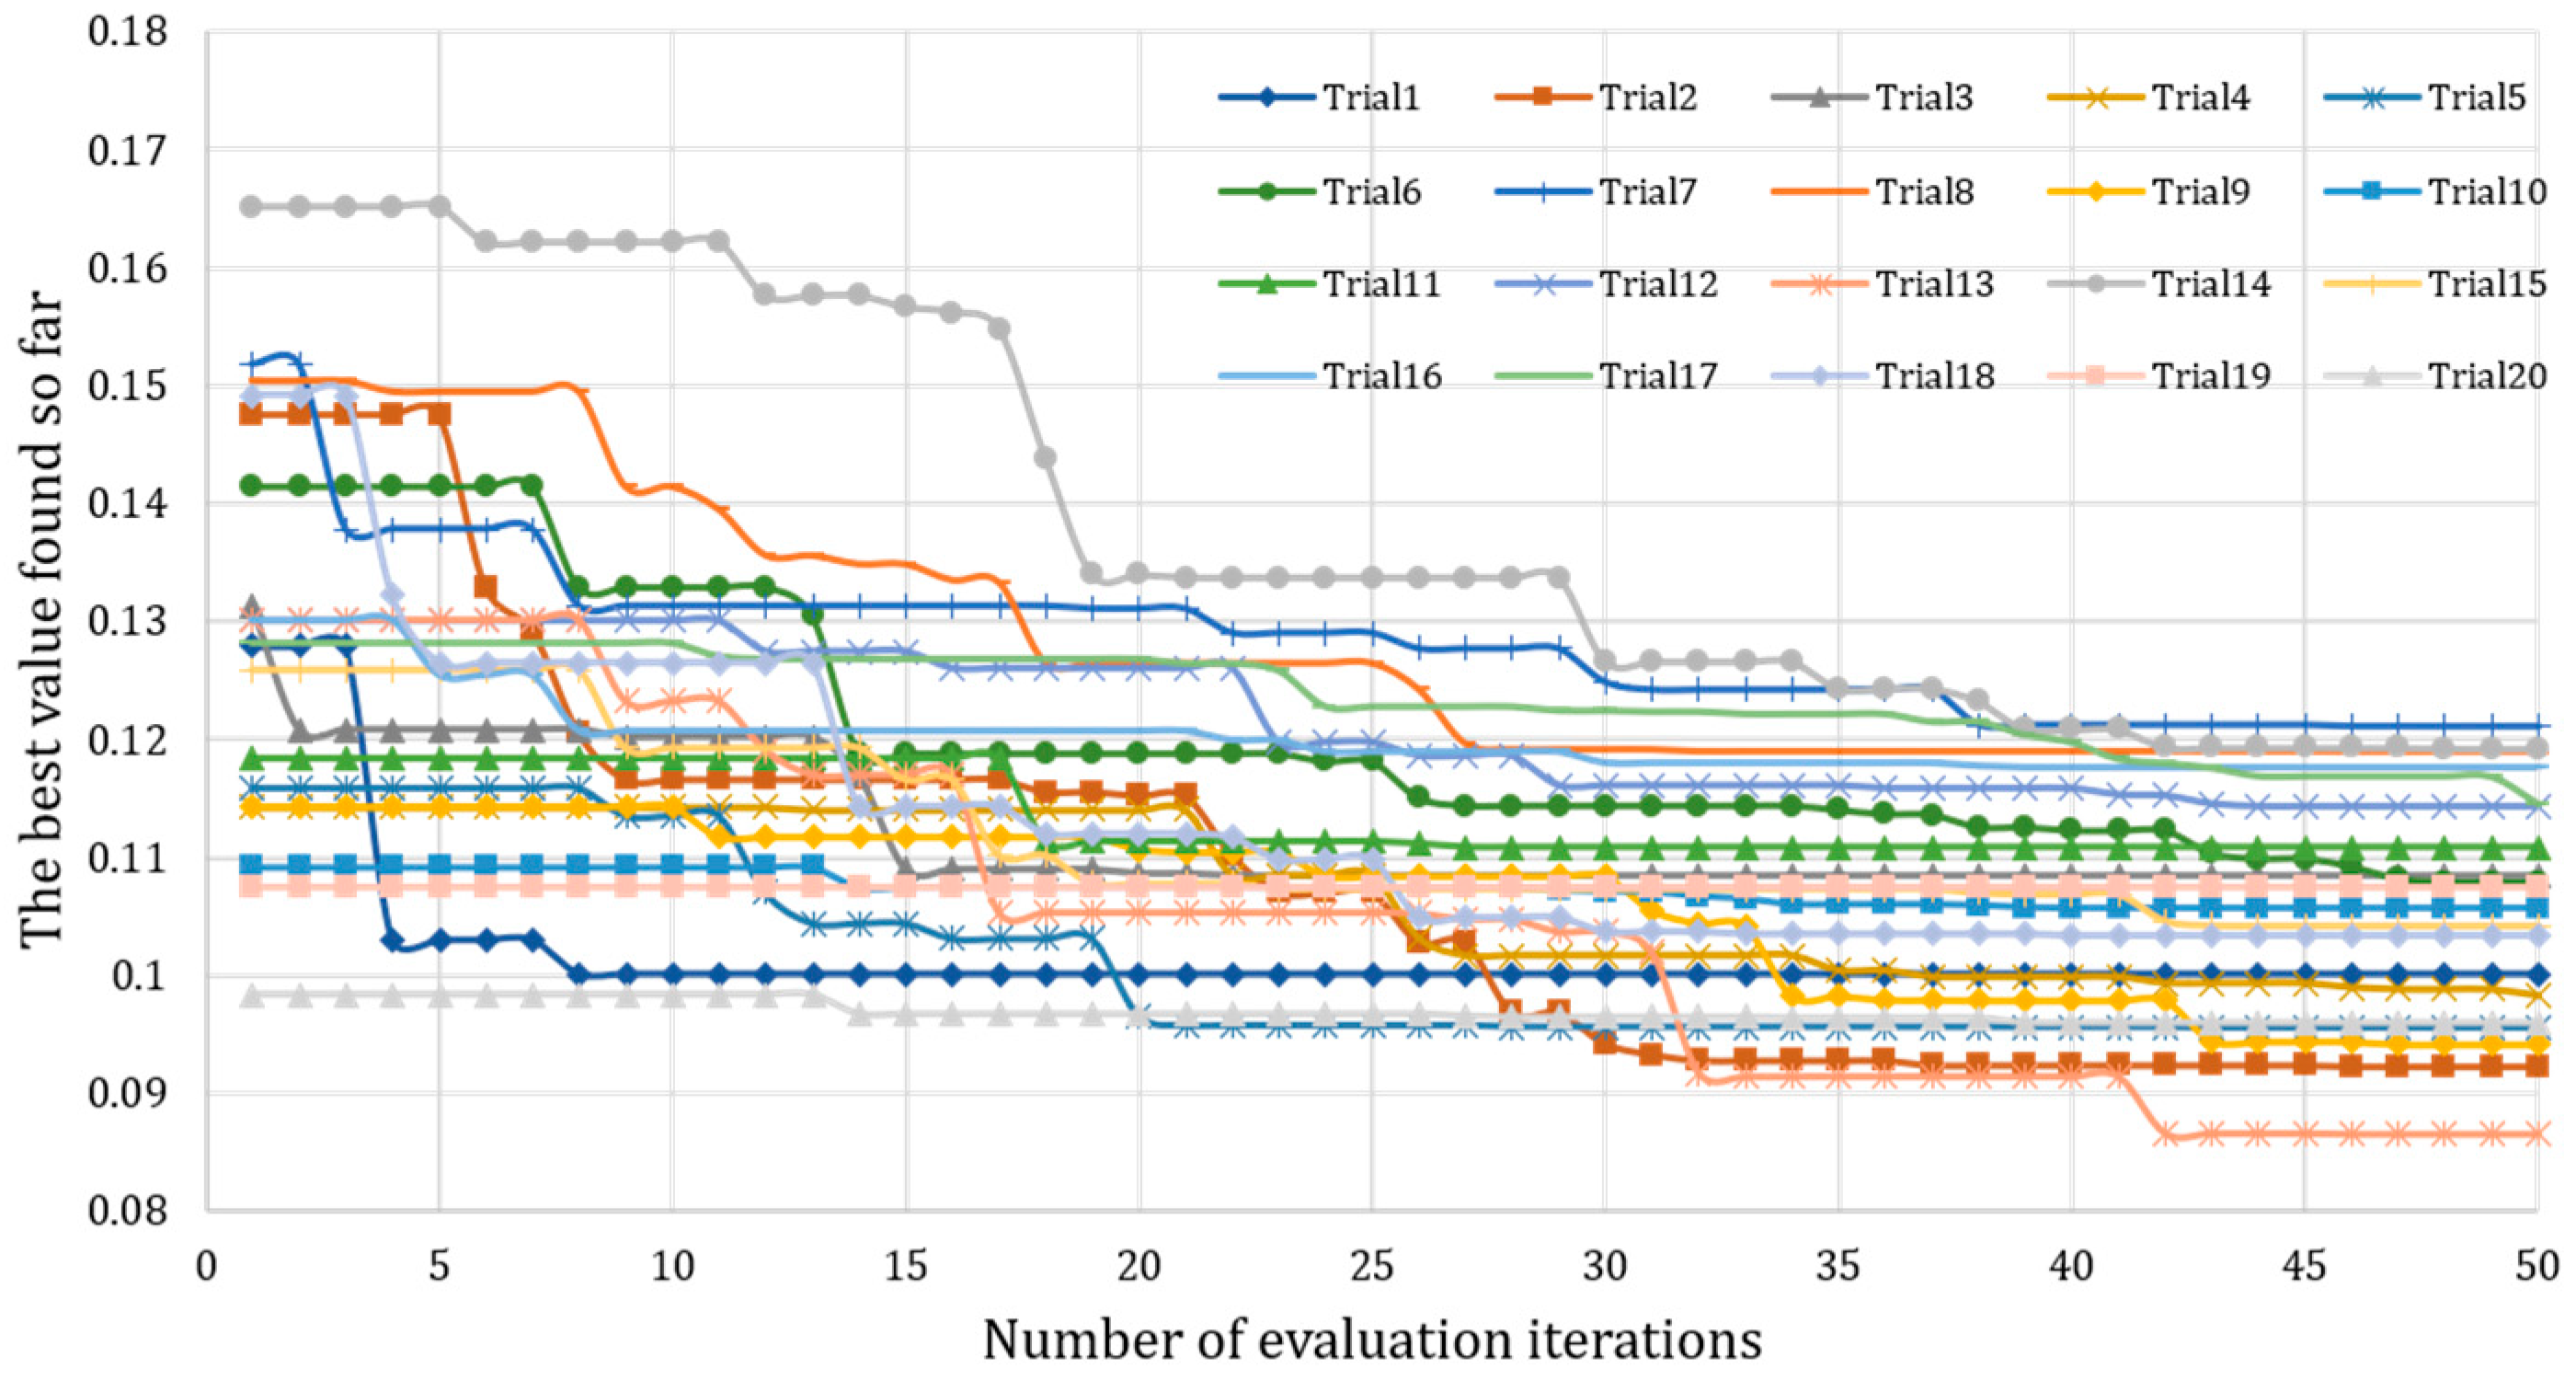
In the multi-objective optimization problem, the DYCORS algorithm is employed to find the optimal solution within the defined search space. To demonstrate the performance of our methodology in optimizing a seawall cross-section that minimizes conflicting objectives of overtopping discharge and cost, a total of 20 trials were conducted.
Figure 7 illustrates the optimization process of these 20 trials (overall performance will be presented in
Section 3.4 below). The
x-axis represents function evaluation iterations, while the
y-axis represents the best value of the objective function found so far (as Equation (6) shows). These curves provide insights into the algorithm’s convergence behavior and its ability to progressively find improved solutions over time. Convergence means that the algorithm has found a set of decision vectors that result in stable values for the optimization objectives within a given range of decision vectors. It can be observed that the results have achieved good convergence after 50 iterations for all 20 trials. Further iterations are unlikely to significantly improve the optimization objectives. This indicates that our optimization algorithm produces the optimal solution after 50 iterations.
In this section, we will focus on the worst-performing Trial 7 among these 20 trials. The optimization result obtained from Trial 7 were relatively worse compared to the other trials, with the highest value of the final objective function found among the 20 trials. By analyzing the performance of Trial 7, we can evaluate the robustness and effectiveness of the optimization algorithm in finding optimal solutions. Therefore, by analyzing the worst result, we can gain insights into the range of performance achieved by our methodology.
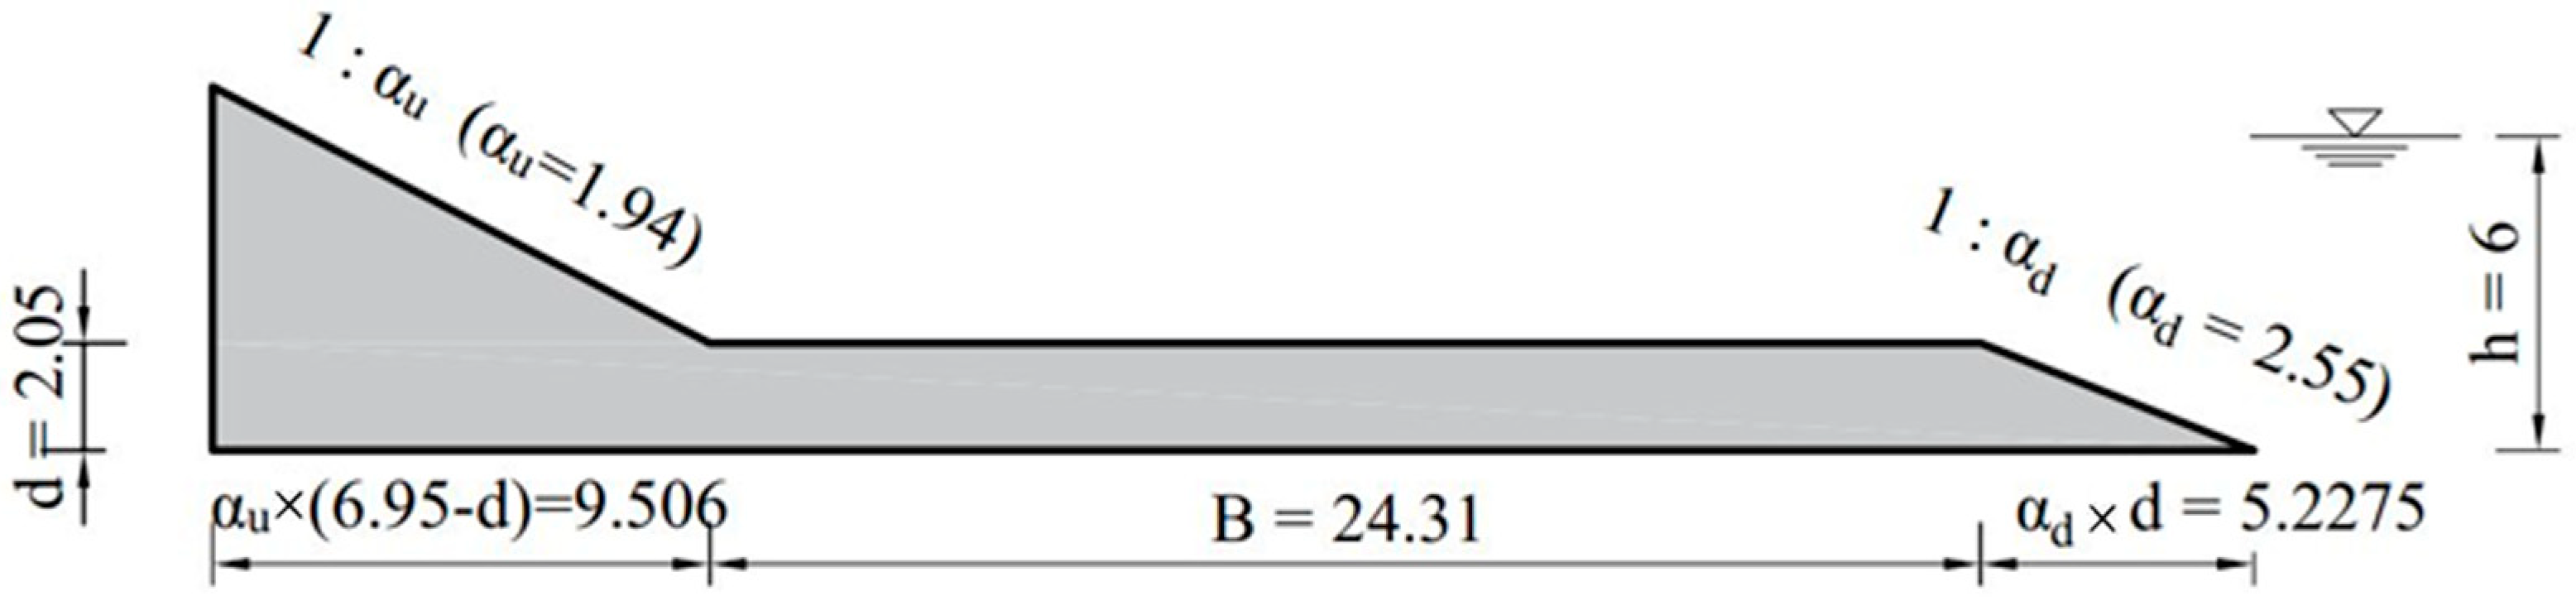
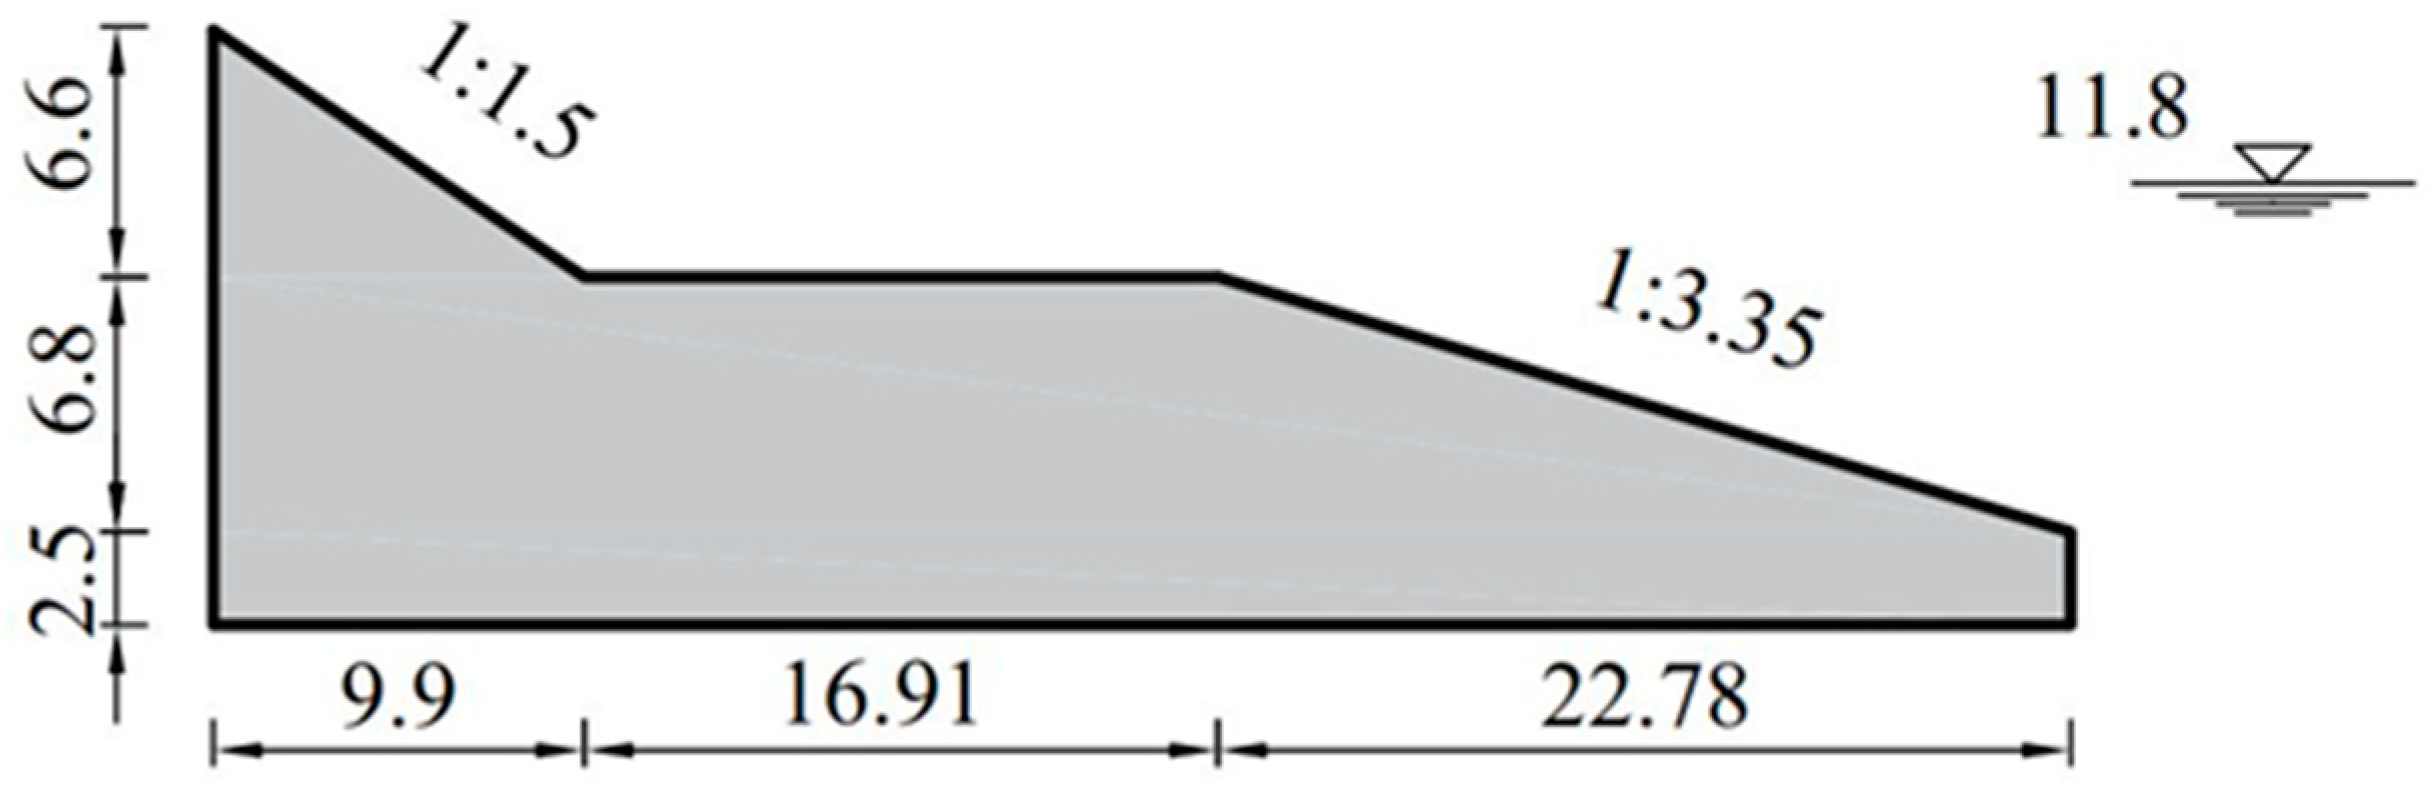
The decision vector values corresponding to the optimal solution of Trial 7 are presented in
Table 4: the width of the berm is 24.31 m and its height is 2.05 m, while 2.55 and 1.94 are the slope cotangent of the downslope and upslope, respectively. These values represent the final optimal solution of the seawall found in Trial 7, as depicted in
Figure 8.
Table 5 presents the wave overtopping discharge, cost, and objective function values for both the optimal solution of Trial 7 and the original solution of the seawall (
Figure 2). From
Table 5, it is evident that the wave overtopping discharge for the optimal solution of Trial 7 is 0.0205 m
3/s/m, while the original solution has a wave overtopping discharge of 0.0249 m
3/s/m, resulting in a reduction of 17.67%. According to design standard Code for Design of sea dike project [
8], to ensure the structural integrity of a seawall protected on three sides, a tolerable value of wave overtopping discharge is 0.05 m
3/s/m. It is evident that the optimal cross-section solution of Trial 7 meets this standard. In terms of construction cost, the optimal solution of Trial 7 has a cost of 97.97, which is 12.1% lower compared to the original solution of 111.45. Regarding the objective function value, there is a 17.69% decrease from the original solution’s value of 0.147 to the optimal solution of Trial 7, which is 0.121. Clearly, the wave overtopping discharge and cost of the optimal solution in Trial 7 are both smaller than those of the original solution. It is worth noting that, despite being the worst result among the 20 trials, Trial 7 still demonstrates satisfactory performance in achieving our defined optimization objectives. This indicates that our methodology for finding the optimal seawall cross-section that simultaneously minimizes wave overtopping discharge and cost is effective and robust.
3.4. Comparison with GA
In this section, we will compare our method, which employs the DYCORS algorithm, with the GA (Genetic Algorithm) as the GA is a popular approach for solving global optimization problems on coastal structures [
22,
23,
24,
25,
26]. In the present study, the GA solver of MATLAB(2019b) software is used and the probability of crossover and mutation operators are chosen as 0.50 and 0.4, respectively. In terms of decision vectors, design parameters, constraints, and multi-objective functions, they are the same as those of DYCORS.
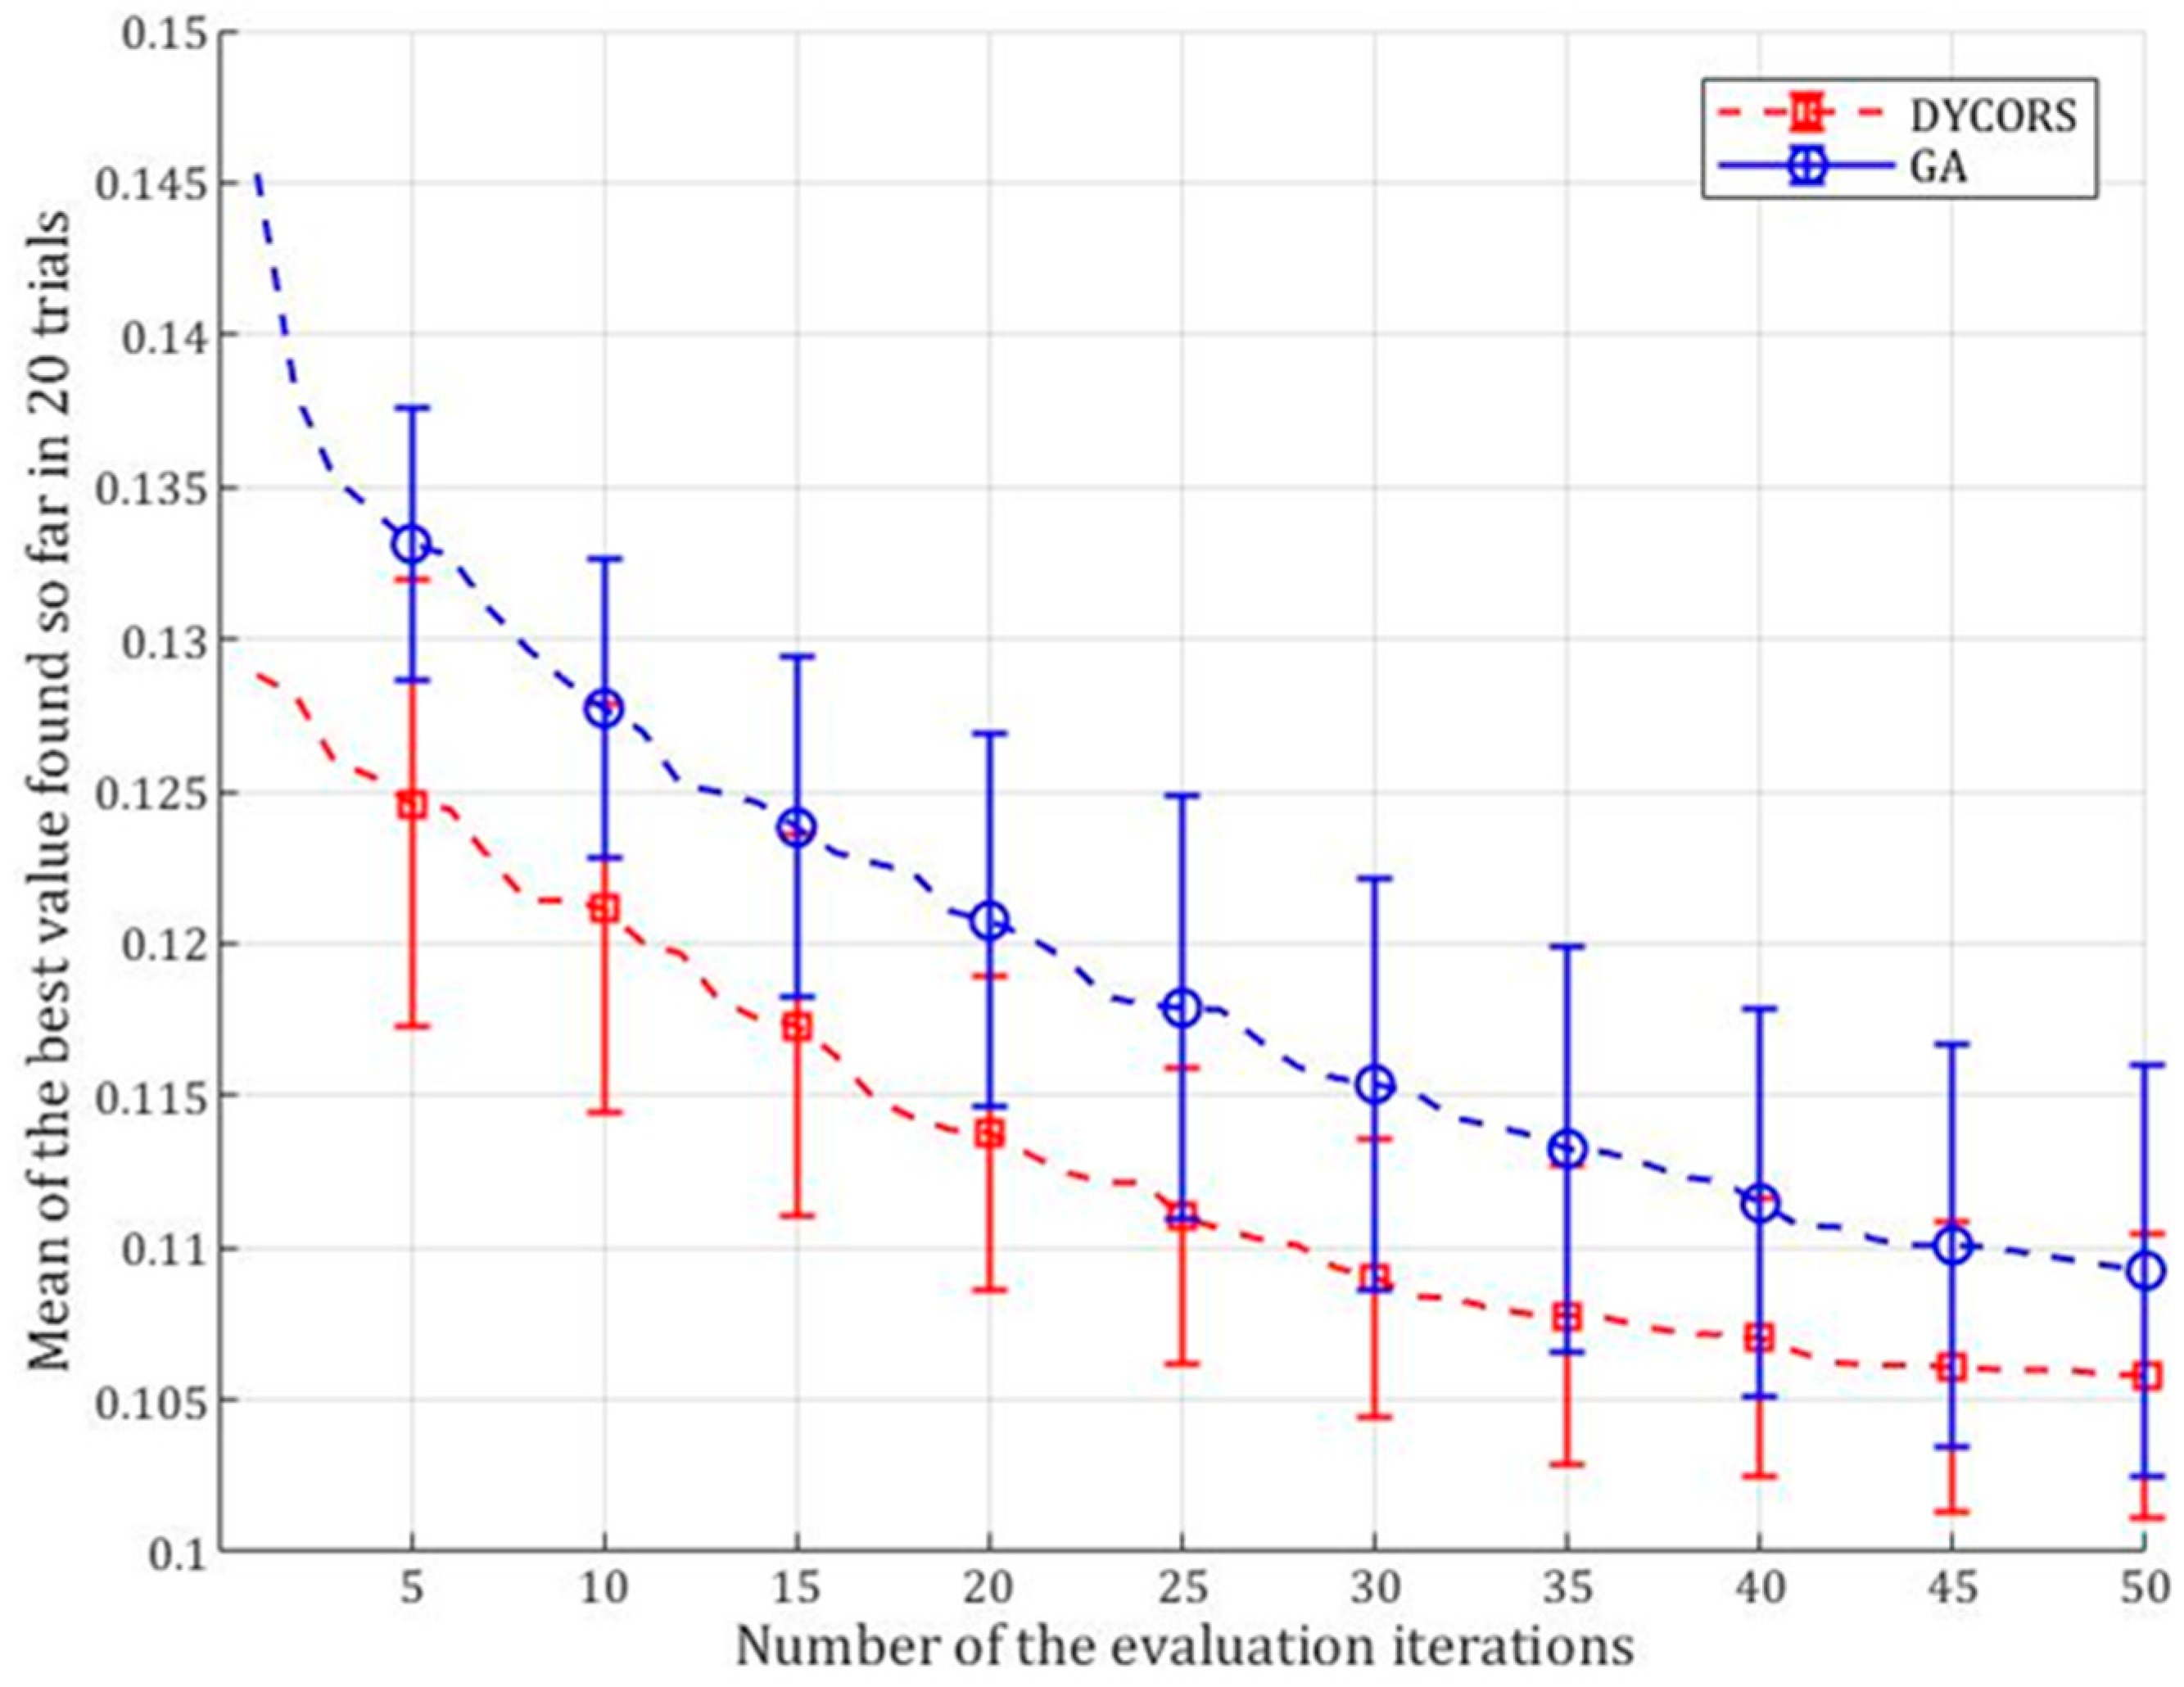
We can evaluate the performance of an algorithm for a specific problem by tracking the best objective function values obtained after each evaluation iteration. As there are multiple trials, we can calculate the average best function value for the algorithm after each evaluation iteration and present the findings in a plot known as an average progress curve. The average progress curve provides a comprehensive assessment of the algorithm’s performance and the evolution of solution quality over time for the optimize problem. It gives a clear understanding of how the quality of solutions is improved or changes throughout the evaluation process. Analyzing the average progress curve allows us to comprehend the algorithm’s behavior and make informed decisions regarding further enhancements or comparisons with other algorithms.
Convergence is an important indicator in optimization problems, signaling the approach or attainment of the optimal solution. As demonstrated in
Section 3.4, favorable convergence is achieved after 50 iterations. Consequently, we determine the relative performance of the two algorithms after 50 evaluation iterations by looking at the values indicated by their respective average progress curves in 20 trials.
Figure 9 shows the average progress curves of these two optimization algorithms applied to the optimization problem of the seawall cross-section with error bars representing 95% t-confidence intervals for the mean. These error bars provide insights into the stability and reliability of the results, allowing us to assess the consistency of each algorithm’s performance across multiple trials. The length of the error bars indicates the potential range of variation in the mean at a given confidence level. The larger the error bar, the greater the variability in the results. From
Figure 9, it can be observed that the data reliability of the DYCORS algorithm is higher. Furthermore, the average progress curve for the DYCORS algorithm consistently falls below that of the GA for this optimization problem, signifying that DYCORS consistently achieves a lower average best function value compared to the GA. Therefore, it can be concluded that DYCORS outperforms the GA throughout the entire dynamic optimization process, consistently producing better results over each evaluation iteration.
In addition,
Table 6 provides the statistical data for the optimization problem after 50 evaluation iterations, including the best value (minimum), the worst value (maximum), the median value, the mean value, and the standard error of the mean of the best function values over the 20 trials for both algorithms. Upon analyzing the statistical data from
Table 6, it can be observed that, for the statistical measures of the 20 trials, both the best value and the worst value for DYCORS are smaller than those for the GA. The mean value, commonly used to measure the central tendency and representativeness of statistical data, provides an estimate of the overall level of the entire dataset. Additionally, it is smaller for DYCORS in comparison to the GA. Furthermore, the standard error is a crucial statistical measure assessing the precision and reliability of the trials’ results. A smaller standard error suggests higher reliability and precision. Comparing the standard error of the mean value, it can be concluded that the data results of DYCORS are more reliable and accurate. The median, which is the value located in the middle position of a sorted dataset, is slightly larger for DYCORS compared to GA. However, overall, DYCORS performs better than GA because we are more concerned with the mean values and standard errors of the mean.
Taking these findings above into account, it can be concluded that, overall, the DYCORS algorithm consistently outperformed the GA for seawall cross-section optimization.


